

Abstract
We applied serial analysis of gene expression (SAGE) to study differentially expressed genes in mouse brain 14 hr after the induction of focal cerebral ischemia. Analysis of >60,000 transcripts revealed 83 upregulated and 94 downregulated transcripts (more than or equal to eightfold). Reproducibility was demonstrated by performing SAGE in duplicate on the same starting material. Metallothionein-II (MT-II) was the most significantly upregulated transcript in the ischemic hemisphere. MT-I and MT-II are assumed to be induced by metals, glucocorticoids, and inflammatory signals in a coordinated manner, yet their function remains elusive. Upregulation of both MT-I and MT-II was confirmed by Northern blotting. MT-I and MT-II mRNA expression increased as early as 2 hr after 2 hr of transient ischemia, with a maximum after 16 hr. Western blotting and immunohistochemistry revealed MT-I/-II upregulation in the ischemic hemisphere, whereas double labeling demonstrated the colocalization of MT with markers for astrocytes as well as for monocytes/macrophages. MT-I- and MT-II-deficient mice developed approximately threefold larger infarcts than wild-type mice and a significantly worse neurological outcome.
For the first time we make available a comprehensive data set on brain ischemic gene expression and underscore the important protective role of metallothioneins in ischemic damage of the brain. Our results demonstrate the usefulness of SAGE to screen functionally relevant genes and the power of knock-out models in linking function to expression data generated by high throughput techniques.
Keywords: differential gene expression, knock-out mice, screening approach, serial analysis of gene expression (SAGE), stroke, focal cerebral ischemia
Brain tissue damage as a result of focal cerebral ischemia (stroke) long has been viewed as an acute passive event in which energy failure directly leads to necrotic cell death. Only recently, experimental evidence has been accumulating that delayed events involving gene expression, such as inflammation or apoptosis, are important contributors to ischemic cell death in the brain (Dirnagl et al., 1999). Candidate approaches have identified a number of genes relevant for cerebral ischemia, yet screening approaches are required to gather a comprehensive understanding of postischemic gene expression.
Using serial analysis of gene expression (SAGE), we present here for the first time such an analysis of differential gene expression after transient focal cerebral ischemia. SAGE (Velculescu et al., 1995, 2000) yields information about absolute transcript numbers of many, if not all, genes expressed in a given tissue and therefore allows for the identification of differentially expressed genes when applied to tissues in different conditions. SAGE is based on the reduction of each expressed transcript sequence to short (14–15 bp), yet representative, sequences (tags) at a defined position, which are concatenated into long molecules. The sequencing of these molecules reveals the identity of multiple transcripts simultaneously. The number of times a particular tag is detected in a SAGE library therefore provides a quantitative and digital measure of gene expression (Velculescu et al., 1995, 1997, 2000; Zhang et al., 1997; Blackshaw et al., 2001).
SAGE identified metallothionein-II (MT-II) as the most significantly upregulated transcript 14 hr after the induction of focal cerebral ischemia in the mouse. This prompted us to investigate further the expression and functional role of MT-II and the related gene MT-I. Evidence is presented here that MT-II is a highly relevant neuroprotective gene in focal cerebral ischemia.
MATERIALS AND METHODS
Serial analysis of gene expression. Total RNA derived from four ipsilateral brain hemispheres from adult male C57BL/6 mice (BGVV, Berlin, Germany) (mean body weight, 18 ± 1 gm) after 14 hr of reperfusion that followed 2 hr of middle cerebral artery occlusion (MCAO) was pooled. For control, total RNA was pooled from four whole brains of the same mouse strain with a mean body weight of 20 ± 2 gm. For each SAGE procedure 5 μg of mRNA was used, as recommended in the Detailed Protocol (Detailed Protocol, version 1.0c; kindly provided by K. W. Kinzler and colleagues, Johns Hopkins Oncology Center, Johns Hopkins University School of Medicine, Baltimore, MD). This protocol was altered in such a way that PCR was performed for 26 cycles with 600 50 μl reactions in parallel to minimize the percentage of redundant ditags (PCR bias). Ligation to form polytags was performed with 1 U of T4 DNA ligase (Invitrogen, Eggenstein, Germany) for 15 min at 16°C. Cloned concatamers were sequenced with dye primer chemistry and the Primer Cycle Sequencing kit (Amersham Biosciences, Braunschweig, Germany) in combination with an automated ALFexpress DNA sequencer (Pharmacia Biotech, Freiburg, Germany) or dye terminator chemistry with Ampli-Tag FS enzyme (PerkinElmer Life Sciences, Vaterstetten, Germany) in combination with an automated ABI 373A DNA sequencer (ABI PerkinElmer, Weiterstadt, Germany).
The tags generated in this way were analyzed by using SAGE software version 3.01 (version 3.01; kindly provided by K. W. Kinzler and colleagues). Sequences were mapped by using tags derived from the mouse Unigene clusters (file, SAGEmap tag ug-rel-Nla3-Mm.txt derived fromMus musculus UniGene Build #96) according to Lal et al. (1999).
Statistical analysis of SAGE tag counts. The averagep value computed by the SAGE software, based on a Monte Carlo analysis (Zhang et al., 1997), serves as order parameter to produce ranked lists of differentially expressed genes (Table1). An abundance of transcripts was calculated, assuming 300,000 mRNAs per cell (Hastie and Bishop, 1976).
Table 1.
List of upregulated genes as revealed by SAGE
| Tag sequence | Control | Ischemia | pvalue | Accession number | Unigene cluster/gene |
|---|---|---|---|---|---|
| TAACTGACAA | 6 | 48 | <1 × 10⁻⁶* | 142740 | Metallothionein 2 |
| TCGCTGCTTT | 0 | 11 | 0.00045 | 202784 | Expressed sequence AL024263 |
| 22482 | RIKEN cDNA 1200015M12 gene | ||||
| GCAGGCACTC | 2 | 15 | 0.00102 | 1703 | Tubulin, beta 5 |
| GCGACGGGCG | 2 | 13 | 0.00333 | No match | |
| GGGCCTGTGG | 0 | 8 | 0.00372* | 22650 | Serine protease inhibitor 2-2 |
| GTATTCCCCT | 0 | 8 | 0.00372 | 7723 | Poly(A) binding protein, nuclear 1 |
| GCTAACCACC | 1 | 10 | 0.00508 | 35389 | Cytochromec, somatic |
| ACCAAAAAAA | 1 | 10 | 0.00508 | 28813 | EST AI462012 |
| GTGACCACGG | 3 | 14 | 0.00549 | Tag matches ribosomal RNA sequence | |
| TGTGAAGTAG | 0 | 7 | 0.00719 | 28687 | Moesin |
| 6836 | ADP-ribosylation factor 1 | ||||
| GAGTGGATTC | 0 | 7 | 0.00719* | 4426 | Cd63 antigen |
| TTAGTTACCT | 0 | 7 | 0.00719 | 13020 | Ribosomal protein L13a |
| 757 | Aplysiaras-related homolog A2 | ||||
| AGGCATTGTC | 2 | 11 | 0.01024 | 2050 | RIKEN cDNA 2510008H07 gene |
| AATATCACCT | 1 | 9 | 0.01043 | 181969 | Tissue inhibitor of metalloproteinase 2 |
| TCATTGGTCG | 1 | 9 | 0.01043 | Tag matches mitochondrial sequence | |
| GAAATAATAA | 0 | 6 | 0.01360 | 172908 | ESTs |
| 18300 | Solute carrier family 3, member 1 | ||||
| TCTACACTGC | 0 | 6 | 0.01360 | 6388 | Heat shock protein, 70 kDa 1 |
| 159373 | RIKEN cDNA 4930480K02 gene | ||||
| 87626 | RIKEN cDNA 1200016K18 gene | ||||
| TGCTGTGCAT | 0 | 6 | 0.01360* | 18459 | Fibroblast growth factor inducible 14 |
| TGGCAGTCTG | 0 | 6 | 0.01360 | No match | |
| TAGGAACCCT | 0 | 6 | 0.01360 | Tag matches mitochondrial sequence | |
| GAATGTAAAT | 1 | 8 | 0.01649 | 104921 | RIKEN cDNA 6530420C11 gene |
| 32318 | Expressed sequence AW260467 | ||||
| TTAATAAAAG | 1 | 8 | 0.01649 | 391 | RIKEN cDNA 9130413I22 gene |
| 33183 | RIKEN cDNA 4931420H10 gene | ||||
| ATGCATCCTT | 2 | 10 | 0.01879 | 20921 | Ig superfamily, member 4 |
| GGCCCAAGGC | 3 | 11 | 0.02678 | 28955 | RIKEN cDNA 4930570C03 gene |
| TGATCATTGT | 3 | 11 | 0.02678 | 34828 | Heat shock protein, 105 kDa |
| 203112 | Expressed sequence AI790491 | ||||
| CAGTTATAAA | 0 | 5 | 0.03026 | 4266 | Integral membrane protein 2 B |
| GGTTAAATGT | 0 | 5 | 0.03026 | 930 | Cathepsin L |
| ACCGATGGCT | 0 | 5 | 0.03026 | 22482 | RIKEN cDNA 1200015M12 gene |
| ACATCATAGA | 0 | 5 | 0.03026 | 70127 | Ribosomal protein L12 |
| CTCTATTTAA | 0 | 5 | 0.03026 | 29541 | RIKEN cDNA 1110004G16 gene |
| AGAGCTTGTT | 0 | 5 | 0.03026 | 4628 | Sphingomyelin phosphodiesterase 1, acid lysosomal |
| AATTTCCCCT | 0 | 5 | 0.03026 | 30245 | RIKEN cDNA 2310047I15 gene |
| CCCCCAAAAA | 0 | 5 | 0.03026 | 9537 | Lipocalin 2 |
| AATGGCTAGC | 0 | 5 | 0.03026 | 35389 | Cytochromec, somatic |
| CCCTCCTCCA | 0 | 5 | 0.03026 | 18161 | 3′-Phosphoadenosine 5′-phosphosulfate synthase |
| 35141 | ESTs, weakly similar to GNT5 rat α-1,3(6)-Ma | ||||
| CTGGGTTCGG | 0 | 5 | 0.03026 | 154298 | RIKEN cDNA 180012I05 gene |
| 204382 | Expressed sequence AI85493 | ||||
| 22768 | Claudin | ||||
| CAGGATTCCT | 0 | 5 | 0.03026 | 203939 | Expressed sequence AI256814 |
| GTATAAAGTT | 0 | 5 | 0.03026 | 34916 | ESTs, weakly similar to I83196 NEDD-4 ORF |
| AAGCCACAGA | 0 | 5 | 0.03026 | 28853 | Expressed sequence C79540 |
| GGGGATCTGT | 1 | 7 | 0.03167* | 3915 | Myelin-associated oligodendrocytic basic protein |
| 4936 | Mitogen-activated protein kinase 10 | ||||
| ATAATTACAT | 1 | 7 | 0.03167 | No match | |
| ATACTGAACA | 1 | 7 | 0.03167 | 45815 | Breast cancer anti-estrogen resistance 3 |
| 139219 | ESTs | ||||
| AAAATTATTG | 1 | 7 | 0.03167 | No match | |
| TGCCATAGAA | 1 | 7 | 0.03167 | 1239 | Glial fibrillary acidic protein |
| AATAAAAGTT | 2 | 9 | 0.03216 | 4069 | ATP synthase, mitochondrial F1 complex, alpha subunit |
| 5885 | RIKEN cDNA 1500001N15 gene | ||||
| GGAGCCATTG | 2 | 9 | 0.03216 | 27677 | RIKEN cDNA 2900002J19 gene |
| AAACGAAAGT | 2 | 9 | 0.03216 | 29815 | Methionine adenosyltransferase II |
Genes upregulated 14 hr after focal cerebral ischemia by a factor of 3 or greater compared with control brain and pvalues < 0.05 as detected by SAGE, ranked by their averagep values (row four), calculated by Monte Carlo analysis according to Zhang et al. (1997). First row contains transcript-specific sequences (tags). Absolute tag numbers detected after analysis of 31,626 tags (control mice) and 32,068 tags (ischemic tissue) are shown in columns two and three. For identification of corresponding transcripts, Unigene-based maps have been used according to Lal et al. (1999). Row four contains accession numbers; row five contains gene annotation according to Mus musculus UniGene Build #96. Several candidate transcripts were tested by Northern blotting (data not shown), which confirmed SAGE data (
).
mRNA species with an abundance of 100 copies per cell are represented in a library of 30,000 tags with a probability of 99% (assuming 300,000 mRNAs per cell). The chance to be represented drops to 35% for less abundant genes (10 copies per cell) and to 4% for rare mRNA species (1 copy per cell). It thus can be assumed that the tag counts typically remain under 10 in both ischemia and the control pool. Therefore, besides a Monte Carlo analysis, we also applied Fisher's exact test, a statistical test designed for the evaluation of rare events, to assess the tag counts observed in the SAGE libraries (Schmitt et al., 1999). The p values calculated by both methods corresponded to each other quite well (data not shown).
MT-I- and MT-II-specific probes. MT-I and MT-II probes were generated by RT-PCR. MT-I-specific primers included position 1240–1266 (ACGTGCTGTGCCTGATGTGACGAACAG) and position 1387–1355 (TAGACTCAAACAGGCTTTTATTATTAACG) according to accession number J00605 (Glanville et al., 1981). MT-II-specific primers included position 1143–1114 (ACGGCTTTTATTGTCAGTTACATGCTTTAT) and position 447–466 (CAACTGCTCCTGTGCCTCCG) according to accession numberK02236 (Searle et al., 1984). After amplification by PCR the probes were gel purified by QIAquick Gel Extraction Kit (Qiagen, Hilden, Germany) and labeled with [α32P]-dCTP (6000 Ci/mmol; Amersham Biosciences), using the Rediprime DNA Labeling System (Amersham Biosciences).
Northern blotting. Adult male C57BL/6 mice (BGVV) were anesthetized deeply at different time points after the induction of ischemia for 2 hr (see below) and then were decapitated; the brains were removed rapidly. Total RNA was prepared freshly, using Trizol reagent (Invitrogen) from whole ipsilateral hemispheres. Total RNA from four mice at each time point was pooled, separated on a 1% sodium phosphate-buffered agarose gel, and capillary-blotted onto a positively charged nylon membrane (Boehringer Mannheim, Mannheim, Germany) according to a standard protocol (Sambrook et al., 1989). The same blot successively was hybridized at 64°C to the MT-I and MT-II probes, using QuickHyb hybridization solution (Stratagene, La Jolla, CA) and stringently washed (30 min; 0.1% SDS/0.1× SSC at 68°C).
Western blotting. Cerebral hemispheres of mice were dissected and homogenized in lysis buffer with a glass homogenizer (type B pistil) to different time points after the ischemic insult. The lysis buffer contained 20 mm Tris-HCl, pH 7.4, 100 mm KCl, 1 mm EDTA, 1% Triton X-100 (both purchased from Sigma, Deisenhofen, Germany), and Complete protease inhibitor cocktail as recommended by the manufacturer (Roche, Mannheim, Germany). The lysate was incubated for 20 min on ice and then centrifuged at 27,000 × g at 4°C for 10 min; the resulting supernatant was taken for determination of protein concentration according to the BCA assay protocol (Pierce, Rockford, IL) or stored at –70 C° until needed for additional procedures. Western blotting was performed according to the protocol of Laemmli (1970). Protein was loaded, 40 μg per lane, on 17.5% SDS-polyacrylamide minigels, followed by electrophoresis and semidry blotting onto polyvinylidene difluoride (PVDF) membranes (Amersham Biosciences). Incubation with a monoclonal mouse antibody raised against metallothionein (Dako, Carpinteria, CA) was performed with a titer of 1:100 after the membrane was blocked with 5% bovine serum albumin in TBST (Tris-buffered saline with 0.05% Tween 20). For loading the control, we used mouse monoclonal anti-β-tubulin antibody after we blocked the membrane in 1% milk in TBST. A secondary anti-mouse horseradish peroxidase-linked antibody (sc-2005; Santa Cruz Biotechnology, Santa Cruz, CA), the enhanced chemiluminescence kit from Pierce, and x-ray films (Sigma) were used to visualize signals. A low-range molecular weight standard (Invitrogen) was used to determine protein sizes.
We provide semiquantitative analysis of band intensity by densitometry from scanned images of nonsaturated immunoblot films, using Scion Image, version Beta 4.0.2 software (Scion Corporation, Frederick, MD). To compare three different experiments (three animals per time point), we added and set as 100% the pixel intensity of the metallothionein bands that had been obtained in each experiment. The individual band was calculated as a percentage of total signals. Statistical analysis was performed with one-way ANOVA with multiple comparisons versus a control group (Bonferroni ttest).
Induction of focal cerebral ischemia. Mice were anesthetized with 2.5% halothane for induction and maintained with 1.0–1.5% halothane in 70% N2O and 30% O2 via a face mask. Sufficiency of occlusion and reperfusion of the middle cerebral artery were monitored by laser Doppler flowmetry (Peri Flux 4001 Master; Perimed, Stockholm, Sweden). Focal cerebral ischemia was induced with an 8/0 nylon monofilament coated with silicone hardener mixture (Xantopren M Mucosa and Activator NF Optosil Xantopren; Heraeus Kulzer, Wehrheim, Germany) via the internal carotid artery as described by Hara et al. (1996). Anesthesia did not exceed 10 min. After 45 min or 2 hr (SAGE and Northern and Western blotting) of ischemia the animals were re-anaesthetized for 1 min; reperfusion was induced by removing the monofilament.
For SAGE a 2 hr ischemic interval was used to maximize the contribution of the affected (ischemic) tissue and thus the sensitivity for detection of induced genes (derived from the ischemic tissue). The infarct volume study in knock-out mice was performed with a 45 min ischemic interval because we speculated that metallothionein is neuroprotective. A longer time interval (e.g., 2 hr), after which tissue damage is already almost maximal, may have masked the effect of targeted disruption of a protective gene.
Physiological monitoring. In all animals during surgery and ischemia the body temperature was measured and maintained between 37.0 and 37.5°C with a heating pad. In randomly selected animals (three per group) the left femoral artery was cannulated, and blood pressure was measured during the preparation. Mean systemic arterial blood pressure (SAP) was measured for a 3 min interval before MCAO and 1 min after MCAO. Blood samples of 50 μl were taken and analyzed just after the induction of ischemia for pH, oxygen (PaO2), and carbon dioxide (PaCO2) (Compact 2 Blood Gas Analyzer; AVL List GmbH, Graz, Austria). There were no significant differences between wild-type and MT-I/-II knock-out mice.
Outcome assessment. Adult 10-week-old male MT-I and MT-II knock-out mice (129S7/SvEvBrd-Mt1tm1BriMt2tm1Bri; The Jackson Laboratory, Bar Harbor, ME) (Masters et al., 1994) and controls (129S3/SvImJ) were used for functional analysis. MT-I/-II knock-out mice were bred on a SV129 background; therefore, SV129 mice were used as controls. TheMT1tm1BriMt2tm1Brimutant strain was developed in the laboratory of Drs. R. Palmiter and R. Brinster (Masters et al., 1994). Both the MT-I and MT-II genes were knocked out in a single targeting event. The 129-derived AB-1 ES cell line was used, so the same strain (SV129) was used as control, as suggested previously (The Jackson Laboratory). At 1, 24, and 48 hr after the induction of ischemia for 45 min, neurological deficits were graded on a scale of 0 (no deficit), 1 (failure to extend right forepaw), 2 (circling to the contralateral side), and 3 (loss of postural reflex), as described by Bederson et al. (1986) and modified by Hara et al. (1996). At 2 d after the induction of ischemia the mice were anesthetized deeply and decapitated; the brains were removed rapidly from the skull and immediately frozen in 2-methylbutane on dry ice. Brains were sectioned (20 μm) on a microtome, dried overnight, and stained with hematoxylin (Merck, Darmstadt, Germany). The sections were digitized, the area of infarction was quantified on a PC with Sigma Scan Pro software (Jandel Scientific, San Rafael, CA), and infarct volumes were calculated. A correction for edema was applied by calculating the “indirect” infarct volume as the volume of the contralateral hemisphere minus the noninfarcted volume of the ipsilateral hemisphere. The difference between “direct” and “indirect” infarct volumes represents brain swelling. Relative infarct size was calculated as a percentage of the size of the contralateral hemisphere. Different volumes were measured to control for a hypothetical (inverse) influence of brain swelling (edema) on the infarct sizes. It has been shown that direct measurement of infarct volume during the development of brain edema is associated with an overestimation of infarct volume and that this artifact can be reduced with the procedure described above (Lin et al., 1993).
Assessment of cerebrovascular anatomy. Differences in infarct volumes may be attributable to differences in the vascular anatomy between wild-type and knock-out animals (Maeda et al., 1998). Therefore, we visualized the superficial brain angioarchitecture by intravascular injection of carbon black via a technique modified afterMaeda et al. (1998). In three knock-out and three wild-type mice anesthesia was induced by 2% halothane and maintained with 1.5% halothane in 70% N2O and 30% O2; body temperature was maintained at 37.3°C with a heating pad. A syringe (filled with black latex; warmed to 38°C) was connected to a polyethylene tube (internal diameter, 0.58). With the tube the abdominal aorta was cannulated caudal of the renal artery. Papaverine hydrochloride (1 mg in 0.9% saline; Sigma-Aldrich, Steinheim, Germany) was injected into the vena cava. After a visible reaction to papaverine was evident, 1 ml of latex was injected over 20 sec. Then 30 min later the mouse was decapitated, and dorsal skull and dura were removed. The entire head was fixed with 4% paraformaldehyde over 7 d. Thereafter, the brain was photographed with a color CCD camera connected to an operating microscope (10-fold magnification). Images were analyzed with Sigma Scan Pro (Jandel Scientific). Anastomoses on the dorsal surface between the anterior cerebral artery and the middle cerebral artery (MCA) were counted. For the determination of the size of the MCA-supplied vascular territory, adjacent anastomosis points were connected by the line of anastomoses, and the distance from the midline to the line of anastomoses was measured 2, 4, and 6 mm from the frontal pole.
Immunohistochemistry. Wild-type (n = 10) and MT-I- and MT-II-deficient mice (n = 3) were perfused with 4% paraformaldehyde before and 24 or 48 hr after ischemia. The 20 μm coronal cryostat sections were obtained from the frozen brains by serial sectioning. Representative sections at interaural positions 6.6, 5.3, 3.9, 1.9, and 0 mm were chosen for immunohistochemistry (n = 7); adjacent sections were stained with hematoxylin and eosin (H&E). After IgG block the sections were incubated in PBS containing 10% normal goat serum for 30 min. Incubation with primary antibodies was performed at 4°C overnight. A mouse monoclonal antibody against metallothionein (E9; Dako) was used at a dilution of 1:300. For double-labeling studies the rabbit polyclonal antibodies against GFAP (Dako) and Iba1 (which labels macrophage/microglial cells; Imai et al., 1996) were added at concentrations of 1:1000, 1:5000, and 1:100. Omission of primary antibodies served as a negative control. The primary antibodies were detected in the brain sections by goat anti-mouse or goat anti-rabbit antibodies conjugated, respectively, to Texas Red or Alexa 488 (Molecular Probes, Leiden, The Netherlands) at 1:200.
For evaluation of the stainings a conventional fluorescence microscope (Leica, Bensheim, Germany) was used. Double labeling was evaluated by using a Bio-Rad MRC 600 confocal laser-scanning microscope (Bio-Rad Microscience, Watford, UK) combined with a Nikon Optiphot microscope and a Krypton laser (Ion Laser Technology, Salt Lake City, UT).
All surgical procedures were performed in accordance with theGuidelines for the Use of Animals in Neuroscience Research(Society for Neuroscience). All experiments were performed in a randomized manner, and surgery, infarct volume determination, and neurological grading were performed by investigators blinded to the groups.
RESULTS
Comparison of ischemic with nonischemic mouse brain transcriptome
We generated 31,626 tags from control and 32,068 tags from ischemic tissue (28,132 tags and 28,678 tags after removal of the linker-generated tags), representing 24,590 different transcripts. Then 14,193 different transcripts were observed in untreated mice, 269 of them occurring with absolute tag numbers of at least 10 (≥100 transcripts per cell), and 10,679 tags were detected only once; however, in ischemic brain tissue 14,988 different transcripts were detected, 255 of them occurring with at least 10 tags, and 11,482 different tags were observed only once. Highly abundant transcripts occurred with frequencies of 0.1–2% in both transcriptomes. From the 20 most abundantly expressed genes in both transcriptomes nine were derived from mitochondrial genes, nine were encoding proteins of the intermediary metabolism, and two were encoding myelin proteins. Two housekeeping genes commonly used as internal standards for semiquantitative RT-PCR were found under the 20 most abundant transcripts in focal cerebral ischemia. Whereas glyceraldehyde-3-phosphate-dehydrogenase (GAPDH) was downregulated slightly (1.3-fold), we found a 1.6-fold upregulation of β-actin in ischemic tissue.
From the estimated 30–40,000 genes of the mouse genome at least 24,590 genes were expressed in the mouse brain as detected by SAGE, from which only 4591 were expressed in both conditions. However, this relatively low fraction probably is related to the number of tags that were sequenced here. Assuming 300,000 transcripts per cell (Hastie and Bishop, 1976), one has to sequence ∼1,200,000 tags per condition to identify at least one tag for a given transcript 97% of the time if its expression level were one copy per cell (Velculescu et al., 1997). Sequencing such a high number of tags thus would minimize, but not eliminate, the bias of absolute abundance levels. Consequently, the sequencing depth of our SAGE library allows for an unbiased view on the differential expression of medium and highly abundant transcripts (≥50 transcripts per cell).
If the arbitrary convention of replacing a tag value of 0 by 0.5 is used to avoid a division by 0, 1224 genes were upregulated in ischemic tissue at least fourfold and 83 at least eightfold. Similar values were obtained for downregulated genes: 1239 (fourfold) and 94 (eightfold). Upregulated genes were ranked by their p values as computed by a Monte Carlo analysis (Table 1). Several of the identified genes were associated previously with focal cerebral ischemia in candidate approaches, while many of them represent new candidates. Five genes with p values <0.05 were selected, and differential expression was confirmed by Northern blotting (MT-II, serine protease inhibitor-2, myelin-associated oligodendrocytic basic protein, fibroblast growth factor-inducible gene 14, and transmembrane-4 superfamily protein cd63) (data not shown).
Classes of upregulated genes with p values ≤0.05 were visualized in Figure 1, demonstrating the high percentage of genes still unclassified and those involved in signal transduction.
Fig. 1.

Classification of genes upregulated after focal ischemia in the mouse brain. Genes upregulated after focal ischemia in the mouse brain with p < 0.05 as detected by SAGE were categorized according to their function, demonstrating the high percentage of still unclassified genes (44% without a match in the database and 65% as ESTs only) and proteins involved in signal transduction.
A complete searchable list is available on our website (http://sagelist.expneuro.de). The frequency of duplicate dimers (349, respectively; 541 in both fractions) potentially caused by a PCR bias was low compared with data that had been published earlier (Velculescu et al., 1997). This difference may be explained by the high number of PCR reactions performed in parallel. However, a relatively high percentage of linker-derived tags (11%) may indicate a nonoptimal washing step after ligation of the linker duplexes.
Reproducibility of SAGE
Although several statistical ways for the analysis of SAGE data have been published (Audic and Claverie, 1997; Zhang et al., 1997; Kal et al., 1999; Lal et al., 1999), empirical information about the reproducibility of SAGE data is still poor.
Because of the complex expression pattern expected in brain (Colantuoni et al., 2000), which would produce a high level of background signal when screening for differentially expressed genes, we performed a control experiment to reveal how precisely the expression patterns obtained by two separately performed SAGE passages from the same starting material would match each other.
Total RNA was pooled and divided into two fractions. SAGE was performed with both fractions separately, and >15,000 tags were generated from each of the two resulting libraries. As shown in Figure2A, ratios of absolute tag counts equal each other very well for highly abundant genes, whereas at lower expression rates the ratios tend to increase and make the identification of differentially expressed genes more difficult.
Fig. 2.
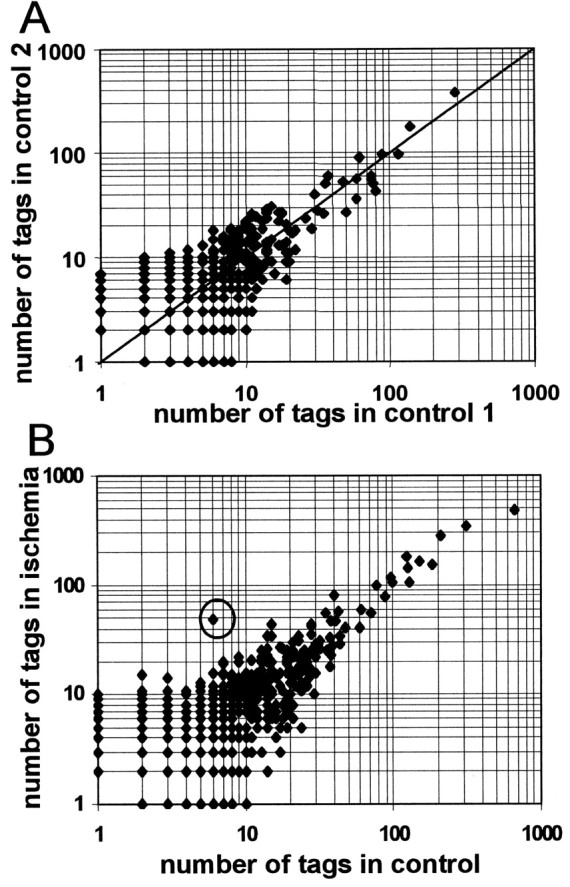
A, Reproducibility of SAGE. Total RNA derived from whole C57BL/6 mouse brain of four mice was pooled, and SAGE was performed with two fractions separately. Respectively, 15,869 tags (control 1) and 15,757 tags (control 2) were generated and used to compare absolute tag counts in each control experiment. Data points in the figure represent different transcripts; values on the x-axis correspond to absolute tag numbers in control 1; values on the y-axis correspond to absolute tag numbers in control 2. No ratio >2 was observed for tag counts >31 in controls 1 or 2. Linker-derived tags were excluded. Data are expressed in double logarithmic scale. B, MT-II is the most significantly upregulated transcript after focal ischemia in the mouse brain detected by SAGE. Data points belong to the different transcripts. The x- and y-axes represent absolute tag numbers in control brains and in postischemic brains, respectively. The dot for MT-II is marked by acircle.
To determine significance levels empirically, we used data from three generated SAGE libraries, two of them derived from the same total RNA preparation (c1 and c2). The third library from ischemic brain tissue was arbitrary divided into two subgroups (i1 and i2) of the same size (∼15,000 tags each), thereby enabling a comparison of “identical” SAGE libraries (i1 and i2), SAGE libraries from the same source but produced separately (c1 and c2), and SAGE libraries from different sources (c1,2 and i1,2) (Table2).
Table 2.
Comparison of diverse SAGE libraries containing 15,000 tags each
| p value | i1 vs i2 | c1 vs c2 | i1,2vs c1,2 |
|---|---|---|---|
| 0.0001 | 0 | 0 | 1.8 ± 0.8 |
| 0.001 | 0 | 0 | 3.0 ± 0.7 |
| 0.01 | 3 | 4 | 10.5 ± 5.6 |
| 0.05 | 21 | 31 | 42.5 ± 5.9 |
SAGE libraries c1 and c2 were generated by using the same starting material from untreated (control) mice but separate SAGE procedures, whereas subgroups i1 and i2 were derived from the same SAGE library from ischemic brain tissue by dividing the whole pool of sequenced tags arbitrarily into two distinct subgroups. Numbers correspond to the number of transcripts found in each comparison, with p values of at least those listed in the first row and an induction of at least threefold. p values were calculated by the double-sided version of Fisher's Exact Test. Values in the fourth row represent mean values ± SD, derived from the pairwise comparison of the subgroups i1, i2, c1, and c2.
Using a significance level of 0.001, we found no significantly different expressed transcripts when identical libraries (i1 vs i2) or libraries from identical tissue (c1 vs c2) were used for comparison, whereas transcripts with significant p values were still detectable between libraries from different tissues (i vs c) (Table 2).
MT-II is the major upregulated transcript
MT-II mRNA was the transcript that is induced most significantly in the ischemic hemisphere (eightfold; p < 1 × 10⁻⁶) after analysis of >60,000 tags (Fig. 2B, Table 1), occurring with a relative abundance of 0.17% among the total ischemic brain mRNA. In contrast to MT-II, MT-I transcripts were not detected by SAGE analysis because of the lack of a Nla3 restriction site (Glanville et al., 1981; Mbikay et al., 1981), which is necessary for the generation of each tag (Velculescu et al., 1995).
Time course of MT-II and MT-I expression after transient focal ischemia
Both transcripts were upregulated in ischemic tissue several hours after the induction of focal ischemia (Fig.3). MT-II mRNA induction was monophasic, starting as early as 2 hr after the induction of ischemia and reaching a maximum after 16 hr with a 6.4-fold induction. MT-I mRNA expression was similar, with a threefold induction after 16 hr. Induction of MT-II 16 hr after ischemia as observed by Northern blotting corresponded quantitatively with the eightfold induction obtained by SAGE. When we used only 1 hr for the induction of ischemia, MT-I and MT-II upregulation reached their peaks at 48 and 24 hr, respectively (data not shown). Although intensities in Northern blotting in untreated mice seem to indicate a higher expression level of MT-I when compared with MT-II (see control in Fig. 3), the absolute Northern blot signal cannot be compared between MT-I and MT-II because of different probe characteristics. Absolute amounts of MT-I and MT-II mRNA in untreated mice were assumed to be in the same range, because former results from quantitative solution hybridization experiments (Searle et al., 1984) revealed a ratio of MT-I mRNA to MT-II mRNA of 2:3 in most mouse tissues. Measurements of induction kinetics clearly indicate a higher induction ratio of MT-II in the first 48 hr after hypoxia in comparison to MT-I (Fig. 3).
Fig. 3.

MT-I and MT-II expression after transient focal ischemia in the mouse brain. A Northern blot was loaded with 10 μg of total RNA per lane, prepared from the whole ipsilateral hemisphere at various time points after 2 hr of ischemia and from control mice. The same Northern blot membrane was probed successively with32P-labeled MT-I-specific (A) and MT-II-specific (B) probes. C, Quality and quantity of RNA after electrophoresis were checked by ethidium bromide staining. D, Induction kinetics of MT-I mRNA and MT-II mRNA after focal cerebral ischemia, based on measurements with PhosphorImager SI (Molecular Dynamics, Sunnyvale, CA) and calculations with ImageQuant, version 5.0 (Molecular Dynamics).
Upregulation of metallothionein protein in the ischemic hemisphere was confirmed via Western blotting (Fig. 4). Metallothionein induction was maximal at 12 and 24 hr after the induction of ischemia for 2 hr (Fig. 4).
Fig. 4.

Metallothionein is induced in the ischemic hemisphere, as demonstrated by Western blotting. Protein was derived from ischemic hemispheres at various time points after the induction of ischemia for 2 hr in C57BL/6 mice and from control animals (Co). Then 40 μg of protein was loaded per lane on 17.5% SDS-polyacrylamide gel, followed by electrophoresis and semidry blotting onto PVDF membranes (B). Incubation with monoclonal mouse antibody raised against MT was performed with a titer of 1:100. For loading the control, we used mouse monoclonal anti-β-tubulin (β-Tub) antibody. A secondary anti-mouse horseradish peroxidase-linked antibody (sc-2005, Santa Cruz Biotechnology), the enhanced chemiluminescence kit from Pierce (Rockford, IL), and autoradiography were used to visualize the signals (B). A low-range molecular weight standard (Invitrogen) was used to determine protein sizes. The semiquantitative analysis of the Western blots by band densitometry is shown from three separate experiments (A). Data are shown as means ± SD.
Localization of MT-I and MT-II in ischemic mouse brain
In wild-type control mice the MT-I and MT-II expression was confined to the choroid plexus and ependymal layer. No MT-I and MT-II expression was observed in MT-I- and MT-II-deficient mice (Fig.5) or in negative controls with the omission of primary antibodies (data not shown).
Fig. 5.
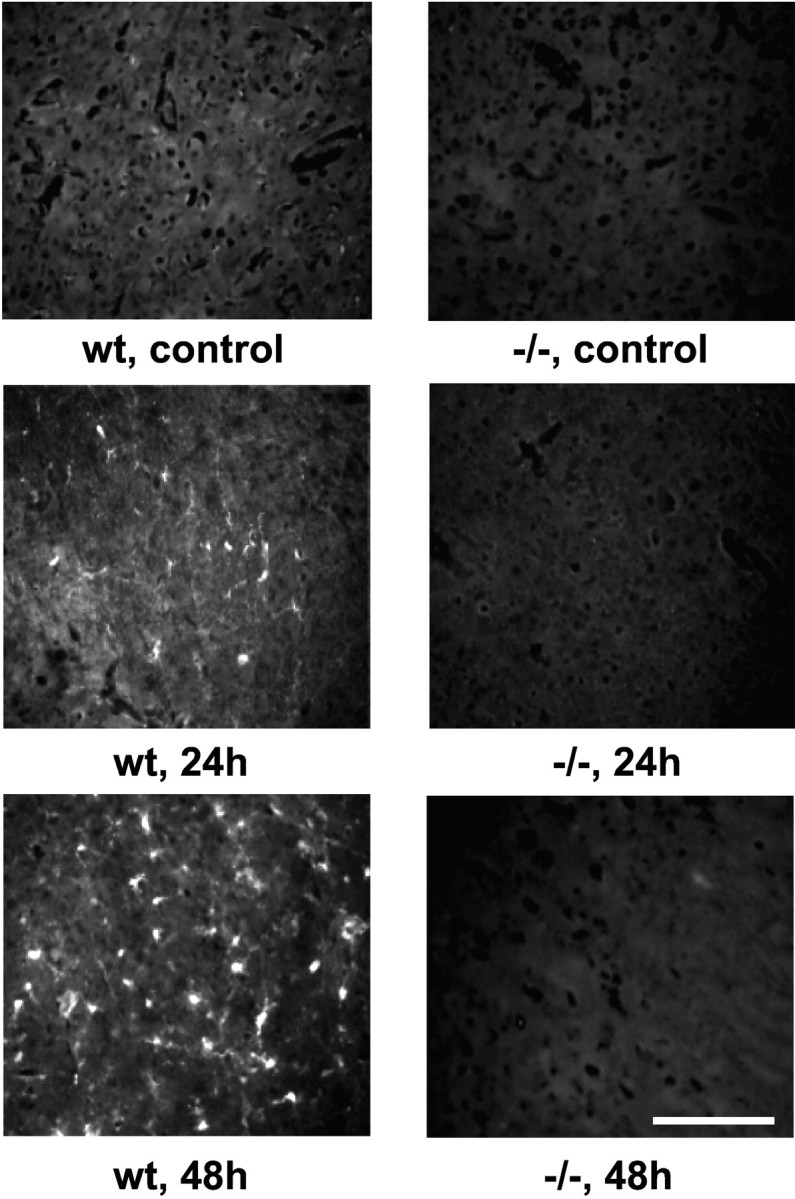
Metallothionein is induced in the ischemic hemisphere as demonstrated by immunohistochemistry. At 24 and 48 hr after the induction of focal cerebral ischemia the mouse brain slices at interaural position 3.9 mm derived from MT-I and MT-II knock-out animals (right) and wild-type animals (left) were stained with anti-MT-I/-II mAb (E9; Dako). MT immunoreactivity can be observed after 24 hr of reperfusion and is more pronounced after 48 hr of reperfusion in the ischemic striatum of wild-type mice (wt). No MT immunoreactivity is detectable in MT-I/-II knock-out mice. Scale bar, 100 μm.
At 24 hr after ischemia MT immunoreactivity was induced in the ipsilateral hemisphere of wild-type, but not of MT-I- and MT-II-deficient, mice. MT-I and MT-II immunoreactivity also increased in the ipsilateral hemisphere of wild-type mice 48 hr after ischemia (Fig. 5). In contrast, infarct size increased only marginally at 48 hr compared with 24 hr (data not shown). Serial sectioning of the brains revealed that MT-I and MT-II expression was distributed homogeneously in the anterior–posterior axis (Fig. 6). Strongest MT-I and MT-II expression was detected in the corpus callosum, hippocampus, and striatum. Expression of MT-I and MT-II was found almost exclusively in reactive astrocytes surrounding the infarct core (Figs. 7, 8). Some macrophages/microglia also expressed MT-I/-II (Fig.8). No MT expression was observed in nonischemic brain (data not shown) or in MT-I- and MT-II-deficient mice 48 hr after ischemia (see Fig. 5).
Fig. 6.
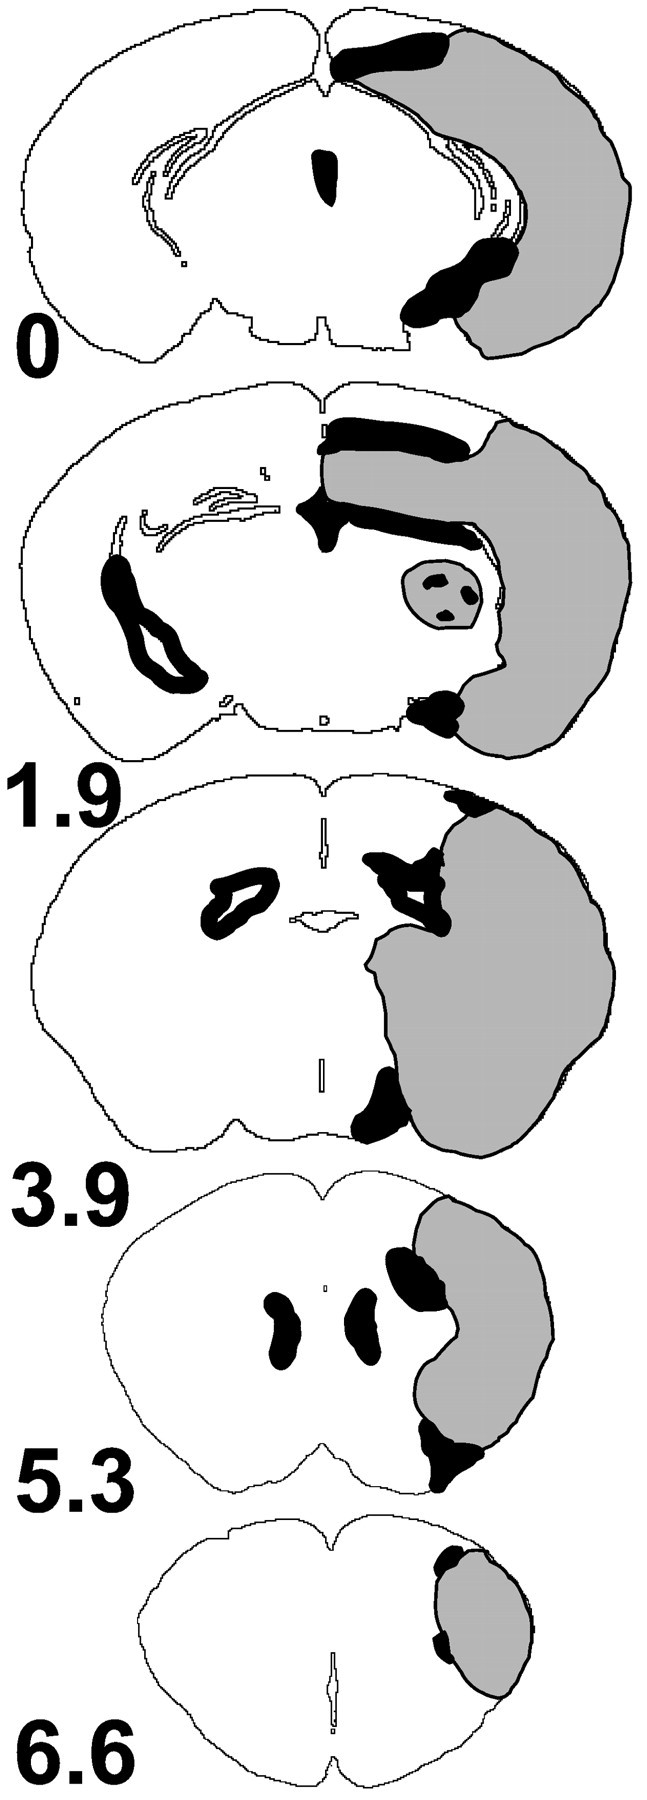
Representative brain sections illustrating the distribution of the ischemic damage and MT expression in wild-type mice after MCAO. The area of infarction (gray) involves the cerebral cortex, striatum, and hippocampus. Note that MT expression (black) is localized around the necrotic core and in the ependyma. Sections are from one representative wild-type mouse 48 hr after MCAO (n = 3). Interaural positions are noted in millimeters.
Fig. 7.

MT is expressed in astrocytes in the peri-infarct zone. A representative area of the infarct border 48 hr after MCAO was chosen (the box in A; H&E-stained section at interaural position 1.9 mm), and the adjacent section was analyzed for GFAP and MT-I/-II expression by double-labeling immunohistochemistry with the use of fluorescent-conjugated secondary antibodies (B–D). Strong MT expression (B) is found around the infarct and in an area of astrogliosis (C; GFAP immunoreactivity). ImagesB and C are superimposed inD, revealing that MT expression is almost exclusively astroglial. Scale bar, 50 μm.
Fig. 8.
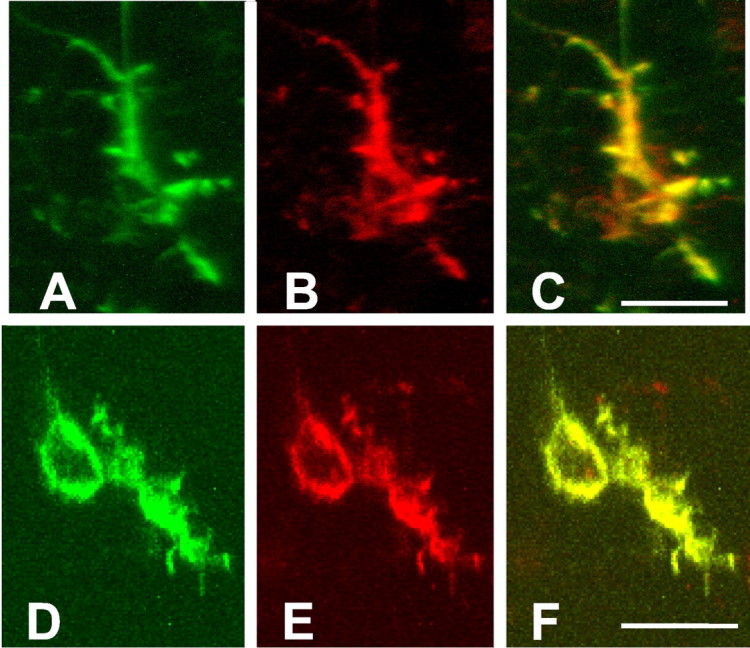
Double labeling demonstrates MT expression in astrocytes and macrophages/microglia 48 hr after transient ischemia in the mouse brain. For double labeling an mAb against MT-I and MT-II (A, D) was used in combination with anti-GFAP antibody (B) and anti-Iba1 antibody (E), which demonstrates the colocalization of metallothionein expression with GFAP-positive (astrocytes) and Iba1-postive (macrophage/microglia) cells in ischemic striatum (C, F). The signals were detected by using a confocal laser-scanning microscope (MRC-600; Bio-Rad). Scale bars, 10 μm.
MT-I- and MT-II-deficient mice have larger infarcts but similar angioarchitecture
Direct, indirect, as well as relative infarct volumes of MT-I- and MT-II-deficient animals were approximately three times as large as those of control mice, as shown in Figure9 and Table3. Neurological deficit was worse in knock-out mice than in control mice (Table4).
Fig. 9.

Infarct volume is greater in MT-I/-II knock-out than in wild-type mice. Direct infarct volume ± SD is visualized. Statistical analysis was performed with the unpaired ttest.
Table 3.
Infarct volumes of wild-type and metallothionein-I/-II knock-out mice (MT−/−)
| Wild-type | MT−/− | Power | p | |
|---|---|---|---|---|
| Infarct volumedirect | 31 (0) | 101 (24) | 1.0 | <0.001 |
| Infarct volumeindirect | 26 (7) | 75 (16) | 1.0 | <0.001 |
| Infarct volumerelative | 15 (5) | 43 (8) | 1.0 | <0.001 |
| Edema | 6 (7) | 26 (14) | 1.0 | <0.001 |
| Deceased animals | 0 | 4 | ||
| Included animals | 14 | 9 |
Edema and direct and indirect infarct volume are given in mm3; relative infarct size is shown in percentage of the contralateral hemisphere. Different volumes were measured to control a hypothetical (inverse) influence of brain swelling (edema) on the infarct sizes. Values are stated as mean; SD is given in brackets. Statistical analysis was performed by using the two-tailed ttest. In all groups that passed a test of normal distribution, a power analysis was performed. No inverse effect of edema on infarct sizes has been observed.
Table 4.
Neurological deficit is greater in ischemic MT-I and MT-II knock-out than in wild-type mice
| 1 hr | 24 hr | 48 hr | |
|---|---|---|---|
| WT | 2 (2/2) | 1 (1/1) | 0.5 (0/1) |
| MT−/− | 3 (2/3) | 2 (2/2.25) | 2 (1.75/2) |
| p= | 0.065 | 0.006 | 0.006 |
Animals were graded for a neurological deficit 1, 24 and 48 hr after induction of ischemia. Values are stated as median and 25/75% percentile in brackets. Comparisons between groups were made by using the Mann–Whitney rank sum test.
Using intravascular carbon black injection, we found no significant differences of the supplying territory of the MCA in MT-I/-II knock-out and wild-type mice (Fig. 10). The similarity of the microangioarchitecture of native MT-I/-II knock-out and wild-type mice also has been shown recently by others (Penkowa et al., 2000).
Fig. 10.

Superficial microcirculation of MT-I/-II knock-out and wild-type animals is not different. A, To evaluate the territory supplied by the middle cerebral artery, we counted anastomoses on the dorsal surface between the anterior cerebral artery and middle cerebral artery. Adjacent anastomosis points were connected by a line (A), and the distance from the midline to the line of anastomoses was measured at 2, 4, and 6 mm from the frontal pole. All values are given as means ± SD (B). For statistical comparison an unpaired t test was calculated. No significant differences in the supplying territory of the middle cerebral artery between knock-out and wild-type mice were detected.
DISCUSSION
Differential gene expression after focal cerebral ischemia
The invention and application of SAGE have paralleled those of competing microarray/chip technologies. Whereas hybridization-based technologies may allow for shorter detection times and high throughput expression analysis, SAGE not only identifies unknown genes but also produces information on absolute gene expression.
To the best of our knowledge, we here present the first comprehensive expression analysis after experimental focal cerebral ischemia in the mouse and supply a list of the 50 most significantly upregulated genes after 14 hr of reperfusion after focal cerebral ischemia. A searchable full list of all transcripts is published on the Internet (see Results). Identification of the complete sequences of the expressed sequence tags (ESTs) may lead to the discovery of new genes relevant for stroke pathophysiology. As can be predicted from statistical calculation (Zhang et al., 1997), some of these genes may represent false-positives, or tag sequences may stem from yet unidentified genes, the sequences of which still may be missing in databases that are available today. This caveat particularly applies to the complete list of differentially expressed tag sequences published on the Internet. Because we primarily were interested in endogenous protective mechanisms, which were assumed to be induced, we focused only on upregulated genes.
In claiming the description of a transcriptome of focal cerebral ischemia, we do not want to conceal that the present sequencing depth of the SAGE library does not allow for an unbiased view on differential expression, which is a problem especially for low-abundance transcripts. However, all available transcript screening technologies exhibit limitations in analyzing weakly expressed genes. These low-abundance transcripts are likely to include many of the relevant signal transducers, in particular transcription factors (Thieffry, 1999). In principle, the complete semiquantitative description of mammalian transcriptomes by SAGE would require the sequencing of at least 1,200,000 tags per condition, resulting in an enormous sequencing effort.
As far as we are aware, we present here for the first time data on the reproducibility of SAGE. By performing SAGE twice on the same pool of mRNAs, we demonstrate that SAGE yields reliable information on differential gene expression in such complex tissues as the mammalian brain. As with other high throughput techniques it must, however, be noted that no absolute criteria for differential expression in terms ofp values or fold induction can be given. Concomitant control studies are indispensable to assess the data material and to determine reasonable thresholds. As revealed by the comparison of homogeneous libraries, a p value of ≤0.001 is not surmounted in our control experiment. Thus, the two genes matching these criteria, MT-II and EST AL024263, can be regarded as robust findings. However, thep value for EST AL024263 (p = 0.00045) was not statistically significant after application of the Bonferroni correction. Loosening the strict threshold for pvalues and accepting values of up to 0.05 inevitably entails a significant portion of false positives. Positive results obtained by Northern blotting clearly prove that such less significant hits should not be discarded without additional analysis.
Another methodological issue has to be considered when interpreting global gene expression patterns in tissues: transcriptional regulation cannot be distinguished a priori from changes in the cellular composition of the organ or tissue that has been studied. In the context of ischemia, selective neuronal cell death and the migration and/or proliferation of leukocytes and glial cells have to be considered. Nevertheless, screening of whole-tissue abundance of a particular transcript provides candidate targets that help to narrow the list of potentially involved genes and may point to changes in cellular composition. The candidate genes defined by the screening approach then have to be analyzed further on a functional and cellular level.
To analyze functional relevance of genes differentially expressed in focal cerebral ischemia, we also focused on the gene most significantly upregulated for which a knock-out model is available.
Expression pattern and function of MT-I and MT-II expression after focal cerebral ischemia
MT-II mRNA was the most significantly upregulated transcript identified by SAGE. Its induction was confirmed by Northern blotting. MTs are small (6 kDa), cysteine-rich molecules characterized further by their lack of aromatic residues and the presence of 7–12 metal atoms per molecule (Fischer et al., 1998). Four MTs have been characterized in mice. Mouse MT-I and MT-II have shown to be induced by glucocorticoids (Kelly et al., 1997), heavy metals like Cd or Zn (Palmiter, 1994), inflammatory agents, cytotoxic chemicals, and their downstream mediators (Kägi, 1991; Samson and Gedamu, 1998). Although MT-I and MT-II generally were assumed to be regulated coordinately (Searle et al., 1984; Masters et al., 1994), our data indicate a differential induction pattern for MT-I and MT-II in focal cerebral ischemia. Induction of MTs was in agreement with recent results of MT-I/-II induction in ischemic brain tissue (Ebadi et al., 1995; Neal et al., 1996; Van Lookeren Campagne et al., 1999).
Despite several functions ascribed to metallothioneins, their exact principle of action remains obscure (Palmiter, 1998). Mechanisms in which MT-I and MT-II are involved in a protective manner, like zinc toxicity (Kelly et al., 1996), oxidative stress (Thornalley and Vasak, 1985; Thomas et al., 1986; Tamai et al., 1993; Wang et al., 1999), and apoptosis (Abdel-Mageed and Agrawal, 1998; Penkowa et al., 1999), also contribute to damage in cerebral ischemia (Choi and Koh, 1998; Dirnagl et al., 1999). This supports the idea of a protective role of MTs in transient focal ischemia. Recently, MT-I-overexpressing transgenic mice were shown to be protected against focal cerebral ischemia (Van Lookeren Campagne et al., 1999). We now supply additional evidence for a neuroprotective role of MTs by the use of a knock-out model.
Expression analysis in general provides correlative rather than causal information. We therefore investigated the functional role of MTs by studying MT-I and MT-II double knock-out mice (Masters et al., 1994). MT-I- and MT-II-deficient mice not only exhibit a poor neurological outcome after stroke compared with the control animals but also histopathologically present with drastically exacerbated infarct volumes. The overwhelming effect of the lack of MT-I and MT-II genes indicates an important protective function of MT in focal cerebral ischemia.
It remains unknown whether this neuroprotective effect is based on a direct oxidant-scavenging effect (Thornalley and Vasak, 1985; Thomas et al., 1986) or whether it involves a complex zinc-mediated regulatory network sustained by MT (Fischer and Davie, 1998). Recent results with MT-I-overexpressing mice further substantiate the evidence of a protective role of metallothioneins in focal cerebral ischemia (Van Lookeren Campagne et al., 1999). However, on the basis of the assumption that both metallothioneins are functionally identical (Masters et al., 1994), we postulate MT-II to be more relevant than MT-I for endogenous neuroprotection because of the higher induction ratio of MT-II in contrast to MT-I.
In conclusion, our data demonstrate the feasibility and reliability of SAGE in such complex tissues as the whole mammalian brain. As shown for MT, this work also demonstrates a feasible way to link differential gene expression data to functional relevance by using knock-out models. Our findings indicate that metallothioneins are important neuroprotective proteins in focal cerebral ischemia. Other investigators may extract additional useful information from the complete list of control and ischemic mouse brain transcripts.
Footnotes
This work was supported by the Deutsche Forschungsgemeinschaft (ME1562/1-1) and the Hermann and Lilly Schilling Foundation. SAGE software (version 3.01) and Detailed Protocol (version 1.0c) were kindly provided by Dr. K. Kinzler.
Correspondence should be addressed to Dr. George Trendelenburg, Department of Neurology, Charité, Humboldt Universität Berlin, Schumannstrasse 20/21, D-10098 Berlin, Germany. E-mail:george.trendelenburg@charite.de.
A. O. Schmitt's present address: Epigenomics AG, D-10178 Berlin, Germany.
REFERENCES
- 1.Abdel-Mageed AB, Agrawal KC. Activation of nuclear factor NFκB: potential role in metallothionein-mediated mitogenic response. Cancer Res. 1998;58:2335–2338. [PubMed] [Google Scholar]
- 2.Audic S, Claverie JM. The significance of digital gene expression profiles. Genome Res. 1997;7:986–995. doi: 10.1101/gr.7.10.986. [DOI] [PubMed] [Google Scholar]
- 3.Bederson JB, Pitts LH, Tsuji M, Nishimura MC, Davis RL, Bartkowski H. Rat middle cerebral artery occlusion: evaluation of the model and development of a neurologic examination. Stroke. 1986;17:472–476. doi: 10.1161/01.str.17.3.472. [DOI] [PubMed] [Google Scholar]
- 4.Blackshaw S, Fraioli RE, Furukawa T, Cepko CL. Comprehensive analysis of photoreceptor gene expression and the identification of candidate retinal disease genes. Cell. 2001;107:579–589. doi: 10.1016/s0092-8674(01)00574-8. [DOI] [PubMed] [Google Scholar]
- 5.Choi DW, Koh JY. Zinc and brain injury. Annu Rev Neurosci. 1998;21:347–375. doi: 10.1146/annurev.neuro.21.1.347. [DOI] [PubMed] [Google Scholar]
- 6.Colantuoni C, Purcell AE, Bouton CM, Pevsner J. High throughput analysis of gene expression in the human brain. J Neurosci Res. 2000;59:1–10. doi: 10.1002/(sici)1097-4547(20000101)59:1<1::aid-jnr1>3.0.co;2-2. [DOI] [PubMed] [Google Scholar]
- 7.Dirnagl U, Iadecola C, Moskowitz MA. Pathobiology of ischaemic stroke: an integrated view. Trends Neurosci. 1999;22:391–397. doi: 10.1016/s0166-2236(99)01401-0. [DOI] [PubMed] [Google Scholar]
- 8.Ebadi M, Iversen PL, Hao R, Cerutis DR, Rojas P, Happe HK, Murrin LC, Pfeiffer RF. Expression and regulation of brain metallothionein. Neurochem Int. 1995;27:1–22. doi: 10.1016/0197-0186(94)00164-p. [DOI] [PubMed] [Google Scholar]
- 9.Fischer EH, Davie EW. Recent excitement regarding metallothionein. Proc Natl Acad Sci USA. 1998;95:3333–3334. doi: 10.1073/pnas.95.7.3333. [DOI] [PMC free article] [PubMed] [Google Scholar]
- 10.Glanville N, Durnam DM, Palmiter RD. Structure of mouse metallothionein-I gene and its mRNA. Nature. 1981;192:267–269. doi: 10.1038/292267a0. [DOI] [PubMed] [Google Scholar]
- 11.Hara H, Huang PL, Panahian N, Fishman MC, Moskowitz MA. Reduced brain edema and infarction volume in mice lacking the neuronal isoform of nitric oxide synthase after transient MCA occlusion. J Cereb Blood Flow Metab. 1996;16:605–611. doi: 10.1097/00004647-199607000-00010. [DOI] [PubMed] [Google Scholar]
- 12.Hastie ND, Bishop JO. The expression of three abundance classes of messenger RNA in mouse tissues. Cell. 1976;9:761–774. doi: 10.1016/0092-8674(76)90139-2. [DOI] [PubMed] [Google Scholar]
- 13.Imai Y, Ibata I, Ito D, Ohsawa K, Kohsaka S. A novel gene iba1 in the major histocompatibility complex class III region encoding a EF hand protein expressed in a monocytic lineage. Biochem Biophys Res Commun. 1996;224:855–862. doi: 10.1006/bbrc.1996.1112. [DOI] [PubMed] [Google Scholar]
- 14.Kägi JHR. Overview of metallothionein. Methods Enzymol. 1991;205:613–626. doi: 10.1016/0076-6879(91)05145-l. [DOI] [PubMed] [Google Scholar]
- 15.Kal AJ, van Zonneveld AJ, Benes V, van den Berg M, Koerkamp MG, Albermann K, Starck N, Ruijter JM, Richter A, Dujon B, Ansorge W, Tabak HF. Dynamics of gene expression revealed by comparison of serial analysis of gene expression transcript profiles from yeast grown on two different carbon sources. Mol Cell Biol. 1999;10:1859–1872. doi: 10.1091/mbc.10.6.1859. [DOI] [PMC free article] [PubMed] [Google Scholar]
- 16.Kelly EJ, Quaife CJ, Froelick GJ, Palmiter RD. Metallothionein I and II protect against zinc deficiency and zinc toxicity in mice. J Nutr. 1996;126:1782–1790. doi: 10.1093/jn/126.7.1782. [DOI] [PubMed] [Google Scholar]
- 17.Kelly EJ, Sandgren EP, Brinster RL, Palmiter RD. A pair of adjacent glucocorticoid response elements regulate expression of two mouse metallothionein genes. Proc Natl Acad Sci USA. 1997;94:10045–10050. doi: 10.1073/pnas.94.19.10045. [DOI] [PMC free article] [PubMed] [Google Scholar]
- 18.Laemmli UK. Cleavage of structural proteins during the assembly of the head of bacteriophage T4. Nature. 1970;227:680–685. doi: 10.1038/227680a0. [DOI] [PubMed] [Google Scholar]
- 19.Lal A, Lash AE, Altschul SF, Velculescu VE, Zhang L, McLendon RE, Marra MA, Prange C, Morin PJ, Polyak K, Papadopoulos N, Vogelstein B, Kinzler KW, Strausberg RL, Riggins GJ. A public database for gene expression in human cancers. Cancer Res. 1999;59:5403–5407. [PubMed] [Google Scholar]
- 20.Lin TN, He YY, Wu G, Khan M, Hsu CY. Effect of brain edema on infarct volume in a focal cerebral ischemia model in rats. Stroke. 1993;24:117–121. doi: 10.1161/01.str.24.1.117. [DOI] [PubMed] [Google Scholar]
- 21.Maeda K, Hata R, Hossmann KA. Differences in the cerebrovascular anatomy of C57black/6 and SV129 mice. NeuroReport. 1998;9:1317–1319. doi: 10.1097/00001756-199805110-00012. [DOI] [PubMed] [Google Scholar]
- 22.Masters BA, Kelly EJ, Quaife CJ, Brinster RL, Palmiter RD. Target disruption of metallothionein I and II genes increases sensitivity to cadmium. Proc Natl Acad Sci USA. 1994;91:584–588. doi: 10.1073/pnas.91.2.584. [DOI] [PMC free article] [PubMed] [Google Scholar]
- 23.Mbikay M, Maiti IB, Thirion JP. Cloning and sequencing of cDNA for mouse liver metallothionein-I. Biochem Biophys Res Commun. 1981;103:825–832. doi: 10.1016/0006-291x(81)90885-8. [DOI] [PubMed] [Google Scholar]
- 24.Neal JW, Singhrao SK, Jasani B, Newman GR. Immunohistochemically detectable metallothionein is expressed by astrocytes in the ischaemic human brain. Neuropathol Appl Neurobiol. 1996;22:243–247. [PubMed] [Google Scholar]
- 25.Palmiter RD. Regulation of metallothionein genes by heavy metals appears to be mediated by a zinc-sensitive inhibitor that interacts with a constitutively active transcription factor, MTF-1. Proc Natl Acad Sci USA. 1994;91:1219–1223. doi: 10.1073/pnas.91.4.1219. [DOI] [PMC free article] [PubMed] [Google Scholar]
- 26.Palmiter RD. The elusive function of metallothionein. Proc Natl Acad Sci USA. 1998;95:8428–8430. doi: 10.1073/pnas.95.15.8428. [DOI] [PMC free article] [PubMed] [Google Scholar]
- 27.Penkowa M, Carrasco J, Giralt M, Moos T, Hidalgo J. CNS wound healing is severely depressed in metallothionein I- and II-deficient mice. J Neurosci. 1999;19:2535–2545. doi: 10.1523/JNEUROSCI.19-07-02535.1999. [DOI] [PMC free article] [PubMed] [Google Scholar]
- 28.Penkowa M, Carrasco J, Giralt M, Molinero A, Hernandez J, Campbell IL, Hidalgo J. Altered central nervous system cytokine-growth factor expression profiles and angiogenesis in metallothionein-I+II deficient mice. J Cereb Blood Flow Metab. 2000;20:1174–1189. doi: 10.1097/00004647-200008000-00003. [DOI] [PubMed] [Google Scholar]
- 29.Sambrook J, Fritsch EF, Maniatis T. Molecular cloning: a laboratory manual, 2nd Ed. Cold Spring Harbor Laboratory; Cold Spring Harbor, NY: 1989. [Google Scholar]
- 30.Samson SL, Gedamu L. Molecular analyses of metallothionein gene regulation. Prog Nucleic Acid Res Mol Biol. 1998;59:257–288. doi: 10.1016/s0079-6603(08)61034-x. [DOI] [PubMed] [Google Scholar]
- 31.Schmitt AO, Specht T, Beckmann G, Dahl E, Pilarsky CP, Hinzmann B, Rosenthal A. Exhaustive mining of EST libraries for genes differentially expressed in normal and tumour tissues. Nucleic Acids Res. 1999;27:4251–4260. doi: 10.1093/nar/27.21.4251. [DOI] [PMC free article] [PubMed] [Google Scholar]
- 32.Searle PF, Davison BL, Stuart GW, Wilkie TM, Norstedt G, Palmiter RD. Regulation, linkage, and sequence of mouse metallothionein I and II genes. Mol Cell Biol. 1984;4:1221–1230. doi: 10.1128/mcb.4.7.1221. [DOI] [PMC free article] [PubMed] [Google Scholar]
- 33.Tamai KT, Gralla EB, Ellerby LM, Valentine JS, Thiele DJ. Yeast and mammalian metallothioneins functionally substitute for yeast copper–zinc superoxide dismutase. Proc Natl Acad Sci USA. 1993;90:8013–8017. doi: 10.1073/pnas.90.17.8013. [DOI] [PMC free article] [PubMed] [Google Scholar]
- 34.Thieffry D. From global expression data to gene networks. BioEssays. 1999;21:895–899. doi: 10.1002/(SICI)1521-1878(199911)21:11<895::AID-BIES1>3.0.CO;2-F. [DOI] [PubMed] [Google Scholar]
- 35.Thomas JP, Bachowski GL, Girotti AW. Inhibition of cell membrane lipid peroxidation by cadmium- and zinc-metallothionein. Biochim Biophys Acta. 1986;884:448–461. doi: 10.1016/0304-4165(86)90195-9. [DOI] [PubMed] [Google Scholar]
- 36.Thornalley PS, Vasak M. Possible role for metallothionein in protection against radiation-induced oxidative stress. Kinetics and mechanism of its reaction with superoxide and hydroxyl radicals. Biochim Biophys Acta. 1985;827:36–44. doi: 10.1016/0167-4838(85)90098-6. [DOI] [PubMed] [Google Scholar]
- 37.Van Lookeren Campagne M, Thibodeaux H, Van Bruggen N, Cairns B, Gerlai R, Palmer JT, Williams SP, Lowe DG. Evidence for a protective role of metallothionein-1 in focal cerebral ischemia. Proc Natl Acad Sci USA. 1999;96:12870–12875. doi: 10.1073/pnas.96.22.12870. [DOI] [PMC free article] [PubMed] [Google Scholar]
- 38.Velculescu VE, Zhang L, Vogelstein B, Kinzler KW. Serial analysis of gene expression. Science. 1995;270:484–487. doi: 10.1126/science.270.5235.484. [DOI] [PubMed] [Google Scholar]
- 39.Velculescu VE, Zhang L, Zhou W, Vogelstein J, Basrai MA, Bassett DE, Jr, Hieter P, Vogelstein B, Kinzler KW. Characterization of the yeast transcriptome. Cell. 1997;88:243–251. doi: 10.1016/s0092-8674(00)81845-0. [DOI] [PubMed] [Google Scholar]
- 40.Velculescu VE, Vogelstein B, Kinzler KW. Analyzing uncharted transcriptomes with SAGE. Trends Genet. 2000;16:423–425. doi: 10.1016/s0168-9525(00)02114-4. [DOI] [PubMed] [Google Scholar]
- 41.Wang G-W, Schuschke DA, Kang YJ. Metallothionein-overexpressing neonatal mouse cardiomyocytes are resistant to H2O2 toxicity. Am J Physiol. 1999;276:H167–H175. doi: 10.1152/ajpheart.1999.276.1.H167. [DOI] [PubMed] [Google Scholar]
- 42.Zhang L, Zhou W, Velculescu VE, Kern SE, Hruban RH, Hamilton SR, Vogelstein B, Kinzler KE. Gene expression profiles in normal and cancer cells. Science. 1997;276:1268–1272. doi: 10.1126/science.276.5316.1268. [DOI] [PubMed] [Google Scholar]