

Abstract
Temporal lobe epilepsy, the most common type of epilepsy in adult humans, is characterized clinically by the progressive development of spontaneous recurrent seizures of temporal lobe origin and pathologically by hippocampal neuronal loss and mossy fiber sprouting. In this study, we sought to test the prominent hypothesis that neuronal loss and mossy fiber sprouting play a critical role in the genesis and progression of temporal lobe epilepsy.
Rats receiving a single kainic acid injection experienced a single sustained episode of epileptic status with massive neuronal loss and mossy fiber sprouting, whereas rats receiving triple kainic acid injections experienced two priming episodes and one sustained episode of epileptic status with no detectable neuronal loss and mossy fiber sprouting. Early in the process of chronic seizure development, primed rats that failed to show detectable neuronal loss and mossy fiber sprouting exhibited a starting date and a frequency of spontaneous recurrent seizures similar to those of nonprimed rats that showed massive neuronal loss and mossy fiber sprouting. However, nonprimed rats displayed significantly prolonged episodes of spontaneous recurrent seizures over the whole process of chronic seizure development and more frequent severe seizures later in the process. Similar results were observed in both Fischer-344 and Wistar rats as well as in the rat pilocarpine preparation of temporal lobe epilepsy.
These results fail to reveal a relation between neuronal loss–mossy fiber sprouting and the genesis of temporal lobe epilepsy but suggest that neuronal loss, mossy fiber sprouting, or both contribute to the intensification of chronic seizures.
Keywords: mossy fiber sprouting, neuronal loss, epilepsy/physiopathology, kainic acid, hippocampal/physiopathology, temporal lobe epilepsy
Temporal lobe epilepsy (TLE), the most common type of epilepsy in adult humans (Engel, 1989), is characterized clinically by the progressive development of spontaneous recurrent seizures (SRS) from temporal lobe foci (Engel, 1989, 1996). Before exhibiting SRS, patients with TLE usually experience epileptic status early in life, followed by a seizure-free period ranging from months to years (Engel, 1989; Lothman and Bertram, 1993). TLE is also characterized pathologically by unique morphological alterations in the hippocampus. The most frequently observed alteration is massive neuronal loss in the hilus of the dentate gyrus and in the CA1 and CA3 pyramidal cell layers (Engel, 1989; Lothman and Bertram, 1993; Ben-Ari and Cossart, 2000). Another common morphological alteration is mossy fiber sprouting, the growth of aberrant collaterals of granule cell axons into the inner molecular layer of the dentate gyrus (Sutula et al., 1989; Houser et al., 1990; Babb et al., 1991; Isokawa et al., 1993).
A prominent hypothesis states that hippocampal neuronal loss and mossy fiber sprouting play a critical role in the genesis and progression of TLE (for review, see Lothman and Bertram, 1993; Wasterlain et al., 1993, 1996; Engel, 1996; Lowenstein, 1996; Coulter, 1999; Houser, 1999;Ben-Ari and Cossart, 2000). This hypothesis is supported by several lines of evidence. First, partial hippocampal removal including the site of neuronal damage results in a seizure-free state or a marked reduction of seizure frequency in many patients (Flaconer and Serafetinides, 1963; Rasmussen, 1983; King et al., 1986; Brown and Babb, 1987; Engel, 1987, 1989; Bruton, 1988; Babb et al., 1990). Second, the sprouted mossy fibers seemingly form a powerful monosynaptic recurrent excitatory pathway, through which SRS is generated (for review, see Sperk, 1994; Lowenstein, 1996; Lynch and Sutula, 2000). This suggestion is supported by the findings that the intensity and time course of mossy fiber sprouting positively correlate with the severity and time course of SRS (Sutula et al., 1989) and that the sprouted mossy fibers seemingly form recurrent excitatory circuits (Tauck and Nadler, 1985; Cronin et al., 1992; Lynch and Sutula, 2000).
Other evidence, however, has challenged this hypothesis. For example, partial resection of hippocampal tissue that exhibits no neuronal loss led to successful control of seizures in some patients with TLE (Spencer and Spencer, 1994; Mathern et al., 1995). In addition, some kainic acid (KA)-treated rats showing frequent SRS exhibit no detectable neuronal loss in the hippocampus (Sloviter, 1992; Buckmaster and Dudek, 1997). Numerous dissociations between epileptogenesis and mossy fiber sprouting have been described in the rat kindling and KA preparations of TLE (Elmer et al., 1997; Mohapel et al., 1997, 2000;Armitage et al., 1998; Longo and Mello, 1998, 1999). In the present study we sought to test this hypothesis further, using both the traditional KA preparation of TLE in rats (Ben-Ari, 1985; Fisher, 1989;Sperk, 1994; Hellier et al., 1998) and a novel version of the preparation.
MATERIALS AND METHODS
Animals. Adult male Fischer-344 and Wistar rats weighing 220–250 gm at the time of first treatment were used. The animals were maintained on a 12 hr light/dark cycle with lights on at 8:00 A.M., with ad libitum access to food and water. All procedures were in accordance with the guidelines established by the Canadian Council on Animal Care as approved by the University of Saskatchewan Animal Care Committee.
Animal treatment. This study consists of five experiments. Experiment 1 aimed to establish a new version of the rat KA preparation of TLE with no obvious neuronal loss. In light of the results of our pilot study based on the finding that short episodes of priming seizures inhibit neuronal death induced by KA-elicited epileptic status (Kelly and McIntyre, 1994; Najm et al., 1998), we used four groups of Fischer-344 rats that received different treatments (Table1). To establish the rat traditional KA preparation of TLE (Ben-Ari, 1985; Fisher, 1989; Sperk, 1994; Hellier et al., 1998), the first group (1KA) received a single KA injection (10 mg/kg, i.p.; Sigma, St. Louis, MO), resulting in a single sustained episode of epileptic status lasting >4 hr. To establish a novel version of the KA preparation of TLE, the second group (3KA) received triple KA injections, resulting in two preconditioning or priming episodes and one sustained episode of epileptic status. That is, on the first two consecutive days, rats in this group received injections of KA (10 mg/kg, i.p.), and then epileptic status was terminated after 20 min by injection of sodium pentobarbital (40 mg/kg, i.p.). On the third day we used the same dose of KA to induce epileptic status but allowed it to persist for >6 hr. As a control, the third group (1KAcontrol) received injections of pentobarbital alone on days 1 and 2 and KA on day 3. The final group (0KAcontrol) received one saline injection on each of 3 d. Because most of the neuronal death occurs before day 4 after KA injection (Pollard et al., 1994; Zhang et al., 1997; Hellier et al., 1998; Hopkins et al., 2000), rats (n = 5–7 for each of 1KA, 3KA, 1Kacontrol, and 0KAcontrol groups) were killed 4 d after treatment to examine the number of surviving neurons (Table 2).
Table 1.
Treatment protocols for the four groups of rats (1KA, 3KA, 1KAcontrol, and 0KAcontrol) in experiment 1
| First day | Second day | Third day | |
|---|---|---|---|
| 1KA | KA→epileptic status > 4 hr | ||
| 3KA | KA→epileptic status = 20 min → sodium pentobarbital | KA→epileptic status = 20 min → sodium pentobarbital | KA → epileptic status > 6 hr |
| 1KAcontrol | Sodium pentobarbital | Sodium pentobarbital | KA → epileptic status > 6 hr |
| 0KAcontrol | Saline | Saline | Saline |
For details see Materials and Methods.
Table 2.
Rat strains, treatment, survival times, stain method, and stain purpose in experiments 1–5
| Rat strain | Treatment | Survival time | Stain method | Stain purpose | |
|---|---|---|---|---|---|
| Experiment 1 | Fischer-344 | 1KA, 3KA, 1KAcontrol, 0KAcontrol | 4 d → | Nissl | Surviving neurons |
| Experiment 2 | Fischer-344 | 1KA, 3KA, 0KAcontrol | 1 d → | Silver, Fluoro-Jade B, TUNEL | Dying neurons |
| Experiment 3 | Fischer-344 | 1KA, 3KA, 0KAcontrol | 7 or 14 d → | Silver, Fluoro-Jade B, TUNEL | Dying neurons |
| Experiment 4 | Fischer-344 | 1KA, 3KA, 0KAcontrol | 20 or 12 weeks → | Nissl, somatostatin, Fluoro-Jade B, TUNEL, Timm, M-enkephalin, neuropeptide Y, synaptophysin | Surviving + dying neurons, mossy fiber sprouting |
| Experiment 5 | Wistar | 1KA, 3KA, 0KAcontrol | 20 weeks → | Same as above | Same as above |
| Fischer-344 | 1 Pilo, 2KA-1Pilo |
For details see Materials and Methods.
Experiment 2 aimed to quantify dying neurons in the brain. For this purpose, three groups of Fischer-344 rats (i.e., 1KA, 3KA, and 0KAcontrol) received the same treatment as described in experiment 1. Because the 1KAcontrol group showed no behavioral and morphological differences from the 1KA group (see Results), this group was not included in this or any subsequent experiment. One day after the final injection of KA or saline, rats (n = 5 each) were killed for examination of dying cells (Table 2).
Experiment 3 aimed to study the possibility that triple KA injections might postpone the process of neuronal damage. For this purpose, 1KA, 3KA, and 0KAcontrol groups of Fischer-344 rats received the same treatment as described in experiment 1. Rats were killed 7 or 14 d after the final injection of KA or saline (Table 2), resulting in six groups (n = 5).
Experiment 4 aimed to quantify SRS, neuronal loss, and mossy fiber sprouting in the 1KA and 3KA groups of rats. To quantify the SRS, 1KA, 3KA, and 0KAcontrol groups of Fischer-344 rats (n = 5–7) were observed for evidence of behavioral SRS by an experimenter who was not informed of group assignment, for 2–3 hr daily, Monday through Friday, for 20 weeks after the final injection (Table 2). Because behavioral observation is not capable of detecting nonconvulsive electroencephalograph (EEG) seizures, EEG and behavioral seizures were observed simultaneously in additional rats in experiment 4. Fischer-344 rats were anesthetized with sodium pentobarbital (40 mg/kg, i.p.) and placed in a stereotaxic instrument. Two bipolar depth electrodes were unilaterally implanted into the dorsal hippocampus [anteroposterior (AP), −2.8; mediolateral (ML), ±1.5; dorsoventral (DV), −3.5 from bregma] and the basolateral amygdaloid nucleus (AP, −2.8; ML, ±4.8; DV, −8.5). A reference wire and four screws were anchored to the skull, and the electrodes and screws were cemented to the skull with dental acrylic. Recordings were taken from one pole of each electrode, referenced to ground. After surgery rats were allowed to recover for 2 weeks. Then, two groups of rats, the 1KA and 3KA groups (n = 4–5), were observed for behavioral and EEG seizures for 30–50 min daily, Monday through Friday, for 12 weeks after the final injection of KA. At the end of SRS recording, these five groups of rats were killed for the examination of neuronal loss and mossy fiber sprouting (Table 2).
Experiment 5 aimed to examine SRS, neuronal loss, and mossy fiber sprouting in Wistar rats and in the pilocarpine preparation of TLE (Table 2). Three groups of Wistar rats (i.e., 1KA, 3KA, and 0KAcontrol groups) and two groups of pilocarpine-treated Fischer-344 rats were used. The traditional pilocarpine preparation of TLE was established by applying a single pilocarpine injection in the 1Pilo group, using standard procedures (Parent et al., 1997, 1999). Another group of rats, the 2KA–1Pilo group, received a modified 3KA injection protocol, involving two sessions of daily inductions of KA-elicited priming epileptic status lasting for 20 min and terminated by sodium pentobarbital, 1 d before induction of a third session of pilocarpine-elicited status lasting for 6 hr. We used KA rather than pilocarpine to induce episodes of priming epileptic status because pilot work showed that all rats exhibiting pilocarpine-elicited epileptic status died within 1 hr after a therapeutic dose of sodium pentobarbital. After the final injection, rats were observed for evidence of behavioral SRS by an experimenter who was not informed of group assignment, for 2–3 hr daily for 20 weeks after the final injection (Table 2). Then the three groups of Wistar rats (n = 5–7) and two groups of Fischer-344 rats (n = 5) were killed for examination of neuronal loss and mossy fiber sprouting. Because both the 1Pilo and 2KA–1Pilo groups of Fischer-344 rats together with the rats in experiment 4 were observed for behavioral seizures, the saline group (i.e., 0KAcontrol group) in experiment 4 was also used as the control group for the pilocarpine preparation.
Perfusion of animals. Rats were deeply anesthetized with sodium pentobarbital and perfused transcardially with one of two protocols. Rats in experiments 1, 4, and 5 were perfused first with 150 ml of 0.1 m PBS, pH 7.4, and then with 250 ml of 4% paraformaldehyde (Sigma) in PBS. The brains were then postfixed for 2 hr in the same fixative and immersed in 30% sucrose at 4°C for 2–3 d. Rats in experiments 2 and 3 were perfused first with 150 ml of wash solution consisting of 0.8% sodium chloride, 0.4% dextrose, 0.8% sucrose, 0.023% calcium chloride, and 0.034% sodium cacodylate (Fisher, Nepean, Ontario, Canada) and then with 250 ml of fixation solution consisting of 4% sucrose, 4% paraformaldehyde, and 1.434% sodium cacodylate. After perfusion, carcasses were kept in a fume hood at room temperature overnight, and then the brains were immersed in 30% sucrose at 4°C for 2–3 d.
Histochemistry and immunohistochemistry. Brains were sectioned on a sliding microtome into frontal sections (40 μm), which were then stained with different techniques for different purposes (Table 2). Sections in experiment 1 were stained with cresyl violet, with which the surviving neurons were visualized. For experiments 2 and 3, three stains were used to reveal the degenerating neurons in three series of sections: de Olmos amino-cupric-silver stain (de Olmos et al., 1994), Fluoro-Jade B stain (Schmued et al., 1997; Hopkins et al., 2000), and terminal deoxynucleotidyl transferase-mediated biotinylated UTP nick end labeling (TUNEL) with a TUNEL staining kit according to manufacturer's instructions (Trevigen, Gaithersburg, MD). For experiments 4 and 5, we used four techniques to reveal surviving and dying neurons. In addition to cresyl violet stain, somatostatin immunohistochemistry was used to quantify the live somatostatin-positive neurons in the dentate hilus, the region most sensitive to the destructive effects of epileptic status (Sloviter, 1991; Buckmaster and Dudek, 1997). Fluoro-Jade B and TUNEL stains were used again to detect any dying neurons in the brain. In experiments 4 and 5 we also examined mossy fiber sprouting using the Timm stain (Sloviter, 1991; Buckmaster and Dudek, 1997) and immunohistochemical staining for Met-enkephalin, neuropeptide Y, and synaptophysin (Table2). Timm stain was performed with our routine protocol (Mohapel et al., 1997, 2000; Armitage et al., 1998). Immunohistochemical staining was performed using a conventional avidin–biotin–immunoperoxidase technique as described previously (Zhang et al., 1997, 2001). Briefly, this procedure included incubation of sections at 4°C for 3 d on a shaker in rabbit anti-somatostatin antibody (1:8000; Peninsula Lab, Belmont, CA), rabbit anti-Met-enkephalin antibody (1:2000; DiaSorin Inc., Stillwater, MN), rabbit anti-neuropeptide Y antibody (1:5000; Peninsula Lab), and rabbit anti-synaptophysin antibody [1:500; SP15 (Honer et al., 1997)]. The primary antibodies were localized using Vectastain Elite reagents (Vector Laboratories, Burlingame, CA). The reaction product was developed by incubating the sections in a solution containing diaminobenzidine and H2O2 at room temperature for 2–5 min. The sections were mounted onto slides, which were then air dried, dehydrated, cleared, and coverslipped.
Immunohistochemical controls were performed by omitting primary antibody or by incubating the sections with antiserum preabsorbed with the immunogen. Sections incubated without primary antibody exhibited virtually no staining, and specific staining by somatostatin, M-enkephalin, neuropeptide Y, and synaptophysin antibodies was prevented by preabsorption with specific synthetic antigen (1.0 mg/ml).
Data analysis. Quantitative assessment of cresyl violet-stained sections was conducted by visually counting neurons with normal morphology using a 20× objective lens. Average cell numbers were obtained by averaging counts over two consistent fields in each brain region, over both hemispheres, and over three sections (240 μm apart) in each brain. For cell counting of somatostatin-stained sections, somatostatin-positive cells in both the dorsal and ventral parts of the dentate hilus were counted over both hemispheres and over three sections in each brain. Quantification of silver stain, Fluoro-Jade B stain, and TUNEL stain was conducted by determining the occurrence or disappearance of positive staining in all the brain regions. The degree of mossy fiber sprouting in the dorsal and ventral hippocampus of each rat was first qualitatively compared between different groups, followed by scoring of mossy fiber sprouting in the ventral hippocampus by an observer unaware of group assignment, as follows. The absence of Timm staining and immunohistochemical staining for enkephalin, neuropeptide Y, and synaptophysin in the inner molecular layer was scored as zero, and dense Timm and immunohistochemical staining were scored as 100; intermediate levels were assigned estimated scores in steps of 10.
Three types of behavioral SRS were counted: stage 2 seizures (wet-dog shakes), stage 3 seizures (forelimb clonus), and stages 4 (rearing) and above seizures, according to our six-point scale for assessing the severity of KA-induced limbic seizures (Zhang et al., 1997). Seizure discharge was operationally defined as a synchronous EEG waveform of high frequency and amplitude, typically with biphasic or multiphasic transients, evolving from background activity and lasting for at least 5 sec. Paroxysmal EEG activity (isolated sharp waves, spindle activity, or synchronous high-amplitude bursts lasting <5 sec) was categorized as interictal epileptiform activity.
Statistical analysis of the data was performed using t tests and one-way ANOVA, followed by the Scheffe post hoctest.
RESULTS
Experiment 1: establishment of the 1KA and 3KA preparations in Fischer-344 rats
Acute limbic seizure activity
Ten of 10 rats in the 1KA group and 10 of 10 in the 1KAcontrol group responded to the 10 mg/kg dose of KA with epileptic status lasting between 0.5 and 8 hr, defined as continuous limbic seizures at stages 3–6. Six of 10 rats in the 1KA group and 7 of 10 in the 1KAcontrol group survived epileptic status lasting >4 hr and were used for further studies on neuronal death–survival. The 3KA group also showed 100% (30 of 30) responsiveness to KA on the first day with epileptic status lasting 20 min, followed by sodium pentobarbital anesthesia. In contrast, with the second and third doses of KA injections on the second and third days, rats were significantly (p < 0.001) less sensitive to KA, and only 21 of 30 rats receiving the second dose of KA and 10 of 21 rats receiving the third dose of KA displayed epileptic status. Five of 10 rats showing epileptic status lasting >6 hr after the third dose of KA survived and were used for further studies on neuronal death–survival. The remaining rats showed either a mixture of epileptic status and stereotyped behavior, such as repetitive rapid walking with abnormal gait, or died after exhibiting epileptic status.
In the rats that did respond to KA with acute convulsive activity, the first form of convulsive activity was obviously different between rats receiving the first and second or third dose of KA. That is, the first convulsive activity displayed by the 1KA, 1KAcontrol, and 3KA groups receiving the first dose of KA was wet-dog shakes, followed by forelimb clonus and stage 4–6 seizures. In contrast, the first convulsive activity observed in the 3KA group receiving the second and third doses of KA was stage 3–5 seizures.
The latency from KA injection to the onset of the initial convulsive activity did not differ significantly between the 1KA and 1KAcontrol groups. In the 3KA group, however, the latency to convulsion differed significantly (p < 0.001) between the first KA injection and the second or third KA injection (28.6 ± 5.2, 11.4 ± 3.1, and 9.5 ± 4.4 min, respectively).
Neuronal death
Rats in the 1KA group showed expected neuronal loss in the dentate hilus and CA3 pyramidal cell layer, whereas rats in the 3KA and 0KAcontrol (i.e., saline) groups displayed no obvious neuronal loss (Fig.1A–C). Similar results were observed in the 1KA and 1KAcontrol groups, as well as in other brain regions susceptible to KA-induced epileptic status, including the olfactory tubercle, CA1 pyramidal cell layer, piriform and entorhinal cortices, thalamus, amygdala, and substantia nigra. As shown in Table 3, one-way ANOVA revealed a significant overall difference between the 1KA, 3KA, and saline groups in the mean ± SEM number of neurons in the dentate hilus (F(2,13) = 51.497; p< 0.001), CA3 (F(2,13) = 83.176;p < 0.001) and CA1 pyramidal cell layers (F(2,13) = 19.390; p< 0.001), piriform (F(2,13) = 105.689; p < 0.001) and entorhinal cortices (F(2,13) = 94.730; p< 0.001), mediodorsal thalamic nucleus (F(2,13) = 85.923; p = 0.001), olfactory tubercle (F(2,13) = 52.784; p < 0.001), basolateral amygdaloid nucleus (F(2,13) = 22.211; p< 0.001), and substantia nigra pars compacta (F(2,13) = 25.218; p< 0.001). The Scheffe test showed that for each region, neuronal counts in the 1KA group differed significantly from those in the 3KA and saline groups (p < 0.001), whereas counts in the latter two did not differ significantly (p > 0.05).
Fig. 1.
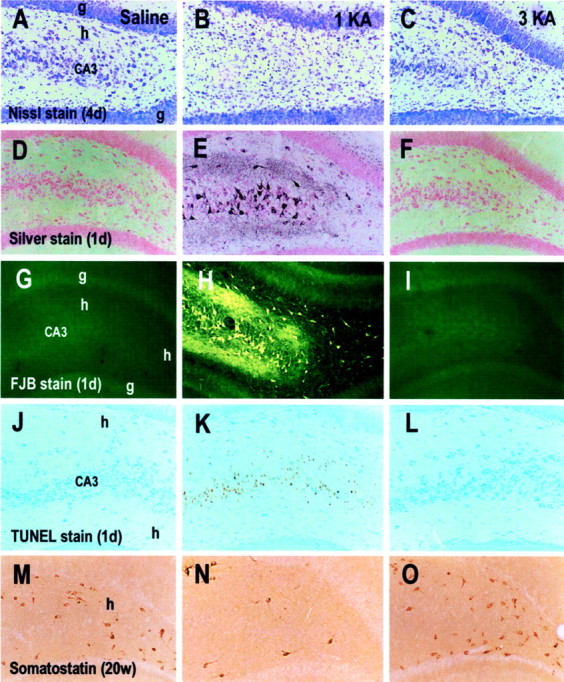
Microphotographs showing cresyl violet (Nissl stain) stain (A–C), silver stain (D–F), Fluoro-Jade B (FJB) stain (G–I), TUNEL stain (J–L), and somatostatin immunohistochemical stain (M–O) in rats treated with saline (A, D, G, J, M), a single KA (1KA) (B, E, H, K, N), and triple KA (3KA) (C, F, I, L, O) injections 4 d (4d) (A–C), 1 d (1d) (D–L), and 20 weeks (20w) (M–O) after the last saline or KA injection. Adjacent sections (D, E, G, J, H, K, orF, I, L) were obtained from the same brains.CA3, CA3 pyramidal cell layer; g, granule cell layer of the dentate gyrus; h, hilus. Magnification: 35× for all microphotographs.
Table 3.
Counts of morphologically normal-appearing neurons in different brain regions after saline, single KA (1KA), and triple KA (3KA) injections
| Saline | 1KA | 3KA | |
|---|---|---|---|
| Dentate hilus | 78.5 ± 3.4 | 41.9 ± 4.0 | 78.2 ± 1.7 |
| CA3 pyramidal cell layer | 178.3 ± 2.5 | 103.2 ± 7.1 | 186.2 ± 3.9 |
| CA1 pyramidal cell layer | 170.0 ± 13.6 | 81.0 ± 11.6 | 182.0 ± 11.9 |
| Piriform cortex | 352.0 ± 14.8 | 111.4 ± 11.4 | 331.7 ± 11.8 |
| Entorhinal cortex | 340.5 ± 20.4 | 84.0 ± 14.6 | 335.4 ± 11.8 |
| Mediodorsal thalamic nucleus | 222.0 ± 14.7 | 28.0 ± 2.9 | 201.0 ± 11.8 |
| Olfactory tubercle | 190.3 ± 14.6 | 50.0 ± 9.0 | 201.0 ± 11.0 |
| Basolateral amygdaloid nucleus | 152.0 ± 13.7 | 41.4 ± 11.4 | 139.0 ± 11.8 |
| Substantia nigra | 160.8 ± 13.2 | 60.8 ± 10.2 | 170.4 ± 11.8 |
Experiment 2: assessment of acute neuronal death in 1KA and 3KA groups of Fischer-344 rats
Consistent with previous studies (Covolant and Mello, 2000;Hopkins et al., 2000), 1 d after a single KA injection numerous brain regions exhibited many silver-impregnated degenerating neurons, including the dentate hilus and CA3 pyramidal cell layer (Fig.1E), claustrum, bed nuclei of the stria terminalis, septum, caudate putamen, deep layers of the cerebral cortex, subiculum, hypothalamus, and all the regions listed in Table 3. However, rats in the 3KA and saline groups showed no detectable silver-impregnated dying neurons in any region, including the dentate hilus and CA3 area (Fig.D, F). Fluoro-Jade B stain produced results consistent with those revealed by de Olmos silver stain (Fig.1G–I). Furthermore, although both the de Olmos silver stain and Fluoro-Jade B stain reveal necrotic neurons (Schmued et al., 1997; Hopkins et al., 2000), the TUNEL stain has the capability to reveal both necrosis and apoptotic neuronal degeneration, and we obtained results with the TUNEL stain (Fig.1J–L) similar to those with the de Olmos silver stain and Fluoro-Jade B stain.
Experiment 3: assessment of delayed neuron death in the 1KA and 3KA groups of Fischer-344 rats
At day 7 but not day 14 after the 1KA, rats showed a small number of silver-impregnated and Fluoro-Jade B- and TUNEL-stained dying neurons scattered over most of the regions that displayed dying neurons 1 d after KA injection. These results are consistent with a recent study using the Fluoro-Jade B stain (Hopkins et al., 2000). In contrast, using the de Olmos silver, Fluoro-Jade B, and TUNEL stains, we found no degenerating neurons throughout the entire brain at 7 and 14 d in rats receiving either 3KA or saline injections (data not shown).
Experiment 4: assessment of SRS, neuronal loss, and mossy fiber sprouting in the 1KA and 3KA groups of Fischer-344 rats
Assessment of behavioral and EEG SRS
The saline group showed significantly fewer wet-dog shakes [presumably stage 2 seizures (Zhang et al., 1997)] than either the 1KA or 3KA group (p < 0.01), whereas the 1KA and 3KA groups displayed similar mean frequencies of both wet-dog shakes and stage 3 seizures (Fig. 2). The saline group was not observed to show stage 3–6 seizures. The mean frequency of stage 4–6 seizures during the first 8 weeks after the final KA injection did not differ significantly in the 1KA and 3KA groups (t(11) = −1.047,p = 0.318). Starting from week 9, however, the 1KA group showed a significantly higher frequency of stage 4–6 seizures (p < 0.01) than the 3KA group (Fig. 2). The latency between sustained epileptic status and the onset of the first observed stage 4–6 seizures in the 1KA (16.1 ± 2.9 d) and 3KA groups (17.2 ± 1.7 d) did not differ significantly.
Fig. 2.
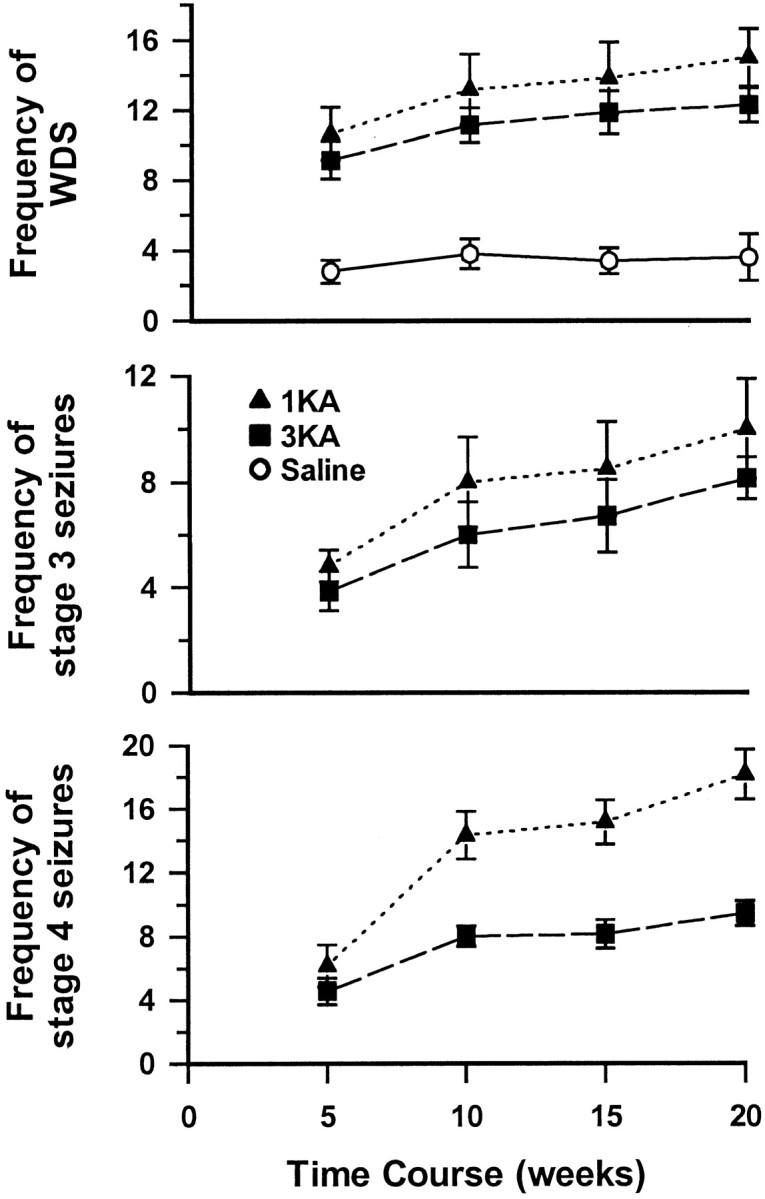
Mean frequency of wet-dog shakes (WDS) (top graph), stage 3 seizures (middle graph), and stages 4–6 seizures (bottom graph) per week over the 20 week period after injection of saline (Saline), a single KA (1KA), or triple KA (3KA). One-way ANOVA for repeated measures revealed that saline-treated rats had significantly fewer wet-dog shakes than either the 1KA or 3KA group (F(2,15) = 21.788;p < 0.001). One-way ANOVA also revealed a significant group effect (F(1,11) = 18.542; p < 0.001) and a significant interaction of groups over time (F(3,11) = 10.69;p < 0.001) when the mean frequencies of stages 4–6 seizures were compared. Rats in all groups were observed for SRS for 2–3 hr daily, Monday through Friday, for 20 weeks.
Epileptiform discharges occurred during approximately half the episodes of wet-dog shakes and all stage 3–6 seizures. Although latencies to onset of EEG seizures in the 1KA (12.4 ± 1.6 d) and 3KA (16.9 ± 1.6 d) groups did not differ significantly, the duration of each EEG seizure over the whole process of seizure development was significantly longer (p < 0.001) in the 1KA group (24.6 ± 1.9 sec) than in the 3KA group (13.5 ± 1.5 sec) (Fig. 3). The difference in the mean frequency of EEG seizures between these two groups was not statistically significant (p = 0.091; 5.5 ± 1.2 and 2.9 ± 0.8 episodes per week for the 1KA and 3KA groups, respectively) in the first 8 weeks after KA injection, but in the later course a significantly higher frequency of EEG seizures (p < 0.05) appeared in the 1KA group (9.8 ± 1.2 episodes per week) than in the 3KA group (5.8 ± 0.8 episodes per week).
Fig. 3.

Typical EEG seizures associated with behavioral stage 5 convulsions recorded from a triple KA-treated rat on the 57th day after the final KA injection. The top trace was recorded from the dorsal hippocampus, and thebottom trace was recorded from the amygdala. Before the occurrence of generalized EEG and behavioral seizures, isolated EEG seizures were recorded sporadically. The characteristics of EEG seizures recorded from the single KA-treated rats were similar to this figure, except that individual episodes of EEG seizures recorded from the single KA-treated rats were significantly longer in duration.
Assessment of neuronal loss and mossy fiber sprouting
Similar to findings in the rats killed 4 d after KA injection (Table 3), the 1KA group killed 20 weeks after KA injection showed massive neuronal loss in various regions, whereas the saline and 3KA groups displayed no significant neuronal loss in Nissl-stained sections. The mean number of somatostatin-positive cells in the dentate hilus of the 1KA group (17 ± 3.8) differed significantly (p < 0.001) from either the saline (70 ± 6.6) or 3KA groups (57.8 ± 5.8), whereas the latter two groups did not differ significantly (Fig. 1M–O). No degenerating neurons were found in the brains of the 1KA, 3KA, and saline groups with Fluoro-Jade B and TUNEL stains.
Consistent with previous studies (Sloviter, 1991; Lurton et al., 1996;Bing et al., 1997; Buckmaster and Dudek, 1997; El Bahh et al., 1997), both the Timm stain and immunohistochemistry for M-enkephalin, neuropeptide Y, and synaptophysin revealed massive mossy fiber sprouting in the inner molecular layer of the dentate gyrus in both the dorsal and ventral hippocampus of the 1KA group (Fig.4). In contrast, the saline and 3KA groups exhibited no detectable mossy fiber sprouting in the dorsal hippocampus (Fig. 4) and a minimal level of mossy fiber sprouting in the ventral hippocampus.
Fig. 4.
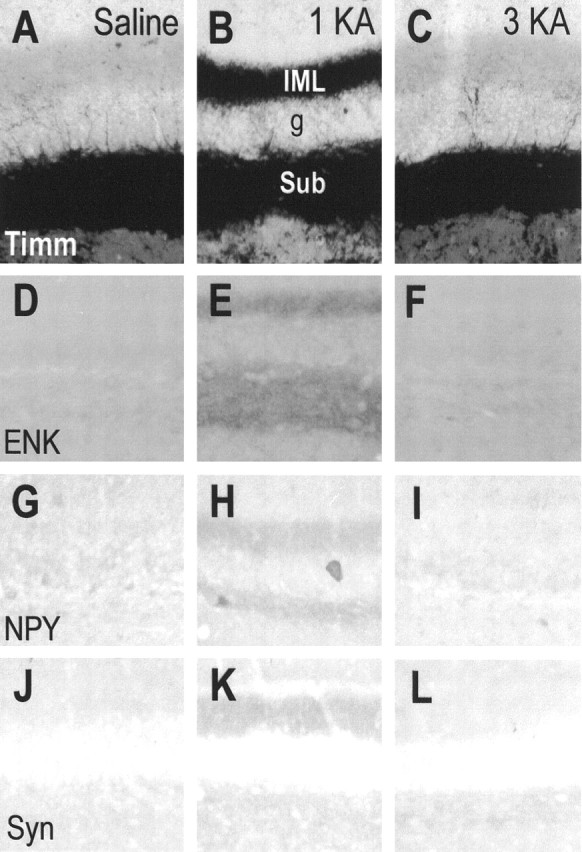
Microphotographs showing Timm stain (Timm) (A–C) and immunohistochemical stain for enkephalin (ENK) (D–F), neuropeptide Y (NPY) (G–I), and synaptophysin (Syn) (J–L) in rats receiving injections of saline (A, D, G, J), a single KA (1KA) (B, E, H, K), or triple KA (3KA) (C, F, I, L) 20 weeks after the last saline or KA injection. Adjacent sections (A, B, D, E, G, H, K, J, and C, F, I, L) were obtained from the same brains. g, Granule cell layer of the dentate gyrus; IML, inner molecular layer of the dentate gyrus; sub, subgranule layer of the dentate gyrus. Magnification: 70× for all microphotographs.
Experiment 5: assessment of SRS, neuronal loss, and mossy fiber sprouting in KA-treated Wistar rats and pilocarpine-treated Fischer-344 rats
Assessment of behavioral seizures
Unlike Fischer-344 rats that showed 100% responsiveness to the first dose of KA, Wistar rats showed 72% (36 of 50) responsiveness to the first dose of KA, consistent with our previous observations (Zhang et al., 1997). Eighteen of 36 Wistar rats that responded to KA survived epileptic status lasting >4 hr. After the second and third doses of KA injections, ∼28% of the Wistar rats (5 of 18) showed typical epileptic status lasting >6 hr. Although Wistar rats displayed significantly lower sensitivity to KA than Fischer-344 rats did (p < 0.01), these two strains of rats exhibited similar acute limbic seizure activities, including the first form of convulsive activity after the first, second, or third KA injection and the behavioral seizure starting dates in both the 1KA and 3KA groups.
Rats in the 1Pilo group displayed acute behavioral seizures similar to those in the 1KA group. The 2KA–1Pilo group exhibited 75% (9 of 12) responsiveness to pilocarpine after the second injection of KA, and 50% (6 of 12) of the rats that responded to pilocarpine survived epileptic status lasting >6 hr.
Saline-treated Wistar rats did not show stage 4–6 seizures. KA-treated Wistar rats (Fig. 5A) and pilocarpine-treated Fischer-344 rats (Fig.6A) exhibited behavioral SRS with a frequency similar to that of KA-treated Fischer-344 rats (Fig. 2). That is, the mean frequency of stage 4–6 seizures in the first 8 weeks after sustained epileptic status did not differ significantly between the 1KA and 3KA groups of Wistar rats (t(6) = −1.441;p = 0.200) or between the 1Pilo and 2KA–1Pilo groups of Fischer-344 rats (t(6) = −1.782; p = 0.125). After the first 8 weeks, however, the 1KA and 1Pilo groups showed a significantly higher frequency of stage 4–6 seizures (p < 0.01) than the 3KA and 2KA–1Pilo groups (Figs. 5A, 6A). The starting dates of stage 4–6 seizures in the 1KA (15.3 ± 2.1 d) and 3KA groups (17.1 ± 1.8 d) of Wistar rats and in the 1Pilo (16.8 ± 2.7 d) and 2KA–1Pilo groups (15.2 ± 2.6 d) did not differ significantly.
Fig. 5.
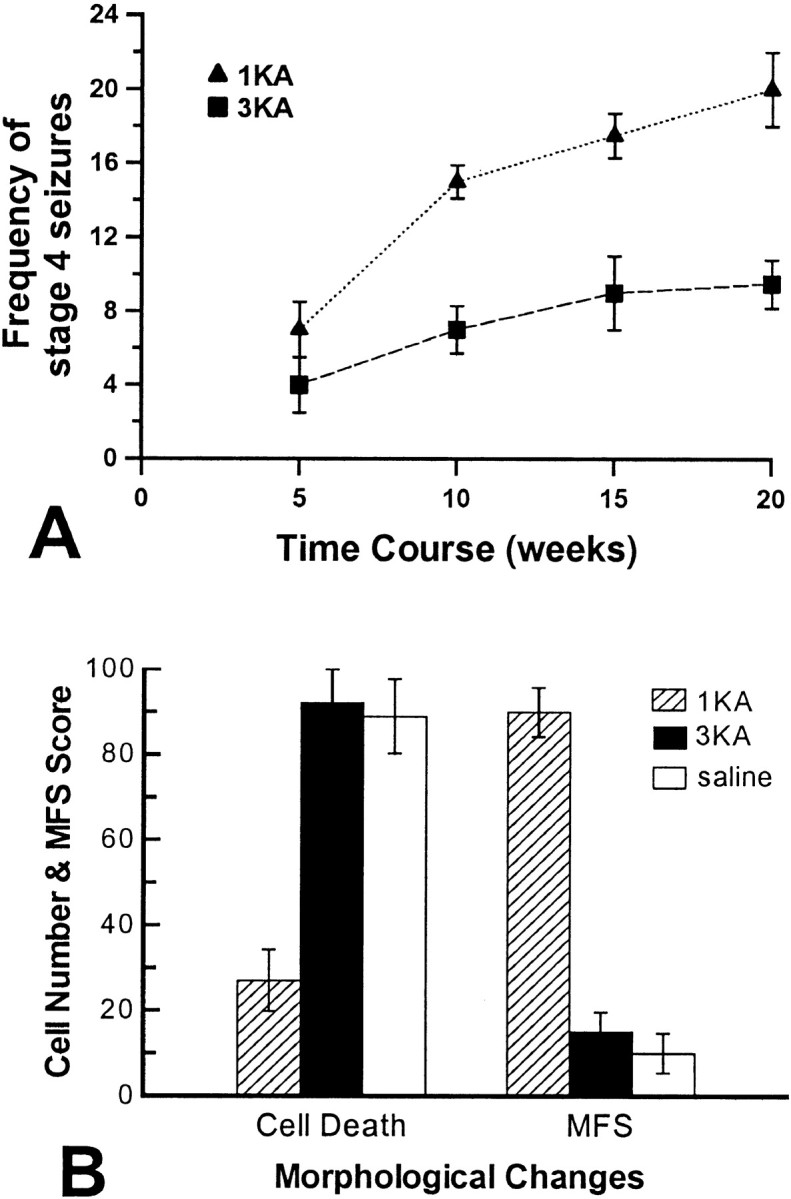
A, Mean frequency of stages 4–6 seizures per week over the 20 week period after a single KA (1KA) and triple KA (3KA) injections in Wistar rats. Starting from week 9, there were a significant group effect (F(1,6) = 13.846;p < 0.05) and a significant interaction of groups over time (F(1,6) = 14.640;p < 0.001) in the frequency of stages 4–6 seizures between 1KA and 3KA groups. B, Neuronal loss and mossy fiber sprouting (MFS) in Wistar rats receiving 1KA, 3KA, and saline injections. Neuronal loss was quantified by counting the total number of somatostatin-immunoreactive neurons in the hippocampal dentate hilus, and mossy fiber sprouting was scored in the ventral hippocampus in Timm-stained sections.
Fig. 6.

A, Mean frequency of stages 4–6 seizures per week over the 20 week period after a single pilocarpine injection (1Pilo) and two KA plus one pilocarpine injections (2KA–1Pilo) in Fischer-344 rats. Starting from week 9, there were a significant group effect (F(1,6) = 17.229; p< 0.05) and a significant interaction of groups over time (F(3,6) = 28.806; p< 0.001) in the frequency of stages 4–6 seizures between 1Pilo and 2KA–1Pilo groups. B, Neuronal loss and mossy fiber sprouting (MFS) in Fischer-344 rats receiving 1Pilo, 2KA–1Pilo, and saline injections in Fischer-344 rats. Neuronal loss and mossy fiber sprouting were quantified using the same protocols as those in Figure 5.
Assessment of neuronal loss and mossy fiber sprouting
KA-treated Wistar rats and pilocarpine-treated Fischer-344 rats showed pathological alterations similar to those of the KA-treated Fischer-344 rats. That is, the 1KA group of Wistar rats and the 1Pilo group showed massive neuronal loss in various regions, whereas the saline and 3KA groups of Wistar rats and the 2KA–1Pilo group showed no significant neuronal loss in the same regions in Nissl-stained sections. The number of somatostatin-positive cells in the dentate hilus was significantly lower in the 1KA group than in the 3KA group of Wistar rats (F(2,9) = 21.683;p < 0.001) (Fig. 5B) as well as in the 1Pilo group than in the 2KA–1Pilo group (F(2,9) = 11.721; p < 0.05) (Fig. 6B). However, there was no significant difference between the saline and 3KA groups of Wistar rats (Fig.5B) or the 2KA–1Pilo group (Fig. 6B). KA-treated Wistar rats and pilocarpine-treated Fischer-344 rats did not show dying neurons in either Fluoro-Jade B- or TUNEL-stained sections. Timm-stained mossy fiber sprouting in the ventral hippocampus was significantly higher in the 1KA group than in the 3KA group of Wistar rats (F(2,9) = 80.333;p < 0.001) (Fig. 5B) as well as in the 1Pilo group than in the 2KA–1Pilo group (F(2,9) = 30.662; p < 0.001) (Fig. 6B). The saline group, the 3KA group of Wistar rats, and the 2KA–1Pilo group similarly exhibited low mossy fiber sprouting scores in the ventral hippocampus (Figs. 5B,6B). Similar results were also obtained in immunohistochemical staining for enkephalin, neuropeptide Y, and synaptophysin (data not shown).
DISCUSSION
Roles of neuronal loss and mossy fiber sprouting in the genesis and development of TLE
Experiment 1 indicated that neuronal degeneration can be detected with Nissl stain in many regions 4 d after a single KA injection and that neither saline nor triple KA injections produced obvious neuronal loss. However, it is possible that results in the 3KA group could reflect an inability of Nissl stain to detect the loss of a small number of neurons in regions containing a large number of healthy neurons; it is also possible that certain regions with significant neuronal loss in the 3KA group were missed, because we did not count neurons in all regions in Nissl-stained sections. We suggest that these explanations are unlikely, because using the very sensitive de Olmos silver stain we failed to detect dying neurons in the whole brain of the 3KA group 1 d after the final KA injection, whereas the 1KA group showed numerous silver-impregnated degenerating neurons in many regions 1 d after KA. Although the de Olmos silver stain has been unreliable in some laboratories, the results obtained with the de Olmos silver stain were replicated by staining, on adjacent sections from the same rats, with Fluoro-Jade B, a sensitive and reliable marker for degenerating neurons after KA-induced epileptic status or other types of brain insults (Schmued et al., 1997; Hopkins et al., 2000). Furthermore, similar results were obtained with TUNEL staining, which has been used widely to detect apoptotic-like neuronal death after epileptic status (Pollard et al., 1994; Morrison et al., 1996; Roux et al., 1999; Tuunanen et al., 1999).
It could be argued that the triple KA injections merely postponed the process of neuronal degeneration. We suggest that this is unlikely, however, because experiments 3 and 4 showed that the silver, Fluoro-Jade B, and TUNEL stains failed to reveal dying neurons in the 3KA group 7 and 14 d and 20 weeks after the final KA injection, although the 1KA group did show a small number of dying neurons in many regions 7 d after KA.
In contrast to the 1KA group, which exhibited massive mossy fiber sprouting in the hippocampus 20 weeks after KA, the saline and 3KA groups showed no detectable mossy fiber sprouting in the dorsal hippocampus and a minimal level of mossy fiber sprouting in the ventral hippocampus. Although it is possible that the triple KA injections could have induced sprouting of mossy fibers that do not contain zinc and thus would not be detected by Timm staining, this seems unlikely in the absence of mossy fiber sprouting detectable with immunohistochemistry for M-enkephalin and neuropeptide Y as well as for synaptophysin, a synaptic vesicle protein that exists in all axon terminals and is widely used as a marker for synaptogenesis (Looney et al., 1999; Sarnart and Born, 1999).
Although the 1KA and 3KA groups exhibited massive and undetectable neuronal loss and mossy fiber sprouting, respectively, they exhibited similar SRS starting dates and frequencies early in the process of seizure development. These results therefore suggest that there is no simple relation between hippocampal neuronal loss–mossy fiber sprouting and the genesis of TLE. However, we also found evidence consistent with the prominent hypothesis that hippocampal neuronal loss and mossy fiber sprouting play a critical role in the progression of TLE (for review, see Lothman and Bertram, 1993; Engel, 1996;Lowenstein, 1996; Wasterlain et al., 1996; Coulter, 1999; Houser, 1999;Ben-Ari and Cossart, 2000). In comparison with the 3KA group, the 1KA group displayed massive neuronal loss and mossy fiber sprouting as well as significantly prolonged episodes of seizures over the whole process of seizure development and more frequent severe seizures (i.e., stages 4–6) later in the process.
Two reservations about our results should be considered. First, because these data were obtained from Fischer-344 rats only, they may be strain specific, given that different strains of rats exhibit different neurotoxicity or severity of behavioral seizures in response to KA (Sanberg et al., 1979; Golden et al., 1991, 1995) and that the degree of KA-induced mossy fiber sprouting is significantly different among different strains of rats (Xu and Racine, 1999). Second, the results may be preparation specific, because they were obtained with the KA preparation, which has been claimed by some researchers to be inferior to the pilocarpine preparation. It has been suggested that in contrast to the KA preparation in which SRS automatically disappears several months after the occurrence of the first episode of SRS, both the pilocarpine preparation and patients with TLE exhibit a similar life-long occurrence of SRS, if not treated (Cavalheiro et al., 1982,1991). Nevertheless, these two possibilities seem unlikely, because in experiment 5 we observed that the 1KA and 3KA Wistar rats and the 1Pilo and 2KA–1Pilo Fischer-344 rats showed results similar to those of the 1KA and 3KA Fischer-344 rats.
Dissociations between the genesis of TLE and neuronal loss or mossy fiber sprouting have been reported in both humans and animals, but the results were inconclusive. Thus, although it has been observed that SRS in some patients with TLE were successfully controlled by partial removal of hippocampal tissue that exhibited no neuronal loss (Spencer and Spencer, 1994; Mathern et al., 1995), removal of hippocampal tissue might disrupt the critical neuronal pathways responsible for epileptogenesis induced by neuronal loss in other parts of the hippocampus or other regions of brain. Although some KA-treated rats with evidence of frequent SRS exhibited no neuronal loss in the hippocampus (Sloviter, 1992; Buckmaster and Dudek, 1997), SRS in these rats could have been generated in other regions of brain exhibiting neuronal loss, because a single KA-induced sustained epileptic status results in massive neuronal death in the hippocampus and other regions of brain (Ben-Ari, 1985; Sperk, 1994; Covolant and Mello, 2000; Hopkins et al., 2000). In separate experiments, we and others have been able to dissociate mossy fiber sprouting from the kindling of limbic seizures (Elmer et al., 1997; Mohapel et al., 1997, 2000; Armitage et al., 1998), although kindling typically does not evoke SRS, the hallmark of TLE. Other researchers have shown that blockade of mossy fiber sprouting by the protein synthesis inhibitor cyclohexamide does not affect the occurrence of SRS in the rat KA and pilocarpine preparations of TLE (Longo and Mello, 1998, 1999), but this finding is controversial (Williams et al., 2000).
In summary, we found that triple KA injections produced two priming episodes and one sustained episode of epileptic status associated with undetectable neuronal loss or mossy fiber sprouting. We also observed that after sustained epileptic status induced by either KA or pilocarpine, Fischer-344 and Wistar rats with and without detectable neuronal loss and mossy fiber sprouting exhibited similar SRS starting dates and frequencies early in the seizure development process, whereas the rats with massive neuronal loss and mossy fiber sprouting displayed significantly prolonged episodes of chronic seizures over the whole process of seizure development and more frequent severe seizures later in the process. There are two implications of these results. First, neuronal loss and mossy fiber sprouting do not relate in any obvious way to the genesis of TLE. However, we note that results are indeed correlational and do not provide direct evidence conclusively establishing or refuting a causal role for neuronal loss and mossy fiber sprouting in the genesis of TLE. Hence it remains possible that neuronal loss and mossy fiber sprouting are two mechanisms among many—such as neurogenesis (Parent et al., 1997; Nakagawa et al., 2000), changes in the balance of excitatory and inhibitory processes (Ben-Ari and Cossart, 2000; de Curtis and Avanzini, 2001; Gorter et al., 2001), or alterations in release or postsynaptic effects of neurotransmitters (Rogawski and Donevan, 1999;Reibel et al., 2000; Takahashi et al., 2000; Sanchez et al., 2001)—that underlie the genesis of TLE. Nevertheless, the 3KA preparation of TLE established in the present study provides a powerful new strategy for investigating mechanisms other than neuronal loss and mossy fiber sprouting, because the 3KA preparation is associated with undetectable neuronal loss and mossy fiber sprouting. Second, neuronal loss, mossy fiber sprouting, or both might play an important role in the prolongation of seizures throughout the process of chronic seizure development as well as in the escalation of mild seizures into severe seizures later in the process. Indeed, other recent findings suggest that both neuronal loss and mossy fiber sprouting play a role in the intensification of chronic seizure development: rats displaying extensive neuronal loss and mossy fiber sprouting bilaterally in the hippocampus experienced increasing frequency of SRS (Gorter et al., 2001).
Plausible mechanism underlying priming seizure-induced protection of neurons against severe epileptic status
It is known that priming or preconditioning of the brain and heart with mild hypoxic–ischemic insults can protect neurons and muscle against subsequent severe ischemic attacks, and a common mechanism probably underlies priming hypoxia-induced protection of both neurons and muscles against severe ischemic attacks (for review, see Abbracchio and Cattabeni, 1999; Rubino and Yellon, 2000). The same mechanism may also underlie priming seizure-induced protection of neurons against sustained epileptic status, because mild priming ischemia and KA-elicited mild priming seizures mutually inhibit neuronal death associated with KA-induced sustained epileptic status and severe ischemic attacks, respectively (Plamondon et al., 1999).
Footnotes
This work was supported by Canadian Institutes of Health Research grants awarded to X.Z., W.G.H, and M.E.C., an establishment grant from Health Services Utilization and Research Commission (HSURC) of Saskatchewan to X.Z., and a postdoctoral fellowship from HSURC to S.S.C. We thank Yan Li for excellent technical assistance.
Correspondence should be addressed to Dr. Xia Zhang or Dr. Michael E. Corcoran, Neuropsychiatry Research Unit, Department of Psychiatry, University of Saskatchewan, A114 Medical Research Building, 103 Wiggins Road, Saskatoon, SK, Canada S7N 5E4. E-mail: zhangxia@duke.usask.ca ormichael.corcoran@usask.ca.
REFERENCES
- 1.Abbracchio MP, Cattabeni F. Brain adenosine receptors as targets for therapeutic intervention in neurodegenerative diseases. Ann NY Acad Sci. 1999;890:79–92. doi: 10.1111/j.1749-6632.1999.tb07983.x. [DOI] [PubMed] [Google Scholar]
- 2.Armitage LL, Mohapel P, Jenkins EM, Hannesson DK, Corcoran ME. Dissociation between mossy fiber sprouting and rapid kindling with low-frequency stimulation of the amygdala. Brain Res. 1998;781:37–44. doi: 10.1016/s0006-8993(97)01218-3. [DOI] [PubMed] [Google Scholar]
- 3.Babb TL, Brown WJ, Pretorius J, Davenport C, Lieb JP, Crandall PH. Temporal lobe volumetric cell densities in temporal lobe epilepsy. Epilepsia. 1990;25:729–740. doi: 10.1111/j.1528-1157.1984.tb03484.x. [DOI] [PubMed] [Google Scholar]
- 4.Babb TL, Kupfer WR, Pretorius JK, Crandall PH, Levesque MF. Synaptic reorganization by mossy fibers in human epileptic fascia dentata. Neuroscience. 1991;42:351–363. doi: 10.1016/0306-4522(91)90380-7. [DOI] [PubMed] [Google Scholar]
- 5.Ben-Ari Y. Limbic seizure and brain damage produced by kainic acid: mechanisms and relevance to human temporal lobe epilepsy. Neuroscience. 1985;14:375–403. doi: 10.1016/0306-4522(85)90299-4. [DOI] [PubMed] [Google Scholar]
- 6.Ben-Ari Y, Cossart R. Kainate, a double agent that generates seizures: two decades of progress. Trends Neurosci. 2000;23:580–587. doi: 10.1016/s0166-2236(00)01659-3. [DOI] [PubMed] [Google Scholar]
- 7.Bing G, Wilson B, Hudson P, Jin L, Feng Z, Zhang W, Bing R, Hong JS. A single dose of kainic acid elevates the levels of enkephalins and activator protein-1 transcription factors in the hippocampus for up to 1 year. Proc Natl Acad Sci USA. 1997;94:9422–9427. doi: 10.1073/pnas.94.17.9422. [DOI] [PMC free article] [PubMed] [Google Scholar]
- 8.Brown WJ, Babb TL. Neuropathological changes in temporal lobe associated with complex partial seizures. In: Hopkins A, editor. Epilepsy. Chapman and Hall; London: 1987. pp. 300–416. [Google Scholar]
- 9.Bruton CJ. The neuropathology of temporal lobe epilepsy. Oxford UP; London: 1988. [Google Scholar]
- 10.Buckmaster PS, Dudek FE. Neuronal loss, granule cell axon reorganization, and functional changes in the dentate gyrus of epileptic kainate-treated rats. J Comp Neurol. 1997;385:385–404. [PubMed] [Google Scholar]
- 11.Cavalheiro EA, Riche DA, Le Gal La Salle G. Long-term effects of intrahippocampal kainic acid injection in rats: a method for inducing spontaneous recurrent seizures. Electroencephalogr Clin Neurophysiol. 1982;53:581–589. doi: 10.1016/0013-4694(82)90134-1. [DOI] [PubMed] [Google Scholar]
- 12.Cavalheiro EA, Leite JP, Bortolotto ZA, Turski WA, Ikonomidou C, Turski L. Long-term effects of pilocarpine in rats: structural damage of the brain triggers kindling and spontaneous recurrent seizures. Epilepsia. 1991;32:778–782. doi: 10.1111/j.1528-1157.1991.tb05533.x. [DOI] [PubMed] [Google Scholar]
- 13.Coulter DA. Chronic epileptogenic cellular alterations in the limbic system after status epilepticus. Epilepsia. 1999;40[Suppl 1]:S23–33. doi: 10.1111/j.1528-1157.1999.tb00875.x. [DOI] [PubMed] [Google Scholar]
- 14.Covolant L, Mello LE. Temporal profile of neuronal injury following pilocarpine or kainic acid-induced status epilepticus. Epilepsy Res. 2000;39:133–152. doi: 10.1016/s0920-1211(99)00119-9. [DOI] [PubMed] [Google Scholar]
- 15.Cronin J, Obenaus A, Houser CR, Dudek FE. Electrophysiology of dentate granule cells after kainate-induced synaptic reorganization of mossy fibers. Brain Res. 1992;573:305–310. doi: 10.1016/0006-8993(92)90777-7. [DOI] [PubMed] [Google Scholar]
- 16.de Curtis M, Avanzini G. Interictal spikes in focal epileptogenesis. Prog Neurobiol. 2001;63:541–567. doi: 10.1016/s0301-0082(00)00026-5. [DOI] [PubMed] [Google Scholar]
- 17.de Olmos JS, Beltramino CA, de Olmos de Lorenzo S. Use of an amino-cupric-silver technique for the detection of early and semiacute neuronal degeneration caused by neurotoxicants, hypoxia, and physical trauma. Neurotoxicol Teratol. 1994;16:545–561. doi: 10.1016/0892-0362(94)90033-7. [DOI] [PubMed] [Google Scholar]
- 18.El Bahh B, Lurton D, Sundstrom LE, Rougier A. Induction of tolerance and mossy fibre neuropeptide-Y expression in the contralateral hippocampus following a unilateral intrahippocampal kainic acid injection in the rat. Neurosci Lett. 1997;227:135–139. doi: 10.1016/s0304-3940(97)00261-9. [DOI] [PubMed] [Google Scholar]
- 19.Elmer E, Kokaia Z, Kokaia M, Lindvall O, McIntyre DC. Mossy fibre sprouting: evidence against a facilitatory role in epileptogenesis. NeuroReport. 1997;8:1193–1196. doi: 10.1097/00001756-199703240-00027. [DOI] [PubMed] [Google Scholar]
- 20.Engel J., Jr . Surgical treatment of the epilepsies. Raven; New York: 1987. [Google Scholar]
- 21.Engel J., Jr . Seizures and epilepsy. F. A. Davis; Philadelphia: 1989. [Google Scholar]
- 22.Engel J., Jr Clinical evidence for the progressive nature of epilepsy. Epilepsy Res [Suppl] 1989;12:9–20. [PubMed] [Google Scholar]
- 23.Fisher RS. Animal models of the epilepsies. Brain Res Rev. 1989;14:245–278. doi: 10.1016/0165-0173(89)90003-9. [DOI] [PubMed] [Google Scholar]
- 24.Flaconer MA, Serafetinides EA. A follow-up study of surgery in temporal lobe epilepsy. J Neurosurg Psychiatry. 1963;26:154–165. doi: 10.1136/jnnp.26.2.154. [DOI] [PMC free article] [PubMed] [Google Scholar]
- 25.Golden GT, Smith GG, Ferraro TN, Reyes PF, Kulp JK, Fariello RG. Strain differences in convulsive response to the excitotoxin kainic acid. NeuroReport. 1991;2:141–144. doi: 10.1097/00001756-199103000-00008. [DOI] [PubMed] [Google Scholar]
- 26.Golden GT, Smith GG, Ferraro TN, Reyes PF. Rat strain and age differences in kainic acid induced seizures. Epilepsy Res. 1995;20:151–159. doi: 10.1016/0920-1211(94)00079-c. [DOI] [PubMed] [Google Scholar]
- 27.Gorter JA, van Vliet EA, Aronica E, Lopes da Silva FH. Progression of spontaneous seizures after status epilepticus is associated with mossy fiber sprouting and extensive bilateral loss of hilar parvalbumin and somatostatin-immunoreactive neurons. Eur J Neurosci. 2001;13:657–669. doi: 10.1046/j.1460-9568.2001.01428.x. [DOI] [PubMed] [Google Scholar]
- 28.Hellier JL, Patrylo PR, Buckmaster PS, Dudek FE. Recurrent spontaneous motor seizures after repeated low-dose systemic treatment with kainate: assessment of a rat model of temporal lobe epilepsy. Epilepsy Res. 1998;31:73–84. doi: 10.1016/s0920-1211(98)00017-5. [DOI] [PubMed] [Google Scholar]
- 29.Honer WG, Falkai P, Young C, Wang T, Xie J, Bonner J, Hu L, Boulianne GL, Luo Z, Trimble WS. Cingulate cortex synaptic terminal proteins and neural cell adhesion molecule in schizophrenia. Neuroscience. 1997;78:99–110. doi: 10.1016/s0306-4522(96)00489-7. [DOI] [PubMed] [Google Scholar]
- 30.Hopkins KJ, Wang G, Schmued LC. Temporal progression of kainic acid induced neuronal and myelin degeneration in the rat forebrain. Brain Res. 2000;864:69–80. doi: 10.1016/s0006-8993(00)02137-5. [DOI] [PubMed] [Google Scholar]
- 31.Houser CR. Neuronal loss and synaptic reorganization in temporal lobe epilepsy. Adv Neurol. 1999;79:743–761. [PubMed] [Google Scholar]
- 32.Houser CR, Miyashiro JE, Swartz BE, Walsh GO, Rich JR, Delgado-Escueta AV. Altered patterns of dynorphin immunoreactivity suggest mossy fiber reorganization in human hippocampal epilepsy. J Neurosci. 1990;10:267–282. doi: 10.1523/JNEUROSCI.10-01-00267.1990. [DOI] [PMC free article] [PubMed] [Google Scholar]
- 33.Isokawa M, Levesque MF, Babb TL, Engel J. Single mossy fiber axonal systems of human dentate granule cells studied in hippocampal slices from patients with temporal lobe epilepsy. J Neurosci. 1993;13:1511–1522. doi: 10.1523/JNEUROSCI.13-04-01511.1993. [DOI] [PMC free article] [PubMed] [Google Scholar]
- 34.Kelly ME, McIntyre DC. Hippocampal kindling protects several structures from the neuronal damage resulting from kainic acid-induced status epilepticus. Brain Res. 1994;634:245–256. doi: 10.1016/0006-8993(94)91927-5. [DOI] [PubMed] [Google Scholar]
- 35.King DW, Flanigin HF, Gallagher BB, So EL, Murvin AJ, Smith DB, Oommen KJ, Feldman DS, Power J. Temporal lobectomy for partial complex seizures: evaluation, results, and 1-year follow-up. Neurology. 1986;36:334–339. doi: 10.1212/wnl.36.3.334. [DOI] [PubMed] [Google Scholar]
- 36.Longo BM, Mello LE. Supragranular mossy fiber sprouting is not necessary for spontaneous seizures in the intrahippocampal kainate model of epilepsy in the rat. Epilepsy Res. 1998;32:172–182. doi: 10.1016/s0920-1211(98)00049-7. [DOI] [PubMed] [Google Scholar]
- 37.Longo BM, Mello LE. Effect of long-term spontaneous recurrent seizures or reinduction of status epilepticus on the development of supragranular mossy fiber sprouting. Epilepsy Res. 1999;36:233–241. doi: 10.1016/s0920-1211(99)00054-6. [DOI] [PubMed] [Google Scholar]
- 38.Looney MR, Dohan FC, Jr, Davies KG, Seidenberg M, Hermann BP, Schweitzer JB. Synaptophysin immunoreactivity in temporal lobe epilepsy-associated hippocampal sclerosis. Acta Neuropathol (Berl) 1999;98:179–185. doi: 10.1007/s004010051067. [DOI] [PubMed] [Google Scholar]
- 39.Lothman EW, Bertram EH., III Epileptogenic effects of status epilepticus. Epilepsia. 1993;34[Suppl 1]:S59–70. doi: 10.1111/j.1528-1157.1993.tb05907.x. [DOI] [PubMed] [Google Scholar]
- 40.Lowenstein DH. Recent advances related to basic mechanisms of epileptogenesis. Epilepsy Res [Suppl] 1996;11:45–60. [PubMed] [Google Scholar]
- 41.Lurton D, Coussemacq M, Barrow P, Sundstrom LE, Rougier A. Widespread ectopic neuropeptide-Y immunoreactivity in contralateral mossy fibres after a unilateral intrahippocampal kainic acid injection in the rat. Neurosci Lett. 1996;213:181–184. doi: 10.1016/0304-3940(96)12854-8. [DOI] [PubMed] [Google Scholar]
- 42.Lynch M, Sutula T. Recurrent excitatory connectivity in the dentate gyrus of kindled and kainic acid-treated rats. J Neurophysiol. 2000;83:693–704. doi: 10.1152/jn.2000.83.2.693. [DOI] [PubMed] [Google Scholar]
- 43.Mathern GW, Pretorius JK, Babb TL. Quantified patterns of mossy fiber sprouting and neuron densities in hippocampal and lesioned seizures. J Neurosurg. 1995;82:211–219. doi: 10.3171/jns.1995.82.2.0211. [DOI] [PubMed] [Google Scholar]
- 44.Mohapel P, Armitage LL, Hannesson DK, Corcoran ME. The effects of fimbria/fornix transections on perforant path kindling and mossy fiber sprouting. Brain Res. 1997;778:186–193. doi: 10.1016/s0006-8993(97)01079-2. [DOI] [PubMed] [Google Scholar]
- 45.Mohapel P, Armitage LL, Gilbert TH, Hannesson DK, Teskey GC, Corcoran ME. Mossy fiber sprouting is dissociated from kindling of generalized seizures in the guinea-pig. NeuroReport. 2000;11:2897–2901. doi: 10.1097/00001756-200009110-00014. [DOI] [PubMed] [Google Scholar]
- 46.Morrison RS, Wenzel HJ, Kinoshita Y, Robbins CA, Donehower LA, Schwartzkroin PA. Loss of the p53 tumor suppressor gene protects neurons from kainate-induced cell death. J Neurosci. 1996;16:1337–1345. doi: 10.1523/JNEUROSCI.16-04-01337.1996. [DOI] [PMC free article] [PubMed] [Google Scholar]
- 47.Najm IM, Hadam J, Ckakraverty D, Mikuni N, Penrod C, Sopa C, Markarian G, Luders HO, Babb T, Baudry M. A short episode of seizure activity protects from status epilepticus-induced neuronal damage in rat brain. Brain Res. 1998;810:72–75. doi: 10.1016/s0006-8993(98)00886-5. [DOI] [PubMed] [Google Scholar]
- 48.Nakagawa E, Aimi Y, Yasuhara O, Tooyama I, Shimada M, McGeer PL, Kimura H. Enhancement of progenitor cell division in the dentate gyrus triggered by initial limbic seizures in rat models of epilepsy. Epilepsia. 2000;41:10–18. doi: 10.1111/j.1528-1157.2000.tb01498.x. [DOI] [PubMed] [Google Scholar]
- 49.Parent JM, Yu TW, Leibowitz RT, Geschwind DH, Sloviter RS, Lowenstein DH. Dentate granule cell neurogenesis is increased by seizures and contributes to aberrant network reorganization in the adult rat hippocampus. J Neurosci. 1997;17:3727–3738. doi: 10.1523/JNEUROSCI.17-10-03727.1997. [DOI] [PMC free article] [PubMed] [Google Scholar]
- 50.Parent JM, Tada E, Fike JR, Lowenstein DH. Inhibition of dentate granule cell neurogenesis with brain irradiation does not prevent seizure-induced mossy fiber synaptic reorganization in the rat. J Neurosci. 1999;19:4508–4519. doi: 10.1523/JNEUROSCI.19-11-04508.1999. [DOI] [PMC free article] [PubMed] [Google Scholar]
- 51.Plamondon H, Blondeau N, Heurteaux C, Lazdunski M. Mutually protective actions of kainic acid epileptic preconditioning and sublethal global ischemia on hippocampal neuronal death: involvement of adenosine A1 receptors and K(ATP) channels. J Cereb Blood Flow Metab. 1999;19:1296–1308. doi: 10.1097/00004647-199912000-00002. [DOI] [PubMed] [Google Scholar]
- 52.Pollard H, Charriaut-Marlangue C, Cantagrel S, Represa A, Robain O, Moreau J, Ben-Ari Y. Kainate-induced apoptotic cell death in hippocampal neurons. Neuroscience. 1994;63:7–18. doi: 10.1016/0306-4522(94)90003-5. [DOI] [PubMed] [Google Scholar]
- 53.Rasmussen TB. Surgical treatment of complex partial seizures: results, lessons, and problems. Epilepsia. 1983;24[Suppl 1]:S65–76. doi: 10.1111/j.1528-1157.1983.tb04645.x. [DOI] [PubMed] [Google Scholar]
- 54.Reibel S, Larmet Y, Carnahan J, Marescaux C, Depaulis A. Endogenous control of hippocampal epileptogenesis: a molecular cascade involving brain-derived neurotrophic factor and neuropeptide Y. Epilepsia. 2000;41[Suppl 6]:S127–133. doi: 10.1111/j.1528-1157.2000.tb01571.x. [DOI] [PubMed] [Google Scholar]
- 55.Rogawski MA, Donevan SD. AMPA receptors in epilepsy and as targets for antiepileptic drugs. Adv Neurol. 1999;79:947–963. [PubMed] [Google Scholar]
- 56.Roux PP, Colicos MA, Barker PA, Kennedy TE. p75 neurotrophin receptor expression is induced in apoptotic neurons after seizure. J Neurosci. 1999;19:6887–6896. doi: 10.1523/JNEUROSCI.19-16-06887.1999. [DOI] [PMC free article] [PubMed] [Google Scholar]
- 57.Rubino A, Yellon DM. Ischaemic preconditioning of the vasculature: an overlooked phenomenon for protecting the heart? Trends Pharmacol Sci. 2000;21:225–230. doi: 10.1016/s0165-6147(00)01483-8. [DOI] [PubMed] [Google Scholar]
- 58.Sanberg PR, Pisa M, McGeer EG. Strain differences and kainic acid neurotoxicity. Brain Res. 1979;166:431–435. doi: 10.1016/0006-8993(79)90234-8. [DOI] [PubMed] [Google Scholar]
- 59.Sanchez RM, Koh S, Rio C, Wang C, Lamperti ED, Sharma D, Corfas G, Jensen FE. Decreased glutamate receptor 2 expression and enhanced epileptogenesis in immature rat hippocampus after perinatal hypoxia-induced seizures. J Neurosci. 2001;21:8154–8163. doi: 10.1523/JNEUROSCI.21-20-08154.2001. [DOI] [PMC free article] [PubMed] [Google Scholar]
- 60.Sarnart HB, Born DE. Synaptophysin immunocytochemistry with thermal intensification: a marker of terminal axonal maturation in the human fetal nervous system. Brain Dev. 1999;21:41–50. doi: 10.1016/s0387-7604(98)00068-0. [DOI] [PubMed] [Google Scholar]
- 61.Schmued LC, Albertson C, Slikker W. Fluoro-Jade: a novel fluorochrome for the sensitive and reliable histochemical localization of neuronal degeneration. Brain Res. 1997;751:37–46. doi: 10.1016/s0006-8993(96)01387-x. [DOI] [PubMed] [Google Scholar]
- 62.Sloviter RS. Permanently altered hippocampal structure, excitability, and inhibition after experimental status epilepticus in the rat: the “dormant basket cell” hypothesis and its possible relevance to temporal lobe epilepsy. Hippocampus. 1991;1:41–66. doi: 10.1002/hipo.450010106. [DOI] [PubMed] [Google Scholar]
- 63.Sloviter RS. Possible functional consequences of synaptic reorganization in the dentate gyrus of kainate-treated rats. Neurosci Lett. 1992;137:91–96. doi: 10.1016/0304-3940(92)90306-r. [DOI] [PubMed] [Google Scholar]
- 64.Spencer DD, Spencer SS. Hippocampal resections and the use of human tissue in defining temporal lobe epilepsy syndromes. Hippocampus. 1994;4:243–249. doi: 10.1002/hipo.450040303. [DOI] [PubMed] [Google Scholar]
- 65.Sperk G. Kainic acid seizures in the rat. Prog Neurobiol. 1994;42:1–32. doi: 10.1016/0301-0082(94)90019-1. [DOI] [PubMed] [Google Scholar]
- 66.Sutula T, Cascino G, Cavazos J, Parada I, Ramirez L. Mossy fiber synaptic reorganization in the epileptic human temporal lobe. Ann Neurol. 1989;26:321–330. doi: 10.1002/ana.410260303. [DOI] [PubMed] [Google Scholar]
- 67.Takahashi Y, Tsunashima K, Sadamatsu M, Schwarzer C, Amano S, Ihara N, Sasa M, Kato N, Sperk G. Altered hippocampal expression of neuropeptide Y, somatostatin, and glutamate decarboxylase in Ihara's epileptic rats and spontaneously epileptic rats. Neurosci Lett. 2000;287:105–108. doi: 10.1016/s0304-3940(00)01133-2. [DOI] [PubMed] [Google Scholar]
- 68.Tauck DL, Nadler JV. Evidence of functional mossy fiber sprouting in hippocampal formation of kainic acid-treated rats. J Neurosci. 1985;5:1016–1022. doi: 10.1523/JNEUROSCI.05-04-01016.1985. [DOI] [PMC free article] [PubMed] [Google Scholar]
- 69.Tuunanen J, Lukasiuk K, Halonen T, Pitkanen A. Status epilepticus-induced neuronal damage in the rat amygdaloid complex: distribution, time-course and mechanisms. Neuroscience. 1999;94:473–495. doi: 10.1016/s0306-4522(99)00251-1. [DOI] [PubMed] [Google Scholar]
- 70.Wasterlain CG, Fujikawa DG, Penix L, Sankar R. Pathophysiological mechanisms of brain damage from status epilepticus. Epilepsia. 1993;34[Suppl 1]:S37–53. doi: 10.1111/j.1528-1157.1993.tb05905.x. [DOI] [PubMed] [Google Scholar]
- 71.Wasterlain CG, Shirasaka Y, Mazarati AM, Spigelman I. Chronic epilepsy with damage restricted to the hippocampus: possible mechanisms. Epilepsy Res. 1996;26:255–265. doi: 10.1016/s0920-1211(96)00058-7. [DOI] [PubMed] [Google Scholar]
- 72.Williams PA, Wuarin JP, Dou P, Ferraro DJ, Dudek FE. Reassessment of the effect of cyclohexamide in the pilocarpine model of temporal lobe epilepsy. Soc Neurosci Abstr. 2000;26:660.7. doi: 10.1152/jn.2002.88.4.2075. [DOI] [PubMed] [Google Scholar]
- 73.Xu B, Racine RJ. A comparison of kainic acid-induced epileptogenesis and morphological changes in the hippocampus of Wistar and Long–Evans rats. Soc Neurosci Abstr. 1999;25:340.2. [Google Scholar]
- 74.Zhang X, Gelowitz DL, Lai CT, Boulton AA, Yu PH. Gradation of kainic acid-induced rat limbic seizures and expression of hippocampal heat shock protein-70. Eur J Neurosci. 1997;9:760–769. doi: 10.1111/j.1460-9568.1997.tb01424.x. [DOI] [PubMed] [Google Scholar]
- 75.Zhang X, Hannesson DK, Saucier DM, Wallace AE, Howland J, Corcoran ME. Susceptibility to kindling and neuronal connections of the anterior claustrum. J Neurosci. 2001;21:3674–3687. doi: 10.1523/JNEUROSCI.21-10-03674.2001. [DOI] [PMC free article] [PubMed] [Google Scholar]