

Abstract
Increasing evidence indicates that insulin-like growth factor-I (IGF-I) has an important role in oligodendrocyte development. In this study, we examined myelination during postnatal development in IGF-I knock-out (KO) mice by assessing myelin staining, the expression of myelin basic protein (MBP) and proteolipid protein (PLP), two major myelin-specific proteins, and the number of oligodendrocytes and their precursors. For comparison, we also measured the expression of median subunit of the neuron-specific intermediate filament, M-neurofilament (M-NF), to obtain an index of the effects of IGF-I deficiency on neurons. We found that myelin staining, MBP and PLP expression, and the percentage of oligodendrocytes and their precursors are significantly reduced in all brain regions of developing IGF-I KO mice but are similar to controls in adult IGF-I KO mice. In contrast, the abundance of M-NF was decreased in both the developing and adult brain of IGF-I KO mice. We also found that IGF-II protein abundance is increased in the brains of IGF-I KO mice. Our data indicate, therefore, that myelination during early development is altered in the absence of IGF-I by mechanisms that involve a reduction in oligodendrocyte proliferation and development. Although neuronal actions cannot be excluded in the myelin normalization, the reduced axonal growth suggested by the reduced M-NF expression makes a role for neuronal factors less compelling. These data suggest that IGF-I plays a significant role in myelination during normal early development and that IGF-II can compensate in part for IGF-I actions on myelination.
Keywords: IGF-I, IGF-II, oligodendrocytes, oligodendrocyte precursors, myelination, development
In the CNS, myelination is characterized by proliferation and differentiation of oligodendrocyte precursors and accumulation of myelin-associated proteins and lipids. In rodents, myelination begins in the first postnatal week and peaks at ∼3–4 weeks (Morell, 1984; Jacobson, 1991). Increasing evidence indicates that insulin-like growth factor-I (IGF-I) has an important role in myelination. In culture, IGF-I increases the number of oligodendrocytes and their precursors by mechanisms involving promotion of oligodendrocyte precursor proliferation, differentiation, and survival (McMorris et al., 1986; McMorris and Dubois-Dalcq, 1988;Saneto et al., 1988; Mozell and McMorris, 1991; Barres et al., 1992; Ye and D'Ercole, 1999). Consistent with in vitro data, we (Ye et al., 1995a,b; Mason et al., 2000) and others (Carson et al., 1993) have demonstrated that brain IGF-I overexpression in transgenic (Tg) mice increases myelination by increasing oligodendrocyte number, myelin protein gene expression, and myelin sheath thickness. Conversely, inhibition of IGF-I bioactivity by ectopic expression of IGF binding protein-1 (IGFBP-1) in brain decreases myelination (Ye et al., 1995a,b).
Like IGFBP-1 Tg mice, mice with ablated IGF-I gene expression [IGF-I knock-out (KO) mice] exhibit a decreased number of oligodendrocytes and myelinated axons in corpus callosum (CC) and anterior commissure (Beck et al., 1995). More recently, Cheng et al. (1998) reported that myelin-associated galactocerebroside and sulfatide are reduced by ∼25% in the brains of adult IGF-I KO mice but that the concentration of myelin and myelin-specific proteins does not differ from those in wild-type (WT) controls. Based on these findings, Cheng et al. concluded that IGF-I does not have a major role in myelination during development and that axonal factors other than IGF-I determine oligodendrocyte survival and myelination. These investigators, however, only examined myelination in adult IGF-I KO mice, leaving open the possibility that myelination is altered during development in the absence of IGF-I expression. In addition to IGF-I, IGF-II and insulin (in high concentrations) can transduce signals through interaction with the type 1 IGF receptor. It seems possible, therefore, that IGF-II (and possibly other agents) can serve as surrogates when IGF-I is deficient and mask the normal role of IGF-I in myelination in IGF-I KO mice.
To investigate these possibilities, we examined myelination and IGF-II expression during early postnatal development. We also measured the expression of the neuron-specific intermediate filament neurofilament (NF) to obtain an index of the effects of IGF-I deficiency on neurons. Here we provide evidence that myelination is significantly reduced in developing IGF-I KO mice. We also show that IGF-II protein abundance is increased in the brains of IGF-I KO mice, suggesting that the increased IGF-II expression may compensate for the loss of IGF-I and its functions. Although we cannot exclude a role for neurons in the myelin normalization, the reduced axon growth suggested by the reduced median subunit of the neuron-specific intermediate neurofilament (M-NF) expression makes this less compelling. These data suggest, therefore, that IGF-I plays a significant role in myelination during normal early development.
MATERIALS AND METHODS
Mice. IGF-I KO mice (Liu et al., 1993) were a generous gift from Dr. Argiris Efstratiadis (Columbia University, New York, NY) and were housed at National Institute of Environmental Health Sciences (Research Triangle Park, NC). Homozygous IGF-I KO mice were obtained by breeding heterozygous males with heterozygous females, and only male IGF-I KO mice were studied. Consistent with a previous report (Liu et al., 1993), ∼20% of homozygous IGF-I KO mice survived postnatally. Homozygous, heterozygous, and WT mice were routinely identified by PCR of tail genomic DNA, using specific oligonucleotide primers, as reported previously (Richards et al., 2001). Mice were maintained with 12 hr light/dark cycles at 22°C. All procedures used were consistent with the guidelines of National Institutes of Health and approved by institutional review committees of the University of North Carolina at Chapel Hill and the National Institute of Environmental Health Sciences.
Northern blot hybridization analysis. Total RNA was extracted using the acidic guanidinium thiocyanate–phenol–chloroform method (Chomczynski and Sacchi, 1987). Aliquots of 15–20 μg of total RNA were electrophoresed, transferred onto nylon membranes, and UV cross-linked. After staining with 0.02% methylene blue, membranes were photographed to quantify the amount of RNA transferred and then hybridized with 32P-labeled single-stranded DNA (ssDNA) probes in Church's buffer (0.5m sodium phosphate, pH 7.1, 7% SDS, and 0.1 mm EDTA) and washed at high stringency with 40 mm sodium phosphate and 1% SDS at 55°C for 60 min. After autoradiography, membranes were stripped and hybridized with a second probe.
Quantification was performed using a computer-assisted image analysis system (Image-Pro; Media Cybermetics, Silver Spring, MD). To ensure the accuracy of changes in mRNA abundance and equal loading of RNA, the mRNA levels were normalized to cyclophilin (CYC) mRNA abundance or to the amount of 18 S rRNA on the membrane visualized by methylene blue staining. The abundance of CYC mRNA closely paralleled the amount of 18 S rRNA transferred.
Probes. Proteolipid protein (PLP), myelin basic protein (MBP), and CYC DNA fragments were amplified by PCR and used as templates for probes, as described in our previous report (Ye et al., 1995a). The PLP DNA fragment corresponded to base pairs (bp) 268–903 of mouse PLP cDNA (Hudson et al., 1987), the MBP DNA fragment corresponded to bp 58–490 of the mouse MBP cDNA (Newman et al., 1987), and the CYC DNA fragment corresponded to bp 106–517 of the rat CYC cDNA (Danielson et al., 1988). ssDNA hybridization probes were generated from these templates by linear PCR (Ye et al., 1992, 1995a) using their respective 3′ end primers and32P-labeled dCTP (Amersham Biosciences, Arlington Heights, IL).
Western blot analysis. Protein from each brain region was extracted as described previously (Klugmann et al., 1997). Briefly, pulverized tissues were lysed in 1% SDS and 1× PBS and sonicated, and the resultant homogenates were boiled for 3–5 min. Supernatants were collected by centrifugation at 12,000 rpm for 5 min at 4°C and stored at −80°C until use. Protein concentration was determined with the BCA protein kit (Pierce, Rockford, IL) using bovine serum albumin as a standard. Aliquots of 15–30 μg of protein (80 μg of protein for IGF-II) were separated on 7.5 or 12.5% polyacrylamide gel and transferred onto polyvinylidene difluoride membrane (Amersham Biosciences). Specific proteins were detected using their specific antibody and visualized using ECL kits (Amersham Biosciences) or ABC colometric kit (Vector Laboratories, Burlingame, CA). Primary antibodies were used and obtained as follows: anti-MBP antibody (1:1500), anti-M-NF antibody (1:1000), anti-H-NF antibody (1:1000), and anti-glial fibrillary acidic protein (GFAP) (1:3000) were obtained fromChemicon (Temecula, CA); anti-PLP antibody (1:500) was obtained from Biogenesis (Brentwood, NH); and anti-IGF-II antibody (1:200), anti-IGF-IR β subunit (1:1000), anti-insulin receptor substrate 1 (IRS1) antibody (1:1000), anti-IRS2 (1:1000), and anti-IRS4 antibody (1:1000) were obtained from Santa Cruz Biotechnology (Santa Cruz, CA). Human recombinant IGF-II (Eli Lilly, Indianapolis, IN) was a gift from Dr. Marsh Davenport (University of North Carolina at Chapel Hill) or obtained from Santa Cruz Biotechnology. Quantification of specific protein abundance was performed using a computer-assisted image analysis system (Image-Pro; Media Cybermetics). To ensure the equal loading and accuracy of changes in protein abundance, the protein levels were normalized to actin abundance. The abundance of actin closely paralleled the amount of total protein loaded.
Histochemical and immunohistochemical staining. Brains were perfused by transcardial infusion of 4% paraformaldehyde in PBS and further fixed in the same fixative overnight. Brains were split along the middle sagittal line. Left hemispheres were paraffin embedded and sagittally sectioned at a thickness of 6 μm for myelin staining using the Luxol Fast Blue–Periodic Acid Schiff (LFB-PAS) method and glutathione S-transferase (GST)-π (1:500) immunostaining. Right hemispheres were cryoprotected with 20% sucrose and sagittally frozen sectioned at a thickness of 10 μm. Sections were washed with 1× PBS and incubated with a polyclonal antibody specific for IGF-II (1:200; Santa Cruz Biotechnology), NG2 (1:200; a gift from Dr. Bill Stallcup, The Burnham Institute, La Jolla, CA), PLP (1:500), or MBP (1:250; Chemicon). Antibody–antigen complexes were detected using either a rhodamine-conjugated anti-rabbit IgG antibody or an ABC kit and peroxidase (Vector Laboratories) and visualized by incubation with DAB.
Quantification of oligodendrocytes. To quantify the number of oligodendrocytes and their precursors, sections were immunostained with GST-π antibody or NG2 antibody, respectively, and a peroxidase-conjugated secondary antibody. They then were counterstained with hematoxylin. Images of labeled cells (blue hematoxylin-stained nuclei and yellowish brown-immunostained cells) were digitally captured using a microscope and a Spot Jr. digital camera (Diagnostic Instruments, Sterling Heights, MI). Only immunolabeled cells with clear nuclei were scored. The number of GST-π-positive cells or NG2-positive oligodendrocyte precursors was calculated as percentage of total number of cells as judged by the number of nuclei. In each section, 300–500 cells in CC and brainstem (BS) and 400–600 cells in cerebral cortex (CTX) were counted. Overestimates of cell number attributable to splitting of nuclei were corrected using Abercrombie's methods (Abercrombie, 1946).
Statistics. Student's t test was used with assistance of SigmaStat software for Widows (SPSS, Chicago, IL).
RESULTS
Compared with those of WT littermate controls (Fig.1), brains of IGF-I KO mice were significantly reduced in weight from the earliest time measured (1 week of age). These results are consistent with data reported previously (Beck et al., 1995; Cheng et al., 1998). To determine whether there are regional alterations in brain growth during development, brains from developing IGF-I KO mice, as well as WT controls, were dissected into five distinct regions [CTX, hippocampus (HIP), diencephalon (DIE), cerebellum (CB), and BS] and weighed. Compared with WT controls, the weights of all five regions were significantly decreased in IGF-I KO mice at all ages examined (Fig. 1). There was no significant difference in brain weight between WT and heterozygous IGF-I KO mice, and, therefore, the data from WT and heterozygous IGF-I KO mice were grouped for additional analyses and referred to as littermate control or as control mice.
Fig. 1.

Weights of whole brain and brain regions in IGF-I KO and control mice during development. Brains were collected from IGF-I KO mice (open circles) and their littermate controls (filled circles), dissected, and weighed. Values are means ± SE from 6–10 mice. Absence of error bars indicates that the variance is smaller than the area encompassed by the symbol. WB, Whole brain. At each age studied, the weights recorded for IGF-I KO and control mice were significantly different (p < 0.01).
We first tested whether blunting of IGF-I expression during early development affects myelination using LFB-PAS staining as an index. As Figures 2 and3 show, myelin is stained light blue, cell nuclei is stained dark blue, and hydrocarbonates are stained pink/purple. In control mice, the abundance of light blue-stained myelin gradually increased during the developmental period studied. At 1 week of age, myelin was readily observed in BS and CB. Light blue-stained myelin became evident in CTX of 2-week-old mice, and bundles of myelinated fibers were observed in CC, BS, DIE, olfactory bulb, and other brain regions at this time. Myelin staining significantly increased during the next several weeks in all brain regions. Representative microphotographs of LFB-PAS staining in developing CTX and BS are shown in Figures 2 and 3, respectively. Myelin staining in IGF-I KO mice followed a similar developmental pattern. Compared with control mice, however, myelin staining in IGF-I KO mice was significantly reduced in the first 3 weeks of life. Myelin staining in most brain regions of IGF-I KO mice gradually increased and became similar to that in control mice at 10 weeks of age (Figs. 2, 3). It appears, however, that the myelin content in CC of IGF-I KO mice remained less than that of littermate controls (Fig. 2). Immunostaining of MBP and PLP, two major myelin-specific proteins, exhibited similar patterns of change during development (data not shown).
Fig. 2.

Myelin staining of CTX from IGF-I KO and littermate control mice during development. Brains of IGF-I KO mice (E–H) and their littermate controls (A–D) were perfusion fixed with 4% paraformaldehyde, sectioned, and stained using the LFB-PAS method. Myelin is stained light blue, nuclei are dark blue, and hydrocarbonates are pink/purple. Sections from mice at 1 week of age are shown in A andE, 2 weeks are shown in B andF, 3 weeks are shown in C andG, and 10 weeks are shown in D andH. Scale bar, 50 μm.
Fig. 3.

Myelin staining of brainstem from IGF-I KO and littermate control mice during development. Brains of IGF-I KO mice (E–H) and their littermate controls (A–D) were perfusion fixed with 4% paraformaldehyde, sectioned, and stained using the LFB-PAS method. Sections from mice at 1 week of age are shown in A andE, 2 weeks are shown in B andF, 3 weeks are shown in C andG, and 10 weeks are shown in D andH. Scale bar, 50 μm.
To quantify changes in myelination during development, we examined the expression of MBP and PLP, using Western immunoblot and Northern blot hybridization analysis. At 2 weeks of age, four major MBP bands (∼14.4, ∼17, ∼18, and ∼21 kDa) and a single PLP band (∼30 kDa) are readily detected by Western immunoblot analysis (Fig.4). The abundance of both MBP and PLP proteins in IGF-I KO mice was significantly decreased in all five regions examined compared with littermate controls. When the abundance of all four MBP bands is combined for quantification, MBP protein in IGF-I KO mice was decreased by ∼80% in CTX, ∼85% in HIP, ∼75% in DIE, ∼60% in BS, and ∼65% in CB. PLP protein abundance was also significantly reduced in IGF-I KO mice, being ∼30% of littermate controls in CTX, ∼45% in HIP, ∼60% in DIE, ∼50% in BS, and ∼55% in CB.
Fig. 4.

MBP and PLP protein abundance in 2-week-old IGF-I KO and littermate control mice. A, Representative Western immunoblot of MBP and PLP protein in brain regions of 2-week-old IGF-I KO and littermate control mice. The IGF-I KO mouse is indicated by KO. After detection with anti-MBP antibody, the blot was stripped and reprobed with antibodies to PLP and actin.B, Quantitative analysis of MBP and PLP protein abundance in 2-week-old IGF-I KO and control mice. The abundance of MBP and PLP is expressed as percentage of that in control mice. Aline is drawn at 100% to facilitate comparison. Values represent mean ± SE of three to five samples. *p < 0.05; **p < 0.01; ***p < 0.001 compared with controls.
As reported previously (Ye et al., 1995a), although a single band of MBP mRNA at size of ∼3 kb was detected, doublet bands of PLP mRNA at ∼2.4 and ∼3.2 kb were clearly observed (Fig.5), and a third PLP mRNA at ∼1.6 kb was detected only after prolonged exposure. Consistent with the changes in protein abundance, mRNA for MBP and PLP in 2-week-old IGF-I KO mice also was decreased (Fig. 5). In IGF-I KO mice, the abundance of MBP mRNA was ∼10, ∼50, and ∼30% of control mice in CTX, BS, and DIE, respectively. Similarly, when compared with those in control mice, PLP mRNA abundance (quantified by combining both the ∼2.4 and ∼3.2 kb mRNAs) in the CTX, BS, and DIE of IGF-I KO mice was decreased by ∼60, ∼50, and ∼60%, respectively. A single experiment also showed that MBP and PLP mRNA abundance in HIP and CB was significantly decreased in IGF-I KO mice (data not shown).
Fig. 5.

MBP and PLP mRNA abundance in the cerebral cortex, brainstem, and diencephalon of 3-week-old IGF-I KO mice and littermate controls. A, Representative Northern blot hybridization analysis of MBP and PLP mRNA abundance in 3-week-old IGF-I KO and control mice. Each lane was loaded with 20 μg of total RNA. The IGF-I KO mouse is indicated by KO. The bottom row shows methylene blue (MB) staining of the 18 S rRNA bands. B, Quantitative analysis of MBP and PLP mRNA abundance in 3-week-old IGF-I KO mice and control mice. The abundance of MBP and PLP mRNA is expressed as percentage of control mice. A line is drawn at 100% to facilitate comparison. Values represent mean ± SE of three to five samples. *p < 0.05; **p < 0.01 compared with controls.
Next we determined whether the reduced expression of MBP and PLP observed in 2-week-old IGF-I KO mice persisted at later development stages. In this experiment, we focused on CTX and BS, because these regions undergo myelination at different times, with myelination occurring earlier in BS than CTX. As Figure6A shows, the abundance of MBP and PLP protein in both CTX and BS of control mice rapidly increases during the first 3 weeks of life and increased only modestly thereafter. Also as expected, accumulation of these proteins begins later in CTX than in BS. The expression of MBP and PLP proteins in the CTX and BS of IGF-I KO mice followed a similar developmental pattern. When compared with control mice, the abundance of MBP and PLP proteins in both CTX and BS of IGF-I KO mice was significantly reduced during their first 3 weeks of postnatal life (Fig.6B). With increasing age, however, the MBP and PLP protein abundance in IGF-I KO mice gradually increased and became similar to that in controls by 10 weeks of age. The abundance of MBP mRNA in CTX, DIE, and BS exhibited a similar pattern of changes (Fig. 6C).
Fig. 6.

MBP and PLP expression in developing IGF-I KO mice and their littermate controls. A, Representative Western blots of MBP and PLP protein abundance in CTX and BS of IGF-I KO and control mice during development. After detection with anti-MBP and anti-PLP antibodies, the blot was stripped and incubated with anti-actin antibody. IGF-I KO mouse is indicated by KO. The age of each mouse in weeks (w) is indicated at the top. B, Quantitative analysis of MBP and PLP protein abundance in CTX and BS of IGF-I KO and control mice during development. The abundance of MBP and PLP is expressed as percentage of littermate control mice. C, Quantitative analysis of MBP mRNA abundance in CTX, BS, and DIE in IGF-I KO and control mice during development. MBP mRNA abundance is expressed as percentage of control mice. Detection of MBP mRNA in DIE from 10-week-old mice was not done. A line is drawn at 100% in B and C to facilitate comparison. Values represent mean ± SE from three to five samples. *p < 0.05; **p < 0.01; ***p < 0.001 compared with littermate controls.
To determine whether the alterations in the MBP and PLP expression in the IGF-I KO mice were attributable to changes in the development of oligodendrocytes, we quantified the number of oligodendrocytes and their precursors during development. Mature oligodendrocytes and their precursors in the frontal CTX (layers 2–6), CC and BS were identified using antibody against the cell body markers GST-π and NG2, respectively. Because blunting IGF-I expression significantly increases cell density (Liu et al., 1993; Beck et al., 1995; Cheng et al., 1998), we measured oligodendrocytes and precursors as percentage of total cells.
In 1-week-old control mice, NG2-positive oligodendrocyte precursors were relatively abundant, being ∼9.9% of total cells in CTX, as judged by nuclear staining, ∼49% in CC, and ∼17% in BS. With age, the number of NG2-positive oligodendrocyte precursors gradually decreased in all brain regions. Compared with control mice, the number of NG2-positive cells was significantly reduced in 3-week-old and 10-week-old IGF-I KO mice (Fig. 7). In 3-week-old IGF-I KO mice, the percentage of NG2-positive cells in CTX, CC, and BS was ∼63, ∼78, and ∼68% of controls, respectively, and was ∼64, ∼76, and ∼80% of controls at 10 weeks of age. One-week-old IGF-I KO mice also exhibited 10–12% decreases in the three brain regions examined, but the reduction was not statistically significant (Fig. 7), possibly attributable to large variation among samples.
Fig. 7.

Number of oligodendrocytes and their precursors in the CTX, CC, and BS of developing IGF-I KO mice and their littermate controls. The numbers of NG2-positive precursor and GST-π-positive oligodendrocytes is expressed in percentage of total cells. Values represent mean ± SE from three samples. *p < 0.05; **p < 0.01; ***p < 0.001 compared with littermate controls.
As reported previously (Tansey and Cammer, 1991; Cammer and Zhang, 1992; Mason et al., 2000), GST-π-positive cells exhibit a small cell body with a few of the processes. In contrast to NG2-positive precursors, GST-π-positive oligodendrocytes were rarely observed in 1-week-old control mice (data not shown), and their number gradually increased with age in all brain regions. In 3-week-old control mice, the percentage of GST-π-positive oligodendrocytes was ∼6, ∼40, and ∼20% of total cell number in CTX, CC, and BS, respectively. The oligodendrocyte number reaches ∼12% of the total cell number in CTX, ∼55% in CC, and ∼26% in BS at 10 weeks. These values are similar to those determined using PLP in situ hybridization (Ye et al., 1995a). Consistent with Western immunoblot analysis, the number of GST-π-positive cells in 3-week-old IGF-I KO mice is reduced in all three regions examined, being ∼60, ∼67, and 71% of control CTX, CC, and BS, respectively (Fig. 7). At 10 weeks, the number of GST-π-positive oligodendrocytes was moderately decreased in the three regions of IGF-I KO mice. The decreases, however, were not statistically significant (Fig. 7).
To examine the relationship between myelination and axon development in IGF-I KO mice, we determined the abundance of NF protein in developing and adult IGF-I KO mice and their littermate controls. NF is a neuron-specific intermediate filament and plays an important role in determining axon caliber. As Figure 8shows, M-NF protein, a medium subunit of NF, was abundant in the CTX and BS of 1-week-old controls. Its abundance gradually increased during development, as reported previously (Julien et al., 1986; Hoffman et al., 1987). Compared with control mice, the abundance of CTX and BS M-NF protein was significantly reduced in the developing IGF-I KO mice, being 60–80% of control mice (Fig. 8B). Unlike the changes in myelin-specific proteins, the changes in abundance of M-NF did not recover and remained reduced by ∼40% in 10-week-old IGF-I KO mice (Fig. 8C). The abundance of another neurofilament subunit, H-NF, in CTX of IGF-I KO mice exhibited a similar pattern of change and was significantly reduced when compared with control mice (data not shown).
Fig. 8.
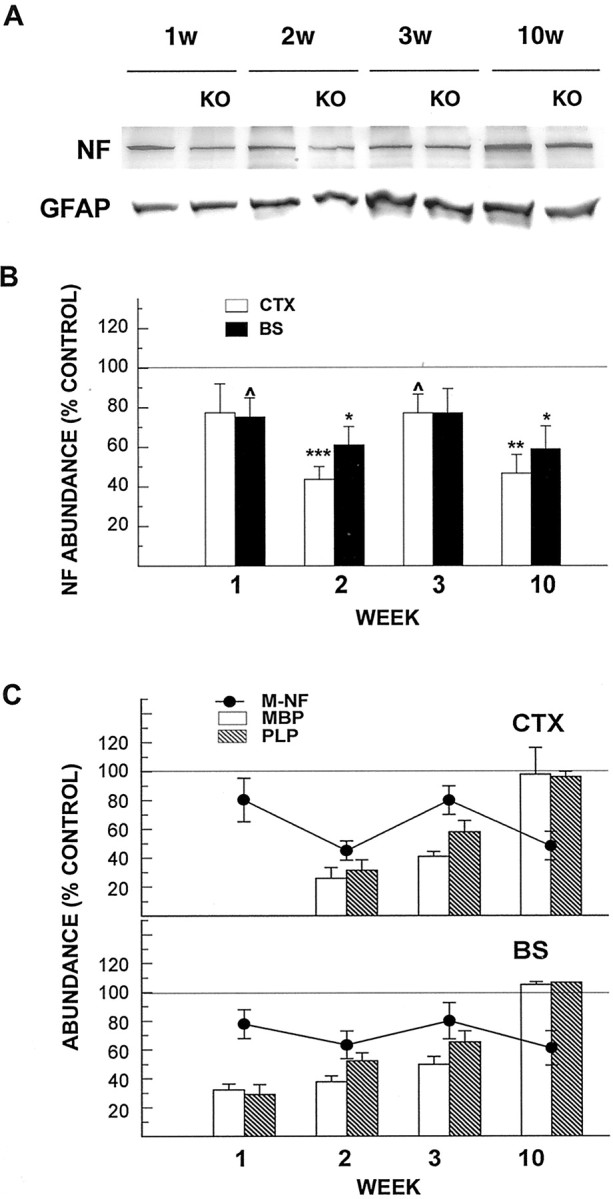
NF and GFAP abundance in developing IGF-I KO and their littermate controls. A, Representative Western immunoblot of M-NF protein and GFAP abundance in CTX of IGF-I KO and control mice during development. IGF-I KO mouse is indicated byKO. The age of each mouse in weeks (w) is indicated at the top.B, Quantitative analysis of NF protein abundance in CTX and BS of IGF-I KO and control mice during development. The abundance of M-NF is expressed as percentage of control mice. C, Correlation of the abundance of M-NF and of MBP and PLP protein in CTX and BS of IGF-I KO and control mice. NF data are superimposed on the data for MBP and PLP protein abundance shown in Figure6B. M-NF, MBP, and PLP abundance is expressed as percentage of that in control mice. A line is drawn at 100% in B and C to facilitate comparison. Values represent mean ± SE from three to five samples. ^p = 0.06; *p < 0.05; **p < 0.01; ***p < 0.001 compared with controls.
The abundance of GFAP, an astrocyte-specific filament protein, was also quantified. Similar to NF abundance, the abundance of GFAP gradually increased during development (Fig. 8A). Its abundance in IGF-I KO mice, however, did not significantly differ from that in control mice (Fig. 8A).
We next investigated possible mechanism(s) for the “catch-up” in myelination that we observed in IGF-I KO mice. Because IGF-II is capable of interacting with the IGFIR (Kiess et al., 1987; Gustafson and Rutter, 1990) and promoting oligodendrocyte development in culture (McMorris et al., 1990; Masters et al., 1991; Barres et al., 1992), we asked whether there is an increase in IGF-II expression that might compensate for the IGF-I deficit. We also examined the abundance of IGFIR and IRS-1, IRS-2, and IRS-4, the three IRSs expressed in brain, to determine whether there is any alteration in their expression. Western immunoblots of protein extracts from the CTX using IGF-II antibody identified a band migrating at an apparent mass of ∼7.5 kDa and a more abundant doublet band of ∼12 kDa. Recombinant human IGF-II migrated identically to the ∼7.5 kDa band. Recombinant IGF-I was not recognized by the IGF-II antibody when similar amounts were applied to the gel. When the antibody was preincubated with recombinant IGF-II, neither the 7.5 kDa band nor the 12 kDa doublet band was observed (Fig.9A). These data confirm that the antibody is specific for IGF-II and likely recognizes both the mature (7.5 kDa) and precursor forms (12 kDa), with no or very little cross-reactivity with IGF-I. We then determined and compared IGF-II protein abundance in the brains of IGF-I KO mice and their controls. When the quantity of each IGF-II band was combined, the abundance of IGF-II was increased in the CTX of IGF-I KO mice (Fig. 9B). In control mice, IGF-II abundance gradually decreased with age, being ∼61% of its level in 1-week-old mice at 2 weeks of age and ∼44% at 10 weeks of age. IGF-II abundance in IGF-I KO mice was relatively constant through the period studied. In 1-week-old IGF-I KO mice, IGF-II abundance was ∼50% greater than in littermate control mice, and its relative abundance increased to ∼190% of controls at 2 weeks of age (p < 0.05 compared with its level in 1-week-old IGF-I KO mice), ∼182% at 3 weeks of age, and ∼160% at 10 weeks of age. The abundance of IGFIR, as well as that of IRS-1, IRS-2, and IRS-4, was similar in IGF-I KO mice and littermate controls (Fig. 9C,D).
Fig. 9.

IGF-II expression in CTX of IGF-I KO mice.A, Representative Western immunoblot of IGF-II protein abundance in IGF-I KO and control mice. CTX protein (80 μg) from a 2-week-old IGF-I KO mouse and a littermate control, recombination human IGF-II (II; 200 ng), and IGF-I (I; 200 ng) were, respectively, loaded in each lane. IGF-I KO mouse is indicated by KO. The right lanerepresents protein (80 μg) from CTX of a 2-week-old control mouse reacted with the anti-IGF-II antibody that was preincubated with 5 μg/ml IGF-II for 1 hr at room temperature (Pre-II). B, Quantitative analysis of IGF-II abundance in the CTX of IGF-I KO and control mice. IGF-II protein abundance is expressed as percentage of control mice. Aline is drawn at 100% to facilitate comparison. Values represent mean ± SE from three to four samples. *p < 0.05; **p < 0.01 compared with controls. C, Representative Western immunoblots of IGFIR, IRS-1, IRS-2, and IRS-4 in IGF-I KO and control mice. CTX protein (30 μg) from a 2-week-old IGF-I KO mouse and a littermate control were loaded in each lane. IGF-I KO mouse is indicated by KO. D, Quantitative analysis of IGFIR, IRS-1, IRS-2, and IRS-4 abundance in the CTX of IGF-I KO and control mice. Values represent mean ± SE from three to five samples.
DISSCUSION
Our data show that myelin staining, expression of myelin-specific protein genes, and oligodendrocyte number are significantly reduced in IGF-I KO mice during the first 3 weeks of postnatal life. This finding is consistent with our previous reports that myelination is decreased in the brain of Tg mice that ectopically express IGFBP-1, an inhibitor of IGF action, although it is increased when IGF-I is overexpressed in brain (Ye et al., 1995a,b). The myelin content, expression of myelin-specific proteins, and oligodendrocyte number in IGF-I KO mice, however, increases after the weanling period, resulting in a normal concentration in adult IGF-I KO mice. These data demonstrate, therefore, that myelination is developmentally altered in IGF-I KO mice. Our finding that IGF-II abundance is increased in the brains of IGF-I KO mice suggests that IGF-II may partially compensate for the loss of IGF-I expression and function.
These findings are consistent with those of Beck et al. (1995) who showed that myelinated axons and myelin sheath thickness are significantly reduced in adult IGF-I KO mice. The data reported byCheng et al. (1998) also are consistent with our findings, although they reached different conclusions. Studying whole brains from young adult IGF-I KO mice, they found a 25% reduction in myelin-associated galactocerebroside and sulfatide but a similar concentration of several myelin-specific proteins. They also reported that the number of oligodendrocytes in the CB and anterior commissure of IGF-I KO mice approximately correlated with the number of projection neurons. For these reasons and because they did not study parameters of myelination before adulthood, they concluded that neuronal factors govern myelination and that IGF-I does not have a major role in myelination during development. Although we found that the myelin in adult IGF-I KO mice was similar to that in normal control mice, our data clearly demonstrate significant decreases in myelin staining, the expression of MBP and PLP proteins and their mRNAs, and the number of oligodendrocytes and their precursors before adulthood. These data indicate that IGF-I has a significant role in stimulating proliferation and maturation of oligodendrocytes and promoting myelin protein expression during development, albeit it can be subserved by IGF-II and/or other agents, when IGF-I expression is deficient (see below).
IGF-II, an IGF-I homolog, also interacts with the IGFIR. Because IGF-II is highly expressed in craniofacial mesenchymal structures (Rotwein et al., 1988; Hepler and Lund, 1990; Rotwein, 1991), the brain is exposed to high IGF-II levels during prenatal and early postnatal life. In rodents, IGF-II expression persists in the choroid plexus, leptomeninges, and parenchymal microvasculature through adulthood (Rotwein et al., 1988; Rotwein, 1991; Cavallaro et al., 1993; Logan et al., 1994). Recently, Logan et al. (Logan et al., 1994; Walter et al., 1999) reported that, in the brain of adult rats, IGF-II and IGFBP-2 immunoreactivity colocalizes to the membrane of cells with oligodendrocyte characteristics and to myelin sheaths. Together with the data reviewed above showing that IGF-II is expressed in the choroid plexus, leptomeninges, and parenchymal microvasculature in adult animals, their study suggests that IGF-II is transported to myelin tracks from its sites of synthesis. Although the precise function of IGF-II in postnatal rodent brains is not clear, its pattern of association with oligodendrocytes and myelin suggests that it may play a role in promoting and/or maintaining myelination (Logan et al., 1994;Walter et al., 1999). The latter speculation is supported by the data that IGF-II promotes development and survival of oligodendrocytes and their precursors in culture (McMorris et al., 1990; Masters et al., 1991; Barres et al., 1992).
Using Western immunoblot analysis, we found that IGF-II expression is increased in IGF-I KO mice. We observed increases in IGF-II-immunoreactive bands at ∼7.5 and ∼12 kDa in CTX and BS. The ∼7.5 kDa comigrates with recombinant IGF-II and represents mature IGF-II, whereas the more abundant bands migrating at ∼12 kDa likely represent precursor forms. Precursor IGF-II forms of 10–18 kDa have been reported in multiple tumor cells lines (Schmitt et al., 1997; Bae et al., 1998) and in the serum of normal and tumor patients (Hoeflich et al., 1995; Bae et al., 1998; Christofilis et al., 1998). The expression of IGF-II in developing and adult rodent CNS has been well studied using a variety of methods, including immunohistochemistry (Logan et al., 1994; Walter et al., 1999), in situhybridization (Cavallaro et al., 1993; Logan et al., 1994; Walter et al., 1999), and RNA protection assay (Rotwein et al., 1988); however, only a few studies have documented its molecular forms in brain (Haselbacher et al., 1985). Although the physiologic significance of the expressed IGF-II precursor is not clear, the precursor derived from tumors has been shown to have biologic activity, including promotion of angiogenesis and hexosaminidase secretion (Hoeflich et al., 1995; Bae et al., 1998; Christofilis et al., 1998). We speculate that the increase in IGF-II during rapid myelination (2–4 weeks of age) and in early adulthood is responsible for the recovery of myelin-specific protein expression in adult IGF-I KO mice. Other studies of mouse CNS myelination support this conclusion. Transgenic mice expressing high levels of IGFBP-1 in brain exhibit a marked decrease in myelination throughout life (Ye et al., 1995a,b; Ni et al., 1997). IGFBP-1 has a similar affinity for both IGF-I and IGF-II (Bach et al., 1993; Oh et al., 1993) and inhibits the actions of both IGF-I and IGF-II. Thus, when the actions of both IGFs are inhibited, myelination is decreased in the adult brain. These data argue that an IGF, either IGF-I or IGF-II, is necessary for normal myelination. Our data, however, do not exclude the possibility that other factors, alone or in concert, may also compensate for the IGF-I loss. In culture, FGF and PDGF, alone or synergistically with IGF-I, are capable of promoting oligodendrocyte proliferation and survival (Barres et al., 1992, 1993; Jiang et al., 2001).
Myelination is closely associated with axon growth, and, therefore, we sought to assess whether there is a correlation between deficient axon growth and delayed myelination in IGF-I KO mice. To provide an index of axon growth during development, we measured the expression of NF. NF, a class IV intermediate filament, is composed of three subunits with molecular masses of ∼200 kDa (high), ∼150 kDa (medium), and ∼68 kDa (low). The expression of each of the three NF subunits increases during development, and their abundance correlates with the axon growth (Friede and Samorajski, 1970; Lasek et al., 1983; Hoffman et al., 1985,1987). In addition, loss of NF protein results in failure of axon growth (Zhu et al., 1997; Elder et al., 1998). We found that, whereas the expression of M-NF and H-NF proteins have a similar developmental profile in both IGF-I KO and control mice, the expression of M-NF and H-NF in IGF-I KO mice is significantly reduced throughout the brain during development and remains decreased in adult IGF-I KO mice, suggesting a decreased axonal growth and/or axon maturation in adult IGF-I KO mice. The expression of NF, therefore, does not parallel the changes in abundance of myelin-specific proteins during development in IGF-I KO mice. Although decreased axon growth could contribute to the alteration in myelination in these mice, axon influences cannot by themselves explain the pattern of myelination in IGF-I KO mice.
Beck et al. (1995) and Cheng et al. (1998) also assessed neuron number in specific regions of IGF-I KO mice. Beck et al. (1995) reported that the numbers of striatal parvalbumin-positive neurons and hippocampal granular neurons were significantly reduced, whereas the numbers of cortical projection neurons in CTX layers III and V and dopaminergic neurons do not differ in IGF-I KO and control mice. Cheng et al. (1998)indicated that there is significant decrease in olfactory bulb neurons but not in Purkinje cells in IGF-I KO mice. Together, it seems likely that IGF-I deficiency reduces overall neuron number but that the influence of IGF-I differs among brain regions. This conclusion is consistent with our findings that there are significant increases in neuron number in some but not all medullary nuclei in IGF-I-overexpressing transgenic mice (Dentremont et al., 1999).
Taken in aggregate, evidence for an important role for IGF-I in oligodendrocyte development and in myelination is strong. We believe that IGF-I is a major component of the signaling mechanisms that regulate myelination during normal development. IGF-II also may have a role in regulating myelination, and it can, at least in part, serve as an IGF-I surrogate in IGF-I-deficient states. It is clear, however, that many of signaling mechanisms are involved in the regulation of myelination.
Footnotes
This work was supported by National Institute of Neurological Disorders and Stroke Grant NS38891 and National Institute of Child Health and Human Development Grant HD08299 (A.J.D.).
Correspondence should be addressed to Dr. A. Joseph D'Ercole, Department of Pediatrics, CB 7220, The University of North Carolina at Chapel Hill, Chapel Hill, NC 27599-7220. E-mail: joseph_d'ercole@unc.edu.
REFERENCES
- 1.Abercrombie M. Estimation of nuclear poplation from microtome section. Anat Rec. 1946;94:274–329. doi: 10.1002/ar.1090940210. [DOI] [PubMed] [Google Scholar]
- 2.Bach LA, Hsieh S, Sakano K, Fujiwara H, Perdue JF, Rechler MM. Binding of mutants of human insulin-like growth factor II to insulin-like growth factor binding proteins 1–6. J Biol Chem. 1993;268:9246–9254. [PubMed] [Google Scholar]
- 3.Bae MH, Lee MJ, Bae SK, Lee OH, Lee YM, Park BC, Kim KW. Insulin-like growth factor II (IGF-II) secreted from HepG2 human hepatocellular carcinoma cells shows angiogenic activity. Cancer Lett. 1998;128:41–46. doi: 10.1016/s0304-3835(98)00044-5. [DOI] [PubMed] [Google Scholar]
- 4.Barres BA, Hart IK, Coles HS, Burne JF, Voyvodic JT, Richardson WD, Raff MC. Cell death and control of cell survival in the oligodendrocyte lineage. Cell. 1992;70:31–46. doi: 10.1016/0092-8674(92)90531-g. [DOI] [PubMed] [Google Scholar]
- 5.Barres BA, Schmid R, Sendnter M, Raff MC. Multiple extracellular signals are required for long-term oligodendrocyte survival. Development. 1993;118:283–295. doi: 10.1242/dev.118.1.283. [DOI] [PubMed] [Google Scholar]
- 6.Beck KD, Powell-Braxton L, Widmer HR, Valverde J, Hefti F. Igf1 gene disruption results in reduced brain size, CNS hypomyelination, and loss of hippocampal granule and striatal parvalbumin-containing neurons. Neuron. 1995;14:717–730. doi: 10.1016/0896-6273(95)90216-3. [DOI] [PubMed] [Google Scholar]
- 7.Cammer W, Zhang H. Localization of Pi class glutathione-S-transferase in the forebrains of neonatal and young rats: evidence for separation of astrocytic and oligodendrocytic lineages. J Comp Neurol. 1992;321:40–45. doi: 10.1002/cne.903210105. [DOI] [PubMed] [Google Scholar]
- 8.Carson MJ, Behringer RR, Brinster RL, McMorris FA. Insulin-like growth factor I increases brain growth and central nervous system myelination in transgenic mice. Neuron. 1993;10:729–740. doi: 10.1016/0896-6273(93)90173-o. [DOI] [PubMed] [Google Scholar]
- 9.Cavallaro T, Martone RL, Stylianopoulou F, Herbert J. Differential expression of the insulin-like growth factor II and transthyretin genes in the developing rat choroid plexus. J Neuropathol Exp Neurol. 1993;52:153–162. doi: 10.1097/00005072-199303000-00008. [DOI] [PubMed] [Google Scholar]
- 10.Cheng CM, Joncas G, Reinhardt RR, Farrer R, Quarles R, Janssen J, McDonald MP, Crawley JN, Powell-Braxton L, Bondy C. Biochemical and morphometric analysis show that myelination in the insulin-like growth factor 1 null brain is proportionate to its neuronal composition. J Neurosci. 1998;18:5673–5681. doi: 10.1523/JNEUROSCI.18-15-05673.1998. [DOI] [PMC free article] [PubMed] [Google Scholar]
- 11.Chomczynski P, Sacchi N. Single-step method of RNA isolation by acid guanidinium thiocyanate-phenol-chloroform extraction. Anal Biochem. 1987;162:156–159. doi: 10.1006/abio.1987.9999. [DOI] [PubMed] [Google Scholar]
- 12.Christofilis M-A, Remacle-Bonnet M, Atlan-Gepner C, Garrouste F, Vialettes B, Fuentes P, Guidicelli R, Rommier G. Study of serum big-insulin-like growth factor (IGF)-II and IGF binding proteins in two patients with extrapancreatic tumor hypoglycemia, using a combination of Western blotting methods. Eur J Endocrinology. 1998;139:317–322. doi: 10.1530/eje.0.1390317. [DOI] [PubMed] [Google Scholar]
- 13.Danielson PE, Forss-Petter S, Brow MA, Calavetta L, Douglas J, Milner RJ, Sutcliffe JG. p1B15: a cDNA clone of the rat mRNA encoding cyclophilin. DNA. 1988;7:261–267. doi: 10.1089/dna.1988.7.261. [DOI] [PubMed] [Google Scholar]
- 14.Dentremont KD, Ye P, D'Ercole AJ, O'Kusky JR. Increased insulin-like growth factor-I (IGF-I) expression during early postnatal development differentially increases neuron number and growth in medullary nuclei of the mouse. Dev Brain Res. 1999;114:135–141. doi: 10.1016/s0165-3806(99)00024-3. [DOI] [PubMed] [Google Scholar]
- 15.Elder GA, Friedrich VL, Jr, Bosco P, Kang C, Goourov A, Tu P-H, Lee VMY, Lazzarini RA. Absence of the mid-sized neurofilament subunit decreases axonal calibers, levels of light neurofilament (NF-L), and neurofilament content. J Cell Biol. 1998;141:727–739. doi: 10.1083/jcb.141.3.727. [DOI] [PMC free article] [PubMed] [Google Scholar]
- 16.Friede RL, Samorajski T. Axon caliber related to neurofilament and microtubules in sciatic nerve fibers of rats and mice. Anat Rec. 1970;167:379–388. doi: 10.1002/ar.1091670402. [DOI] [PubMed] [Google Scholar]
- 17.Gustafson TA, Rutter WJ. The cysteine-rich domains of the insulin and insulin-like growth factor I receptors are primary determinants of hormone binding specificity. Evidence from receptor chimeras. J Biol Chem. 1990;265:18663–18667. [PubMed] [Google Scholar]
- 18.Haselbacher GK, Schwab ME, Pasi A, Humbel RE. Insulin-like growth factor II (IGF II) in human brain: regional distribution of IGF-II and of higher molecular mass forms. Proc Natl Acad Sci USA. 1985;82:2153–2157. doi: 10.1073/pnas.82.7.2153. [DOI] [PMC free article] [PubMed] [Google Scholar]
- 19.Hepler JE, Lund PK. Molecular biology of the insulin-like growth factors. In: Bazan N, editor. Molecular neurobiology. Humana; Totowa, NJ: 1990. pp. 93–127. [DOI] [PubMed] [Google Scholar]
- 20.Hoeflich A, Wolf E, Braulke T, Koepf G, Kessler U, Brem G, Rascher W, Blum W, Kiess W. Does the overexpression of pro-insulin-like growth factor-II in transfected human embryonic kidney fibroblasts increase the secretion of lysosomal enzymes? Eur J Biochem. 1995;232:172–178. doi: 10.1111/j.1432-1033.1995.tb20796.x. [DOI] [PubMed] [Google Scholar]
- 21.Hoffman P, Thompson G, Griffin J, Price D. Changes in neurofilament transport coincide temporally with alterations in the caliber of axons in regenerating motor fibers. J Cell Biol. 1985;101:1332–1340. doi: 10.1083/jcb.101.4.1332. [DOI] [PMC free article] [PubMed] [Google Scholar]
- 22.Hoffman PN, Cleveland DW, Griffin JW, Landes PW, Cowan NJ, Price DL. Neurofilament gene expression: a major determinant of axonal caliber. Proc Natl Acad Sci USA. 1987;84:3472–3473. doi: 10.1073/pnas.84.10.3472. [DOI] [PMC free article] [PubMed] [Google Scholar]
- 23.Hudson LD, Berndt JA, Puckett C, Kozak CA, Lazzarini RA. Aberrant splicing of proteolipid protein mRNA in the dysmyelinating jimpy mutant mouse. Proc Natl Acad Sci USA. 1987;84:1454–1458. doi: 10.1073/pnas.84.5.1454. [DOI] [PMC free article] [PubMed] [Google Scholar]
- 24.Jacobson M. Developmental neurobiology, Ed 3, pp 95–142. Plenum; New York: 1991. [Google Scholar]
- 25.Jiang FJ, Frederick TJ, Wood TL. IGF-I synergizes with FGF-2 to stimulate oligodendrocyte progenitor entry into the cell cycle. Dev Biol. 2001;232:414–423. doi: 10.1006/dbio.2001.0208. [DOI] [PubMed] [Google Scholar]
- 26.Julien J-P, Meyer D, Flavell D, Hurst J, Grosveld F. Cloning and developmental expression of the murine neurofilament gene family. Mol Brain Res. 1986;1:243–250. doi: 10.1016/0169-328x(86)90030-6. [DOI] [PubMed] [Google Scholar]
- 27.Kiess W, Haskell JF, Lee L, Greenstein LA, Miller BE, Aarons AL, Rechler MM, Nissley SP. An antibody that blocks insulin-like growth factor (IGF) binding to the type II IGF receptor is neither an agonist nor an inhibitor of IGF-stimulated biologic responses in L6 myoblasts. J Biol Chem. 1987;262:12745–12751. [PubMed] [Google Scholar]
- 28.Klugmann M, Schwab MH, Puhlhofer A, Schneider A, Zimmermann F, Griffiths IR, Nave KA. Assembly of CNS myelin in the absence of proteolipid protein. Neuron. 1997;18:59–70. doi: 10.1016/s0896-6273(01)80046-5. [DOI] [PubMed] [Google Scholar]
- 29.Lasek RJ, Oblinger M, Drake P. Molecuar biology of neuronal geometry: expression of neurofilament genes influences axonal diameter. Cold Spring Harbor Symp Quant Biol. 1983;18:731–744. doi: 10.1101/sqb.1983.048.01.076. [DOI] [PubMed] [Google Scholar]
- 30.Liu J-P, Baker J, Perkins AS, Robertson EJ, Efstratiadis A. Mice carrying null mutations of the genes encoding insulin-like growth factor I (Igf-1) and type 1 IGF receptor. Cell. 1993;75:59–72. [PubMed] [Google Scholar]
- 31.Logan A, Gonzalez A-M, Hill DJ, Berry M, Gregson NA, Baird A. Coordinated pattern of expression and localization of insulin-like growth factor-II (IGF-II) and IGF-binding protein-2 in the adult rat brain. Endocrinology. 1994;135:2255–2264. doi: 10.1210/endo.135.5.7525264. [DOI] [PubMed] [Google Scholar]
- 32.Mason JL, Ye P, Suzuki K, D'Ercole AJ, Matsushima GK. Insulin-like growth factor-1 inhibits mature oligodendrocyte apoptosis during primary demyelination. J Neurosci. 2000;20:5703–5708. doi: 10.1523/JNEUROSCI.20-15-05703.2000. [DOI] [PMC free article] [PubMed] [Google Scholar]
- 33.Masters BA, Werner H, Roberts CT, Jr, LeRoith D, Raizada MK. Insulin-like growth factor I (IGF-I) receptors and IGF-I action in oligodendrocytes from rat brains. Regul Pept. 1991;33:117–131. doi: 10.1016/0167-0115(91)90207-w. [DOI] [PubMed] [Google Scholar]
- 34.McMorris FA, Dubois-Dalcq M. Insulin-like growth factor I promotes cell proliferation and oligodendroglial commitment in rat glial progenitor cells developing in vitro. J Neurosci Res. 1988;21:199–209. doi: 10.1002/jnr.490210212. [DOI] [PubMed] [Google Scholar]
- 35.McMorris FA, Smith TM, DeSalvo S, Furlanetto RW. Insulin-like growth factor I/somatomedin C: a potent inducer of oligodendrocyte development. Proc Natl Acad Sci USA. 1986;83:822–826. doi: 10.1073/pnas.83.3.822. [DOI] [PMC free article] [PubMed] [Google Scholar]
- 36.McMorris FA, Furlanetto RW, Mozell RL, Carson MJ, Raible DW. Regulation of oligodendrocyte development by insulin-like growth factors and cyclic nucleotides. Ann NY Acad Sci. 1990;605:101–109. doi: 10.1111/j.1749-6632.1990.tb42385.x. [DOI] [PubMed] [Google Scholar]
- 37.Morell P. Myelin, Ed 2. Plenum; New York: 1984. [Google Scholar]
- 38.Mozell RL, McMorris FA. Insulin-like growth factor I stimulates oligodendrocyte development and myelination in rat brain aggregate cultures. J Neurosci Res. 1991;30:382–390. doi: 10.1002/jnr.490300214. [DOI] [PubMed] [Google Scholar]
- 39.Newman S, Kitamura K, Campagnoni AT. Identification of a cDNA coding for a fifth form of myelin basic protein in mouse. Proc Natl Acad Sci USA. 1987;84:886–890. doi: 10.1073/pnas.84.3.886. [DOI] [PMC free article] [PubMed] [Google Scholar]
- 40.Ni W, Rajkumar K, Nagy JI, Murphy LJ. Impaired brain development and reduced astrocyte response to injury in transgenic mice expressing IGF-I binding protein-1. Brain Res. 1997;769:97–107. doi: 10.1016/s0006-8993(97)00676-8. [DOI] [PubMed] [Google Scholar]
- 41.Oh Y, Müller HL, Lee D-Y, Fielder PJ, Rosenfeld RG. Characterization of the affinities of insulin-like growth factor (IGF)-binding proteins 1–4 for IGF-I, IGF-II, IGF-I/insulin hybrid, and IGF-I analogs. Endocrinology. 1993;132:1337–1344. doi: 10.1210/endo.132.3.7679979. [DOI] [PubMed] [Google Scholar]
- 42.Richards RG, Klotz DM, Bush MR, Walmer DK, DiAugustine RP (2001) E2-induced degradation of uterine insulin receptor substrate-2: requirement for an IGF-I-stimulated, proteasome-dependent pathway. Endocrinology 3842–3849. [DOI] [PubMed]
- 43.Rotwein P. Structure, evolution, expression and regulation of insulin-like growth factors I and II. Growth Factors. 1991;5:3–18. doi: 10.3109/08977199109000267. [DOI] [PubMed] [Google Scholar]
- 44.Rotwein P, Burgess SK, Milbrandt JD, Krause JE. Differential expression of insulin-like growth factor genes in rat central nervous system. Proc Natl Acad Sci USA. 1988;85:265–269. doi: 10.1073/pnas.85.1.265. [DOI] [PMC free article] [PubMed] [Google Scholar]
- 45.Saneto RP, Low KG, Melner MH, De Vellis J. Insulin/insulin-like growth factor I and other epigenetic modulators of myelin basic protein expression in isolated oligodendrocyte progenitor cells. J Neurosci Res. 1988;21:210–219. doi: 10.1002/jnr.490210213. [DOI] [PubMed] [Google Scholar]
- 46.Schmitt S, ReniQiu Q, Torresani T, Doebeli M, Zapf J, Schoenle EJ. High molecular weight forms of IGF-II (big-IGF-II) released by Wilms' tumor cells. Eur J Endocrinol. 1997;137:396–401. doi: 10.1530/eje.0.1370396. [DOI] [PubMed] [Google Scholar]
- 47.Tansey FA, Cammer W. A pi form of glutathione-S-transferase is a myelin- and oligodendrocyte-associated enzyme in mouse brain. J Neurochem. 1991;57:95–102. doi: 10.1111/j.1471-4159.1991.tb02104.x. [DOI] [PubMed] [Google Scholar]
- 48.Walter HJ, Berry M, Hill DJ, Cwyfan-Hughes S, Holly JMP, Logan A. Distinct sites of insulin-like growth factor (IGF)-II expression and localization in lesioned rat brain: possible roles of IGF binding proteins (IGFBPs) in the mediation of IGF-II activity. Endocrinology. 1999;140:520–532. doi: 10.1210/endo.140.1.6463. [DOI] [PubMed] [Google Scholar]
- 49.Ye P, D'Ercole AJ. Insulin-like growth factor I protects oligodendrocytes from tumor necrosis factor-α-induced injury. Endocrinology. 1999;140:3063–3072. doi: 10.1210/endo.140.7.6754. [DOI] [PubMed] [Google Scholar]
- 50.Ye P, Carson J, D'Ercole AJ. In vivo actions of insulin-like growth factor-I (IGF-I) on brain myelination: studies of IGF-I and IGF binding protein-1 (IGFBP-1) transgenic mice. J Neurosci. 1995a;15:7344–7356. doi: 10.1523/JNEUROSCI.15-11-07344.1995. [DOI] [PMC free article] [PubMed] [Google Scholar]
- 51.Ye P, Carson J, D'Ercole AJ. Insulin-like growth factor-I influences the initiation of myelination: studies of the anterior commissure of transgenic mice. Neurosci Lett. 1995b;201:235–238. doi: 10.1016/0304-3940(95)12194-3. [DOI] [PubMed] [Google Scholar]
- 52.Ye P, Kanoh M, Zhu W, Laszkiewicz I, Royland JE, Wiggins RC, Konat G. Cyclic AMP-induced upregulation of proteolipid protein and myelin associated glycoprotein gene expression in C6 cells. J Neurosci Res. 1992;31:578–583. doi: 10.1002/jnr.490310324. [DOI] [PubMed] [Google Scholar]
- 53.Zhu Q, Couillard-Despres S, Julien J-P. Delayed maturation of regenerating myelinated axons in mice lacking neurofilaments. Exp Neurol. 1997;148:299–316. doi: 10.1006/exnr.1997.6654. [DOI] [PubMed] [Google Scholar]