

Abstract
Thalamocortical (TC) impulses potently influence the sensory neocortex, but the functional impact of individual TC neurons throughout the layers of the cortex has proved difficult to assess. Here we examine, in awake rabbits, the vertical distribution of monosynaptic currents generated in a somatosensory cortical “barrel” column by spontaneous impulses of single, topographically aligned TC neurons. We show that closely neighboring TC neurons generate widely differing patterns of monosynaptic activation within layers 4 and 6 of their aligned column. Moreover, synaptic currents generated by TC impulses with long preceding interspike intervals are greatly enhanced in both of these layers. The degree of this enhancement differs reliably among neighboring TC neurons but, for a given neuron, is very similar in layers 4 and 6. Our results indicate that in the awake state, TC synapses throughout the depth of the cortex serve as powerful filters of sensory information that reflect individual characteristics of their parent TC neuron.
Keywords: thalamocortical synapse, somatosensory cortex, cortical column, barrel, current source–density analysis, synaptic depression
All sensory information but olfaction is conveyed to the neocortex by action potentials of thalamocortical (TC) neurons. The cortex is powerfully influenced by these impulses, but the functional impact of individual TC neurons throughout the layers of the cortex has proved difficult to assess. Morphological reconstructions of single TC axons provide crucial information about the spatial distribution of TC synapses (Humphrey et al., 1985; Jensen and Killackey, 1987). However, because central synapses vary widely in both efficacy and dynamics (Gil et al., 1997,1999), morphological analyses can only hint at functional issues. Physiological studies have examined the impact of TC neurons on cortical target neurons (Reid and Alonso, 1995; Swadlow, 1995; Alonso et al., 2001; Miller et al., 2001), but only a few postsynaptic neurons have been studied with any single TC neuron, and these are usually in a single cortical layer. Here, our aim is to gain a more comprehensive view of the impact of single TC neurons throughout the depths of a cortical column. We do this by combining current source–density (CSD) analysis (Haberly and Shepherd, 1973; Freeman and Nicholson, 1975) with extracellular spike-triggered averaging (Swadlow and Gusev, 2000) to assess, in fully awake rabbits, the monosynaptic currents generated within a somatosensory cortical (S1) “barrel” column (Woolsey and Van Der Loos, 1970) by spontaneous impulses of individual, topographically aligned TC neurons. These measures reveal that closely neighboring TC neurons that project to the same cortical barrel often exert a remarkably different impact on cortical layers 4 and 6. Moreover, we show that monosynaptic currents generated by TC impulses with long preceding interspike intervals are greatly (and similarly) enhanced in both of these cortical layers, but the degree of enhancement in neighboring TC neurons differs reliably. Our results indicate that in the awake state, TC synapses throughout the depth of the cortex serve as powerful filters of sensory information that reflect individual characteristics of their parent TC neuron.
MATERIALS AND METHODS
Recordings were obtained from S1 cortical barrel columns and from their topographically aligned thalamic “barreloids” in two female adult Dutch belted rabbits. Initial surgery was performed under anesthesia using aseptic procedures. Subsequent recordings were obtained from awake subjects using procedures approved by the Institutional Animal Care and Use Committee at the University of Connecticut. Methods to ensure the comfort of our subjects have been described previously (Swadlow, 1995). Rabbits were held snugly within a stocking and placed on a foam pad. A steel bar on the head was fastened to a restraining device in a manner that minimized stress on the neck.
Thalamic microelectrodes were constructed of quartz-insulated, platinum–tungsten filaments (Reitboeck, 1983) with a diameter of 40 μm. Filaments were pulled to a taper and sharpened to a fine tip. A concentric array of seven such electrodes (spaced at ∼160 μm) was chronically implanted within the ventrobasal (VB) thalamus after receptive field mapping. Electrodes were guided within stainless steel tubes (160 μm outer diameter) and controlled by seven miniature microdrives. We could often record from the same ventrobasal thalamic barreloid (which represents a single vibrissa) with two to three microelectrodes. All of the TC neurons studied had receptive fields that were clearly dominated by a single vibrissa.
Cortical recordings were obtained using 16 channel silicone probes (University of Michigan Center for Neural Communication Technology, Ann Arbor, MI). Probe sites were separated vertically by 100 μm and had impedances of 1–2 MΩ. Topographic alignment of thalamic and cortical recording sites was achieved by receptive field mapping and was confirmed by spike-triggered averages of cortical field potentials elicited by the TC neurons (Swadlow and Gusev, 2000). After alignment and mapping of the barrel, the 16 channel probe was placed into the estimated center of the barrel (based on maximal responses from the principle vibrissa and minimal responses from surrounding vibrissas). We were careful to ensure that the probe was aligned normal to the cortical surface so sites remained within the same barrel column in layers 4 and 6. The probe was lowered until deeper channels registered long-latency antidromic spikes to microstimulation via thalamic microelectrodes [indicative of layer 6 (Swadlow, 1989)] and was cemented into place. Probes retained good recording characteristics and stable impedances for 24–48 hr, allowing two to three lengthy recording sessions, during which several topographically aligned TC neurons were usually studied.
Each cortical probe site was filtered at 3 Hz to 1.9 kHz (one-half amplitude) and sampled continuously at 5 kHz. Spike data from TC neurons and field potential data were acquired using a “Plexon” data acquisition system (Dallas, TX). Spike-triggered averages of cortical field activity were generated from the spontaneous activity of TC neurons. For the “control” record, we used all spikes in the data set except those occurring within 5 msec of another spike. We eliminated spikes with short interspike intervals to avoid generating compound averages from multiple, high-frequency spikes. When examining the effects of the preceding interval on spike-triggered potentials, we analyzed only TC spikes that were: (1) preceded by interspike intervals of a given value and (2) not followed by another spike within 5 msec. The one-dimensional CSD was calculated from the second spatial derivative of the field potential profile using the general methods ofFreeman and Nicholson (1975): (∂2Φ/∂z2) = [Φ(z + nΔz) − 2Φ(z) + Φ(z −nΔz)]/(nΔz)2, where Φ is the field potential, z is the coordinate perpendicular to the layers, Δz is the sampling interval (100 μm in the present study), and nΔz is the differentiation grid (n = 2 in the present study). The differentiation grid n = 2 is equivalent to spatial smoothing and allows reduction of high spatial frequency noise. To obtain upper and lower boundary sites, we used an extrapolation method that assumes no additional decay in the field potential above and below the uppermost and lowermost recording sites, respectively (Vaknin et al., 1988). This was justified because our field potentials were close to zero at the extreme recording sites, and no potential reversals are expected above or below these sites. In CSD traces, current sinks are indicated by downward deflections and sources by upward deflections. To facilitate visualization of CSD profiles, we generated color image plots using linear interpolation along the depth axis.
RESULTS
In each of six barrel columns, we examined the vertical distribution of field potentials and currents that were generated by the spontaneous spikes of two to six aligned TC neurons.
The extracellular fields and currents generated by TC impulses
Figure 1Aillustrates a case in which two microelectrodes recorded from six TC neurons of a single thalamic barreloid. Three TC neurons were studied on each microelectrode (160 μm horizontal separation), and the total vertical distance between recordings made on each electrode was <80 microns. The cortical probe is near the center of the aligned barrel column. A CSD trace from layer 4 is shown at the right (Fig.1A, trace 8 from N1, below). Figure1B (left side, N1) shows responses generated within the aligned column by one TC neuron (Fig.1A, N1). Spike-triggered field potentials and CSD analysis of these field potentials are shown. Responses during the first few milliseconds after the TC spike consist of two components: (1) an initial biphasic or triphasic “axon-terminal” component (Swadlow and Gusev, 2000) (latency of <1 msec), and (2) a longer latency (usually 1.2–1.8 msec), negative-going potential. We conclude (see Discussion) that this latter component reflects a current sink resulting from monosynaptic TC excitation. For this neuron, the axon-terminal potential had a latency of 0.81 msec and was clearly isolated from the dominant postsynaptic effect, a current sink, with an onset latency of 1.58 msec.
Fig. 1.

A, An illustrative case. Two independent microelectrodes in a thalamic barreloid are shown. During two recording sessions, three TC neurons were studied via each electrode (N1–N6). The cortical probe is in the aligned barrel, with deeper sites within layer 6. An example of CSD traces showing the axon-terminal potential and the postsynaptic current sink (arrows) and the synaptic delay (time between the onset of these two potentials) is shown on the right. Thevertical dashed line indicates the time of the TC spike.B, N1 and N2 show spike-triggered field and CSD profiles generated by two TC neurons (N1 and N2 in A) recorded simultaneously via one of the microelectrodes. The vertical dashed lines indicate the time of the TC spike. Colorized CSDs are shown below (color intensities reflect source and sink amplitudes).Bottom right, CSD profile generated by an air puff (200 presentations, note the long time base). Horizontal arrows in colorized CSDs here and in Figure 2 denote sites known to be within layer 6 (see Materials and Methods). Gains for N1 and N2 are identical and are 20 times higher than those used for the air-puff stimulus.
The laminar distribution of postsynaptic current sinks generated by TC impulses
The major postsynaptic current sink generated by the above TC neuron was centered in layer 4. However, three of six TC neurons projecting to this barrel generated significant sinks in layer 6. N2 (Fig. 1) shows profiles of one such neuron (Fig. 1A, N2). This neuron was recorded simultaneously and on the same microelectrode as the TC neuron shown in N1. Thus, these two TC neurons were close neighbors and projected to the same barrel column but generated very different patterns of current within the column under identical recording conditions. The major postsynaptic response extends deeper in N2 (∼100 μm) than in N1. Moreover, there is a substantial sink deep within the cortex, in layer 6. Figure 1B(right) shows the CSD profile generated to stimulation of the principle vibrissa (gain is 1/20 that used in N1 and N2). Note the strong sink in the middle of the cortex, which we assume to be centered within layer 4. A weaker current sink is seen in layer 6 (Fig.1B, arrows, see Materials and Methods).
Figure 2 shows CSD profiles for all six TC neurons that projected to the column shown in Figure1A. N1 and N2 show the same CSD profiles (but compressed) shown in Figure 1, and N3–N6 show the profiles generated by the four other TC neurons. Of the 24 TC neurons that we studied, 14 generated postsynaptic current sinks that were limited to layer 4 (as in Fig. 2, N1, N4, N6). Nine of the remaining TC neurons showed strong current sinks in layer 4 and weaker (seven cases, e.g., N2 and N3) or similarly strong (two cases) sinks in layer 6. In only one case (Fig.2, N5) was a postsynaptic current sink restricted to layer 6.
Fig. 2.

CSD profiles for six TC neurons projecting to a single column (same as in Fig. 1A). N1–N3 were recorded on one microelectrode, and N4–N6 were recorded on the second electrode. The profile generated by the air puff is shown for reference. Gain (and color) settings for all TC profiles are identical and are 20 times higher than those used for the air-puff stimulus. Thevertical dashed lines indicate the time of the TC action potential.
Dynamics of postsynaptic currents generated by a TC impulse
The postsynaptic impact of a TC impulse depended strongly on the duration of the preceding interspike interval. Figure3A shows CSD profiles of a TC neuron that generated powerful sinks in both layer 4 and layer 6 of the aligned barrel. The control profile is shown on the left. The center CSD profile was generated by the same TC neuron but was limited to impulses with preceding interspike intervals of 250–500 msec. Note that the amplitude of the postsynaptic sinks in both layers 4 and 6 (Fig. 3A, traces magnified in insets) has increased substantially. The amplitude of the axon-terminal potential, however, is unchanged (Fig. 3A, arrows). Theright side of Figure 3A shows the CSD profile generated by the initial spikes of TC “bursts.” These impulses have no preceding impulse for ≥100 msec but are followed by another TC impulse at intervals of <4 msec. Note the enhanced current sink in both cortical layers. Figure 3B shows, for this same TC neuron, the relationship between the preceding interspike interval and the magnitude of the axonal-terminal potential (left) and postsynaptic current sinks (right) as a function of cortical depth. For this latter measure (and for those presented in Fig.4, below), we integrated the value of the current sink occurring only during the initial 1 msec of the postsynaptic response to avoid the possibility of including disynaptic currents. The amplitude of the axon-terminal potential is not affected by interspike interval, but the magnitude of the postsynaptic responses in both layers increases with increasing interspike intervals.
Fig. 3.
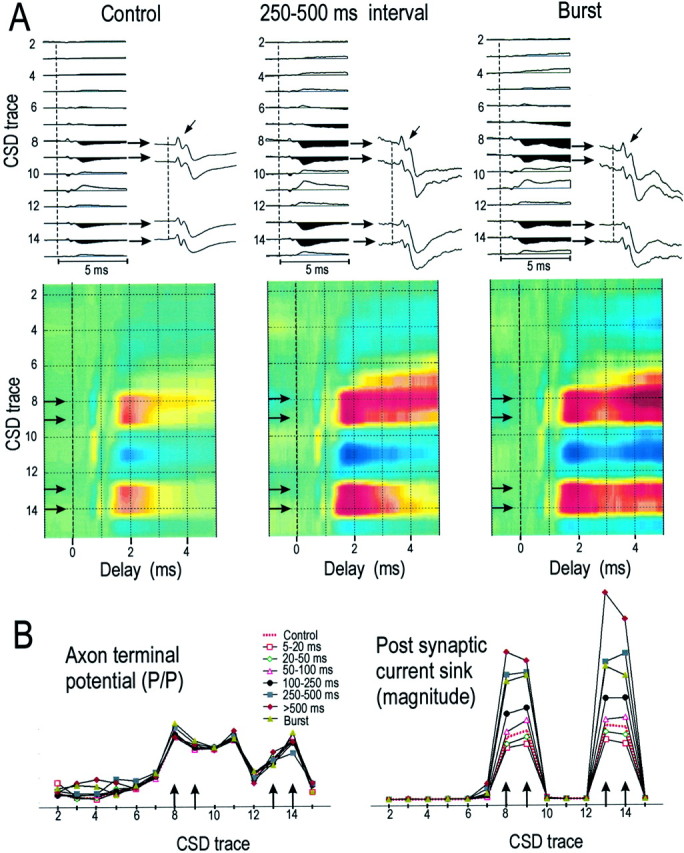
A, CSD profiles for another TC neuron. The control profile is shown on the left(n = ∼120,000 TC spikes), with an amplified view (gain is 3.5 times greater) of the responses in layer 4 (top horizontal arrows) and layer 6 (bottom horizontal arrows). Oblique arrows indicate axon-terminal responses. The colorized CSD profile is shown below.Middle profiles were generated by TC spikes with preceding interspike intervals of 250–500 msec (n= 2290). Profiles on the right were generated by initial spikes of TC bursts (n = 2427). Gain settings and color intensities for all CSDs are identical. The vertical dashed lines indicate the time of the TC action potential.B, The amplitude (peak–peak) of the axon-terminal response (left) and the magnitude of the initial 1 msec of the postsynaptic current sink (right) were plotted at different CSD sites as a function of preceding interspike interval. Control response and the response to the initial spike in a TC burst are also plotted.
Fig. 4.
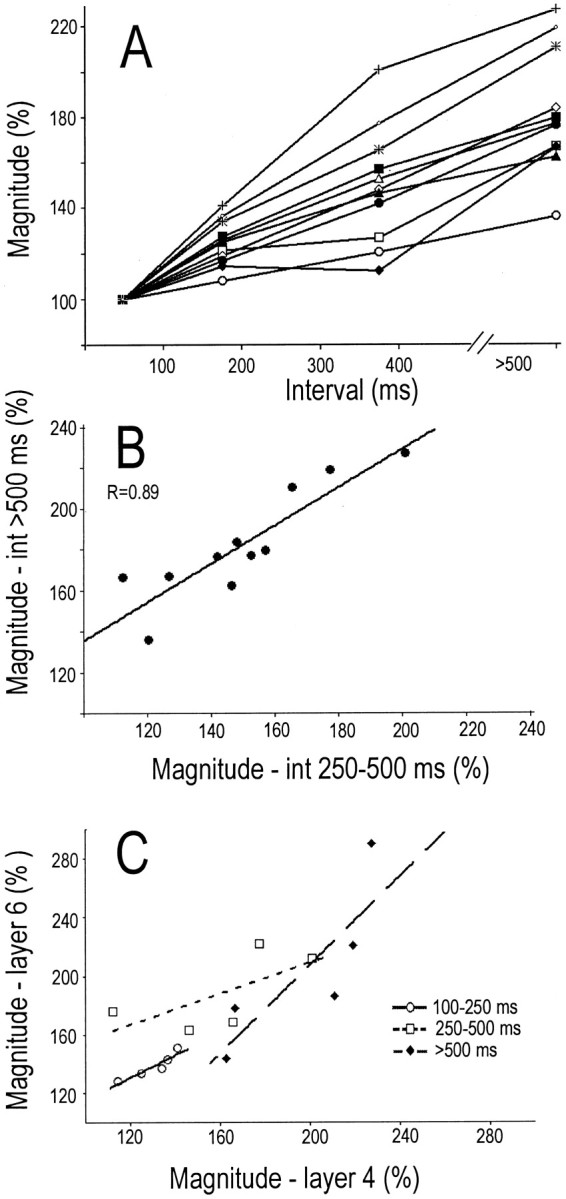
A, For 11 TC neurons, the magnitude of postsynaptic current sinks generated in layer 4 by spikes with various preceding interspike intervals. B, For these same 11 neurons, the correlation between the response to TC spikes with preceding intervals of 250–500 msec and with preceding interspike intervals of >500 msec. C, The relationship for five TC neurons between the magnitude of the response in layers 4 and 6 at three preceding interspike intervals.
Qualitatively similar results were obtained in each of 10 additional cases. For each TC neuron, impulses with long preceding intervals generated stronger postsynaptic responses than did control impulses. However, the degree of enhancement varied considerably among different TC neurons. Figure 4A shows, for each of these 11 TC neurons, the magnitude of the postsynaptic sink generated in layer 4 by impulses with various preceding interspike intervals. For each TC neuron, the values generated are normalized against the value for impulses with short interspike intervals (<100 msec). For some TC neurons, current sinks generated by spikes with the longest preceding intervals (>500 msec) were more than two times greater than those generated at the shortest intervals. Other TC neurons showed much less enhancement, and there was a strong correlation between the enhancements generated at the two longest intervals (Fig.4B, 250–500 vs >500 msec; r = +0.89; p = < 0.001). This shows that differences among TC neurons in the amplitude of the enhanced response reflect a stable feature of the TC neuron.
The above results show stable differences among TC neurons in the dynamics of TC transmission. We subsequently asked whether, for a given TC neuron, the magnitude of the enhancement seen in layer 4 was similar to the magnitude seen in layer 6. The case illustrated in Figure 3shows that postsynaptic current sinks generated in both layers 4 and 6 are similarly enhanced at longer interspike intervals. This was found for each of the five TC neurons that we could adequately test. Figure4C (filled diamonds) shows, for each of these TC neurons, the postsynaptic enhancement seen in layer 4 and in layer 6 at interspike intervals of >500 msec. There is a positive correlation between the strength of the enhancement seen in these two layers (r = 0.80). Similar positive relationships were obtained for each of these five TC neurons at interspike intervals of 250–500 msec (r = 0.66) and at intervals of 100–250 msec (r = 0.83). The results of meta-analysis of these separate correlations (Johnson and Eagly, 2000) are highly significant (p < 0.004). These results show that the individual differences among TC neurons seen in the temporal dynamics of TC transmission apply equally to layers 4 and 6. Moreover, the slope of ∼1 in the above correlations indicates that the magnitude of the enhanced responses in these two layers is very similar.
DISCUSSION
The extracellular currents under study
Central to this study is the negative field potential within layers 4 and/or 6 that follows the axon-terminal potential. Because of its latency and focal depth distribution and because it is (1) reversibly blocked by AMPA/kainate antagonists and (2) sharply restricted in horizontal extent to a single S1 barrel (Swadlow and Gusev, 2000), we conclude that this potential reflects an extracellular current sink generated by monosynaptic TC activation. Thus, it serves as an index of all monosynaptic excitatory currents generated by the impulses of this single TC neuron. The delay between the onset of the axon-terminal response and the onset of the postsynaptic current sink (means = 0.72 and 0.68 msec in layers 4 and 6, respectively) supports this interpretation. Although synaptic currents are generally thought to be the main contributors to cortical field potentials (Mitzdorf, 1985), local action potentials undoubtedly made some contribution to the observed postsynaptic current sinks.
For several reasons, we think it highly unlikely that the observed spike-triggered current profiles reflect significant contributions from neighboring TC neurons that are firing in synchrony with the TC neuron under study (cf. Alonso et al., 1996; Hughes et al., 2002): (1) Both the presynaptic (axonal) and postsynaptic depth profiles generated by closely neighboring TC neurons were often highly distinct (Figs. 1, 2). If neighboring, synchronously firing TC neurons were contributing significantly to the spike-triggered depth profiles, results from different TC neurons would be more similar. (2) The early components of the spike-triggered current profiles display very high temporal precision. Thus, a recent analysis showed that the rise times (10–90%) of the axon-terminal and monosynaptic potentials were only 0.23 and 0.68 msec, respectively (Swadlow and Gusev, 2000), and similar results were obtained in the present study. In contrast, even “precisely correlated firing” between dorsal LGN neurons (Alonso et al., 1996) occurs at a longer time scale (±1 msec). Thus, if synchronously firing TC neurons were contributing significantly to the observed profiles, the time course of these very rapid events would have been blurred considerably. (3) Finally, we have recorded from >50 pairs of VB neurons located within the same thalamic barreloid (H. A. Swadlow and A. G. Gusev, unpublished observations) and have observed only weakly synchronous activity (timescale of many milliseconds).
The laminar distribution of current sinks: relationship to TC bouton distribution
Physiological studies based on electrical stimulation of the thalamus have generally reported synaptic input to layers 4 and 6 (Bullier and Henry, 1979; Ferster and Lindstrom, 1983; Castro-Alamancos and Connors, 1996). However, synaptic responses generated by thalamic stimulation are difficult to interpret because of synaptic input mediated by the intracortical collaterals of antidromically activated corticothalamic neurons (cf. Ferster and Lindstrom, 1985). Morphological studies of TC boutons in the somatosensory and visual system show strong TC input to layer 4 and deep layer 3 and a lesser input to layer 6 (Ferster and LeVay, 1978; Jensen and Killackey, 1987). Single-fiber labeling studies confirm this general result but show unexplained heterogeneity in the laminar arborization pattern among different TC axons. For example, Humphrey et al. (1985) found that different dorsal LGN neurons distribute 1% to >20% of their boutons within layer 6 but were “unable to relate this layer V1 variability to variability in any other anatomical or physiological feature.” Similar variability among TC neurons in the layer 6 projection is seen in the somatosensory barrel system (Jensen and Killackey, 1987; Pierret et al., 2000). Consistent with these studies, our results showed layer 4 to be the dominant site of monosynaptic current sinks, with most TC neurons generating sinks that were limited to this layer. The remaining neurons showed current sinks of variable magnitude within layer 6. Thus, our results confirm a highly heterogeneous input to layer 6. In addition, we show that even closely neighboring TC neurons can generate remarkably different patterns of current sinks within layers 4 and 6 (Fig. 1).
Dynamics of thalamocortical transmission in layers 4 and 6: the effects of interspike interval
The initial impulse of a thalamic burst generates an enhanced response in putative inhibitory interneurons of S1 (Swadlow and Gusev, 2001). Thalamic bursts are preceded by long interspike intervals (>100 msec), and this interval is crucial for generating the enhanced cortical response. The present analysis extends the above finding in two significant ways: (1) These results are not limited to TC synapses onto inhibitory interneurons. TC impulses with long preceding intervals generated current sinks that were much stronger than those with short preceding intervals. These sinks reflect the summed activity of all the synapses made within the column by a given TC neuron. Because the great majority of these synapses are onto dendritic spines (e.g., 83% in rat visual cortex) (Peters and Feldman, 1976), we conclude that much of the enhanced current flow is attributable to activation (largely subthreshold) of excitatory cortical neurons. (2) Enhanced cortical activation occurs in layer 6 as well as in layer 4, and the magnitude of the effect within these layers is similar. This finding is significant, because TC impulses with long preceding interspike intervals are more likely to activate corticothalamic “feedback” neurons of layer 6, which receive substantial synaptic input from TC terminals (White and Hersch, 1982).
TC synapses in vitro exhibit paired-pulse depression that lasts for hundreds of milliseconds (Gil et al., 1997), and similar effects have been observed in vivo (Swadlow and Gusev, 2001;Castro-Alamancos and Oldford, 2002; Chung et al., 2002). Because of this, the high spontaneous activity of these neurons in intact adults (10–20 Hz in the present study) should result in a chronic state of synaptic depression. Our results are consistent with the notion that long intervals preceding TC spikes allow recovery from such activity-dependent depression, and that such spikes should evoke a maximum EPSP in cortical targets (Ramcharan et al., 2000; Swadlow and Gusev, 2001).
The different TC axons studied here showed enhancements of 35% to >100% in the magnitude of the postsynaptic response seen at long interspike intervals. The extent of this variability is consistent with findings in vitro, where similar variability is seen in the magnitude of paired-pulse depression observed at different TC synapses [Gil et al. (1997), their Fig. 2C]. It is important to know whether this variability is at the level of the specific synaptic contact under study or at the level of the TC neuron. Our results show that much of this variability can be globally related to the particular TC neuron under study. Some TC neurons form synapses that are, on average, more depressing than those of other TC neurons, and these differences are maintained over a range of preceding interspike intervals (Fig. 4A,B). Moreover, for a given TC neuron, the dynamics seen in layers 4 and 6 are very similar but differ consistently from the dynamics seen in other TC neurons.
Finally, these results show that TC synapses in layers 4 and 6 may serve as significant filters of sensory information. Sensory information carried by impulses with long preceding interspike intervals, including the initial spikes of a thalamic burst, have a special status: they generate stronger postsynaptic responses than impulses with short preceding intervals. Because of this potent cortical response in layers 4 and 6, these findings are consistent with suggestions that thalamic bursts could serve as a “wake-up” call to the cortex (Sherman and Guillery, 1996; Sherman, 2001). They are also consistent with suggestions that a sensory “interval code” may be decoded through mechanisms of synaptic depression or facilitation (Gerstner et al., 1997; Goldman et al., 1999; Reich et al., 2000). Our results show that sensory information encoded within the interval distribution of TC impulses may be decoded by the amplitude of the postsynaptic currents generated by those impulses. Thus, at the TC synapse, an interval code may be transformed into an “amplitude code,” and the nature of this transform may differ considerably, reflecting individual characteristics of the parent TC neuron. How (or whether) the cortex uses this amplitude-modulated message in retrieving encoded aspects of the environment is an open question.
Footnotes
This work was supported by grants from the National Science Foundation (IBN-0077694), the National Institute of Mental Health (MH-64024), and the Russian Foundation of Basic Research (00-04-49163). Multichannel probes were provided by the University of Michigan Center for Neural Communication Technology (National Institutes of Health Grant P41-RR09754). We thank J.-M. Alonso, K. Lukatela, and H. L. Read for insightful suggestions and V. Serdyukov for expert hardware and software development.
Correspondence should be addressed to Dr. H. A. Swadlow, Department of Psychology (U-20), The University of Connecticut, Storrs, CT 06269. E-mail: Swadlow@psych.psy.uconn.edu.
REFERENCES
- 1.Alonso JM, Usrey WM, Reid RC. Precisely correlated firing in cells of the lateral geniculate nucleus. Nature. 1996;383:815–819. doi: 10.1038/383815a0. [DOI] [PubMed] [Google Scholar]
- 2.Alonso JM, Usrey WM, Reid RC. Rules of connectivity between geniculate cells and simple cells in cat primary visual cortex. J Neurosci. 2001;21:4002–4015. doi: 10.1523/JNEUROSCI.21-11-04002.2001. [DOI] [PMC free article] [PubMed] [Google Scholar]
- 3.Bullier J, Henry GH. Laminar distribution of first-order neurons and afferent terminals in cat striate cortex. J Neurophysiol. 1979;42:1271–1281. doi: 10.1152/jn.1979.42.5.1271. [DOI] [PubMed] [Google Scholar]
- 4.Castro-Alamancos MA, Connors BW. Spatiotemporal properties of short-term plasticity in sensorimotor thalamocortical pathways of the rat. J Neurosci. 1996;16:2767–2779. doi: 10.1523/JNEUROSCI.16-08-02767.1996. [DOI] [PMC free article] [PubMed] [Google Scholar]
- 5.Castro-Alamancos MA, Oldford E. Cortical sensory suppression during arousal is due to the activity-dependent depression of thalamocortical synapses. J Physiol (Lond) 2002;541:319–331. doi: 10.1113/jphysiol.2002.016857. [DOI] [PMC free article] [PubMed] [Google Scholar]
- 6.Chung S, Lin X, Nelson SB. Short-term depression at thalamocortical synapses contributes to rapid adaptation of cortical sensory responses in vivo. Neuron. 2002;34:437–446. doi: 10.1016/s0896-6273(02)00659-1. [DOI] [PubMed] [Google Scholar]
- 7.Ferster D, Levay S. The axonal arborizations of lateral geniculate neurons in the striate cortex of the cat. J Comp Neurol. 1978;182:923–944. doi: 10.1002/cne.901820510. [DOI] [PubMed] [Google Scholar]
- 8.Ferster D, Lindstrom S. An intracellular analysis of geniculo-cortical connectivity in area 17 of the cat. J Physiol (Lond) 1983;342:181–215. doi: 10.1113/jphysiol.1983.sp014846. [DOI] [PMC free article] [PubMed] [Google Scholar]
- 9.Ferster D, Lindstrom S. Synaptic excitation of neurons in area 17 of the cat by intracortical axon collaterals of cortico-geniculate cells. J Physiol (Lond) 1985;367:233–252. doi: 10.1113/jphysiol.1985.sp015822. [DOI] [PMC free article] [PubMed] [Google Scholar]
- 10.Freeman JA, Nicholson C. Experimental optimization of current source-density technique for anuran cerebellum. J Neurophysiol. 1975;38:369–382. doi: 10.1152/jn.1975.38.2.369. [DOI] [PubMed] [Google Scholar]
- 11.Gerstner W, Kreiter AK, Markram H, Herz AVM. Neural codes: firing rates and beyond. Proc Natl Acad Sci USA. 1997;94:12740–12741. doi: 10.1073/pnas.94.24.12740. [DOI] [PMC free article] [PubMed] [Google Scholar]
- 12.Gil Z, Connors BW, Amitai Y. Differential regulation of neocortical synapses by neuromodulators and activity. Neuron. 1997;19:679–686. doi: 10.1016/s0896-6273(00)80380-3. [DOI] [PubMed] [Google Scholar]
- 13.Gil Z, Connors BW, Amitai Y. Efficacy of thalamocortical and intracortical synaptic connections: quanta, innervation, and reliability. Neuron. 1999;23:385–397. doi: 10.1016/s0896-6273(00)80788-6. [DOI] [PubMed] [Google Scholar]
- 14.Goldman MS, Nelson SB, Abbot LF. Decorrelation of spike trains by synaptic depression. Neurocomputing. 1999;26–27:147–153. [Google Scholar]
- 15.Haberly LB, Shepherd GM. Current-density analysis of summed evoked potentials in opossum prepyriform cortex. J Neurophysiol. 1973;36:789–803. doi: 10.1152/jn.1973.36.4.789. [DOI] [PubMed] [Google Scholar]
- 16.Hughes SW, Blethyn KL, Cope DW, Crunelli V. Properties and origins of spikelets in thalamocortical neurons in vitro. Neuroscience. 2002;110:395–401. doi: 10.1016/s0306-4522(01)00577-2. [DOI] [PubMed] [Google Scholar]
- 17.Humphrey AL, Sur M, Uhlrich DJ, Sherman SM. Projection patterns of individual X- and Y-cell axons from the lateral geniculate nucleus to cortical area 17 in the cat. J Comp Neurol. 1985;233:159–189. doi: 10.1002/cne.902330203. [DOI] [PubMed] [Google Scholar]
- 18.Jensen KF, Killackey HP. Terminal arbors of axons projecting to the somatosensory cortex of the adult rat. I. The normal morphology of specific thalamocortical afferents. J Neurosci. 1987;7:3529–3543. doi: 10.1523/JNEUROSCI.07-11-03529.1987. [DOI] [PMC free article] [PubMed] [Google Scholar]
- 19.Johnson BT, Eagly AH. Quantitative synthesis of social psychological research. In: Reis HT, Judd CM, editors. Handbook of research methods in social and personality psychology. Cambridge UP; London: 2000. pp. 496–528. [Google Scholar]
- 20.Miller L, Escabi MA, Read HL, Schreiner CE. Functional convergence of response properties in the auditory thalamocortical system. Neuron. 2001;32:151–160. doi: 10.1016/s0896-6273(01)00445-7. [DOI] [PubMed] [Google Scholar]
- 21.Mitzdorf U. Current source-density method and application in cat cerebral cortex. Investigation of evoked potentials and EEG-phenomena. Physiol Rev. 1985;65:37–100. doi: 10.1152/physrev.1985.65.1.37. [DOI] [PubMed] [Google Scholar]
- 22.Peters A, Feldman ML. The projection of the lateral geniculate nucleus to area 17 of the rat cerebral cortex. I. General description. J Neurocytol. 1976;5:63–84. doi: 10.1007/BF01176183. [DOI] [PubMed] [Google Scholar]
- 23.Pierret T, Lavallee P, Deschenes M. Parallel streams for the relay of vibrissal information through thalamic barreloids. J Neurosci. 2000;20:7455–7462. doi: 10.1523/JNEUROSCI.20-19-07455.2000. [DOI] [PMC free article] [PubMed] [Google Scholar]
- 24.Ramcharan EJ, Cox CL, Zhan XJ, Sherman SM, Gnadt JW. Cellular mechanisms underlying activity patterns in the monkey thalamus during visual behavior. J Neurophysiol. 2000;84:1982–1987. doi: 10.1152/jn.2000.84.4.1982. [DOI] [PubMed] [Google Scholar]
- 25.Reich DS, Mechler F, Purpura KP, Victor JD. Interspike intervals, receptive fields, and information encoding in primary visual cortex. J Neurosci. 2000;20:1964–1974. doi: 10.1523/JNEUROSCI.20-05-01964.2000. [DOI] [PMC free article] [PubMed] [Google Scholar]
- 26.Reid RC, Alonso JM. Specificity of monosynaptic connections from thalamus to visual cortex. Nature. 1995;378:281–284. doi: 10.1038/378281a0. [DOI] [PubMed] [Google Scholar]
- 27.Reitboeck HJ. Fiber microelectrodes for electrophysiological recordings. J Neurosci Methods. 1983;8:249–262. doi: 10.1016/0165-0270(83)90038-9. [DOI] [PubMed] [Google Scholar]
- 28.Sherman SM. A wake-up call from the thalamus. Nat Neurosci. 2001;4:344–346. doi: 10.1038/85973. [DOI] [PubMed] [Google Scholar]
- 29.Sherman SM, Guillery RW. Functional organization of thalamocortical relays. J Neurophysiol. 1996;76:1367–1395. doi: 10.1152/jn.1996.76.3.1367. [DOI] [PubMed] [Google Scholar]
- 30.Swadlow HA. Efferent neurons and suspected interneurons in S-1 vibrissa cortex of the awake rabbit: receptive fields and axonal properties. J Neurophysiol. 1989;62:288–308. doi: 10.1152/jn.1989.62.1.288. [DOI] [PubMed] [Google Scholar]
- 31.Swadlow HA. The influence of VPM afferents on putative inhibitory interneurons in S1 of the awake rabbit: evidence from cross-correlation, microstimulation, and latencies to peripheral sensory stimulation. J Neurophysiol. 1995;73:1584–1599. doi: 10.1152/jn.1995.73.4.1584. [DOI] [PubMed] [Google Scholar]
- 32.Swadlow HA, Gusev AG. The influence of single VB thalamocortical impulses on barrel columns of rabbit somatosensory cortex. J Neurophysiol. 2000;83:2803–2813. doi: 10.1152/jn.2000.83.5.2802. [DOI] [PubMed] [Google Scholar]
- 33.Swadlow HA, Gusev AG. The impact of “bursting” thalamic impulses at a neocortical synapse. Nat Neurosci. 2001;4:402–408. doi: 10.1038/86054. [DOI] [PubMed] [Google Scholar]
- 34.Vaknin G, DiScenna PG, Teyler TJ. A method for calculating current source density (CSD) analysis without resorting to recording sites outside the sampling volume. J Neurosci Methods. 1988;24:131–135. doi: 10.1016/0165-0270(88)90056-8. [DOI] [PubMed] [Google Scholar]
- 35.White EL, Hersch SM. A quantitative study of thalamocortical and other synapses involving the apical dendrites of corticothalamic projection cells in mouse SmI cortex. J Neurocytol. 1982;11:137–157. doi: 10.1007/BF01258009. [DOI] [PubMed] [Google Scholar]
- 36.Woolsey TA, Van Der Loos H. The description of a cortical field composed of discrete cytoarchitectonic units. Brain Res. 1970;17:205–242. doi: 10.1016/0006-8993(70)90079-x. [DOI] [PubMed] [Google Scholar]