

Abstract
Thalamic relay nuclei transmit basal ganglia output to the frontal cortex, forming the last link in corticobasal ganglia circuitry. The thalamus regulates cortical activity through differential laminar connections, providing not only feedback, but also initiating “feedforward” loops, via nonreciprocal projections, that influence higher cortical areas. This study examines the organization of thalamic connections with cortex from basal ganglia relay nuclei, including ventral anterior (VA), ventral lateral (VL), and mediodorsal (MD) nuclei, in the Macaque monkey. Anterograde and bidirectional tracer injections ([3H]-amino acids, dextran conjugates of Fluorescein, Lucifer Yellow or FluoroRuby, or wheat germ agglutinin) into discrete VA/VL, MD, and frontal cortical sites demonstrate specific thalamocortical connections. VL projections target caudal motor areas (primary, supplementary, and caudal premotor areas), whereas VA projections target more rostral premotor areas (including cingulate and presupplementary motor areas) and MD projects to dorsolateral and orbital prefrontal cortices. Thalamocortical projections innervate cortical layers I and III, and to a lesser extent, layer V. In motor areas layer I projections are more extensive than those to layer III (and V). The complex laminar organization of projections from specific thalamic sites suggests differential regulation of cortical function. Injections of bidirectional tracers into thalamic and frontal cortical sites also show that in comparison to thalamocortical projections, corticothalamic projections to VA–VL and MD are more widespread. These findings demonstrate both reciprocal and nonreciprocal components to the thalamo-cortico-thalamic relay. Together, these experiments indicate a dual role for VA–VL and MD nuclei: (1) to relay basal ganglia output within specific cortical circuits and (2) to mediate information flow between cortical circuits.
Keywords: thalamocortical, corticothalamic, ventral anterior, ventral lateral, mediodorsal, frontal cortex
Thalamic relay nuclei form a crucial link between the basal ganglia and cortex by transmitting basal ganglia output to specific frontal cortical areas (Schell and Strick, 1984;Goldman-Rakic and Porrino, 1985; Ilinsky et al., 1985; Wiesendanger and Wiesendanger, 1985; Matelli et al., 1989; Nakano et al., 1992; Ray and Price, 1993; Matelli and Luppino, 1996). Parallel models of basal ganglia circuitry indicate that these thalamocortical relays maintain functionally distinct corticobasal ganglia loop systems through projections back to the cortical area of origin (Alexander et al., 1986; Parent and Hazrati, 1995). In most models of basal ganglia function, the thalamocortical projection is treated as a simple “way station” back to cortex. However, in other systems the concept that thalamic relay nuclei passively transfer output from afferent systems to the cortex has undergone important revisions in recent years, emphasizing thalamic processing of afferent inputs and its influence on cortical activity (Sherman and Guillery, 1996). Studies show that in addition to relaying subcortical information to cortex, thalamocortical circuits participate in the modulation and regulation of cortical–cortical activity (Jones, 1985; Sherman and Guillery, 1996;Castro-Alamancos and Connors, 1997). This regulation can be accomplished in part by projections to different cortical layers which are, in turn, associated with specific cortical and subcortical connections (Jones, 1985). Thus thalamocortical projections to different layers can differentially affect subpopulations of cortical neurons and consequently their output. Critical issues regarding thalamic influence on cortex, therefore include not only the distribution of specific regions of thalamocortical projections, but also the laminar organization of those terminations.
The basal ganglia-cortical system is often considered a one-way circuit with the thalamocortical pathway the last link (Alexander et al., 1986;Parent and Hazrati, 1995). However, thalamic relay nuclei, including the ventral anterior (VL), ventral lateral (VA), and the medial dorsal (MD) nuclei, also receive massive cortical input (Künzle, 1976,1978; Künzle and Akert, 1977; Russchen et al., 1987; Siwek and Pandya, 1991; Ray and Price, 1993). Thus, although the basal ganglia thalamic relay nuclei have specific cortical projections that terminate in motor, cognitive, and limbic cortical areas, our understanding of this system depends not only on the thalamocortical projections, but on the cortical input to these thalamic relay nuclei. The corticothalamic projection has 10 times the density of the thalamocortical projection in sensory systems (Jones, 1985). There are two components to this input, a reciprocal one, and a nonreciprocal one (Catsman-Berrevoets and Kuypers, 1978; Hoogland et al., 1987; Murphy and Sillito, 1996;Deschenes et al., 1998; Darian-Smith et al., 1999; Murphy et al., 1999). The nonreciprocal component provides a feedforward mechanism in which the thalamus influences higher cortical areas (Sherman and Guillery, 1996; Jones, 1998b). One goal of this study was to determine the relationship between the thalamocortical and corticothalamic connections of the basal ganglia relay nuclei to understand how this complex circuit regulates cortical activity. Furthermore, we recently demonstrated that the VA–VL and MD thalamic nuclei project directly to the striatum (McFarland and Haber, 2000, 2001). Because these nuclei are affected by their cortical input, it further emphasizes the importance of determining what that input is. The aims of this study were to: (1) determine the cortical projections and laminar distribution of terminal fields from specific basal ganglia thalamic relay nuclei and (2) to determine whether there is a nonreciprocal component to the corticothalamic projection to the VA–VL and MD.
MATERIALS AND METHODS
To examine the organization of thalamocortical-thalamic connections from basal ganglia relay nuclei, we performed two sets of tracing experiments. The first set involved anterograde and bidirectional tracer injections into the ventral anterior, ventral lateral, and mediodorsal thalamic nuclei (Fig.1). In each case, the cortical distribution and laminar pattern of terminal fibers were charted. In cases that used a bidirectional tracer (108b, 104, 31, and 122), we also examined the distribution of retrogradely labeled corticothalamic cells and compared it with that of thalamocortical terminals in the same case. The second set of experiments involved a series of bidirectional tracer injections into frontal cortical areas that receive basal ganglia output from these thalamic relay nuclei. These cases were charted for cell and fiber labeling in the thalamus.
Fig. 1.

Summary of thalamic and cortical injection sites.A, Rostral-caudal, coronal hemisections through the thalamus illustrating the relative location of VA–VL and MD injection sites. B, Representative coronal hemisections through the center of cortical injections. AD, Anterior dorsal nucleus (n.); AM, anterior medial n.; AV, anterior ventral n.; MD, mediodorsal n.;CL, central lateral n.; CM, center median n.; Pc, paracentral n.; Pf, parafascicular n.; R, reticular n.; Rh, rhomboid n.; VA, ventral anterior pars parvocellular n.;VAmc, ventral anterior pars magnocellularis n.;VLc, ventral lateral pars caudalis n.;VLm, ventral lateral pars medialis n.;VLo, ventral lateral pars oralis n.; VPI, ventral posterior inferior n.; VPL, ventral posterior lateral n.; VPM, ventral posterior medial n.;X, Olszewski's Area X; mtt, mammilothalamic tract; sm, striae medularis.
Surgery and tissue preparation. Twenty adult macaque monkeys (Macaca nemestrina) were used for these tracing experiments. All procedures were approved by the University Committee on Animal Resources. Before surgery, monkeys were tranquilized by intramuscular injection of ketamine (10 mg/kg). Anesthesia was maintained by intravenous injection of pentobarbital (initial dose 20 mg/kg, i.v. and maintained as needed). Temperature, heart rate, and respiration were monitored throughout the surgery. Monkeys were placed in a Kopf (David Kopf Instruments, Tujunga, CA) stereotaxic instrument, a midline scalp incision was made, and the muscle and fascia were displaced laterally to expose the skull. A craniotomy (∼2–3 cm2) was made over the region of interest and small dural incisions only at recording or injection sites. Serial electrode penetrations were performed to identify patterns of neuronal activity that indicate the boundaries of different basal ganglia structures and to locate the thalamic injection sites (Haber et al., 1993). Accurate placement of tracer injections was achieved by careful alignment of the injection cannulas with the electrode. Cortical injection sites were determined by visual inspection of frontal cortical gyri, indicating general frontal cortical areas.
Monkeys received injections of one or more of the following anterograde–bidirectional tracers including Lucifer Yellow (LY) (n = 10), Fluorescein (FS) (n = 2), or FluoroRuby (FR) (n = 3) conjugated to dextran amine (40–50 nl, 10% in 0.1 m phosphate buffer, pH 7.4; Molecular Probes, Eugene, OR), wheat germ agglutinin conjugated to horseradish peroxidase (WGA-HRP; 10% in dH2O; Sigma, St. Louis, MO; n = 3), or tritiated amino acids (AA; 100 nl, 1:1 solution of [3H] leucine and [3H]-proline in dH2O, 200 mCi/ml; NEN, Boston, MA;n = 6) into different parts of the VA–VL–MD thalamus or frontal cortex. Tracers were pressure-injected over 10 min using a 0.5 μl Hamilton syringe. After each injection, the syringe remainedin situ for 20–30 min. Twelve to fourteen days after the operation, monkeys were again deeply anesthetized and perfused with saline followed by a 4% paraformaldehyde–1.5% sucrose solution in 0.1 m phosphate buffer, pH 7.4. Brains were postfixed overnight and cryoprotected in increasing gradients of sucrose (10, 20, and 30%). Serial sections of 50 μm were cut on a freezing microtome into 0.1 m phosphate buffer or cryoprotectant solution.
Immunocytochemistry. Immunocytochemistry was performed on free-floating sections to visualize LY, FS, FR, and WGA-HRP tracers. Before incubation in primary antisera, tissue was treated with 10% methanol and 3% hydrogen peroxide in 0.1 mphosphate buffer (PB) to inhibit endogenous peroxidase activity and rinsed 1–2 hr in PB with 0.3% Triton X-100 (TX; Sigma). Sections were preincubated in 10% normal goat serum (NGS) and 0.3% TX in PB for 30 min. Tissue was placed in the primary antisera: anti-LY (1:2000 dilution; Molecular Probes), anti-FS (1:1000; Molecular Probes), anti-FR (1:3000; Molecular Probes), or anti-WGA (1:20,000; Sigma) in 10% NGS and 0.3% TX in PB for four nights at 4°C. For visualization of immunoreactivity, the avidin–biotin reaction (rabbit Vectastain ABC kit; Vector Laboratories, Burlingame, CA) was used in conjunction with diaminobenzidine (DAB) and nickel-intensification procedures. After incubation in primary antisera, the tissue was thoroughly rinsed in PB with 0.3% TX before incubation in biotinylated goat anti-rabbit IgG, diluted 1:200 in 10% NGS and 0.3% TX in PB at room temperature for 45 min. After extensive rinsing, the tissue was incubated in the avidin–biotin complex solution diluted 1:100 (for PHA-L the Elite Peroxidase avidin-biotin is used at 1:50 dilution) in 10% NGS and 0.3% TX in PB at room temperature for 1 hr. After extensive rinsing, immunoreactivity was visualized using standard DAB procedures. Staining was intensified by incubating the tissue for 5–15 min in a solution of 0.05% 3,3′-diaminobenzidine tetrahydrochloride, 0.025% cobalt chloride, 0.02% nickel ammonium sulfate, and 0.01% H2O2 to yield a black reaction product. Sections were mounted onto gel-coated slides, dehydrated, defatted in xylenes, and coverslipped with Permount.
Visualization of tritiated amino acids. Sections were directly mounted onto gel-coated slides and dried on a slide warmer for 2–3 d. Eight slides were chosen surrounding the putative site of the [3H]-AA injection, placed in an autoradiography cassette, and exposed to Hyperfilm-3H for seven nights at room temperature. After developing the film with D-19 (Eastman Kodak, Rochester, NY) and fixer, all slides were exposed to NTB2 emulsion (Kodak). Sections were dehydrated in serial alcohols, defatted in xylenes for two or more nights, rehydrated, and dried. In a humidified darkroom, slides were dipped into a 1:1 solution of 20% glycerin and NTB2 emulsion, slowly air-dried in a humidified dark room for ∼5 hr, and then sealed in a lightproof box with desiccant and stored at −20°C. After 6–9 months, the slides were developed in D-19 and fixer (Kodak). Sections were counterstained with cresyl violet to help identify brain structures and coverslipped with Permount.
Analysis. Thalamic and cortical injections with cortical contamination or weak labeling were eliminated from the analysis. Cell and fiber distributions in the cortex and thalamus were charted using a research microscope with bright-field–dark-field illumination and fitted with a drawing tube. With the aid of a drawing tablet and high-resolution flatbed scanner, charts were traced and scanned into a Power Macintosh computer to create composite images. Thalamic experiments used multiple tracer molecules (FS, WGA-HRP, and AA) that have intrinsic differences in uptake and transport properties. Control injections of different tracer molecules into the same site demonstrated similar projection patterns and relative densities within the same areas of the brain. In general, AA cases resulted in denser thalamocortical terminal labeling than FS or WGA-HRP cases, but with similar distribution patterns. Thus, comparisons are limited to the distribution of thalamocortical labeling between cases and relative densities within an experiment. Using counterstained or adjacent, Nissl-stained coronal sections, we determined the boundaries of cytoarchitectonic areas within the cortex and the thalamus for each animal. Anatomical boundaries for motor, premotor, cingulate motor areas, and prefrontal cortical areas of the frontal cortex were delineated according to previous studies (Barbas and Pandya, 1989;Matelli et al., 1991; Dum and Strick, 1993). We used the atlas byOlszewski (1952) in conjunction with anatomical descriptions made by Jones (1998b) and Parent et al. (1983) to delineate the borders among the different thalamic nuclei.
RESULTS
Anterograde and bidirectional tracer injections were placed into discrete regions of the VA–VL complex, the MD, and into cortex (Fig.1) (McFarland and Haber, 2001). The thalamic injection sites included two in different regions of the VLo, (cases 107 and 108a), four injections into different parts of VA (cases 110, 108b, 94 and 104), and two in the central MD (cases 31 and 122). Examination of cortical regions traversed by the injection cannulas showed no leakage or evidence of corticocortical labeling. All injections sites resulted in anterograde labeling in the striatum as previously reported (McFarland and Haber, 2001). Furthermore, all bidirectional tracer injections resulted in retrograde labeled cells in the globus pallidus, internal segment and substantia nigra, pars reticulata. The cortical injection sites included three nonoverlapping sites at similar dorsal and medial positions, but at different rostrocaudal positions in different functional domains; SMA and preSMA and area 9; a lateral prefrontal injection site, area 46; and two medial injections, one into the anterior cingulate cortex (areas 24a/b and 32), and one into the orbital frontal cortex, area 14. All injection sites resulted in discrete anterograde labeling in the striatum consistent with its documented corticostriatal projection pattern (Künzle, 1975,1978; Selemon and Goldman-Rakic, 1985; Haber et al., 1995).
Thalamocortical projections
Distribution of thalamocortical terminal fields after anterograde tracer injections into the thalamus
Labeled fibers in cortex were predominately ipsilateral. VA–VL thalamic injections labeled fibers in motor cortical areas including primary (M1), supplementary (SMA), premotor (PM), and cingulate motor (CMA) areas (Table 1). The MD injection site labeled fibers in prefrontal areas, including dorsolateral prefrontal cortex and specific regions of orbital and medial prefrontal cortex. Thalamocortical fibers were distributed in a patchy manner, with areas of both heavy and light terminal labeling. In motor, premotor, and cingulate motor areas, the most extensive thalamocortical labeling in most cases was in layer I. In addition, there was also a dense distribution of labeling in layer III. These were, for the most part, discontinuous with areas of minimal labeling interrupted by more densely labeled regions. Finally, there were densely labeled patches of fibers in layer V. In contrast, the most extensive labeling was found in layer III in prefrontal regions. There were also some regions of layer I labeled, but the labeling was less extensive than that in motor and premotor areas. There were few labeled areas in layer V.
Table 1.
Distribution and relative density of VA/VL/MD thalamocortical projections
| Cortical area | Case/thalamic nucleus (subregion) | ||||||
|---|---|---|---|---|---|---|---|
| 107 VLo (dl) | 108a VLo (vm) | 110 VA (dl) | 108b VA (cv) | 94 VA (rl) | 104 VAmc | 31 MD | |
| M1 | ++++ | ++++ | +++ | − | − | − | − |
| SMA-proper | +++ | ++ | ++++ | ++ | − | − | − |
| CMAc (24d) | − | − | ++ | + | − | − | − |
| PMdc | ++ | − | +++ | + | − | − | − |
| PMvc | − | ++ | ++ | ++ | − | − | − |
| PreSMA | − | − | +++ | ++++ | +++ | + | − |
| CMAr (24c) | ++ | − | ++ | +++ | ++++ | − | − |
| PMvr | − | + | − | +++ | − | ++++ | ++ |
| PMdr (SEF) | + | − | + | + | − | ++++ | − |
| FEF (8) | − | − | − | + | − | +++ | ++ |
| 9/46 | − | − | + | − | ++ | +++ | +++ |
| 12 | − | − | − | − | − | + | ++++ |
| 13 | − | − | − | − | − | − | +++ |
Areas in frontal cortex that contained labeled thalamocortical fibers after injection into VA/VL/MD cortical areas are grouped into frontal cortical regions in order of direct associated with motor control. Values are based on the relative density of labeled fibers and terminals in each cortical area, where − represents no labeled fibers observed and + to ++++ represent increasing relative densities from few fibers to very dense labeling. The density of fiber labeling in each cortical region is weighted relative to the cortical area with the densest labeling in each of the cases. Frontal cortical areas not detailed in this table contained only occasional or no labeled thalamocortical fibers. dl, Dorsolateral; vm, ventromedial; cv, central-ventral; rl, rostrolateral; M1, primary motor cortex; SMA, supplementary motor area; CMAc, caudal cingulate motor area; PMdc, dorsal-caudal premotor cortex; PMvc, ventral-caudal premotor cortex; PMvr, ventral-rostral premotor cortex; PMdr, dorsal-rostral premotor cortex; CMAr, rostral cingulate motor area; FEF, frontal eye fields.
VLo projections. The injections into VLo primarily labeled M1, SMA, and caudal premotor areas (Figs. 2, 3). An injection of AA into the central, lateral VLo (case 107) resulted in densely labeled terminal fields in the rostral half of M1 extending into SMA (Fig. 2). Silver grain deposits were heaviest along the medial wall in both areas. The density of the terminal fields was extensive in layer I, occurring throughout the rostral motor cortex and SMA (Fig.2b). There were also very dense patches of labeling in layers III and V. These were predominantly located on the medial wall of M1 and SMA, extending along the dorsal convexity (Fig.2B,C). There were patches of terminals also located more laterally. Here, fewer clusters of silver grains were located in layer III. However, they did extend to the central sulcus. The density of labeling in M1 decreased laterally, such that the rostral, ventrolateral portion of M1 contained few labeled fibers. There were few silver grains in the caudal CMA (CMAc). Labeling in SMA extended into a small region of PMdc (Fig. 2B). At more rostral levels, terminal labeling was absent in preSMA; however, a small, but dense patch of labeled fibers extended into the ventral portion of the cingulate sulcus in the rostral CMA (CMAr).
Fig. 2.

Lateral VLo thalamocortical projections: case 107.A–C, Cortical schematics showing the distribution of silver grain deposits, indicative of fiber and terminal labeling, in motor cortical areas after an AA injection into the lateral VLo (thalamic schematic depicts site). In M1 areas, small, unfilled dots represent individual Betz cells. Dotted lines in cortical areas represent the boundary between layers IV and V. Numbers next to labels indicate approximate AP level relative to interaural zero. Photomicrographs of dark-field labeling (b) and Nissl staining (b′) show the laminar distribution of lateral VLo projections in PMdc (boxed area in B). Scale bar, 0.2 mm. See Table 1 for cortical abbreviations.
Fig. 3.
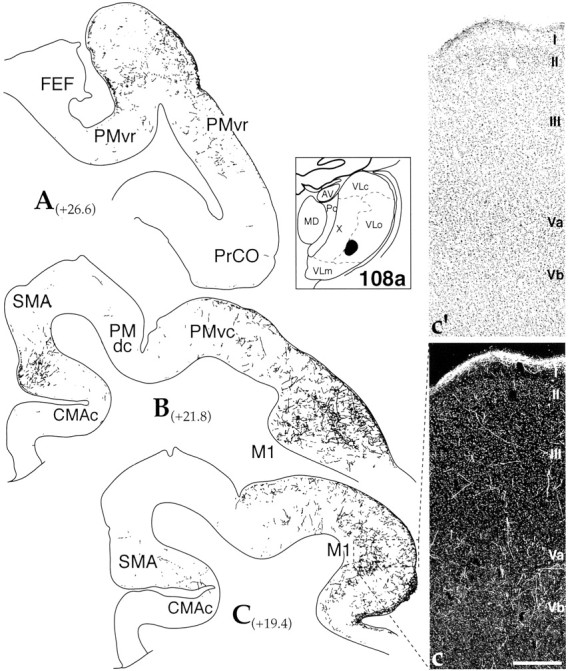
Ventromedial VLo thalamocortical projections: case 108a. A–C, Cortical schematics illustrating the distribution of labeled thalamocortical fibers and terminals in frontal cortical areas after an FS injection into the lateral VLo (thalamic schematic depicts site). Numbersnext to labels indicate approximate AP level, relative to interaural zero. Dark-field photomicrograph (c) and corresponding Nissl stain (c′) show the laminar distribution of ventromedial VLo projections in M1 (boxed area in C). Note the reticular pattern of labeled thalamocortical fibers in layers V, III, and I. Scale bar, 0.4 mm. See Table 1 for cortical abbreviations.
The center of the FS injection (case 108a) was ventral, medial, and caudal to that in case 107. Many labeled fibers were labeled in the rostral M1, primarily lateral to the caudal premotor area (Fig. 3). Terminals were located in cortical layers I, III, and V. As in case 107, terminal fields were numerous in layer I, in both M1 and premotor areas, along with dense patches in layers III and V. Few fibers were labeled in SMA at this caudal level, however, occasional dense patches of terminals were located in more rostral regions (Fig. 3B). The distribution of terminals extended throughout the caudal, ventral premotor area and into the rostral, ventral premotor area. Similar to the caudal regions, terminals were primarily located in layer I, but also many were found in layer III. At this level, there were relatively few fibers in the deep layers.
VApc projections. Compared with the distribution of labeled fibers after injections into VLo, thalamocortical projections from VApc primarily targeted premotor areas. An injection of AA into the caudal, dorsolateral VApc (case 110), resulted in dense terminal labeling centered in the SMA (Fig. 4). There were also some terminals that extended caudally into M1. As in the previous cases, there were labeled fibers in layers I, III, and V (Fig.4b). In the heavily labeled central area of SMA, terminals extended laterally into the caudal premotor area, terminating primarily in the dorsal part, but also extending somewhat into the caudal, ventral premotor area (PMvc). In addition, dense patches of terminal labeling, continuous with SMA, were found in the CMAc. The dense terminal fields of SMA continued rostrally into the preSMA area and into CMAr (Fig. 4A). The distribution of terminals continued into preSMA and, to some extent, into the rostral premotor area. Patches of labeled fibers were again located in layers I, III, and V. Terminal labeling also continued into the caudal regions of area 9. However, the distribution of silver grains differed in the prefrontal regions. Here, the silver grains were most prominent in layer III, with occasional patches of label in the deep layers.
Fig. 4.

Dorsolateral VA thalamocortical projections: case 110. A–C, Cortical schematics showing the distribution of labeled fibers and terminals in motor cortical areas after an AA injection into the dorsolateral VApc (thalamic schematic depicts site). In M1 areas, small, unfilled dots represent individual Betz cells. Numbers next to labels indicate approximate AP level relative to interaural zero. Dark-field photomicrograph (b) and corresponding Nissl stain (b′) show the laminar distribution of dorsolateral VA projections in SMA (boxed area in B). Scale bar, 0.4 mm. See Table 1 for cortical abbreviations.
Rostral and medial injection sites in VA resulted in labeling in more premotor regions, with no labeling in M1. Case 108b was the most lateral of these cases (Fig. 5). The distribution of silver grains was concentrated in the PreSMA, extending into CMAr, and the rostral, ventral PM area (PMvr). In caudal sections, there were smaller, less dense patches of silver grains in the rostral part of SMA proper and in parts of the caudal premotor area. In addition, there were some patches of terminals in frontal eye fields (FEFs) (Fig. 5C). At rostral levels, terminals extended into the most caudal levels of area 9. Terminal labeling was distributed in layers I, III, and V in most regions. In some instances layer I was the main or primary region containing silver grains (Fig. 5c, FEF and PMvc), whereas in other regions labeling in layer III was most prominent (Fig. 5B, preSMA). Terminal labeling in case 94 was concentrated in CMAr (Fig. 6). At more rostral levels, the concentration of silver grains split into two patches, one located in the ventral part of preSMA–CMAr and one in the 24b (Fig. 6B). Labeling continued rostrally into area 9. In general, terminal labeling was concentrated in layers I and III and appeared a comparable density in each layer within the same cortical region.
Fig. 5.

Central, ventral VA thalamocortical projections: case 108b. A–C, Cortical schematics showing the distribution of labeled fibers and terminals in frontal cortical areas after an AA injection into the central, ventral VApc (thalamic schematic depicts site). Numbers next to labels indicate approximate AP level relative to interaural zero. c, Dark-field photomicrograph showing dense fiber/terminal labeling in layer I in FEF (boxed area in C). Scale bar, 0.4 mm. See Table 1 for cortical abbreviations.
Fig. 6.

Rostral VA thalamocortical projections: case 94.A–C, Cortical schematics illustrating the distribution of labeled fibers and terminals in frontal cortical areas after an AA injection into the rostral pole of VApc (thalamic schematic depicts site). Numbers next to labels indicate approximate AP level relative to interaural zero. Dark-field photomicrograph (b) and corresponding Nissl stain (b′) showing the laminar distribution of rostral VA projections in the cingulate (boxed area inB). Scale bar, 0.25 mm. See Table 1 for cortical abbreviations.
Case 104 was an FS injection centered in the dorsal, medial VAmc. Dense clusters of labeled thalamocortical fibers were concentrated in the rostral the premotor area, in FEF, and in area 9 (Fig.7). In caudal sections, there were patches of fiber labeling in PMvr, extending into the adjacent area 12l/o. Fluorescein-positive fiber clusters were present in FEF within the superior limb of the arcuate sulcus (Fig. 7B,C) and along the dorsomedial convexity in the rostral, dorsal PM area (PMdr), primarily in its rostral half. This distribution was continuous with labeled fibers in area 9 (Fig. 7A). Terminals were located both in the dorsal convexity and in the ventral, medial wall. Although there were some terminals in layers I and V, the majority of fibers were located in layer III (Fig. 7b).
Fig. 7.
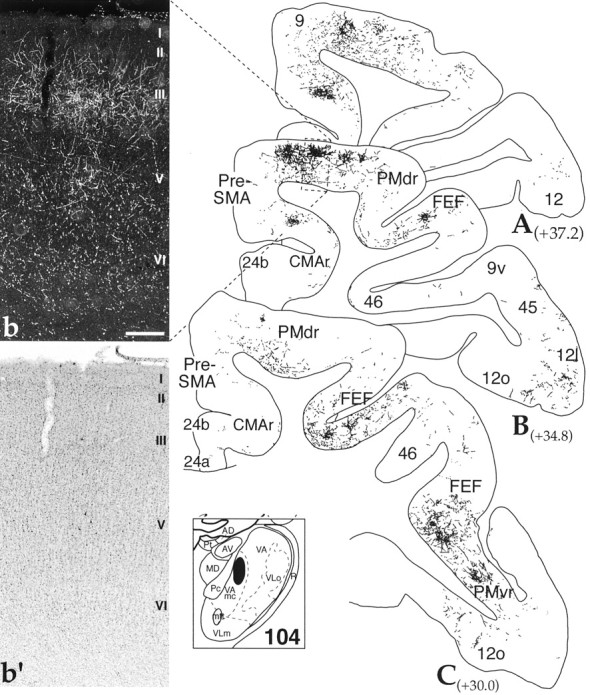
Dorsal VAmc thalamocortical projections: case 104. A–C, Cortical schematics showing the distribution of labeled thalamocortical fibers and terminals in frontal cortical areas after an FS injection into the dorsal VAmc (thalamic schematic depicts site). Numbers next to labels indicate approximate AP level relative to interaural zero. Dark-field photomicrograph (b) and corresponding Nissl stain (b′) showing the laminar distribution of rostral VA projections in the cingulate (boxed area inB). Note FS-positive corticothalamic cells in layers V–VI. Scale bar, 0.4 mm. See Table 1 for cortical abbreviations.
MD projections. Cases 31 (Fig.8) and 122 (data not shown, but similar to case 31) were injections of WGA-HRP and LY, respectively, into the central MD nucleus, involving primarily the parvocellular (pc), but also some of the magnocellular (mc) division of MD. Terminals were densely distributed in areas 9 and 46 and extended into the orbitofrontal areas 12 and 13. In addition, there were some fibers in PMvr and in medial regions of prefrontal cortex, areas 32 and 25. For the most part, terminals were located in layer IV and deep layer III (Fig. 8c). In addition, some fibers were also found in layer I. However, compared with injections into the VA–VL, these were fewer.
Fig. 8.
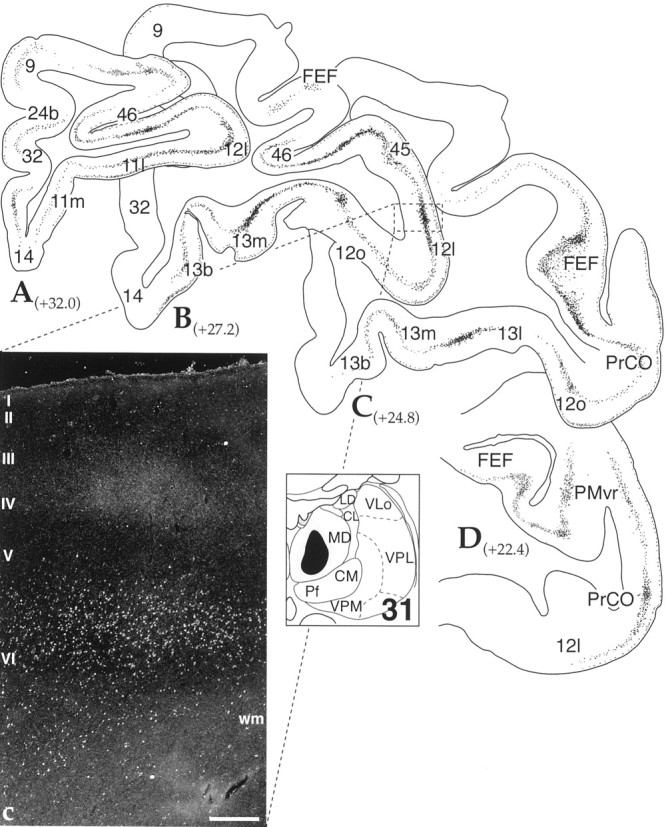
Central MD thalamocortical projections: case 31. A–D, Cortical schematics illustrating the distribution of labeled thalamocortical terminals in frontal cortical areas after a WGA-HRP injection into the central, medial MD (thalamic schematic depicts site). Numbers next to labels indicate approximate AP level relative to interaural zero. b,Dark-field photomicrograph showing the laminar distribution of labeled thalamocortical fibers and corticothalamic cells in area delineated by the dotted box in sectionB. Scale bar, 0.4 mm. See Table 1 for cortical abbreviations.
Retrogradely labeled cells after tracer injections into the cortex
Injections of bidirectional tracers were placed in different regions of frontal cortex. The results from these experiments are consistent with the pattern of retrogradely labeled cells found in the thalamus from previous studies (Wiesendanger and Wiesendanger, 1985;Russchen et al., 1987; Barbas et al., 1991; Matelli and Luppino, 1996). Injection site 108c was an LY injection into the rostral SMA. Labeled cells were primarily located in VLc and in the dorsolateral VA (Fig.9A–D). Injection site 102 was placed rostral to case 108 and was located in pre-SMA and caudal area 9. Labeled cells were located primarily in VA, but a significant population of cells were also found in MDpc (Fig.9E–H). A rostral injection into area 9 (case 78) labeled cells in more medial parts of the VA and a more prominent group of cells in MDpc than seen in case 102 (Fig. 9I–K). Thus, whereas in all three cases, labeled cells were distributed in VL, VA, and in MD, the relative distribution of cells reflected the rostrocaudal position of the injection site and the extent to which it involved premotor or prefrontal areas. Few or no labeled cells were found in VL after the more rostral injections. Case 121 was a lateral prefrontal injection of LY in 46. The majority of LY-positive neurons were concentrated medially in the MD at rostral levels and in the central part at more caudal levels (Fig.10A–D). There were few cells outside the MD. Injection sites placed in the medial and orbital prefrontal cortex labeled cells primarily in MDmc (Fig.10E–H).
Fig. 9.

Comparison of the distribution of thalamic terminal and cell labeling after injection into dorsomedial frontal cortical areas. Coronal hemisections through the VA–VL and MD nuclei of the thalamus illustrate the distribution of labeled thalamocortical cells (black; dot = 1 cell) and corticothalamic fibers (red) after cortical injections of LY (macro photos depict injection sites). A–D, Case 108c, injection in SMA. E–H, Case 102, injection into PreSMA/9. I–K, Case 78, injection into area 9. For thalamic abbreviations, see legend in Figure 1. CSL, Central superior lateral n.; MDmc/pc, mediodorsal pars magnocellularis/pars parvicellularis n.; PvA, anterior paraventricular n.
Fig. 10.

Comparison of the distribution of thalamic terminal and cell labeling after injection into prefrontal cortical areas. Coronal hemisections through the VA–VL and MD nuclei of the thalamus illustrate the distribution of labeled thalamocortical cells (black; dot = 1 cell) and corticothalamic fibers (red) after cortical injections of LY (macro photos depicts sites). A–D, Case 121, injection in lateral area 9. E–H, Case 36, injection into area 24.I–L, Case 47, injection into area 14. For thalamic abbreviations, see legend in Figure 1. CSL, Central superior lateral n.; MDmc/pc, mediodorsal pars magnocellularis/pars parvicellularis n.; PvA, anterior paraventricular n.
Corticothalamic projections
Eleven experiments used bidirectional tracers placed in either the thalamus or cortex. These cases documented the extent of the cortical innervation to particular thalamic sites in comparison to the thalamocortical labeling. In each case, the distribution of the corticothalamic projection was more extensive than the thalamocortical projection.
Bidirectional tracer injections into the thalamus
After injections into the thalamus, retrogradely labeled cells in the cortex were located in the deep layers (V/VI). Although all cortical areas that contained fiber labeling also had labeled corticothalamic neurons, additional cortical areas contained only labeled cells.
Case 108a showed numerous FS-positive cortical cells in caudal and rostral motor areas (Fig.11A–D). There were many labeled cells in M1 and PMvc that were also the regions containing densest thalamocortical fiber labeling. There were also labeled cells in SMA and PMvr, regions with some, albeit less terminal labeling. Cells were located in layers V and VI. Labeled fibers and labeled cells overlapped primarily in layer V with few labeled fibers in layer VI. Consistent with the typical distribution of corticothalamic projection neurons, there were no labeled cells in layers III or I, which contained many labeled fibers. In addition to this reciprocal projection, FS-positive cells were found in many areas that contained few or no labeled fibers (Fig.12A). There was dense cell labeling in SMA, encompassing its entire dorsoventral extent spreading ventralward into CMAc. Of particular interest was the extent of labeled cells in rostral motor regions including PMvr, CMAr, FEF, and preSMA that did not contain labeled fibers (Fig.11A). In addition, labeled cells were also found in prefrontal areas, PrCO, 12o/l, and the medial cingulate, 24b.
Fig. 11.
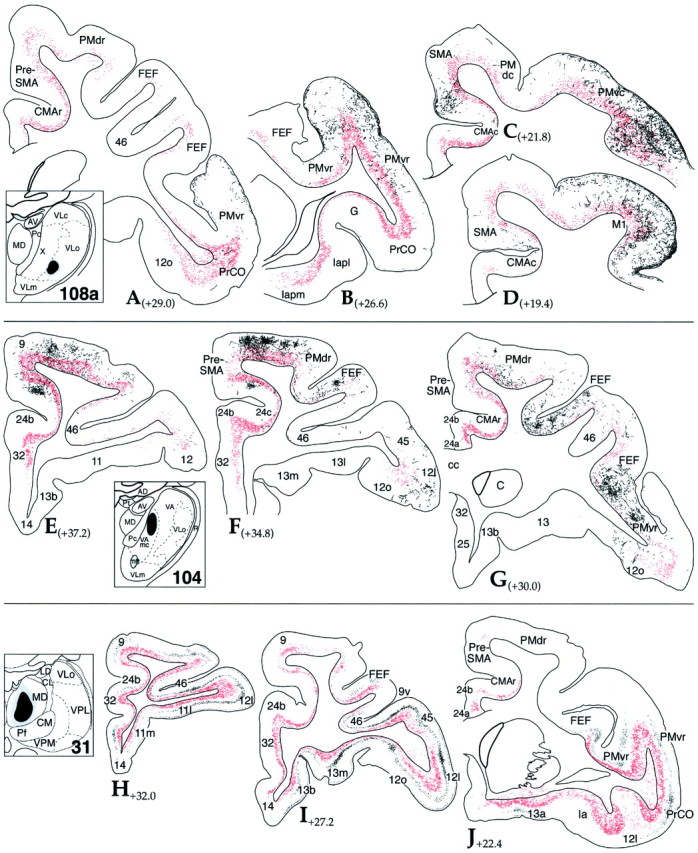
Comparison of the distribution of thalamocortical terminal and corticothalamic cell labeling after thalamic injections. Cortical schematics illustrating the distribution of retrogradely labeled corticothalamic cells (red; dot = 1 cell) and anterogradely labeled thalamocortical fibers (black). Thalamic schemas depict each site.A–D, Case 108a, LY injection into VLo.E–G, Case 104, FS injection into VAmc.H–J, Case 31, WGA-HRP injection into MD. See Table 1for cortical abbreviations.
Fig. 12.

Dark-field, macro photomicrographs of nonreciprocal corticothalamic labeling after thalamic injections.A, Case 108a, FS-positive corticothalamic cells in a region of SMA absent of thalamocortical fiber/terminal labeling.Arrow points to a labeled thalamocortical fiber extending into field from the adjacent cortical region.B, Case 104, FS-positive corticothalamic cells in area 24b. C, Case 31, labeled corticothalamic cells in area 32. Note absence of thalamocortical fiber/terminal labeling. Scale bar, 0.5 mm.
In case 104, there was a dense distribution of labeled cells in the rostral premotor areas (PMvr and PMdr) and in the frontal eye fields (Fig. 11E–G). These areas also had the densest distribution of labeled fibers. As in the previous case, labeled cells and fibers overlapped in layer V with no labeled cells in layers III and I. In addition, there was a dense distribution of labeled cells in PreSMA that extended into the cingulate sulcus, encompassing CMAr and 24b, but few labeled fibers (Fig. 12B). This distribution of labeled cells also extended rostrally into prefrontal area 9, medially into area 32, and laterally into orbital area 12. Although there was a continuous stream of densely labeled cells, rostral, medial and lateral prefrontal areas contained few patches of labeled fibers. In cases 31 and 122, labeled cells were densely distributed throughout the orbital and lateral prefrontal cortex (Fig.11H–J). Consistent with previous cases, these cells were located in layers V and VI. Lateral prefrontal areas also had many labeled fibers, primarily located in layer IV and deep layer III. In addition, labeled cells were also found in several regions with few or no labeled fibers. This included the more medial prefrontal regions, medial area 9, and the midline cortical regions of 24, 32, and 14 (Fig. 12C).
Injection sites placed in cortex
To further examine the relationship between the thalamocortical projection and the corticothalamic projection, we compared the cell and fiber labeling in the thalamus after eight cases in which a bidirectional tracer was injected into different frontal cortical regions (Figs. 1B, 9). Although some injection sites extended into the adjacent cortical region, there was no overlap between the sites. An injection into SMA–PreSMA (case 108c) resulted in a dense area of thalamocortical cell and corticothalamic fiber labeling in the medial, dorsal part of VA, extending caudally into area X and the adjacent portion of VLc (Fig. 9A–C). Dense clusters of thalamocortical fibers generally overlapped LY-positive cells, but there also were many labeled fibers in regions devoid of labeled cells, particularly ventromedial to cells (compare fibers in VA and area X) (Fig. 9B,C). In addition, there were a few LY-positive cells and fibers in the lateral part of MDpc and MDmf (Fig.9D). An injection into preSMA/area 9 (case 102) just rostral to case (108c) primarily labeled cells in the MD nucleus (Fig.9G,H). As in the previous case, labeled cells were found in most regions with dense fiber labeling. There were also fiber fields in the VA, particularly in dorsal regions where there were fewer labeled cells (Fig. 9E,F). An injection into medial area 9 (case 78), just rostral to case 102 also labeled cells in the MD (Fig. 9K). These cells were distributed among the dense, labeled fibers. In addition, a cluster of labeled cells and fibers was found in medial VA (Vamc) (Fig. 9I,J). As with the previous cases, there were extensive fiber clusters outside of the labeled cells in the VA. Thus, all three medial injection sites resulted in more extensive fiber labeling in the thalamus than labeled cells. Furthermore, labeled fibers were found outside regions of labeled cells.
An injection into the lateral prefrontal area (area 46) resulted in dense cell and fiber labeling in the MD nucleus (Fig.10B–D). Cells overlapped with the region of labeled fibers. However, terminal labeling extended ventrally to the labeled cells into the rostral, central part of MD (MDpc). At more caudal levels, labeled cells and fibers overlapped. In addition, there was an extensive distribution of labeled fibers in VA with few labeled cells (Fig. 10A). An injection into the anterior cingulate cortex labeled both cells and fibers in the caudal MD (Fig.10H). In addition, dense fiber labeling extended into the rostral MD and VA, but with few or no cells labeled (Fig.10E–G) Finally, a medial, ventral injection into area 14 resulted in overlapping labeled cells and fibers in the medial MD (MDmc) (Fig. 10J–L). In addition, labeled fibers extended ventralward into an area with few labeled cells. Some labeled fibers were noted in the VA nucleus with few, scattered LY-positive cells (Fig. 10I). In summary, in all of the bidirectional tracer injections into frontal cortex, labeled fibers in the thalamus were more extensive than labeled cells.
DISCUSSION
The functional topography of the thalamocortical projections is largely preserved, supporting parallel processing models of the basal ganglia. The VL projects to regions associated with motor execution and preparation of movement (areas M1, SMA, and PMc), caudal VA projects to rostral premotor areas (preSMA, CMAr, and PMr), rostral and medial VA additionally project to prefrontal cortex, and the MD projects to the dorsolateral and to orbital prefrontal cortex (Table 1). However, labeling is often noncontiguous and located in more than one distinct region of frontal cortex: an injection into VL targeted lateral motor areas, but also a region in SMA; an injection into VA targeted medial areas, but also a region in PMvr. Both M1 and SMA are part of the caudal motor areas with similar physiological characteristics. Likewise, rostral premotor areas, both medial and more lateral are similar in that they are less excitable and show activity primarily during internally guided tasks (Vitek et al., 1996; van Donkelaar et al., 1999, 2000). Thus VA–VL projections target sets of functionally related frontal cortical areas and are consistent with other recent anatomical studies (Miyata and Sasaki, 1984; Wiesendanger and Wiesendanger, 1985; Matelli et al., 1989; Dum and Strick, 1993; Hoover and Strick, 1993; Kurata, 1994; Rouiller et al., 1994; Shindo et al., 1995; Matelli and Luppino, 1996). Of particular interest is the laminar organization of thalamocortical terminals fields, which varies according to each cortical area. These findings suggest a complex role in mediating corticocortical function. Finally, in comparison to thalamocortical projections, corticothalamic projections to VA–VL and MD are more widespread, arising from many cortical areas not innervated by those thalamic sites. This arrangement creates both reciprocal and nonreciprocal components to the thalamo-cortico-thalamic interface. Together, these experiments indicate that VA–VL and MD nuclei function in two ways: (1) to relay basal ganglia output within a specific cortical circuit and (2) to mediate information flow between cortical circuits.
Thalamocortical projections target different cortical layers
Thalamocortical neurons synapse on the dendrites of pyramidal neurons in different cortical layers, which are associated with differential processing and modulation of cortical neuronal ensembles (Harvey, 1980; Hersch and White, 1981; White and Hersch, 1982; Hendry and Jones, 1983; Yamamoto et al., 1990; Castro-Alamancos and Connors, 1997; Larkum et al., 1999). Layer V labeling was patchy, compared with layer III, and found primarily in areas that also labeled layer III. Layer I was the most prominently labeled layer in cortical regions that received VL projections. Fibers from caudal regions of VA also terminated prominently in layer I, but layer I was less densely labeled after more rostral and medial VA and MD injections. Thus, projections from basal ganglia relay nuclei project to different layers, indicating a more complex function for the thalamocortical projection than a simple feedback loop that complete each basal ganglia circuit.
Terminals in different layers represent both focal and diffuse projections resulting in complex processing both within and between cortical areas (Jones, 1975; Sasaki et al., 1979; Herkenham, 1986;Nakano et al., 1992; Castro-Alamancos and Connors, 1997). Focal thalamic projections terminate in layer V, in close proximity to labeled cells. Layer V pyramidal cells send excitatory input to the thalamus, forming a direct thalamocortico-thalamic loop, thus sustaining information processing from the thalamus within a specific corticobasal ganglia circuit. Furthermore, corticostriatal cells also reside in layer V and comprise a subpopulation of corticothalamic neurons with collaterals to the striatum (Arikuni and Kubota, 1986;Saint-Cyr et al., 1990; Haber et al., 1995; Levesque et al., 1996; Pare and Smith, 1996; McFarland and Haber, 2000). This supplies excitatory cortical input to part of the same circuit and in the striatum further reinforces or focuses activity or habit formation. Furthermore, projections to layers III and I may interact with apical dendrites of layer V cells, which if timed precisely could increase the firing from deep layer cells (Larkum et al., 1999). Taken together these projections represent the thalamocortical feedback within each functional corticobasal ganglia circuit, providing a recurrent loop system for development of specific learned behaviors (Fig.13A).
Fig. 13.

Summary of thalamic terminal organization in cortical layers. Projections to the deep layers may interact with neurons that, in turn, project back to both the thalamus and striatum. These terminals, therefore, are in a position to directly reinforce corticothalamic and corticostriatal inputs to specific corticobasal ganglia circuits (A). In addition, through the nonreciprocal corticothalamic projection, terminals in layer V may also interface with other corticobasal ganglia circuits by projecting to a thalamic region that is part of another circuit system (B). Thalamocortical projections to the superficial layers may have a similar dual function. These projections may interact with the apical dendrites of layer V cells, further reinforcing each parallel circuit. In addition, through corticocortical projections from layer III, these terminals may influence with adjacent circuits.
In contrast to the more focal projections that provide feedback within a circuit, thalamocortical projections to the superficial layers play a key role in corticocortical processing (Fig. 13B). Within thalamic nuclei there are two chemically distinct and intermingled cell groups that project to either deep or superficial layers, providing both focal cortical input and a more diffuse one that is critical for widespread cortical activity (oscillatory activity) (Rausell et al., 1992; Castro-Alamancos and Connors, 1997; Jones, 1998b). The projections to layer III from the VA–VL–MD nuclei were more extensive than those to layer V. Whereas in specific cortical regions (primarily prefrontal areas) layer III cells project to the striatum (Haber et al., 1995), the main output of layer III is cortical. This provides an important mechanism for cross-communication between basal ganglia circuits. Projections to layer I (particularly from VL and VA) were often more extensive than those to layers III and V. These projections are particularly interesting in that they have a more global recruiting action response effecting wide networks of cortical activity. They establish and maintain synchrony across ensembles of cortical neurons that is observed over widespread areas of cortex (Herkenham, 1986;Castro-Alamancos, 1997; Jones, 1998a, 2001). In contrast to the topographically specific thalamocortical projections to deep layers, the more widespread, diffuse terminals to layer I are in a position to modulate neuronal activity from all cortical layers with dendrites ascending into layer I.
Relationship of corticothalamic and thalamocortical projections
Although corticothalamic projections to specific relay nuclei are thought to follow a general rule of reciprocity, increasing evidence in other systems suggests the presence of nonreciprocal corticothalamic projections (Giguere and Goldman-Rakic, 1988; Sherman and Guillery, 1996; Jones, 1998b; Darian-Smith et al., 1999). Corticothalamic projections to specific VA–VL and MD sites are more extensive than thalamocortical projections from the same thalamic site and are derived from areas not innervated by the same thalamic site. Likewise, after injections into the frontal cortex, labeled fibers in the thalamus are far more widespread than labeled cells. These findings are based on injections in discrete areas of VA–VL and MD thalamus, as well as select areas of the frontal cortex. Together, the data provide strong evidence for nonreciprocal corticothalamic projections to the specific basal ganglia relay nuclei (Fig. 13B).
Although reciprocal thalamocortical relays from VA–VL and MD nuclei appear to maintain segregated corticobasal ganglia circuits, the nonreciprocal corticothalamic component supplies input from functionally distinct frontal cortical areas. Tracer injections into the central MD show reciprocal projections with lateral and orbital prefrontal areas, but also result in dense retrograde cell labeling in medial prefrontal areas, in particular, areas 9 (in part), 24, and 32, that do not contain labeled fibers. Consistent with these results,Giguere and Goldman-Rakic (1988) found that MD and medial prefrontal areas are reciprocally connected, with the exception anterior cingulate and supplementary motor areas. In a later study, Ray and Price (1993)showed substantial projections to medial prefrontal areas 32 and 24 from MD pars caudodorsalis, a region not fully examined by Giguere and Goldman-Rakic (1988). Together these data suggest that MD subregions receive nonreciprocal corticothalamic connections. Cortical injections of bidirectional tracers further support these findings. Injections into dorsolateral prefrontal areas (9 and 46) show relatively restricted populations of labeled cells in MD and part of VA. However, the fiber distributions are more widespread, particularly in VA.
In contrast to MD, studies that have examined the reciprocity of connections between VA–VL nuclei and the frontal cortex are few and limited (Kievit and Kuypers, 1975). Bidirectional tracer injection into VA-labeled cells and fibers in the frontal eye fields, dorsal premotor areas, and caudal area 9. In addition, labeled cells were found in medial prefrontal areas (24 and 32). Consistent with these findings, cortical injections into preSMA and area 9, demonstrated a much wider distribution of fibers in VA than labeled cells, extending into the MD nucleus. Finally, bidirectional tracer injection into Vlo-labeled fibers and cells in the caudal motor areas (both M1 and caudal premotor regions). However, the labeled cells were also located in more rostral motor regions (preSMA and CMAr) as well as lateral prefrontal cortex. These regions had few labeled fibers. Thus, there appears to be trend for nonreciprocal corticothalamic projections arising from more rostral premotor and prefrontal cortical areas.
Functional implications
Corticobasal ganglia loops are considered one-way circuits, from cortex through the basal ganglia, to the thalamic relay nuclei, and back to the cortex. Our findings show that the pathway back to cortex has two components: (1) a component that reinforces each corticobasal ganglia circuit and (2) a component that relays information between circuits (Figs. 13, 14). Relaying information between circuits is accomplished both through the organization of projections to different layers and through the nonreciprocal corticothalamic pathway. A similar arrangement of thalamocortical relays has previously been described for geniculocortical pathways mediating information flow between visual areas (Sherman and Guillery, 1996). Nonreciprocal corticothalamic pathways in sensory systems have been suggested to function as feedforward pathways that mediate information flow from primary sensory to higher association cortical areas (Jones, 1998b). In contrast to sensory systems, basal ganglia relay nuclei appear to mediate information flow from higher cortical “association” areas of the prefrontal cortex to rostral motor areas involved in “cognitive” or integrative aspects of motor control to primary motor areas that direct movement execution (Figs. 13, 14). For example, VLo receive inputs from both caudal motor and rostral motor areas, as well as some afferents from prefrontal areas such as PrCO and 24b. Thalamocortical output from VLo primarily targets caudal motor areas, including M1, SMA, and PMvc. Information from prefrontal and rostral motor cortical areas is thus transmitted by VLo to primary motor cortices. Similar “feed-forward” projections are present in VAmc and MD relays. VA–VL and MD relay nuclei may thus integrate information from a wide array of functionally different corticothalamic inputs as well as specific basal ganglia afferents before sending it back to specific cortical regions.
Fig. 14.

Proposed schema of information flow between thalamic relay nuclei and frontal cortical areas. Thalamic areas MD (central), VA, and VLo are depicted on the left and the corresponding prefrontal, premotor, and motor cortical areas on theright. Black lines between cortical regions demonstrate the diverse corticocortical interconnections between adjacent frontal cortical areas. Colored gradients inboxes indicate the functional association between particular thalamic and frontal cortical areas (from most limbic,red, to motor, blue).Arrows illustrate the major thalamocortical and corticothalamic connections between areas. Each thalamic area has strong reciprocal thalamocortico-thalamic connections but also receives prominent corticothalamic inputs from more rostral, cognitive, or limbic association areas (above). Nonreciprocal projections to central MD, VA, or VLo nuclei may thus form feedforward pathways that transmit information from prefrontal and rostral motor areas to more caudal motor areas, affecting motor output or behavior.
We recently demonstrated a significant direct projection from the VA–VL nuclei to the striatum (McFarland and Haber, 2000, 2001). The fact that these nuclei project to the striatum further changes our concept of the basal ganglia as a one-way circuit. Because VA–VL nuclei receive nonreciprocal cortical projections, information conveyed to the striatum is likely to be more than a simple feedback circuit. The thalamus processes complex cortical inputs from multiple areas and is likely to convey this information to the striatum. Thus, information may travel in a relatively parallel manner from cortex to striatum; however, the thalamus is in a position to directly modify those one-way circuits.
Footnotes
This work was supported by National Institutes of Health Grants MH11661 (N.R.M.) and NS22511 (S.N.H.). We thank April Whitbeck and Evelyn Galban for their technical help and Rachel Haber-Thomson and Dr. Kisok Kim for their assistance in the preparation of figures.
Correspondence should be addressed to Dr. Suzanne N. Haber, Department of Neurobiology and Anatomy, University of Rochester School of Medicine and Dentistry, 601 Elmwood Avenue, Box 603, Rochester, NY 14642. E-mail: suzanne_haber@urmc.rochester.edu.
REFERENCES
- 1.Alexander GE, DeLong MR, Strick PL. Parallel organization of functionally segregated circuits linking basal ganglia and cortex. Annu Rev Neurosci. 1986;9:357–381. doi: 10.1146/annurev.ne.09.030186.002041. [DOI] [PubMed] [Google Scholar]
- 2.Arikuni T, Kubota K. The organization of prefrontocaudate projections and their laminar origin in the macaque monkey: a retrograde study using HRP-gel. J Comp Neurol. 1986;244:492–510. doi: 10.1002/cne.902440407. [DOI] [PubMed] [Google Scholar]
- 3.Barbas H, Pandya DN. Architecture and intrinsic connections of the prefrontal cortex in the rhesus monkey. J Comp Neurol. 1989;286:353–375. doi: 10.1002/cne.902860306. [DOI] [PubMed] [Google Scholar]
- 4.Barbas H, Haswell Henion TH, Dermon CR. Diverse thalamic projections to the prefrontal cortex in the Rhesus monkey. J Comp Neurol. 1991;313:65–94. doi: 10.1002/cne.903130106. [DOI] [PubMed] [Google Scholar]
- 5.Castro-Alamancos MA. Short-term plasticity in thalamocortical pathways: cellular mechanisms and functional roles. Rev Neurosci. 1997;8:95–116. doi: 10.1515/revneuro.1997.8.2.95. [DOI] [PubMed] [Google Scholar]
- 6.Castro-Alamancos MA, Connors BW. Thalamocortical synapses. Prog Neurobiol. 1997;51:581–606. doi: 10.1016/s0301-0082(97)00002-6. [DOI] [PubMed] [Google Scholar]
- 7.Catsman-Berrevoets CE, Kuypers HG. Differential laminar distribution of corticothalamic neurons projecting to the VL and the center median. An HRP study in the cynomologus monkey. Brain Res. 1978;154:359–365. doi: 10.1016/0006-8993(78)90706-0. [DOI] [PubMed] [Google Scholar]
- 8.Darian-Smith C, Tan A, Edwards S. Comparing thalamocortical and corticothalamic microstructure and spatial reciprocity in the macaque ventral posterolateral nucleus (VPLc) and medial pulvinar. J Comp Neurol. 1999;410:211–234. [PubMed] [Google Scholar]
- 9.Deschenes M, Veinante P, Zhang ZW. The organization of corticothalamic projections: reciprocity versus parity. Brain Res Brain Res Rev. 1998;28:286–308. doi: 10.1016/s0165-0173(98)00017-4. [DOI] [PubMed] [Google Scholar]
- 10.Dum RP, Strick PL. Cingulate motor areas. In: Vogt BA, Gabriel M, editors. Neurobiology of cingulate cortex and limbic thalamus: a comprehensive treatise. Birkhauser; Boston: 1993. pp. 415–441. [Google Scholar]
- 11.Giguere M, Goldman-Rakic PS. Mediodorsal nucleus: area 1 laminar and tangential distribution of afferents and efferents in the frontal lobe of rhesus monkeys. J Comp Neurol. 1988;277:195–213. doi: 10.1002/cne.902770204. [DOI] [PubMed] [Google Scholar]
- 12.Goldman-Rakic PS, Porrino LJ. The primate mediodorsal (MD) nucleus and its projection to the frontal lobe. J Comp Neurol. 1985;242:535–560. doi: 10.1002/cne.902420406. [DOI] [PubMed] [Google Scholar]
- 13.Haber SN, Lynd-Balta E, Mitchell SJ. The organization of the descending ventral pallidal projections in the monkey. J Comp Neurol. 1993;329:111–129. doi: 10.1002/cne.903290108. [DOI] [PubMed] [Google Scholar]
- 14.Haber SN, Kunishio K, Mizobuchi M, Lynd-Balta E. The orbital and medial prefrontal circuit through the primate basal ganglia. J Neurosci. 1995;15:4851–4867. doi: 10.1523/JNEUROSCI.15-07-04851.1995. [DOI] [PMC free article] [PubMed] [Google Scholar]
- 15.Harvey AR. A physiological analysis of subcortical and commissural projections of areas 17 and 18 of the cat. J Physiol (Lond) 1980;302:507–534. doi: 10.1113/jphysiol.1980.sp013258. [DOI] [PMC free article] [PubMed] [Google Scholar]
- 16.Hendry SH, Jones EG. The organization of pyramidal and non-pyramidal cell dendrites in relation to thalamic afferent terminations in the monkey somatic sensory cortex. J Neurocytol. 1983;12:277–298. doi: 10.1007/BF01148465. [DOI] [PubMed] [Google Scholar]
- 17.Herkenham M. New perspectives on the organization and evolution of nonspecific thalamocortical projections. In: Jones EG, Peters A, editors. Cerebral cortex: sensory-motor areas and aspects of cortical connectivity. Plenum; New York: 1986. pp. 403–445. [Google Scholar]
- 18.Hersch SM, White EL. Thalamocortical synapses with corticothalamic projection neurons in mouse SmI cortex: electron microscopic demonstration of a monosynaptic feedback loop. Neurosci Lett. 1981;24:207–210. doi: 10.1016/0304-3940(81)90157-9. [DOI] [PubMed] [Google Scholar]
- 19.Hoogland PV, Welker E, Van der Loos H. Organization of the projections from barrel cortex to thalamus in mice studied with Phaseolus vulgaris-leucoagglutinin and HRP. Exp Brain Res. 1987;68:73–87. doi: 10.1007/BF00255235. [DOI] [PubMed] [Google Scholar]
- 20.Hoover JE, Strick PL. Multiple output channels in the basal ganglia. Science. 1993;259:819–821. doi: 10.1126/science.7679223. [DOI] [PubMed] [Google Scholar]
- 21.Ilinsky IA, Jouandet ML, Goldman-Rakic PS. Organization of the nigrothalamocortical system in the rhesus monkey. J Comp Neurol. 1985;236:315–330. doi: 10.1002/cne.902360304. [DOI] [PubMed] [Google Scholar]
- 22.Jones EG. Lamination and differential distribution of thalamic afferents within the sensory-motor cortex of the squirrel monkey. J Comp Neurol. 1975;160:167–203. doi: 10.1002/cne.901600203. [DOI] [PubMed] [Google Scholar]
- 23.Jones EG. The thalamus. Plenum; New York: 1985. [Google Scholar]
- 24.Jones EG. Viewpoint: the core and matrix of thalamic organization. Neuroscience. 1998a;85:331–345. doi: 10.1016/s0306-4522(97)00581-2. [DOI] [PubMed] [Google Scholar]
- 25.Jones EG. The thalamus of primates. In: Bloom FE, Björklund A, Hökfelt T, editors. The primate nervous system, Part II. Elsevier; Amsterdam: 1998b. pp. 1–298. [Google Scholar]
- 26.Jones EG. The thalamic matrix and thalamocortical synchrony. Trends Neurosci. 2001;24:595–601. doi: 10.1016/s0166-2236(00)01922-6. [DOI] [PubMed] [Google Scholar]
- 27.Kievit J, Kuypers HG. Subcortical afferents to the frontal lobe in the rhesus monkey studied by means of retrograde horseradish peroxidase transport. Brain Res. 1975;85:261–266. doi: 10.1016/0006-8993(75)90079-7. [DOI] [PubMed] [Google Scholar]
- 28.Künzle H. Bilateral projections from precentral motor cortex to the putamen and other parts of the basal ganglia. An autoradiographic study in Macaca fascicularis. Brain Res. 1975;88:195–209. doi: 10.1016/0006-8993(75)90384-4. [DOI] [PubMed] [Google Scholar]
- 29.Künzle H. Thalamic projections from the precentral motor cortex in Macaca fascicularis. Brain Res. 1976;105:253–267. doi: 10.1016/0006-8993(76)90424-8. [DOI] [PubMed] [Google Scholar]
- 30.Künzle H. An autoradiographic analysis of the efferent connections from premotor and adjacent prefrontal regions (areas 6 and 9) in Macaca fascicularis. Brain Behav Evol. 1978;15:185–234. doi: 10.1159/000123779. [DOI] [PubMed] [Google Scholar]
- 31.Künzle H, Akert K. Efferent connections of cortical, area 8 (frontal eye field) in Macaca fascicularis. A reinvestigation using the autoradiographic technique. J Comp Neurol. 1977;173:147–164. doi: 10.1002/cne.901730108. [DOI] [PubMed] [Google Scholar]
- 32.Kurata K. Site of origin of projections from the thalamus to dorsal versus ventral aspects of the premotor cortex of monkeys. Neurosci Res. 1994;21:71–76. doi: 10.1016/0168-0102(94)90069-8. [DOI] [PubMed] [Google Scholar]
- 33.Larkum ME, Zhu JJ, Sakmann B. A new cellular mechanism for coupling inputs arriving at different cortical layers. Nature. 1999;398:338–341. doi: 10.1038/18686. [DOI] [PubMed] [Google Scholar]
- 34.Levesque M, Charara A, Gagnon S, Parent A, Deschenes M. Corticostriatal projections from layer V cells in rat are collaterals of long-range corticofugal axons. Brain Res. 1996;709:311–315. doi: 10.1016/0006-8993(95)01333-4. [DOI] [PubMed] [Google Scholar]
- 35.Matelli M, Luppino G. Thalamic input to mesial and superior area 6 in the Macaque monkey. J Comp Neurol. 1996;372:59–87. doi: 10.1002/(SICI)1096-9861(19960812)372:1<59::AID-CNE6>3.0.CO;2-L. [DOI] [PubMed] [Google Scholar]
- 36.Matelli M, Luppino G, Fogassi L, Rizzolatti G. Thalamic input to inferior area 6 and area 4 in the macaque monkey. J Comp Neurol. 1989;280:468–488. doi: 10.1002/cne.902800311. [DOI] [PubMed] [Google Scholar]
- 37.Matelli M, Luppino G, Rizzolatti G. Architecture of superior and mesial area 6 and the adjacent cingulate cortex in the macaque monkey. J Comp Neurol. 1991;311:445–462. doi: 10.1002/cne.903110402. [DOI] [PubMed] [Google Scholar]
- 38.McFarland NR, Haber SN. Convergent inputs from thalamic motor nuclei and frontal cortical areas to the dorsal striatum in the primate. J Neurosci. 2000;20:3798–3813. doi: 10.1523/JNEUROSCI.20-10-03798.2000. [DOI] [PMC free article] [PubMed] [Google Scholar]
- 39.McFarland NR, Haber SN. Organization of thalamostriatal terminals from the ventral motor nuclei in the macaque. J Comp Neurol. 2001;429:321–336. doi: 10.1002/1096-9861(20000108)429:2<321::aid-cne11>3.0.co;2-a. [DOI] [PubMed] [Google Scholar]
- 40.Miyata M, Sasaki K. Horseradish peroxidase studies on thalamic and striatal connections of the mesial part of area 6 in the monkey. Neurosci Lett. 1984;49:127–133. doi: 10.1016/0304-3940(84)90148-4. [DOI] [PubMed] [Google Scholar]
- 41.Murphy PC, Sillito AM. Functional morphology of the feedback pathway from area 17 of the cat visual cortex to the lateral geniculate nucleus. J Neurosci. 1996;16:1180–1192. doi: 10.1523/JNEUROSCI.16-03-01180.1996. [DOI] [PMC free article] [PubMed] [Google Scholar]
- 42.Murphy PC, Duckett SG, Sillito AM. Feedback connections to the lateral geniculate nucleus and cortical response properties. Science. 1999;286:1552–1554. doi: 10.1126/science.286.5444.1552. [DOI] [PubMed] [Google Scholar]
- 43.Nakano K, Tokushige A, Kohno M, Hasegawa Y, Kayahara T, Sasaki K. An autoradiographic study of cortical projections from motor thalamic nuclei in the macaque monkey. Neurosci Res. 1992;13:119–137. doi: 10.1016/0168-0102(92)90093-r. [DOI] [PubMed] [Google Scholar]
- 44.Olszewski J. The thalamus of the Maccaca mulatta: an atlas for use with the stereotaxic instrument. Karger; Basel: 1952. [Google Scholar]
- 45.Pare D, Smith Y. Thalamic collaterals of corticostriatal axons: Their termination field and synaptic targets in cats. J Comp Neurol. 1996;372:551–567. doi: 10.1002/(SICI)1096-9861(19960902)372:4<551::AID-CNE5>3.0.CO;2-3. [DOI] [PubMed] [Google Scholar]
- 46.Parent A, Hazrati LN. Functional anatomy of the basal ganglia. I. The cortico-basal ganglia-thalamocortical loop. Brain Res Brain Res Rev. 1995;20:91–127. doi: 10.1016/0165-0173(94)00007-c. [DOI] [PubMed] [Google Scholar]
- 47.Parent A, Mackey A, De Bellefeuille L. The subcortical afferents to caudate nucleus and putamen in primate: a fluorescence retrograde double labeling study. Neuroscience. 1983;10:1137–1150. doi: 10.1016/0306-4522(83)90104-5. [DOI] [PubMed] [Google Scholar]
- 48.Rausell E, Bae CS, Vinuela A, Huntley GW, Jones EG. Calbindin and parvalbumin cells in monkey VPL thalamic nucleus: distribution, laminar cortical projections, and relations to spinothalamic terminations. J Neurosci. 1992;12:4088–4111. doi: 10.1523/JNEUROSCI.12-10-04088.1992. [DOI] [PMC free article] [PubMed] [Google Scholar]
- 49.Ray JP, Price JL. The organization of projections from the mediodorsal nucleus of the thalamus to orbital and medial prefrontal cortex in Macaque monkeys. J Comp Neurol. 1993;337:1–31. doi: 10.1002/cne.903370102. [DOI] [PubMed] [Google Scholar]
- 50.Rouiller EM, Liang F, Babalian A, Moret V, Wiesendanger M. Cerebellothalamocortical and pallidothalamocortical projections to the primary and supplementary motor cortical areas: a multiple tracing study in macaque monkeys. J Comp Neurol. 1994;345:185–213. doi: 10.1002/cne.903450204. [DOI] [PubMed] [Google Scholar]
- 51.Russchen FT, Amaral DG, Price JL. The afferent input to the magnocellular division of the mediodorsal thalamic nucleus in the monkey, Macaca fascicularis. J Comp Neurol. 1987;256:175–210. doi: 10.1002/cne.902560202. [DOI] [PubMed] [Google Scholar]
- 52.Saint-Cyr JA, Ungerleider LG, Desimone R. Organization of visual cortical inputs to the striatum and subsequent outputs to the pallido-nigral complex in the monkey. J Comp Neurol. 1990;298:129–156. doi: 10.1002/cne.902980202. [DOI] [PubMed] [Google Scholar]
- 53.Sasaki K, Jinnai K, Gemba H, Hashimoto S, Mizuno N. Projection of the cerebellar dentate nucleus onto the frontal association cortex in monkeys. Exp Brain Res. 1979;37:193–198. doi: 10.1007/BF01474266. [DOI] [PubMed] [Google Scholar]
- 54.Schell GR, Strick PL. The origin of thalamic inputs to the arcuate premotor and supplementary motor areas. J Neurosci. 1984;4:539–560. doi: 10.1523/JNEUROSCI.04-02-00539.1984. [DOI] [PMC free article] [PubMed] [Google Scholar]
- 55.Selemon LD, Goldman-Rakic PS. Longitudinal topography and interdigitation of corticostriatal projections in the rhesus monkey. J Neurosci. 1985;5:776–794. doi: 10.1523/JNEUROSCI.05-03-00776.1985. [DOI] [PMC free article] [PubMed] [Google Scholar]
- 56.Sherman SM, Guillery RW. Functional organization of thalamocortical relays. J Neurophysiol. 1996;76:1367–1395. doi: 10.1152/jn.1996.76.3.1367. [DOI] [PubMed] [Google Scholar]
- 57.Shindo K, Shima K, Tanji J. Spatial distribution of thalamic projections to the supplementary motor area and the primary motor cortex: A retrograde multiple labeling study in the macaque monkey. J Comp Neurol. 1995;357:98–116. doi: 10.1002/cne.903570110. [DOI] [PubMed] [Google Scholar]
- 58.Siwek DF, Pandya DN. Prefrontal projections to the mediodorsal nucleus of the thalamus in the rhesus monkey. J Comp Neurol. 1991;312:509–524. doi: 10.1002/cne.903120403. [DOI] [PubMed] [Google Scholar]
- 59.van Donkelaar P, Stein JF, Passingham RE, Miall RC. Neuronal activity in the primate motor thalamus during visually triggered and internally generated limb movements. J Neurophysiol. 1999;82:934–945. doi: 10.1152/jn.1999.82.2.934. [DOI] [PubMed] [Google Scholar]
- 60.van Donkelaar P, Stein JF, Passingham RE, Miall RC. Temporary inactivation in the primate motor thalamus during visually triggered and internally generated limb movements. J Neurophysiol. 2000;83:2780–2790. doi: 10.1152/jn.2000.83.5.2780. [DOI] [PubMed] [Google Scholar]
- 61.Vitek JL, Ashe J, DeLong MR, Kaneoke Y. Microstimulation of primate motor thalamus: somatotopic organization and differential distribution of evoked motor responses among subnuclei. J Neurophysiol. 1996;75:2486–2495. doi: 10.1152/jn.1996.75.6.2486. [DOI] [PubMed] [Google Scholar]
- 62.White EL, Hersch SM. A quantitative study of thalamocortical and other synapses involving the apical dendrites of corticothalamic projection cells in mouse SmI cortex. J Neurocytol. 1982;11:137–157. doi: 10.1007/BF01258009. [DOI] [PubMed] [Google Scholar]
- 63.Wiesendanger R, Wiesendanger M. The thalamic connections with medial area 6 (supplementary motor cortex) in the monkey (Macaca fascicularis). Exp Brain Res. 1985;59:91–104. doi: 10.1007/BF00237670. [DOI] [PubMed] [Google Scholar]
- 64.Yamamoto T, Samejima A, Oka H. The mode of synaptic activation of pyramidal neurons in the cat primary somatosensory cortex: an intracellular HRP study. Exp Brain Res. 1990;80:12–22. doi: 10.1007/BF00228842. [DOI] [PubMed] [Google Scholar]