

Abstract
The projection of primary afferents onto spinal interneurons constitutes the first step in sensorimotor transformations performed by spinal reflex systems. Despite extensive studies on spinal somatotopy, uncertainties remain concerning the extent and significance of representational overlap and relation to spinal reflex circuits. To address these issues, the cutaneous projection from the hindpaw and its relation to the topography of lamina V neurons encoding withdrawal reflex strength (“reflex encoders”) was studied in rats. Thin and coarse primary afferent terminations in laminas II and III–IV, respectively, were mapped by wheat germ agglutinin-horseradish peroxidase and choleragenoid tracing. The functional weights of these projections were characterized by mapping nociceptive and tactile field potentials and compared with the topography of reflex encoders. Both anatomical and physiological data indicate that thin and coarse skin afferent input is spatially congruent in the horizontal plane. The representation of the hindpaw in the spinal cord was found to be intricate, with a high degree of convergence between the projections from different skin sites. “Somatotopic disruptions” such as the representation of central pads medial to that of the digits were common. The weight distribution of the cutaneous convergence patterns in laminas III–IV was similar to that of lamina V reflex encoders. This suggests that the cutaneous convergence and features such as somatotopic disruptions have specific relations to the sensorimotor transformations performed by reflex interneurons in the deep dorsal horn. Hence, the spinal somatotopic map may be better understood in light of the topography of such reflex systems.
Keywords: somatotopic, sensorimotor, receptive field, somatosensory, spinal cord, reflex, primary afferent
Although somatotopy is a ubiquitous organizational principle of the CNS, its functional significance remains unclear. Somatotopic maps have been ascribed the basis of perception (Kaas, 1997) but have also been regarded primarily as epiphenomena deriving from underlying principles of, for instance, wiring economy of the brain (Van Essen, 1997; Weinberg, 1997).
Spinal somatotopic maps have been investigated extensively. Primary afferent terminations, i.e., presynaptic somatotopy, have been resolved with tracer techniques at the level of single axons (Light and Perl, 1979; Sugiura et al., 1986; Brown et al., 1991; Shortland and Woolf, 1993; Wilson et al., 1996), skin patches, or whole nerves (Molander and Grant, 1985; Nyberg and Blomqvist, 1985; Swett and Woolf, 1985; Maslany et al., 1992). The topography of the postsynaptic neurons has also been studied extensively (Willis et al., 1973; Brown and Fuchs, 1975; Light and Durkovic, 1984; Wilson et al., 1986; Pubols et al., 1989; Bullitt, 1991; King and Apps, 2000). Most of these primarily descriptive studies are unanimous regarding overall organizational features of the spinal somatotopic map, such as the representation of proximal skin regions lateral to distal ones. Other features appear less consistent. The degree of representational overlap, for instance, has been reported as being everything from essentially absent to prominent (Light and Durkovic, 1984; Swett and Woolf, 1985; Woolf and Fitzgerald, 1986;Florence et al., 1988; Maslany et al., 1992; Shortland and Woolf, 1993). Most importantly, however, very few studies have explicitly addressed the functional significance or origin of spinal somatotopy (Koerber et al., 1993; Brown et al., 1997). One possible functional principle could be that spinal somatotopy is the result of developmental and phylogenetic processes adapting sensory input to motor output.
To test this hypothesis, we compare the spinal somatotopy with the organization of a functionally well characterized spinal system performing well defined sensorimotor transformations, namely the nociceptive withdrawal reflex (NWR) system. In rats and cats, this set of reflexes has a modular organization, each module controlling single muscles (Schouenborg and Kalliomäki, 1990; Schouenborg et al., 1992; Levinsson et al., 1999). The cutaneous input to a module matches the action of the output muscle; i.e., receptive field location and sensitivity distribution closely mirror the efficacy of skin withdrawal of the output muscle (Schouenborg and Weng, 1994). Interneurons that can encode such receptive field properties (“reflex encoders”) have been identified in the deep dorsal horn of spinal segments L4–L5 (Schouenborg et al., 1995). Whether these interneurons are directly intercalated in the withdrawal reflex (WR) circuit has not been tested, but their receptive field properties together with the finding that they were nonprojecting cells make them strong candidate NWR interneurons. The topography of these neurons is conspicuous by the succession, from medial to lateral lamina V, of neurons encoding receptive fields of different groups of hindlimb muscles and was therefore denoted “musculotopic.”
Here we map the spinal presynaptic (using tracing of coarse and thin afferents) and postsynaptic somatotopies in laminas II–IV and the musculotopic organization of single reflex encoder neurons (using electrophysiological techniques) in lamina V. Indeed, comparisons between the three levels of mapping suggest that the “first order” somatotopies reflect the musculotopic organization of reflex encoders in the deep dorsal horn.
Preliminary results have been published previously (Levinsson et al., 2000).
MATERIALS AND METHODS
The present report is based on data from 51 adult Wistar rats of both sexes, weighing 200–400 gm. The animals received food and waterad libitum and were kept in a 12 hr light/dark cycle at a constant environmental temperature of 21°C (humidity 65%). In addition, data on the receptive fields of 151 neurons recorded in 22 rats, included previously in a different study (Schouenborg et al., 1995), were used for comparisons. Approval for the experiments was obtained in advance from the Local Ethical Committee of Malmö/Lund.
Transganglionic labeling experiments. Twenty-six rats were used for transganglionic labeling experiments (Robertson and Grant, 1985; LaMotte et al., 1991). Eighteen of these were included in a different study and were subjected to transection of the right plantar nerves on the first postnatal day. Results obtained from the left side (plantar nerves unlesioned) were indistinguishable (with respect to size, details in appearance, and topography of the labeling) from those obtained from the left side in normal unlesioned rats and were therefore included in the normal material. In the eight rats that had undergone no previous experimental manipulations, both sides were used. Under chloral hydrate anesthesia (300 mg/kg, i.p.), 0.5 μl of either wheat germ agglutinin-horseradish peroxidase conjugate (WGA-HRP) (2%; Sigma) or the B subunit of cholera toxin (CTb) (1%; List) was injected into each of one to three sites of the skin on each hindpaw (see Table1). Previous studies have shown that CTb and WGA-HRP primarily label myelinated and unmyelinated fibers, respectively (Robertson and Grant, 1985; LaMotte et al., 1991; Broman et al., 1993).
Table 1.
Number of injections and (animals) for each injection site used for transganglionic labeling
| Injection site | WGA-HRP | CTb |
|---|---|---|
| Digits (distal phalanx) | 17 (10) | 20 (10) |
| Dorsal digits | 4 (2) | |
| Central pads | 8 (7) | 10 (10) |
| Heel | 7 (6) | 4 (4) |
| Dorsal foot | 4 (4) | 4 (4) |
| Total | 36 (12) | 42 (14) |
After either 3 d (WGA-HRP injections) or 7 d (CTb injections), the rats were deeply anesthetized with sodium pentobarbital and killed by transcardial perfusion. After a rinse with PBS (300 mOsm, pH 7.4), the rats were fixed with 1 l of either 1.25% glutaraldehyde and 1% paraformaldehyde (WGA-HRP experiments) or 4% paraformaldehyde (CTb experiments) in PBS. In WGA-HRP-injected rats, perfusion was terminated with a rinse of PBS. A dorsal laminectomy was made, and with the spinal cord in situ, the length of individual segments was measured with a micromanipulator before the spinal cord was removed and immersed in 30% sucrose in PBS at 4°C overnight. The caudal border of each segment was defined by the level of entrance of its caudalmost rootlet.
The removed lumbar spinal cords were cut horizontally (CTb experiments) or parasagittally (WGA-HRP experiments) at 40 μm on a freezing microtome. All sections were saved and processed. Sections from rats injected with WGA-HRP were processed with tetramethyl benzidine, ammonium heptamolybdate, and H2O2 as described previously (Broman et al., 1993) and mounted on slides. Transganglionic labeling in CTb-injected rats was visualized by immunohistochemistry as follows (with intervening rinses in PBS): (1) immersion in 0.3% H2O2 in distilled water, 20 min; (2) immersion in 0.1% glycine in distilled water, 30 min; (3) incubation in 5% normal rabbit serum diluted in PBS containing 0.5% bovine serum albumin (BSA) and 0.5% Triton X-100 (PBS-T), overnight (room temperature); (4) incubation in a 1:1 mixture of two mouse monoclonal antibodies against CTb (clones CT2 and CT9; kindly provided by Dr. Marianne Wikström, Göteborg University, Göteborg, Sweden) diluted 1:50 in PBS containing 2% normal rabbit serum, 0.5% BSA, and 2% Triton X-100, 2 d; (5) incubation in rabbit anti-mouse secondary antibodies (Dakopatts; 1:50 in PBS-T), 1 hr; (6) incubation in mouse monoclonal peroxidase-antiperoxidase complex (Dakopatts; 1:120 in PBS-T), 1 hr; (7) visualization of bound peroxidase by incubation of sections for 10–15 min in the chromagen Vector SG (Vector) diluted according to the manufacturer's instructions. The sections were then rinsed and mounted on slides.
Transganglionic labeling was documented using a digital microscope camera (Polaroid DMC) at 40× magnification. Light-field (CTb experiments) and dark-field (WGA-HRP experiments and for delineation of borders between gray and white matter in CTb experiments) optics were used. Photomontages of the sections were made in Adobe Photoshop and prints (final magnification of approximately 60×) were prepared and used to construct dorsal view maps of the labeling. Landmarks, such as blood vessels, were used to align adjacent sections. To display the relations between labeling and the medial border of the dorsal horn, this was considered as a vertical plane along which horizontal sections were aligned. Hence, to facilitate the comparison between physiological and morphological data, the somewhat curved laminar sheets were not straightened out (cf. Koerber and Brown, 1982; Molander and Grant, 1985). A small scale difference, in comparison with studies using this method, will therefore be present in the mediolateral axis of dorsal view maps.
Surgery and preparation for field potential and single neuron recordings. Electrophysiological recordings were made in 25 rats, which were anesthetized with halothane (1.0–2.0%) in a mixture of 65% nitrous oxide and 35% oxygen and ventilated artificially via a tracheal cannula. The expiratory CO2 (3.0–4.5%) was monitored continuously. An infusion of 5% glucose in Ringer's acetate, pH = 7.0, at a rate of 30–50 μl/min was administered via the right jugular vein. Mean arterial blood pressure (75–140 mmHg) was monitored continuously in the right carotid artery. Core temperature was maintained between 36.5 and 38.5°C using a feedback-regulated heating system. Careful local infiltration of lidocaine (2.0 mg/ml) with adrenaline (1.2 μg/ml) was used to reduce nociceptive input during surgery and to minimize possible postoperative excitability changes (Clarke and Matthews, 1990). A craniotomy was performed, and after bilateral ligation of the common carotid arteries, the brain rostral to the inferior colliculus was removed by suction. Anesthesia was then discontinued, and the animal was paralyzed with pancuronium bromide. A laminectomy of the 10th thoracic vertebrae was made, and the rat was spinalized using a pair of fine scissors. A laminectomy of the vertebrae T13, L1, and L2 was also made. Stabilization of the preparation was accomplished by clamping the spinal processes of the vertebrae rostral and caudal to the laminectomy. The dura was removed, and the exposed spinal cord was covered by agar (2% w/v) in saline. Experiments were terminated after signs of deterioration, such as a precipitous drop in blood pressure or expiratory CO2 level.
Field potential mappings. The early component of extracellular field potentials is generally held to reflect mainly synaptic currents (Mitzdorf, 1985; Willis and Coggeshall, 1991). The marked differences in the field potential input to nearby recording sites (see below) and the rapid decline of extracellular spike amplitude with distance from a single neuron suggest that such recordings have a high spatial resolution. Thus, to obtain information on the functional projection of primary afferents, extracellular field potentials evoked by tactile or nociceptive skin stimulation were studied. Glass-coated tungsten microelectrodes (1–5 MΩ at 1 kHz) were used for recordings of field potentials. Data were collected using computer software “EGAA” (RC Electronics Inc., Goleta, CA) or “Spike2/Signal” (Cambridge Electronics Design) and stored on hard disk. Mappings were made in the transverse or horizontal (see Fig.8B) plane through the dorsal horn. For each recording point, the skin on the hindpaw was stimulated (1–2 skin sites for transversal maps and 11–25 skin sites for horizontal maps; for stimulus parameters, see below). Typically 70–90 and 50–80 recording sites for each transverse and horizontal map, respectively, were used. In each track of the horizontal maps of tactile input, recordings were made at the depth at which the largest Aβ potentials were evoked by gross electrical stimulation (15 μA, 0.2 msec pulse width) of the plantar skin. This resulted in recordings in laminas III–IV (see Fig.5). After termination of recordings, electrical lesions were made by passing current (30 sec, 5mA DC) through the recording electrode. The animal was then perfused with 10% formalin in saline, and the segmental borders were determined. The spinal cord was taken out, immersed in 30% sucrose overnight, cut in 40 μm sections on a freezing microtome, and stained with Cresyl violet. Coordinates of the electrical lesions were used to verify the recording positions.
Fig. 8.
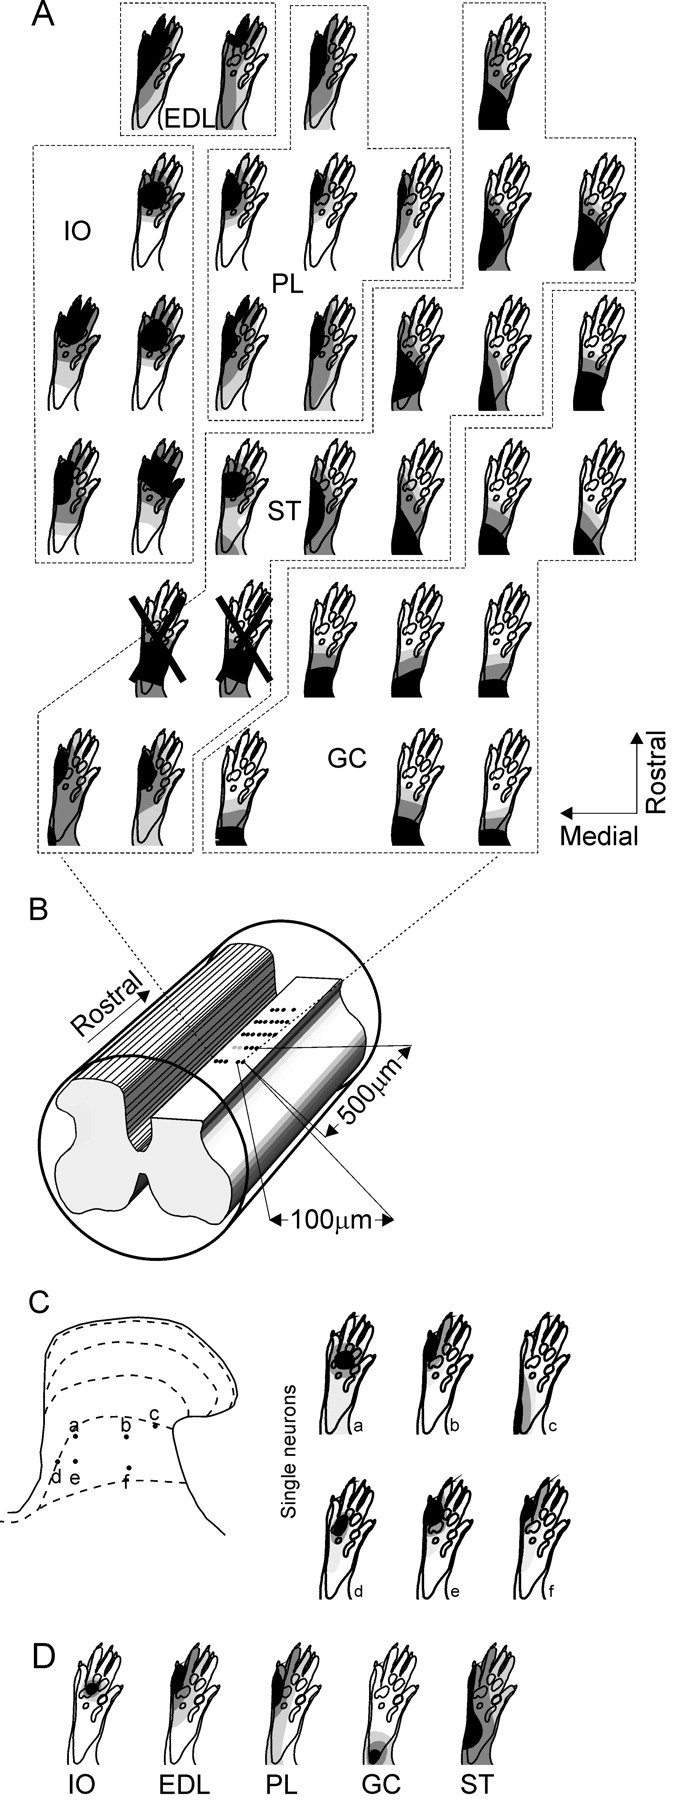
Spatial convergence patterns of tactile input (SCPTI; A) as determined with field potentials recordings in a horizontal plane in laminas III–IV of the L5 segment and comparison with previous receptive field data for single reflex encoder neurons in lamina V (C) and withdrawal reflexes (D; EMG data) to some hindlimb muscles. Spike counts from single neuron recordings and EMG and field potential amplitudes were processed in an identical way to construct quantitative receptive fields and SCPTI, respectively (see Materials and Methods).Light gray, dark gray, andblack indicate skin areas from which evoked responses were 0–30, 30–70, and 70–100%, respectively, of maximal response.A, SCPTI of laminas III–IV. The outermost contour was set at 50% of the maximal response for that spinal cord site. SCPTI with a high degree of similarity with withdrawal reflex receptive fields of single hindlimb muscles (correlation coefficient >0.7;p < 0.001, Student's t test; seeD for muscle abbreviations) are shown. SCPTI with a correlation coefficient <0.7 were considered not similar to the reflex pathways and are crossed out. Areas exhibiting SCPTI similar to the withdrawal reflex of a muscle are delimited with hatched lines and denoted with the muscle abbreviation.B, Schematic illustration of recording sites.Black dots indicate tracks where the SCPTI exhibit a high degree of similarity (correlation coefficient >0.7) with withdrawal reflex receptive fields in D. Gray dots indicate recordings of SCPTI with a correlation coefficient <0.70 with withdrawal reflex receptive fields.C, a–f are receptive fields of reflex encoder neurons as mapped with calibrated noxious pinch [data obtained from Schouenborg et al. (1995)]. Cellsa–c andd–f were obtained in two different experiments. Approximate recording positions are indicated in the schematic of L5 dorsal horn. D, Average receptive fields of withdrawal reflexes for a sample of rat hindlimb muscles [data fromSchouenborg and Kalliomäki (1990) and Schouenborg et al. (1992)]. IO, Interossei muscles; EDL, extensor digitorum longus muscle (digits 4, 5); PL, peroneus longus muscle; GC, gastrocnemius muscle;ST, semitendinosus muscle. Note the groups of SCPTI (A) with similarities to withdrawal reflex receptive fields (D) and reflex encoder neurons (C).
Fig. 5.

Sample of transverse map in the caudal L4 segment. Samples of individual sweeps (left) from which the iso-response maps (right) were constructed. Isopotential curves of tactile and laser input are labeled with blueand red scales, respectively. Stars in iso-response maps indicate recording positions of sample sweeps. Field potential amplitudes of tactile and laser maps were measured at the latencies indicated with vertical lines labeledT and L, respectively.Arrowhead indicates stimulus onset.Arrows indicate electrode tracks, CO2-laser stimulation, and tactile stimulation of distal plantar digit 4. Amplitudes of responses are given as percentage of maximal responses for laser and tactile stimulation, respectively. Note the laser evoked field potential focus dorsal to the focus evoked by tactile stimulation.
Construction of isopotential maps. The amplitude of the tactile and laser evoked field potentials was determined at different latencies using a computer program designed by the authors. For each stimulated skin site, response amplitudes were then mathematically transferred into a high-density grid of evoked responses, which was used to generate an iso-response map (Kriging algorithm; “Surfer,” Golden Software, Inc.) of the input from a skin site to the spinal cord. For the horizontal maps, the distance between recording sites was greater in the rostrocaudal direction (500 μm) than in the mediolateral direction (75–100 μm), requiring compensation when generating the high-density grids (“anisotrophy”: 0.2). This was not done for the transverse maps because dorsoventral distance between recording sites was approximately the same as the mediolateral distance (see above).
Single cell receptive fields and field potential input to laminas III–IV. Receptive fields of single cells in lamina V and input to laminas III–IV as detected with field potentials were recorded with glass microelectrodes filled with 3 m sodium chloride (7–12 MΩ at 1 kHz). Single cells were sought ventral to the area of maximal Aβ input using electrical search stimulus. The receptive fields of neurons receiving both nociceptive and tactile input [wide dynamic range (WDR) type] were quantitatively mapped using noxious pinch (for stimulus parameters, see below). The number of spikes evoked during 1 sec of constant pinch force was determined for a large number of spatially unbiased skin sites (typically 30–40). Using the original number of evoked spikes assigned to their respective stimulus sites (each corresponding to an x–y coordinate on the paw), a high-density grid (∼2700 standard points in thex–y coordinate system) of evoked responses (z values of the x–y coordinates) was mathematically derived (Kriging algorithm; Surfer, Golden Software, Inc.). To reduce data noise, the grid z values were spatially averaged (“smoothed”; 11 × 11 matrix, weight of matrix center = 2) and then used to generate an iso-response map corresponding to a quantitative representation of the spatial weight distribution within the receptive field. The derived iso-response maps closely adhered to the raw data (correlation, r, between the raw data and the closest corresponding smoothed grid z value was 0.94; p < 0.001; five randomly chosen receptive fields including a total of 135 stimulation sites). This quantitative mapping procedure has been used extensively in previous studies from our laboratory, reliably yielding highly reproducible receptive fields (cf. Ekerot et al., 1991; Schouenborg et al., 1995; Garwicz et al., 2002).
The spatial convergence patterns of tactile input (SCPTI), as determined from recordings of evoked field potentials in laminas III–IV (11–30 skin sites per experiment), were represented in an analogous way (field potential amplitude instead of spike count). The animal was perfused as above with the electrode in situ, and the sectioned spinal cord was used to determine mediolateral recording positions.
A quantitative comparison of the spatial characteristics of the SCPTI, the receptive fields of reflex encoder neurons, and receptive fields of withdrawal reflexes of single hindlimb muscles was made. Different SCPTIs and receptive fields were compared by linear correlation analysis between z values of individual grid points in the high density (x–y) grids of evoked responses described above. Data for individual comparisons included all grid points falling within any of the two fields to be compared (Schouenborg et al., 1995). Student's t test was used to calculate the statistical significance of the correlation values. The original number of stimulated skin sites was used to define the degrees of freedom in the Student's t test.
Stimulation of the skin. Time-locked tactile stimulation was given using a handheld, electrically triggered tapping device (contact surface circular; diameter 0.8 mm; stroke length 1 mm; time from stimulation onset to skin contact ∼1.5 msec). To evoke time-locked nociceptive input, a CO2-laser (Irradia, Stockholm, Sweden) was used (2 W, 20–30 msec pulses; stimulated skin area ∼0.8 mm2). When tested on the dorsal side of the experimenters' hands, these stimulus intensities evoked a weak short-lasting pricking pain. For CO2-laser stimulation, care was taken not to stimulate exactly the same site consecutively. The interstimulus interval for the same skin point was thereby >5 min. For receptive field mapping of single cells, a handheld noxious pinch device was used. The flat surface of a pair of forceps (1 mm2 on each side) equipped with a force-transducer was applied to a skin flap of ∼4 mm2, and the pinch force was increased (∼1 N/sec) and kept at 2 N (using auditory feedback) for >1 sec (Schouenborg et al., 1992). This pinch force caused weak to moderate pain when applied to the skin of our own hands and did not result in any visible tissue damage, consistent with findings in previous work (Schouenborg et al., 1992; Holmberg and Schouenborg, 1996b). To avoid changes in reflex excitability, the interval between stimulation of consecutive skin sites was ∼1 min.
To determine the degree of activation of skin receptors at some distance from the site of tactile stimulation, the field potential amplitudes were measured before and after transection of the plantar nerves (two rats). The plantar nerves were identified through a skin incision medial to the Achilles tendon and soaked with lignocaine with adrenaline (concentrations as above) for at least 3 min before transection. At skin sites (n = 5) known to be innervated by the plantar nerves only, such as the central parts of the paw, this resulted in a reduction of the field potential amplitudes by 90%, on average. Thus, the tactile field potentials are mainly evoked by activity in afferents from the stimulated skin site. The origin of the remaining small potential is not known, but because its amplitude did not increase by stimulus proximity to skin innervated by other nerves, it could represent activation of deep receptors in the paw or cutaneous ones at the dorsal ankle, where the paw was supported from underneath. Spread of the stimulation is presumably negligible when using CO2-laser, which results in a very local, short-lasting heating of the skin. For purposes of illustration and to avoid display of unspecific activity, we present only isopotential maps of skin sites evoking potentials of a magnitude of >50% of maximum in the respective experiment throughout this paper.
RESULTS
Tracing experiments: general observations
The topography of primary afferent termination was visualized by transganglionic transport of CTb (14 rats) or WGA-HRP (12 rats) injected into the skin. Light microscopic examination of CTb-immunolabeled spinal cord sections revealed dense patches of labeling in laminas III–IV (Fig.1A), with no or only sparse labeling in lamina II. Examination at a higher magnification demonstrated a Golgi-like labeling that made it possible to distinguish terminals and fibers (Fig. 1B). Only scattered fibers and terminals were evident outside the dense foci of labeling (Fig.2A). This was seen in laminas III–IV, both medial/lateral and caudal/rostral to the focus area. Furthermore, ventral to the dense foci of labeling in laminas III–IV there was a diffuse sparser and apparently nontopographic labeling of fibers and terminals that extended over several spinal cord segments (Fig. 2B). Because the focus of the present study was on the somatotopic termination in laminas III–IV, this diffuse labeling was not included in the dorsal view maps.
Fig. 1.

Spinal labeling after transganglionic transport of tracers. A, Low-power photomicrograph demonstrating CTb immunolabeling in a horizontal section through the dorsal horn (caudal is to the left). This rat was injected with CTb into the heel and digit 4 of the left hindpaw (labeling in top half of the micrograph) and into digit 4 (labeling in thebottom half of micrograph) and digit 1 of the right hindpaw (digit 1 labeling rostral to the micrograph). InB, the labeling after the injection into the right digit 4 is shown at higher magnification. Note the clear labeling of terminals and fibers. C, Low-power dark-field photomicrograph of transganglionic WGA-HRP labeling (arrows) in the dorsal horn in a parasagittal section through the spinal cord. Dorsal is upward and caudal is to the left. WGA-HRP was injected into digits 2 and 4. Note dense labeling in lamina II. At higher magnification (D, light-field micrograph), the particulate appearance of the labeling is evident. Scale bars: (shown in A)A, C, 1 mm; (shown in B)B, D, 100 μm.
Fig. 2.

Montage of micrographs showing a dense focus of termination and scattered terminals outside this area in laminas III–IV (A) and diffuse labeling 240 μm (6 sections) ventral to this (B) after CTb injection in digit 5. Medial is upward and rostral is to theright. Inset shows detail from theboxed area. Scale bar (shown in B forA and B): 250 μm.
Examination of sections from WGA-HRP-injected rats demonstrated dense foci of labeling in lamina II (Fig. 1C,D). At higher magnification, WGA-HRP labeling appeared as punctuate or crystalline granules (Fig. 1D). Thus, in comparison with the CTb-immunolabeled sections, the distinction between fibers and terminals was less straightforward in the WGA-HRP material. However, because the labeled fibers in Lissauer's tract were sparse, most lamina II labeling is likely to reflect terminal or preterminal labeling of mainly unmyelinated cutaneous afferents. Sparse labeling seen in laminas III–IV just ventral to the dense foci in lamina II (Fig. 1C,D), and topographically aligned in the horizontal plane, probably represented a limited tracer uptake by cutaneous myelinated fibers from the same skin area and occasional unmyelinated terminals (Sugiura et al., 1986). For WGA-HRP, only the labeling in lamina II was included in the construction of dorsal view maps (see below).
Topography of primary afferent termination
The topographies of the primary afferent terminations as revealed in dorsal view maps of WGA-HRP (Fig.3A,B,left) and CTb (Fig.3A,B, right) labeling were very similar, with slightly larger patches of labeling for the latter. Although the termination fields of afferents from most skin sites had an elongated “cigar-like” shape in the dorsal horn, the projection from certain sites exhibited more complex spatial patterns. For example, injection of CTb in digit 4 resulted in a characteristic forked termination (Figs.1A,B,3A,e,f).
Fig. 3.

A, Samples of dorsal view maps of primary afferent termination from different skin sites on the hindpaws. Skin injection of WGA-HRP (a–d) or CTb (e–h) at the sites indicated in paw schematics. In each sample the medial border of the dorsal horn is to the left. The images have been mirrored when suitable. Sections c and d and g andh are pairs of the two sides from one animal. Segmental borders in e are applicable for all sections. Vertical bar, 1 mm. B, Samples of dorsal view maps aligned with respect to the caudal heel projection area to illustrate the interanimal variation of primary afferent termination. Data from WGA-HRP-injected (i–l) and CTb-injected (m–p) rats are shown. The medial border of the dorsal horn (to the left in each sample) has been straightened out. Skin injections were made at the sites indicated in the paw schematic. Vertical bar, 1 mm. Note the low variation in rostrocaudal position of termination fields and the high congruency between thin and thick fiber projections.
The different skin sites injected with CTb or WGA-HRP are listed in Table 1. Digits 1–5 were represented in a rostrocaudal succession (Fig.3A,a,d,e–h), and adjacent digits were found to have partially overlapping spinal projections (see Fig. 7). The dorsal digit skin projected lateral and slightly rostral to the plantar digit skin (Fig.3A,g,h), whereas the central pads were found to project to the most medial parts of the dorsal horn (Fig.3A,b–d,f), partly overlapping the digit projections. Analogous to the digits, lateral pads were found caudal to medial ones. Tracer injections in the heel (Fig. 3B) resulted in one patch of labeling in mid L5 and usually (four or four animals for CTb and three of seven for WGA-HRP) one patch in the medial part of mid L3. Areas of spinal cord labeling differed somewhat in size between animals, and rostrocaudal disparities of individual skin site projections of up to approximately half a segment were seen. This interanimal variation appears to be explained primarily by variations in segmental borders: the length of the L4 segment for instance varied from 2.1 to 3.6 mm (cf. Molander and Grant, 1985). If the topographical plots were aligned with respect to the caudal heel termination, the maximal rostrocaudal spread for the termination centers of each of the other skin sites was on average 720 ± 367 μm (10 rats) (Fig. 3B). Bilateral injections into homologous skin sites resulted in labeling with a high degree of symmetry. Furthermore, from the comparison in Figure3B, it can be seen that there is a high degree of congruency between thin and thick fiber projections in lamina II and laminas III–IV, respectively.
Fig. 7.

Comparison of CTb-labeled primary afferent terminations and tactile field potentials in laminas III–IV (depth below surface 600 ± 100 μm) in the horizontal plane for corresponding skin sites. The maps are aligned with respect to the L4–L5 segmental border. Field potential maps were obtained from two animals (top and bottom left), and primary afferent termination maps were obtained from three animals (superimposed to the right). Isopotential levels with an amplitude >50% of maximum are shown. In each map, caudal isdown, and the medial line of respective plotted areas corresponds to the medial border of the dorsal horn. Orange plus signs indicate electrode penetrations. Skin sites that received tactile stimulation or CTb injection are indicated in paw schematic and color coded. Vertical bars indicate 200 μm. It can be seen that, for each skin site, a region of dense transganglionic labeling corresponds to a field potential focus. In addition, marked field potentials were sometimes evoked well outside the area expected from the dense transganglionic labeling. For example, stimulation of digit 1 evoked marked field potentials in L5 (bottom left,red).
Field potential characteristics
Field potential recordings were made in a total of 25 rats. Tactile stimulation of the paw evoked field potentials with an amplitude of up to 1.5 mV and a duration of <50 msec. (Figs.4B,5). The onset latency (corrected for stroke time of tactile stimulator; see Materials and Methods) was typically ∼4.5 msec, indicating that the potentials were evoked by activity in coarse fibers, presumably of Aβ type. The onset latency for Aβ fiber evoked field potentials after electrical stimulation of the paw was ∼3 msec, indicating a receptor activation time of ∼1.5 msec. In two animals, compound action potentials (CAPs) in a cut dorsal root evoked by tactile stimulation of the paw was recorded with bipolar silver hook electrodes in mineral oil, and the onset latency was compared with that of field potentials in the dorsal horn (Fig. 4). When the conduction time from the recording site of the CAPs to the dorsal horn was subtracted, a latency difference of ∼0.5 msec remained, indicating that the early components of tactile field potentials are of monosynaptic origin.
Fig. 4.

Compound action potential (CAP;A) in the dorsal root and field potential in the dorsal horn (B) after tactile stimulation of the lateral-most central pad. CAP was recorded with bipolar silver hook electrodes in mineral oil, and field potential was recorded with a glass micropipette. Broken lines indicate onset of the potentials. Latency difference was 0.7 msec. The distal hook electrode was ∼10 mm from the field potential registration site, which would give a conduction time of 0.2 msec (assuming a conduction velocity of 50 m/sec) between the registration sites of the potentials, leaving 0.5 msec for synaptic transmission. Arrowheads indicate onset and offset of stimulation. Average of 25 (A) and 10 (B) stimulations.
CO2-laser stimulation typically evoked long-latency (∼220 msec) field potentials, indicating an input from unmyelinated fibers (Fig. 5). The duration was typically ∼100 msec. The long latency of these potentials precluded a detailed analysis of the central delay. However, the potentials were evoked in areas of the spinal cord known to receive the bulk of unmyelinated afferents, and the early phase of nociceptive C fiber evoked potentials on cutaneous nerve stimulation have been shown previously to be of monosynaptic origin (Schouenborg, 1984; Liu and Sandkühler, 1997). Hence, it is reasonable to assume that at least the early phase of the CO2-laser evoked potentials reflects the synaptic current evoked in first-order dorsal horn neurons.
In summary, the field potential maps in this paper can be seen as the monosynaptic functional connection between primary afferents and spinal neurons, although a small contribution from polysynaptic connections cannot be excluded. This conclusion is further corroborated by the temporal dynamics of isopotential maps of spinal cord input, illustrated in Figure 6. Horizontal isopotential maps at different latencies after stimulus onset for two different skin sites mapped in separate experiments are shown. When a focus appeared, it typically remained stationary for ∼2 msec. At longer latencies a shift of focus was often seen (Fig.6A,B).
Fig. 6.

Temporal aspects of horizontal field potential isopotential maps in laminas III–IV (depth 600 ± 100 μm below surface of spinal cord) from two different experiments. The field potential amplitude was measured at different latencies after stimulation (indicated in bottom left corner of each map). Stimulated skin site for isopotential maps in Aand B are indicated in paw schematics to theright. In each map, caudal is down, and the medial border of the dorsal horn corresponds to the left margin (see left-most map inA). Scale bar, 500 μm. A, Isopotential horizontal maps covering the rostral two-thirds of L4 after lateral pad stimulation. Note that anatomical data did not indicate any projection from this pad to the L4 segment (Figs. 3, 7). B, Isopotential maps covering L5 segment (the caudal border of each segment was defined by the level of entrance of its caudalmost rootlet). Note the focus apparent at latencies 5.5–6.5 msec, which then spreads laterally and rostrally.
Transverse plane field potential mapping
To study the laminar distribution of tactile and nociceptive input and the topographical relation between the two, field potential maps were constructed from data collected in a transverse plane through the dorsal horn (four rats). The derived isopotential maps showed that the foci of tactile and laser stimulation were located in laminas III–IV and lamina II, respectively (Fig. 5). The nociceptive focus was located just dorsal to the tactile focus, which would indicate that the input from the two types of cutaneous stimulation was spatially aligned along a dorsoventral axis. This finding supports the conclusion from the tracing experiments that the terminations of thin and coarse fibers are spatially aligned. In line with the results of transganglionic tracing, thin afferent input (CO2-laser stimulation) resulted in a less extensive focus than coarse afferent input (tactile stimulation). In addition to the clearly distinguishable focus in the superficial dorsal horn, scattered small foci of activity were seen in deeper laminas after CO2-laser stimulation. Furthermore, at superficial recording sites, a field potential of much shorter latency was sometimes observed, consistent with input mediated by Aδ fibers. For unknown reasons, these short-latency CO2-laser evoked potentials were not reliably evoked; therefore, isopotential maps were not possible to construct.
Postsynaptic somatotopy and its relation to primary afferent termination
To obtain information on postsynaptic somatotopy of tactile input, touch evoked field potentials were recorded and subsequently plotted in horizontal maps of laminas III–IV (Figs. 6,7) (six rats). In general, a rostrocaudal distance of 2 mm or more was covered in each experiment. In each rat, 11–25 different skin sites were stimulated, and for each of these an iso-response map of the field potentials in the dorsal horn was constructed. Figure 7 shows field potential maps for a selection of skin sites and a comparison with data on CTb-labeled primary afferent termination from the same skin sites. The somatotopic maps derived from tracing and field potential experiments were similar, indicating a good correspondence in the topographical relations between projections from different skin sites as observed with the two methods. For example, in no case were there any shifts in the rostrocaudal succession of medial to lateral digits. For input from a given skin site, a region of dense transganglionic labeling in the spinal cord usually coincided with a field potential focus (Fig. 7). To provide a measure of the similarity between the maps, the mean rostrocaudal distance from the L4–L5 segmental border to the centers of the field potential focus and the dense CTb termination area was determined for each of 11 skin sites. The correlation coefficient and difference between corresponding rostrocaudal distances was 0.89 (linear regression analysis,p < 0.001; Student's t test) and 736 ± 448 μm, respectively. Thus, the differences between the two maps were within the expected level taking into account interanimal variations in segmental borders (up to approximately half a segment; see above), details in the appearance of the maps, and resolution of the methods (e.g., ±250 μm in rostrocaudal axis for field potentials). However, marked field potentials were sometimes seen well outside the region of dense termination (>2 mm away) and may be the result of activity in synapses formed by scattered terminals seen outside the dense focus (Fig. 2A). Furthermore, because they covered larger regions, field potential foci evoked from different skin sites appeared to overlap more than the regions of corresponding transganglionic labeling.
Cutaneous convergence patterns in different spinal cord sites and their relation to reflex interneurons
A given spinal cord site received input from large portions of the paw. To determine the spatial weight distribution of the input, the tactile input strength from different skin sites to all recording sites in the dorsal horn was analyzed and presented as SCPTI. Continuous areas in the dorsal horn with similar SCPTI were often found. Adjacent to such homogenous areas, the SCPTI could differ dramatically (Fig. 8). Central pad-centered SCPTI tended to be located in the most medial electrode tracks followed by, in a medial to lateral succession, digit-centered receptive fields and more proximally centered ones.
A correlation analysis was made between the recorded SCPTI and the weight distribution of receptive fields of WRs of single hindlimb muscles (Fig. 8D) [data from Schouenborg and Kalliomäki (1990) and Schouenborg et al. (1992)]. The distributions were considered similar when the correlation coefficient between the SCPTI and one of the WR receptive fields was higher than 0.7 (p < 0.001; Student's t test) (see Materials and Methods for details on the correlation analysis). In the L5 segment, 80% of the SCPTI was similar to the weight distribution of one of the WR receptive fields. In Figure 8, dorsal horn areas in the L5 segment exhibiting SCPTI similar to the WR receptive fields are delimited. In the L4 segment, the similarity between SCPTI and WR receptive fields was less apparent (24% of the recorded SCPTI was similar to the weight distribution of one of the WR receptive fields).
The mediolateral sequence of SCPTI in L5 was reminiscent of the sequence of receptive fields of putative withdrawal reflex interneurons found in the deep dorsal horn in a previous study (Fig. 8C) [data from Schouenborg et al. (1995)]. Such neurons were found to be frequent in lamina V of the L5 segment and to a lesser extent in L4. Because they exhibit receptive fields with a sensitivity distribution indistinguishable from those of withdrawal reflexes of single muscles, they were termed reflex encoders, although they have not been positively identified as interneurons in the NWR circuitry. The similarities in topography of SCPTI in laminas III–IV and reflex encoder neurons in lamina V could indicate that reflex encoder neurons of a particular type are found ventral to a region of tactile input with similar weighting of input as the corresponding reflex encoder.
To test this hypothesis, the relation between the spatial distribution of the input of field potentials and receptive fields of reflex encoders was analyzed in more detail in six animals (Fig.9). A total of 23 cells, recorded extracellularly at depths previously shown to contain reflex encoder neurons (notably lamina V), were characterized with respect to cutaneous receptive field and activating stimuli. The recorded spikes were characterized by a biphasic wave shape and an amplitude clearly distinguishable from background noise. Twelve of the cells were activated by both tactile and nociceptive input and exhibited receptive fields similar to those of single muscles (correlation coefficient >0.7; p < 0.001, Student's t test) and were therefore classified as reflex encoders. Lamina V WDR neurons that did not exhibit spatial characteristics similar to the withdrawal reflexes of any hindlimb muscle were also encountered (n = 7). The topography of the reflex encoder neurons confirmed previous data of a musculotopic organization (see introductory remarks) (Schouenborg et al., 1995). After the receptive field of a reflex encoder was mapped, the SCPTI in laminas III–IV was determined in the same and adjacent tracks. The results of two such experiments are shown in Figure 9. The receptive fields of the cells exhibit a high degree of similarity with the following muscle receptive fields (Schouenborg et al., 1992, their Figs. 4–6):A, musculus (m.) peroneus longus; B, m. extensor digitorum longus, digits 4, 5; C, m. extensor digitorum longus, digits 2, 3; D, m. peroneus longus; E, m. semitendinosus. For all but SCPTI 3, the SCPTI in laminas III–IV are strikingly similar to the receptive fields of the reflex encoders in the deep dorsal horn, indicating a topographical correspondence between the tactile input to laminas III–IV and reflex encoder topography. Of 12 reflex encoder neurons recorded in the six animals, 8 were highly similar (correlation coefficient >0.7; range 0.72–0.95; p < 0.001, Student's t test) to the SCPTI in the same track.
Fig. 9.

Samples of SCPTI in laminas III–IV (1-7) and receptive fields of reflex encoder neurons in lamina V (A–E). A andB and 1 and 2 were recorded in L4 in one experiment, and C–E and3-7 were recorded in L5 in a different experiment. Approximate recording positions are indicated in dorsal horn outlines. Arrows indicate electrode penetrations. With the exception of 3 and C, there is a high degree of similarity between receptive field of reflex encoder neuron and field potential convergence more dorsal in the same or adjacent track. Correlation coefficients are inparentheses. Conventions are as in Figure 8. In the material as a whole, 8 of 12 reflex encoder neurons exhibited a correlation coefficient >0.7 in comparison with SCPTI in the same track.
DISCUSSION
A complex spinal somatotopy exhibiting a high degree of representational overlap is demonstrated using both anatomical and electrophysiological techniques. Furthermore, the spinal somatotopic map of laminas III–IV appears to have a specific spatial relation to the topography of lamina V reflex encoder neurons. Because these neurons have characteristics that indicate a central role in sensorimotor transformation, we suggest that the spinal somatotopic map is not primarily a reflection of somatosensory discriminative functions of the CNS but rather related to the organization of spinal sensorimotor integrating circuits. It is notable that this would make sense from a phylogenetic perspective because the sensorimotor integrating functions of CNS would presumably precede the more “purely” sensory discriminative functions.
Presynaptic and postsynaptic somatotopy and their relation
We have used skin injection of small quantities of CTb and WGA-HRP, which are mainly transported by coarse and thin primary afferents, respectively. Results obtained with both tracers suggest a significant overlap in the dense terminations from different skin sites. As discussed extensively in previous studies (Molander and Grant, 1985; Nyberg and Blomqvist, 1985; Maslany et al., 1992), this interpretation is crucially dependent on the degree of tracer spread in the periphery. Indeed, these studies indicated an overlap in the spinal termination of afferents from different skin sites. The findings that identical tracing protocols resulted in minimal overlap in the dorsal column nuclei (Florence et al., 1989; Maslany et al., 1991) and that injections of tracers in adjacent digits resulted in partly overlapping termination patterns indicate that the overlap is not an artifact from spread of tracer in the skin. The tracer volumes injected in the present study were smaller than in previous studies (Molander and Grant, 1985; Florence et al., 1991; Maslany et al., 1992), and tracer injection in the dorsal and ventral side of a digit resulted in primarily separate terminal fields. Thus, the problem of peripheral tracer spread is presumably limited. In addition, it should be noted that the topography of termination of cutaneous coarse afferents displayed in the reconstructions does not include scattered terminals outside the dense foci of labeling. Previous electrophysiological and morphological data (Wall and Werman, 1976; Meyers and Snow, 1984;Shortland and Wall, 1992; Koerber and Mirnics, 1995) indicate that these may be collaterals of axons with their main termination in the dense focus. Thus, the morphological overlap of primary afferent terminations is actually larger than indicated by the dorsal view maps.
The morphological overlap seen in the tracing experiments was paralleled by a large functional overlap as demonstrated with extracellular field potentials. Field potential recordings indicated an extensive divergence of projections from single skin sites, corroborating previous data on single fiber projections and the cord dorsum potentials that they evoke (Koerber et al., 1990; Koerber and Mirnics, 1995). The Aβ fiber evoked field potentials in laminas III–IV mainly reflect currents in the synapses between primary afferent fibers and spinal neurons, and the spread of current in the spinal cord is presumably small. The field potential data would therefore indicate that there is a substantial overlap in the functional cutaneous projection to the spinal cord (see also below).
Field potential foci were sometimes seen well outside the area of dense focus of primary afferent termination. Although morphological and electrophysiological data were not obtained in the same animal, it would suggest that the scattered terminals could evoke activity of significant amplitude. Hence, the amplitude of the evoked postsynaptic activity may be determined by the strength of the individual synapses as well as by the density of terminals.
Multimodal convergence
The somatotopic patterns revealed by the two tracers were very similar, indicating that the main termination of unmyelinated and myelinated afferents is concordant. This is supported by the field potential maps made in the transversal plane in the present study and also by previous data obtained using electrical nerve stimulation (Schouenborg, 1984). The functional projections of myelinated and unmyelinated afferents would be well aligned along an axis approximately perpendicular to Rexed's laminas. This spatial arrangement of input of different modalities may facilitate the synthesis of multimodal receptive fields characteristic of different classes of spinal interneurons. Moreover, a concordance of the input may be favorable for intermodality interactions (Cervero and Iggo, 1980; Nilsson and Schouenborg, 1999), such as the inhibition of transmission in nociceptive and itch pathways by input in tactile and nociceptive fibers, respectively.
The spinal somatotopic map
On a gross level our data are compatible with previous descriptions of spinal somatotopy but differ in the details and interpretation. As described previously, medial to lateral digits were represented in a rostrocaudal succession (Molander and Grant, 1985;Maslany et al., 1992). Not surprisingly, this succession was seen also for medial to lateral pads of the paw. Exceptions to the principle organization that distal skin is represented medial to proximal skin were observed. For example, the central pads were represented medial to the digits, dorsal skin was represented more lateral than plantar skin (cf. Florence et al., 1989, their Fig. 14), and the heel often had a double representation, where the rostral labeling was seen in the medial extreme of L3. Such “somatotopic disruptions” (Florence et al., 1991) and the prominent representational overlap are not easy to reconcile with a description of the somatotopic map in terms of a distorted image of the paw (Molander and Grant, 1985; see also Weinberg, 1997). Below we discuss the possible functional significance of the spinal somatotopic map in the context of sensorimotor integration.
The relation between spinal somatotopy and reflex encoders
Many of the recorded lamina V reflex encoders exhibited receptive fields with a high degree of similarity with SCPTI dorsal to the neurons. Hence, the somatotopic map in laminas III–IV, and possibly also the topographically congruent lamina II map, may have a specific relation to interneurons in the deep dorsal horn. It should be noted that SCPTI in laminas III–IV did not always exhibit characteristics that would resemble any known reflex encoder receptive field. One may speculate that in such cases interneurons of the deep dorsal horn could belong to a different system with disparate receptive field characteristics. The dorsal horn would hence be organized in a column-like manner (cf. Réthelyi, 1981), where each column performs basic sensorimotor transformations. Compatible with such an organization are the recent results of Tresch and Bizzi (1999), which demonstrate consistent motor responses to spinal microstimulation at different depths in the dorsal horn.
The clarification of spatial relations between the spinal somatotopic map and sensorimotor integrating systems may help the understanding of the properties or origin of somatotopy. For example, the interossei muscle-like reflex encoders were found in the medial parts of lamina V in both the present and a previous study (Schouenborg et al., 1995). In the medial parts of laminas III–IV, SCPTI with central pad-centered foci were found, thus resembling the receptive fields of mm. interossei-like reflex encoders. Hence, the topography of cutaneous input to the spinal cord including the somatotopic disruptions may be understood more readily in view of the topography of sensorimotor integrating spinal reflex systems rather than the somatosensory discriminative demands of CNS (cf. Koerber et al., 1993).
Developmental aspects
The embryonic development of the spinal cord is characterized by a ventral to dorsal temporal sequence. Appearance of motoneurons precedes that of interneurons, which in turn precedes primary afferent ingrowth (Altman and Bayer, 1984). A previous study has indicated a specific spatial relation between lamina V reflex encoders and the topography of motoneuron pools (Schouenborg et al., 1995). The present findings suggest a relation also to the somatotopic map in more superficial laminas. Furthermore, studies in the embryonic chick suggest that motoneurons can influence the peripheral outgrowth of sensory afferents (Scott, 1986; Honig et al., 1998). Taken together, these findings may suggest an instrumental role of motoneurons in the functional assembly of the dorsal horn.
Although the gross termination pattern is likely to be chemically guided perhaps in part by adhesion molecules (Xue and Honig, 1999), details of the spinal somatotopic map are likely to be dependent on an experience-dependent tuning. During postnatal development, receptive fields of withdrawal reflexes undergo profound tuning whereby erroneous connections are eliminated or depressed and adequate connections are strengthened (Holmberg and Schouenborg, 1996a). Through this tuning, the system can adapt to an altered movement pattern caused by neonatal tendon transfer (Holmberg et al., 1997) as well as to altered innervation of the skin (Holmberg and Schouenborg, 1996b). Here we show that SCPTI in laminas III–IV in the adult rat often exhibit striking similarities with the receptive fields of lamina V reflex encoder neurons. Hence, it is conceivable that the tuning of the tactile input to the withdrawal reflex system occurs already in the first order synapses and that the tuning of this and possibly other motor systems is accompanied by corresponding changes in somatotopic organization of the dorsal horn.
Significance of somatotopic maps
Somatotopic maps have been described in various CNS sites, although their functional significance is unclear (Kaas, 1997;Weinberg, 1997). Often, they have been described in terms of the classical “homunculus” (Penfield and Rasmussen, 1950; Sutherling et al., 1992) or a “point to point” projection (Silos Santiago et al., 1995). By contrast, somatotopic maps have sometimes been suggested to be a discontinuous mosaic representation of the body (Favorov et al., 1987). In line with the latter view, it has been shown recently that the microzonal organization of climbing fiber input to the cortex of the forelimb area of the cerebellar C3 zone in the cat is a reflection of the modular organization of the spinal withdrawal reflex system (Garwicz et al., 2002). A cerebellar microzone in the C3 zone receives a cutaneous climbing fiber input with spatial characteristics corresponding to single spinal withdrawal reflex modules. Hence, the organization of sensory input to some supraspinal systems, as well as to the spinal cord as suggested in this study, may have a specific relation to the action of single muscles. We therefore suggest that topographic sensory maps reflect not merely a representation of the body surface but actually a major step in sensorimotor transformation.
Footnotes
This work was supported by the Swedish Medical Research Council Projects 1013, 10569, and 14276, the Medical Faculty of Lund University, Astra Hässle Inc., Knut and Alice Wallenberg's Foundation, Elsa and Thorsten Segerfalk's Foundation, Greta and Johan Kock's Foundation, Magnus Bergvall's Foundation, Åke Wiberg's Foundation, the Crafoord Foundation, and The Royal Physiographic Society in Lund.
Correspondence should be addressed to Anders Levinsson, Section for Neurophysiology, Department of Physiological Sciences, Lund University, BMC F10, S-221 84 Lund, Sweden. E-mail:Anders.Levinsson@mphy.lu.se.
M. Zhang's present address: Department of Neuroscience and Anatomy, The Milton S. Hershey Medical Center, Pennsylvania State College of Medicine, 500 University Drive, Hershey, PA 17033-2390.
REFERENCES
- 1.Altman J, Bayer SA. Advances in anatomy, embryology and cell biology, Vol 85. Springer; Berlin: 1984. The development of the rat spinal cord. pp. 1–166. [DOI] [PubMed] [Google Scholar]
- 2.Broman J, Anderson S, Ottersen OP. Enrichment of glutamate-like immunoreactivity in primary afferent terminals throughout the spinal cord dorsal horn. Eur J Neurosci. 1993;5:1050–1061. doi: 10.1111/j.1460-9568.1993.tb00958.x. [DOI] [PubMed] [Google Scholar]
- 3.Brown PB, Fuchs JL. Somatotopic representation of hindlimb skin in cat dorsal horn. J Neurophysiol. 1975;38:1–9. doi: 10.1152/jn.1975.38.1.1. [DOI] [PubMed] [Google Scholar]
- 4.Brown PB, Gladfelter WE, Culberson JC, Covalt Dunning D, Sonty RV, Pubols LM, Millecchia RJ. Somatotopic organization of single primary afferent axon projections to cat spinal cord dorsal horn. J Neurosci. 1991;11:298–309. doi: 10.1523/JNEUROSCI.11-01-00298.1991. [DOI] [PMC free article] [PubMed] [Google Scholar]
- 5.Brown PB, Koerber HR, Millecchia R. Assembly of the dorsal horn somatotopic map. Somatosens Mot Res. 1997;14:93–106. doi: 10.1080/08990229771097. [DOI] [PubMed] [Google Scholar]
- 6.Bullitt E. Somatotopy of spinal nociceptive processing. J Comp Neurol. 1991;312:279–290. doi: 10.1002/cne.903120210. [DOI] [PubMed] [Google Scholar]
- 7.Cervero F, Iggo A. The substantia gelatinosa of the spinal cord: a critical review. Brain. 1980;103:717–772. doi: 10.1093/brain/103.4.717. [DOI] [PubMed] [Google Scholar]
- 8.Clarke RW, Matthews B. The thresholds of the jaw-opening reflex and trigeminal brainstem neurons to tooth-pulp stimulation in acutely and chronically prepared cats. Neuroscience. 1990;36:105–114. doi: 10.1016/0306-4522(90)90354-7. [DOI] [PubMed] [Google Scholar]
- 9.Ekerot C-F, Garwicz M, Schouenborg J. Topography and nociceptive receptive fields of climbing fibres projecting to the cerebellar anterior lobe in the cat. J Physiol (Lond) 1991;441:257–274. doi: 10.1113/jphysiol.1991.sp018750. [DOI] [PMC free article] [PubMed] [Google Scholar]
- 10.Favorov OV, Diamond ME, Whitsel BL. Evidence for a mosaic representation of the body surface in area 3b of the somatic cortex of cat. Proc Natl Acad Sci USA. 1987;84:6606–6610. doi: 10.1073/pnas.84.18.6606. [DOI] [PMC free article] [PubMed] [Google Scholar]
- 11.Florence SL, Wall JT, Kaas JH. The somatotopic pattern of afferent projections from the digits to the spinal cord and cuneate nucleus in macaque monkeys. Brain Res. 1988;452:388–392. doi: 10.1016/0006-8993(88)90045-5. [DOI] [PubMed] [Google Scholar]
- 12.Florence SL, Wall JT, Kaas JH. Somatotopic organization of inputs from the hand to the spinal gray and cuneate nucleus of monkeys with observations on the cuneate nucleus of humans. J Comp Neurol. 1989;286:48–70. doi: 10.1002/cne.902860104. [DOI] [PubMed] [Google Scholar]
- 13.Florence SL, Wall JT, Kaas JH. Central projections from the skin of the hand in squirrel monkeys. J Comp Neurol. 1991;311:563–578. doi: 10.1002/cne.903110410. [DOI] [PubMed] [Google Scholar]
- 14.Garwicz M, Levinsson A, Schouenborg J. Common principles of sensory encoding in spinal reflex modules and cerebellar climbing fibres. J Physiol (Lond) 2002;540:1061–1069. doi: 10.1113/jphysiol.2001.013507. [DOI] [PMC free article] [PubMed] [Google Scholar]
- 15.Holmberg H, Schouenborg J. Postnatal development of the nociceptive withdrawal reflexes in the rat: a behavioural and electromyographic study. J Physiol (Lond) 1996a;493:239–252. doi: 10.1113/jphysiol.1996.sp021379. [DOI] [PMC free article] [PubMed] [Google Scholar]
- 16.Holmberg H, Schouenborg J. Developmental adaptation of withdrawal reflexes to early alteration of peripheral innervation in the rat. J Physiol (Lond) 1996b;495:399–409. doi: 10.1113/jphysiol.1996.sp021602. [DOI] [PMC free article] [PubMed] [Google Scholar]
- 17.Holmberg H, Schouenborg J, Yu YB, Weng H-R. Developmental adaptation of rat nociceptive withdrawal reflexes after neonatal tendon transfer. J Neurosci. 1997;17:2071–2078. doi: 10.1523/JNEUROSCI.17-06-02071.1997. [DOI] [PMC free article] [PubMed] [Google Scholar]
- 18.Honig MG, Frase PA, Camilli SJ. The spatial relationships among cutaneous, muscle sensory and motoneuron axons during development of the chick hindlimb. Development. 1998;125:995–1004. doi: 10.1242/dev.125.6.995. [DOI] [PubMed] [Google Scholar]
- 19.Kaas JH. Topographic maps are fundamental to sensory processing. Brain Res Bull. 1997;44:107–112. doi: 10.1016/s0361-9230(97)00094-4. [DOI] [PubMed] [Google Scholar]
- 20.King VM, Apps R. Somatotopical organization of Fos-like immunoreactivity in rat cervical spinal cord following noxious stimulation of the forelimb. Neuroscience. 2000;101:179–188. doi: 10.1016/s0306-4522(00)00333-x. [DOI] [PubMed] [Google Scholar]
- 21.Koerber HR, Brown PB. Somatotopic organization of hindlimb cutaneous nerve projections to cat dorsal horn. J Neurophysiol. 1982;48:481–489. doi: 10.1152/jn.1982.48.2.481. [DOI] [PubMed] [Google Scholar]
- 22.Koerber HR, Mirnics K. Morphology of functional long-ranging primary afferent projections in the cat spinal cord. J Neurophysiol. 1995;74:2336–2348. doi: 10.1152/jn.1995.74.6.2336. [DOI] [PubMed] [Google Scholar]
- 23.Koerber HR, Brown PB, Mendell LM. Correlation of monosynaptic field potentials evoked by single action potentials in single primary afferent axons and their bouton distributions in the dorsal horn. J Comp Neurol. 1990;294:133–144. doi: 10.1002/cne.902940110. [DOI] [PubMed] [Google Scholar]
- 24.Koerber HR, Hobbs G, Brown PB. Precision and variability of hindlimb representation in cat dorsal horn and implications for tactile localization. J Neurophysiol. 1993;70:2489–2501. doi: 10.1152/jn.1993.70.6.2489. [DOI] [PubMed] [Google Scholar]
- 25.LaMotte CC, Kapadia SE, Shapiro CM. Central projections of the sciatic, saphenous, median, and ulnar nerves of the rat demonstrated by transganglionic transport of choleragenoid-HRP (B-HRP) and wheat germ agglutinin-HRP (WGA-HRP). J Comp Neurol. 1991;311:546–562. doi: 10.1002/cne.903110409. [DOI] [PubMed] [Google Scholar]
- 26.Levinsson A, Garwicz M, Schouenborg J. Sensorimotor transformation in cat nociceptive withdrawal reflex system. Eur J Neurosci. 1999;11:4327–4332. doi: 10.1046/j.1460-9568.1999.00861.x. [DOI] [PubMed] [Google Scholar]
- 27.Levinsson A, Holmberg H, Zhang M, Broman J, Schouenborg J. New principles for the topographical organization of sensory input to the spinal cord. Soc Neurosci Abstr. 2000;26:148. [Google Scholar]
- 28.Light AR, Durkovic RG. Features of laminar and somatotopic organization of lumbar spinal cord units receiving cutaneous inputs from hindlimb receptive fields. J Neurophysiol. 1984;52:449–458. doi: 10.1152/jn.1984.52.3.449. [DOI] [PubMed] [Google Scholar]
- 29.Light AR, Perl ER. Spinal termination of functionally identified primary afferent neurons with slowly conducting myelinated fibers. J Comp Neurol. 1979;186:133–150. doi: 10.1002/cne.901860203. [DOI] [PubMed] [Google Scholar]
- 30.Liu X, Sandkühler J. Characterization of long-term potentiation of C-fiber-evoked potentials in spinal dorsal horn of adult rat: essential role of NK1 and NK2 receptors. J Neurophysiol. 1997;78:1973–1982. doi: 10.1152/jn.1997.78.4.1973. [DOI] [PubMed] [Google Scholar]
- 31.Maslany S, Crockett DP, Egger MD. Somatotopic organization of the dorsal column nuclei in the rat: transganglionic labeling with B-HRP and WGA-HRP. Brain Res. 1991;564:56–65. doi: 10.1016/0006-8993(91)91351-z. [DOI] [PubMed] [Google Scholar]
- 32.Maslany S, Crockett DP, Egger MD. Organization of cutaneous primary afferent fibers projecting to the dorsal horn in the rat: WGA-HRP versus B-HRP. Brain Res. 1992;569:123–135. doi: 10.1016/0006-8993(92)90378-m. [DOI] [PubMed] [Google Scholar]
- 33.Meyers DE, Snow PJ. Somatotopically inappropriate projections of single hair follicle afferent fibres to the cat spinal cord. J Physiol (Lond) 1984;347:59–73. doi: 10.1113/jphysiol.1984.sp015053. [DOI] [PMC free article] [PubMed] [Google Scholar]
- 34.Mitzdorf U. Current source-density method and application in cat cerebral cortex: investigation of evoked potentials and EEG phenomena. Physiol Rev. 1985;65:37–100. doi: 10.1152/physrev.1985.65.1.37. [DOI] [PubMed] [Google Scholar]
- 35.Molander C, Grant G. Cutaneous projections from the rat hindlimb foot to the substantia gelatinosa of the spinal cord studied by transganglionic transport of WGA-HRP conjugate. J Comp Neurol. 1985;237:476–484. doi: 10.1002/cne.902370405. [DOI] [PubMed] [Google Scholar]
- 36.Nilsson H-J, Schouenborg J. Differential inhibitory effect on human nociceptive skin senses induced by local stimulation of thin cutaneous fibres. Pain. 1999;80:103–112. doi: 10.1016/s0304-3959(98)00205-x. [DOI] [PubMed] [Google Scholar]
- 37.Nyberg G, Blomqvist A. The somatotopic organization of forelimb cutaneous nerves in the brachial dorsal horn: an anatomical study in the cat. J Comp Neurol. 1985;242:28–39. doi: 10.1002/cne.902420103. [DOI] [PubMed] [Google Scholar]
- 38.Penfield W, Rasmussen T. The cerebral cortex of man: a clinical study of localization of function. Macmillan; New York: 1950. [Google Scholar]
- 39.Pubols BHJ, Hirata H, West-Johnsrud L. Somatotopic organization of forelimb representation in cervical enlargement of raccoon dorsal horn. J Neurophysiol. 1989;61:126–137. doi: 10.1152/jn.1989.61.1.126. [DOI] [PubMed] [Google Scholar]
- 40.Réthelyi M. Geometry of the dorsal horn. In: Brown AG, Réthelyi M, editors. Spinal cord sensation. Scottish Academic Press; Edinburgh: 1981. pp. 1–11. [Google Scholar]
- 41.Robertson B, Grant G. A comparison between wheat germ agglutinin- and choleragenoid-horseradish peroxidase as anterogradely transported markers in central branches of primary sensory neurones in the rat with some observations in the cat. Neuroscience. 1985;14:895–905. doi: 10.1016/0306-4522(85)90152-6. [DOI] [PubMed] [Google Scholar]
- 42.Schouenborg J. Functional and topographical properties of field potentials evoked in rat dorsal horn by cutaneous C-fibre stimulation. J Physiol (Lond) 1984;356:169–192. doi: 10.1113/jphysiol.1984.sp015459. [DOI] [PMC free article] [PubMed] [Google Scholar]
- 43.Schouenborg J, Kalliomäki J. Functional organization of the nociceptive withdrawal reflexes. I. Activation of hindlimb muscles in the rat. Exp Brain Res. 1990;83:67–78. doi: 10.1007/BF00232194. [DOI] [PubMed] [Google Scholar]
- 44.Schouenborg J, Weng H-R. Sensorimotor transformation in a spinal motor system. Exp Brain Res. 1994;100:170–174. doi: 10.1007/BF00227291. [DOI] [PubMed] [Google Scholar]
- 45.Schouenborg J, Holmberg H, Weng HR. Functional organization of the nociceptive withdrawal reflexes. II. Changes of excitability and receptive fields after spinalization in the rat. Exp Brain Res. 1992;90:469–478. doi: 10.1007/BF00230929. [DOI] [PubMed] [Google Scholar]
- 46.Schouenborg J, Weng H-R, Kalliomäki J, Holmberg H. A survey of spinal dorsal horn neurones encoding the spatial organization of withdrawal reflexes in the rat. Exp Brain Res. 1995;106:19–27. doi: 10.1007/BF00241353. [DOI] [PubMed] [Google Scholar]
- 47.Scott SA. Skin sensory innervation patterns in embryonic chick hindlimb following dorsal root ganglion reversals. J Neurobiol. 1986;17:649–668. doi: 10.1002/neu.480170609. [DOI] [PubMed] [Google Scholar]
- 48.Shortland P, Wall PD. Long-range afferents in the rat spinal cord. II. Arborizations that penetrate grey matter. Philos Trans R Soc Lond B Biol Sci. 1992;337:445–455. doi: 10.1098/rstb.1992.0120. [DOI] [PubMed] [Google Scholar]
- 49.Shortland P, Woolf CJ. Morphology and somatotopy of the central arborizations of rapidly adapting glabrous skin afferents in the rat lumbar spinal cord. J Comp Neurol. 1993;329:491–511. doi: 10.1002/cne.903290406. [DOI] [PubMed] [Google Scholar]
- 50.Silos Santiago I, Jeng B, Snider WD. Sensory afferents show appropriate somatotopy at the earliest stage of projection to dorsal horn. NeuroReport. 1995;6:861–865. doi: 10.1097/00001756-199504190-00009. [DOI] [PubMed] [Google Scholar]
- 51.Sugiura Y, Lee CL, Perl ER. Central projections of identified, unmyelinated (C) afferent fibers innervating mammalian skin. Science. 1986;234:358–361. doi: 10.1126/science.3764416. [DOI] [PubMed] [Google Scholar]
- 52.Sutherling WW, Levesque MF, Baumgartner C. Cortical sensory representation of the human hand: size of finger regions and nonoverlapping digit somatotopy. Neurology. 1992;42:1020–1028. doi: 10.1212/wnl.42.5.1020. [DOI] [PubMed] [Google Scholar]
- 53.Swett JE, Woolf CJ. The somatotopic organization of primary afferent terminals in the superficial laminae of the dorsal horn of the rat spinal cord. J Comp Neurol. 1985;231:66–77. doi: 10.1002/cne.902310106. [DOI] [PubMed] [Google Scholar]
- 54.Tresch MC, Bizzi E. Responses to spinal microstimulation in the chronically spinalized rat and their relationship to spinal systems activated by low threshold cutaneous stimulation. Exp Brain Res. 1999;129:401–416. doi: 10.1007/s002210050908. [DOI] [PubMed] [Google Scholar]
- 55.Van Essen DC. A tension-based theory of morphogenesis and compact wiring in the central nervous system. Nature. 1997;385:313–318. doi: 10.1038/385313a0. [DOI] [PubMed] [Google Scholar]
- 56.Wall PD, Werman R. The physiology and anatomy of long ranging afferent fibres within the spinal cord. J Physiol (Lond) 1976;255:321–334. doi: 10.1113/jphysiol.1976.sp011282. [DOI] [PMC free article] [PubMed] [Google Scholar]
- 57.Weinberg RJ. Are topographic maps fundamental to sensory processing? Brain Res Bull. 1997;44:113–116. doi: 10.1016/s0361-9230(97)00095-6. [DOI] [PubMed] [Google Scholar]
- 58.Willis WD, Coggeshall RE. Sensory mechanisms of the spinal cord. Plenum; New York: 1991. [Google Scholar]
- 59.Willis WD, Weir MA, Skinner RD, Bryan RN. Differential distribution of spinal cord field potentials. Exp Brain Res. 1973;17:169–176. doi: 10.1007/BF00235026. [DOI] [PubMed] [Google Scholar]
- 60.Wilson P, Meyers DE, Snow PJ. The detailed somatotopic organization of the dorsal horn in the lumbosacral enlargement of the cat spinal cord. J Neurophysiol. 1986;55:604–617. doi: 10.1152/jn.1986.55.3.604. [DOI] [PubMed] [Google Scholar]
- 61.Wilson P, Kitchener PD, Snow PJ. Intraaxonal injection of neurobiotin reveals the long-ranging projections of A beta-hair follicle afferent fibers to the cat dorsal horn. J Neurophysiol. 1996;76:242–254. doi: 10.1152/jn.1996.76.1.242. [DOI] [PubMed] [Google Scholar]
- 62.Woolf CJ, Fitzgerald M. Somatotopic organization of cutaneous afferent terminals and dorsal horn neuronal receptive fields in the superficial and deep laminae of the rat lumbar spinal cord. J Comp Neurol. 1986;251:517–531. doi: 10.1002/cne.902510407. [DOI] [PubMed] [Google Scholar]
- 63.Xue Y, Honig MG. Ultrastructural observations on the expression of axonin-1: implications for the fasciculation of sensory axons during axonal outgrowth into the chick hindlimb. J Comp Neurol. 1999;408:299–317. doi: 10.1002/(sici)1096-9861(19990607)408:3<299::aid-cne1>3.0.co;2-n. [DOI] [PubMed] [Google Scholar]