

Abstract
Smoothness is characteristic of coordinated human movements, and stroke patients' movements seem to grow more smooth with recovery. We used a robotic therapy device to analyze five different measures of movement smoothness in the hemiparetic arm of 31 patients recovering from stroke. Four of the five metrics showed general increases in smoothness for the entire patient population. However, according to the fifth metric, the movements of patients with recent stroke grew less smooth over the course of therapy. This pattern was reproduced in a computer simulation of recovery based on submovement blending, suggesting that progressive blending of submovements underlies stroke recovery.
Keywords: stroke recovery, submovements, smoothness, segmentation, robotic therapy, minimum-jerk, blending
Recent epidemiological data that have suggested increasing prevalence of stroke have prompted vigorous novel treatment trials and the use of unique brain-imaging tools to begin to understand the pathophysiology of stroke (Chollet et al., 1991; Dam et al., 1993). Most survivors of stroke will have impaired brain function and permanent levels of disability. As survival from stroke improves with modern medical care, the increasing number of these patients has also prompted the drive to understand the functional motor recovery process. Recently, investigators armed with new tools (Krebs et al., 1998a, 1999; Lum et al., 1999; Kahn et al., 2001) have begun the detailed kinematic analysis of motor recovery. Based on observations of changes in movement smoothness in recovering stroke patients (Krebs et al., 1998b), we measured the development of movement smoothness as patients with stroke recovered motor function in formerly paralyzed arms.
Movement smoothness has been used as a measure of motor performance of both healthy subjects (Platz et al., 1994) and persons with stroke (Trombly, 1993; Kahn et al., 2001). Smoothness measures have most often been based on minimizing jerk, the third time derivative of position (Flash and Hogan, 1985), although many other measures are possible, including snap, the fourth time derivative of position (Edelman and Flash, 1987), and counting peaks in speed (Brooks et al., 1973; Fetters and Todd, 1987; Cirstea and Levin, 2000; Kahn et al., 2001). Smoothness in the minimum-jerk sense has been used to identify presymptomatic individuals with Huntington's disease (Smith et al., 2000) and has also been shown to account for the two-thirds power law, widely considered an invariant in human movement (Wann et al., 1988; Gribble and Ostry, 1996; Todorov and Jordan, 1998; Schaal and Sternad, 2001).
Although smoothness is a characteristic of unimpaired movements, perhaps the most striking feature of the earliest movements made by patients recovering from stroke is their lack of smoothness; they appear to be composed of a series of discrete submovements (Krebs et al., 1999). Evidence of discrete submovements has also been found in the movements of healthy subjects (Milner, 1992; Vallbo and Wessberg, 1993). Complex movements have been decomposed into submovements as an analysis tool (Morasso and Mussa-Ivaldi, 1982; Flash and Henis, 1991;Berthier, 1996; Burdet and Milner, 1998) with apparent success. Although the existence of submovements has not been demonstrated unequivocally, they account for many patterns in human movement (Doeringer and Hogan, 1998; Hogan et al., 1999).
Krebs et al. (1998b) report that movements made by patients recovering from stroke become smoother as recovery proceeds. This was attributed to a progressive overlapping and blending of submovements, although only isolated examples of submovement blending were reported. In this study, we present additional evidence that recovery proceeds by progressive blending of submovements. We quantify the smoothness of movements made by stroke patients with their affected limb and how it changed over the course of recovery. We present an analysis of how progressive blending of submovements would affect measures of smoothness and show that it is consistent with our experimental observations.
MATERIALS AND METHODS
Subjects. Thirty-one subjects (10 women and 21 men) participated in this study performed at the Spaulding Rehabilitation Hospital (Boston, MA). Twelve subjects were acute-stage inpatients who had suffered their first unilateral infarct <1 month before beginning the study, and 19 were chronic-stage outpatients from 12 to 53 months after stroke. Subjects were between 19 and 78 years of age (mean age of 55.6 years for inpatients and 56.2 years for outpatients), hemiparetic, and able to understand and carry out verbal instructions. See Table1 for a summary of clinical evaluation scores and times after stroke for inpatient and outpatient groups. Only subjects who participated in more than five therapy sessions and had completed >100 point-to-point movements were included in this analysis. The protocol was approved by the Human Studies Committee at Spaulding Rehabilitation Hospital and by the Committee on the Use of Human Experimental Subjects of the Massachusetts Institute of Technology. All subjects gave informed consent.
Table 1.
Clinical evaluation results for all subjects
| Subject | Age | Initial Fugl-Meyer | Final Fugl-Meyer | Months after stroke |
|---|---|---|---|---|
| Inpatients (n = 12) | ||||
| 102 | 55 | 6 | 37 | 1 |
| 104 | 41 | 3 | 24 | 1 |
| 105 | 53 | 5 | 20 | 1 |
| 107 | 64 | 5 | 14 | 1 |
| 201 | 62 | 23 | 33 | 1 |
| 203 | 72 | 11 | 17 | 1 |
| 204 | 78 | 11 | 22 | 1 |
| 205 | 67 | 10 | 16 | 1 |
| 206 | 40 | 10 | 23 | 1 |
| 207 | 46 | 12 | 43 | 1 |
| 302 | 33 | 35 | 56 | 1 |
| 303 | 56 | 25 | 48 | 1 |
| Outpatients (n = 19) | ||||
| 701 | 40 | 42 | 47 | 43 |
| 702 | 59 | 18 | 22 | 46 |
| 704 | 19 | 31 | 40 | 37 |
| 705 | 53 | 50 | 54 | 32 |
| 706 | 27 | 45 | 57 | 30 |
| 707 | 66 | 25 | 24 | 27 |
| 708 | 73 | 15 | 20 | 28 |
| 709 | 64 | 24 | 30 | 19 |
| 710 | 56 | 20 | 25 | 47 |
| 711 | 75 | 22 | 25 | 53 |
| 712 | 46 | 34 | 35 | 20 |
| 713 | 77 | 27 | 23 | 12 |
| 714 | 77 | 15 | 15 | 19 |
| 715 | 47 | 26 | 19 | 46 |
| 716 | 72 | 17 | 20 | 19 |
| 717 | 76 | 23 | 30 | 50 |
| 718 | 43 | 25 | 28 | 19 |
| 719 | 41 | 19 | 25* | 12 |
| 720 | 58 | 48 | 53* | 20 |
Fugl-Meyer scores are for the upper-extremity portion of the evaluations only; a score of 66 represents no impairment. Scores marked with
are interim evaluations.
Apparatus. MIT-MANUS, a planar robot, was designed as a therapy aid in the Newman Laboratory at the Massachusetts Institute of Technology (Hogan et al., 1995; Krebs et al., 1998b, 1999). A key characteristic of MIT-MANUS is its “backdrivability” (i.e., its ability to “get out of the way” when pushed by a subject). Thus, subjects' movements were minimally obscured by the dynamics of the robot. During all movements analyzed and presented in this paper, the robot was unpowered and acted as a passive measurement device that restricted patients' hand motion to a horizontal plane.
Procedure. Over the course of a therapy session, subjects were directed to make a number of point-to-point movements, ending as near to the directed point as possible. With a computer display of a center target, eight targets equally spaced around a circle, and the current position of the robot endpoint, subjects moved from the center to each target and back, starting at “North” and proceeding clockwise (Fig. 1). Each target was 14 cm from the center. Inpatient subjects typically received robot therapy five times per week for 4 weeks and outpatients three times per week for 6 weeks. Each session lasted ∼1 hr. A computer recorded the position, velocity, and force exerted at the robot handle. In addition, each subject was clinically assessed by a “blinded” clinician at the beginning, middle, and end of therapy using a collection of several clinical scales. In this study, only the results of the Fugl-Meyer Test of Upper Extremity Function (Fugl-Meyer et al., 1975) are reported.
Fig. 1.
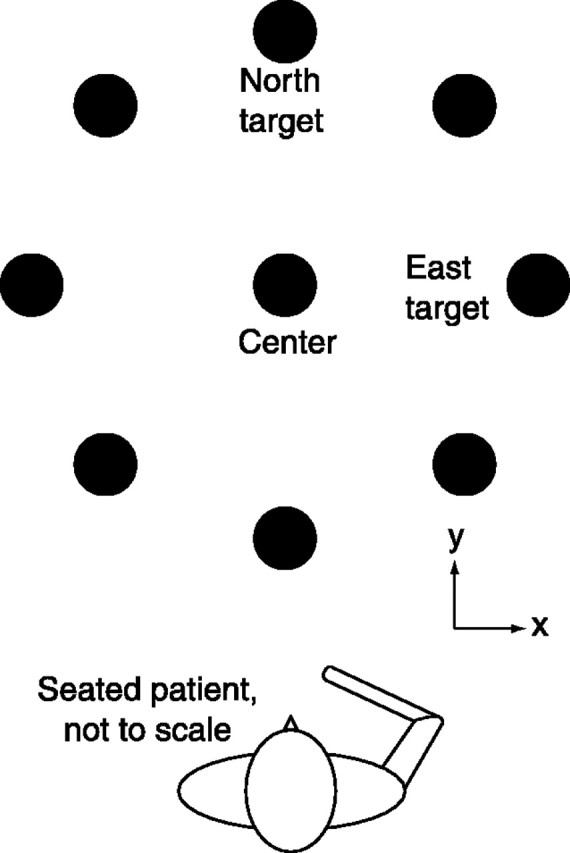
Top view, Reaching task. The task required each subject to attempt to move from the center position to a target and then return to the center, beginning at the North target, and repeating for each target in a clockwise pattern around the circle. Subjects were presented with a visual display of the task similar to that in the figure, which also included a display of the subject's hand position. The robot remained unpowered for the duration of all of the trials incorporated into this analysis. Each target is 14 cm from the center.
Analysis. In addition to calculating the mean speed, peak speed, and duration, five measures of smoothness were applied to the kinematic data collected during point-to-point movements. All smoothness metrics have been defined such that higher values of the metric correspond to smoother movements. A movement was considered to begin when the speed first became greater than 2% of the peak speed and was considered to end after the speed dropped and remained below the 2% threshold again.
Jerk metric. The jerk metric characterizes the average rate of change of acceleration in a movement. It is calculated by dividing the negative mean jerk magnitude by the peak speed. Taking the negative of the mean jerk causes increases in the jerk metric to correspond with increases in smoothness; that is, it transforms the jerk metric from a measure of “nonsmoothness” into a measure of smoothness. Dividing the jerk magnitude by peak speed is identical to first normalizingx and y velocities by the peak speed and then calculating jerk. Normalizing mean jerk in this way made the metric a measure of smoothness only and did not confound it with changes in overall movement speed. Although the other four measures have no units associated with them, the jerk metric has units of 1/s2. The other four metrics each quantify some shape characteristic of the speed curve thought to be related to smoothness, and hence can remain dimensionless. The jerk metric, however, is based directly on a mathematical definition of smoothness and by definition must carry units.
Speed metric. The speed metric is the normalized mean speed (i.e., the mean of the speed divided by the peak speed). Early in recovery, subjects' movements appear to be composed of a series of short, episodic submovements. The resulting speed profile has a series of peaks with deep valleys in between, representing complete or near-complete stops between each apparent submovement (Fig.2). The mean speed of such a movement is much less than its peak. In this case, the normalized mean speed is relatively low, particularly when the interval between submovements is significant. However, as subjects recover, submovements tend to have shorter and less complete breaks between them, resulting in speed profiles with shallower valleys between peaks. The normalized mean speed for these movements is significantly higher.
Fig. 2.

Simulated versus actual speed profiles.a–d, Progressive blending of two minimum-jerk curves at various states of blending (T). See Materials and Methods for a detailed description of the simulation.e–h, Actual patient speed profiles. eand f are taken from the first and last therapy sessions of an inpatient; g and h are taken from the first and last therapy sessions of an outpatient. Simulated speed profiles qualitatively resemble the actual patient data.a contains two distinct speed peaks, just as the patient speed profile e. Continuing down thecolumns, b and f are qualitatively similar, c somewhat resemblesg, and d is similar to h. Progression from the first to the last therapy sessions qualitatively suggests an increase in submovement blending. In addition, the movements of the subject that is longer poststroke (Outpatient) have characteristics of more highly blended submovements compared with those of the inpatient.
Mean arrest period ratio. Early in recovery, it is common for subjects to move in an episodic manner, stopping multiple times before reaching their objective. A speed profile resulting from this type of movement will have many intervals of zero velocity. However, as subjects reach their goal more directly, without unnecessary stops, the speed profiles will tend to spend less time near zero speed. “Movement Arrest Period Ratio” (MAPR), as described by Beppu et al. (1984), quantifies this change; it is the proportion of time that movement speed exceeds a given percentage of peak speed. By nature, the MAPR with a low threshold is less likely to be informative when studying movements that are close to normal. However, outpatients' movements in this study, although better than those of inpatients, are still far from normal. They move at approximately one-half the speed of healthy subjects and show significantly nonstraight paths. The MAPR threshold selected in this analysis was 10%.
Peaks metric. The number of peaks in a speed profile has been used to quantify smoothness in healthy subjects (Brooks et al., 1973; Fetters and Todd, 1987) and in stroke patients (Kahn et al., 2001). Fewer peaks in speed represent fewer periods of acceleration and deceleration, making a smoother movement. In this study, the peaks metric is taken to be the negative of the number of peaks to relate increases in the peaks metric to increases in smoothness.
“Tent” metric. The tent metric is the ratio of the area under the speed curve to the area under a curve “stretched” over the top of it. It is based on a graphical analysis of the difference between a speed profile and a similarly scaled, single-peaked speed profile (i.e., a speed profile with a single acceleration and a single deceleration phase). An example of a tent curve is shown in Figure 3.
Fig. 3.

A constructed tent profile. A subject's speed profile is superimposed with the corresponding tent profile constructed during the calculation of the tent metric. It should be noted that, unlike the other metrics, the tent metric is sensitive to “permutations.” Consider two movements, each of which have four peaks, two large and one small. In one movement, the peaks are ordered (Large 1, Small 1, Small 2, and Large 2) with periods of no movement in between, and in the second movement, peaks are ordered (Small 1, Large 1, Large 2, and Small 2). The tent metric will show higher smoothness in the second movement.
Statistical tests. Using linear regression, a line was fit to each of the smoothness metrics over the course of therapy for each subject, and the confidence interval for the slope was determined. SeePress et al. (1992) for a detailed mathematical description. Student'st tests were also performed to compare changes in each of the smoothness metrics in acute and chronic populations.
Simulation. To test whether changes in the smoothness of movements made by recovering stroke patients were attributable to progressive blending of submovements, a simulation of submovement blending was performed. A simulated movement was composed of two minimum-jerk speed profiles of the same amplitude and width, initiated an interval T apart, as shown in Figure 2a–d. Blending was simulated by performing scalar summation of the overlapping portion of the speed profiles (Morasso and Mussa-Ivaldi, 1982) as opposed to vector summation (Flash and Henis, 1991). Note that in the case of straight line movement, the two summing modalities are equivalent.
As T is varied, the extent of overlap of the two submovement speed curves varies as well, although the net displacement of the simulated movement remains constant, consistent with the fixed-distance, point-to-point movements required by the experimental task. Sample speed profiles from subjects shown in Figure2e–h lend support to this description of movement. The sample movement taken from the inpatient's first day of therapy is clearly divided into two stages, with the subject coming to a complete stop in between them. The movement taken from the inpatient's last day of therapy shows a speed profile with shallower valleys between the peaks. As interpreted by the simulation, the submovements are more completely blended together than those of the earlier movement. In comparison, on the outpatient's final day of therapy, the speed profile is nearly unimodal. This effect occurs in the simulation as well when there is such a high degree of blending that individual peaks are no longer distinguishable.
In the simulation, the five smoothness metrics are calculated for many values of T. To remain consistent with the data-processing methods used on actual subject data, a movement was considered to begin when the speed first became greater than 2% of the peak speed and to end after the speed dropped and remained below the 2% threshold again.
RESULTS
Movement speed and duration
The differences between first-day and last-day values of the fits for mean speed, peak speed, and movement duration are plotted in Figure4. Filled circles represent statistical significance (p ≤ 0.05). Subjects' peak speeds changed significantly in many cases but with no clear trend in the direction of the change. Significant decreases in peak speed outnumber increases from 11 to 9. Subjects' mean speeds (total distance traveled over total movement duration) tended to increase for both inpatients and outpatients, with the changes being significantly larger in inpatients (p ≤ 0.001). Similarly, subjects' movement duration tended to decrease for both inpatients and outpatients, with the changes being significantly larger in inpatients. This similarity between mean speed and movement duration follows from the fact that the nominal distance for the movement task remained constant.
Fig. 4.
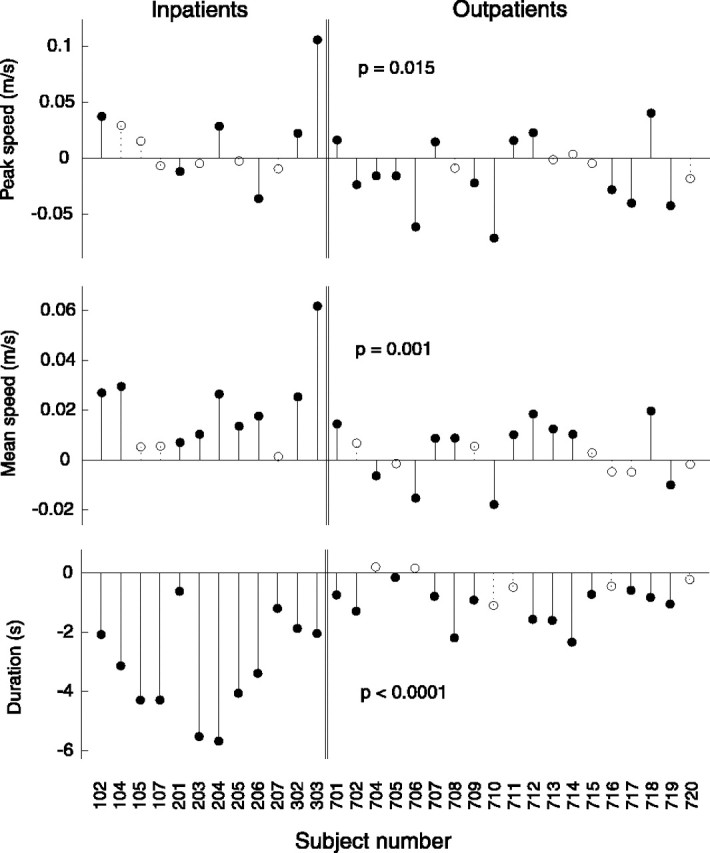
Changes in mean and peak speed and movement duration over the course of therapy for each subject. Filled circles denote changes that are statistically significant (p ≤ 0.05). Statistical significance (p value) of the difference between the changes in smoothness of inpatient (acute) and outpatient (chronic) populations is shown for each metric. Although mean speed and duration show general trends, peak speed does not and, in fact, shows more instances of a decrease than an increase. Open circles denote changes that did not reach statistical significance.
The trends observed in movement speed and duration are predicted by the simulation of submovement blending in two of the three cases. As the simulation progresses, movement duration decreases, which, as mentioned previously, also yields an increase in mean speed. This correctly predicts observed trends in mean speed and movement duration. However, the simulation also predicts an increase in peak speed with increases in blending at high levels of blending. This pattern is not generally seen in Figure 4, revealing a limitation of the simplified model of blending used. However, this property will not affect the results or interpretation of the smoothness metrics, because all metrics were chosen in such a way as to be insensitive to scaling of the speed profile.
The existence of strong trends in mean speed and duration indicates that they might potentially make useful measures of recovery; however, not every subject follows them. Six subjects showed no significant change in movement duration. With regard to mean speed, 10 subjects showed no significant change, and 4 actually showed significant decreases.
Movement smoothness
The differences between first-day and last-day values of the fits for each smoothness measure are plotted in Figure5. An increase in any metric indicates an increase in smoothness, as defined by that metric. Filled circles represent statistical significance (p ≤ 0.05).
Fig. 5.
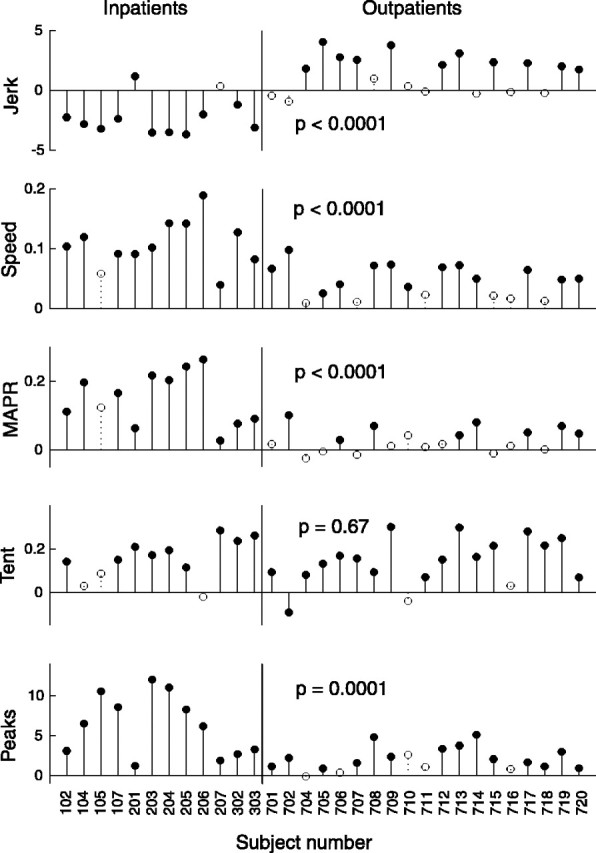
Changes in each smoothness metric over the course of therapy for each subject. Increases in smoothness are represented by positive changes in a smoothness metric in every case. Filled circles denote changes that are statistically significant (p ≤ 0.05). Statistical significance (p value) of the difference between the changes in smoothness of inpatient (acute) and outpatient (chronic) populations is shown for each metric. Note that, with one exception, every incidence of a significant decrease in smoothness occurred in the jerk metric with the inpatient group. Open circles denote changes that did not reach statistical significance.
All subjects but one showed a significant increase in one or more of the smoothness metrics, with 22 subjects showing an improvement in four or more metrics. The movements of both inpatients and outpatients tended to get smoother over the course of therapy. The amount of change in smoothness metrics varied between inpatient and outpatient populations. For all smoothness metrics except the tent metric, the amount of change between the two groups differed significantly (p ≤ 0.0001). In the speed metric, MAPR, and the peaks metric, inpatients showed greater increases in smoothness than outpatients. However, inpatients tended to show decreases in smoothness as measured by the jerk metric, whereas outpatients tended to show increases.
As shown in Table 1, inpatients and outpatients had a wide range of Fugl-Meyer scores both at the beginning and at the end of therapy. On average, however, inpatients began therapy lower on the Fugl-Meyer scale.
Although the patients' age range was quite large, there was no statistically significant difference in age between inpatients and outpatients as groups. Therefore, the observed differences in inpatient and outpatient performance in four of the five smoothness metrics cannot be attributed to variations in patients' ages. Correlation analysis shows that patients' age correlates weakly with their performance; the highest level of correlation is 0.33, which occurs with changes in the peaks metric (Table2).
Table 2.
Correlation between changes in each smoothness metric and changes in the Fugl-Meyer score, time after stroke, and subject's age (Pearson's r)
| Smoothness metric | Jerk | Speed | MAPR | Tent | Peaks |
|---|---|---|---|---|---|
| Correlation with subject's age | 0.11 | 0.08 | 0.18 | 0.10 | −0.33 |
| Correlation with change in Fugl-Meyer | −0.48 | 0.40 | 0.33 | 0.03 | −0.12 |
| Correlation with time after stroke | 0.54 | −0.58 | −0.61 | −0.27 | 0.58 |
To test how accurately changes in smoothness were predicted by changes in clinical scores, correlations were performed between changes in each of the five smoothness metrics changes in the Fugl-Meyer score and time after stroke (Table 2). The correlation is appreciable in several cases (as large as −0.48 for changes in the Fugl-Meyer score and −0.61 for time after stroke), indicating that changes in smoothness are related to these clinical scores but only indirectly reflected in them.
In the interest of a clear presentation, the clinical data included here have intentionally been limited to that which was directly relevant to the specific topic of the paper. Other aspects of the data will be discussed in future work.
Simulation results
Figure 6 displays all five smoothness metrics as a function of simulated submovement blending. Note that increasing blending corresponds to decreasing T(i.e., moving from right to left in the figure, rather than left to right). See Materials and Methods for a detailed description of the simulation.
Fig. 6.

Comparison of smoothness metrics during the simulated blending of two minimum-jerk curves. The values of the five smoothness metrics are shown for a range of values of T. Translation to the left along the x-axis represents an increase in submovement blending. Translation up they-axis represents an increase in smoothness. Speed profiles for selected values of T are shown along thehorizontal axis, depicting the state of the simulation at various degrees of blending.
As T decreases, the metrics generally tend to show an increase in smoothness. There are a few exceptions to this pattern. The speed metric, MAPR, the peaks metric, and the tent metric increase all saturate or peak at low T (high blending). Nevertheless, the general trend is that these four metrics increase as blending becomes more complete.
In contrast to the other four metrics, the jerk metric does not generally increase with blending. Although the jerk metric increases with increasing blending over the interval 0.12 sec <T < 0.26 sec, it decreases with increasing blending for T > 0.26 sec. For most of the range considered, the jerk metric shows that the simulated movements become less smooth as submovements blend. This behavior is not an artifact of the minimum-jerk curves used in the simulation; similar behavior was observed using support-bounded lognormal (Plamondon, 1995) and Gaussian curves.
It should be noted that the nonmonotonic behavior described here depends on the form of the jerk metric chosen. As defined in Materials and Methods, the jerk metric is calculated by taking the negative of the mean jerk magnitude for the movement and normalizing it by the peak speed. This is just one of several reasonable ways to define a jerk metric; for example, the mean jerk magnitude could be normalized by a variety of quantities (e.g., by mean speed, the cube of mean speed, the cube of peak speed, duration, and the square of duration) or not at all. Through serendipity, the particular jerk metric, selected based on previous use of jerk to describe movement smoothness, was found to exhibit a nonmonotonicity, a clearly identifiable feature that allowed for more meaningful comparison between the data and the simulation. Some variations of jerk metric produce the nonmonotonic behavior (no normalization, normalization by peak speed, the cube of peak speed, duration, and the square of duration), but at least one does not (normalization by the cube of mean speed), whereas normalizing by mean speed produces a flat region of no change in the jerk metric with blending.
Low jerk is not the only way to quantify smoothness; there are many other possible smoothness measures. For example, minimum snap (the fourth time derivative of position) described the kinematics of point-to-point drawing movements more accurately than minimum jerk (Plamondon et al., 1993). However, the measure of the rate of change of movement acceleration provides a compelling real-world description of smoothness and offers several advantages: analytical tractability, computational manageability, and theoretical simplicity.
As an aside, it is interesting to note that near T = 0.19 sec, the peaks metric drops briefly. This occurs because there is a small range of T for which the composite curve, a blend of two submovements, has three peaks. See Figure 2c for an illustration of this phenomenon. This counter-intuitive result, that the sum of two single-peaked curves produces a triple-peaked composite, emphasizes the difficulty of reliably identifying submovements underlying continuous motions. Although this phenomenon is dependent on the nature of the submovement shape (it does not occur when using Gaussian-shaped submovements, for instance), it is worthy of consideration. It raises questions about the validity of common methods for submovement identification that rely on counting speed peaks or on using speed peak locations to initialize local minimization algorithms. Reliable methods for identifying submovements are a topic of ongoing research and will be more thoroughly addressed in future work.
DISCUSSION
Movement smoothness increases during recovery
Subjects' increased movement smoothness raises the following question: is the tendency to make movements with smooth, symmetric, and bell-shaped speed profiles an epiphenomenon of musculoskeletal dynamics, or is it the result of learned motor behavior? To a limited extent, movement smoothness is a natural consequence of the low-pass filtering properties of the neural, muscular, and skeletal systems.Krylow and Rymer (1997) demonstrated this phenomenon, showing that a simple train of electrical pulses produced a movement with a smooth acceleration phase. However, it is notable that the complete movement had a highly asymmetric speed profile, quite unlike normal human movement, indicating that some form of neural coordination (e.g., appropriately timed recruitment of agonist and antagonist muscle groups) would be necessary to produce the approximately symmetric speed profiles typically observed.
Studies of development and recovery from neural injury strongly suggest that smoothness is a result of learned coordination. Infants' movements have been shown to become more smooth (in the sense of having fewer speed peaks) as motor control improves (von Hofsten, 1991). This indicates that movement smoothness is a result of a learned, coordinative process rather than a natural consequence of the structure of the neuromuscular system. Additionally, there is evidence that the segmented nature of stroke patients' arm movements can be attributed to a deficit in interjoint coordination (Levin, 1996). Taken with our observation that smoothness increases with recovery, the conclusion that smooth movement is a result of well developed coordination seems inescapable.
Evidence for discrete submovements
The “V”-shape of the jerk metric curve in Figure 6 predicts that subjects with poorer blending (on the right half of the V) will show decreases in jerk-based smoothness as they recover, whereas subjects with more complete blending (on the left half of the V) will show increases in jerk-based smoothness as they continue to recover. This is reflected clearly in the fact that exclusively inpatient subjects showed significant decreases in the jerk metric, whereas outpatients, who are presumably closer to their asymptote of recovery, showed only increases.
A second prediction of the curves in Figure 6 is that subjects with poorer blending will show marked increases in the other four smoothness metrics as they recover, whereas subjects with more complete blending will show only modest increases as the metrics saturate or peak. This is shown by the fact that increases in smoothness are significantly lower for outpatients than inpatients as measured by MAPR, the peaks metric, and the speed metric. The fact that submovement blending can explain the observed behaviors of the several smoothness metrics we considered lends support to the theory that movement is composed of discrete submovements.
Could the improvement in motion smoothness reflect peripheral factors, such as restoring the capability of the system to recruit a sufficiently large number of motor units? If impaired patients were only limited by the magnitude of their neural activation signals, and this quantity increased over the course of recovery, then this theory would predict an increase in peak speed of the movements as well. The data do not support this hypothesis, however. More subjects show peak speed decreases than show increases.
Jerk as a smoothness metric
The fact that many subjects showed an increase in the jerk metric during recovery highlights a distinction between jerk-based notions of smoothness and submovement blending. Care should be taken when assuming that less smooth movements (as measured with jerk) are more impaired or less skilled. The counterintuitive behavior of the jerk metric in the data and in simulation suggests that, at least during poststroke recovery, jerk minimization may not be the primary criterion governing refinements in movement patterns.
The fact that the jerk metric reports a higher degree of smoothness with very low blending than with a moderate amount of blending follows from the definition of the metric. High smoothness corresponds to low average jerk; when a simulated movement consists of two submovements separated by a large period of rest, average jerk will be relatively low, and smoothness therefore is high. And as the two submovements become more blended, they begin to approach each other, and the period of rest is shortened. This increases average jerk, decreasing smoothness.
Applications of submovements
Just as measurements of jerk have allowed identification of presymptomatic individuals with Huntington's disease when clinical measurements have not (Smith et al., 2000), the high resolution and specificity of other kinematic measures may allow observation of other previously unobservable phenomena. Such measures would serve to complement time-tested clinical scales, such as the Fugl-Meyer. Several research groups have used kinematic and force measures to quantify movement deficits in stroke patients (Wing et al., 1990; Ada et al., 1993; Trombly, 1993; Levin, 1996; Lum et al., 1999; Kahn et al., 2001). Our results extend their work by showing clear increases in smoothness in both acute and chronic populations, even in subjects who did not show an increase on the Fugl-Meyer scale. Measurement of smoothness may provide a meaningful, objective quantification of motor performance that could be used to augment clinical evaluations. Alternatively, to the extent that smoothness is a result of submovement blending, direct estimation of submovement blending characteristics may provide an even more intuitive and robust measure of recovery.
The existence of submovements might indicate a discrete internal representation of motor commands. Strong direct evidence for discrete movement primitives in frog wiping reflexes has been shown (Giszter and Kargo, 2000; Kargo and Giszter, 2000) in both force profiles and EMG measurements. Physiological evidence for discrete submovements has been reported in healthy human subjects as well; in slow finger movements,Vallbo and Wessberg (1993) showed both discrete kinematic jumps in finger position as well as synchronized pulses of EMG activity in the finger flexors and extensors. If it is shown to be feasible, locating and measuring this internal coding of motor commands could lead to insight into the nature of human motor behavior and motor system pathologies. A similar coding of movement may be used in neural–machine interfaces (Wiener, 1961). A control system based on discrete submovements requires much less information to be transferred (i.e., lower average communication bandwidth) between the controller and the system being controlled. Initial experiments into brain–computer interfaces are promising but have shown very limited bandwidth capabilities (Lauer et al., 2000). Using discrete feedforward control commands may make practical applications of neural interfaces realizable.
It should be noted that other, nondiscrete models may be capable of describing decreasingly segmented behavior. However, to be fully successful, a model of recovery must produce movements that have significant periods of rest, as is often observed in stroke patients. For example, a continuous forward and inverse adaptive model pair described by Bhusan and Shadmehr (1999) incorporates time delays representative of those in the visual and spinal feedback loops and predicts segmented behavior when learning to move in a novel force field. It predicts that the segmentation will decrease as the models become trained but is unlikely to predict periods of rest.
As an aside, the behavior of the Bhusan and Shadmehr (1999) model is attributable to its structure and to the existence of time delays rather than to its continuous nature. A similar model could be implemented in discrete terms equally plausibly. A discrete submovement model of this structure is much more likely to reproduce the salient characteristics of movement during stroke recovery, including both segmentation and periods of rest.
There are control system applications for submovements as well. Transmission delays tend to have a destabilizing effect on closed-loop control systems and often exist in teleoperated systems. The discrete nature of motor commands may be a mechanism by which control of movement is stabilized despite ≥100 msec delays in neural pathways and in the visual feedback loop; the CNS may be stably “teleoperating” the periphery using submovements. Telerobotic systems in space, medicine, and hazardous material handling that adopt control architectures based on discrete feedforward commands may become more stable, increasing performance. In addition, where the delay in these systems is caused by bandwidth limitations, the concise nature of discrete command representation would decrease average bandwidth requirements and further improve system performance. As an added benefit, control system resources dedicated previously to continuously monitoring input and output commands would be freed to execute other tasks.
These benefits would not be without cost. By their nature, discrete controllers have periods of time in which they gather information but do not act on it. This results in a delay, a scaled-up version of the discrete-time effect encountered in digital systems, which is likely to degrade performance. (Both optimal and robust control theory use near-continuous time controllers and predict a degradation of performance when time discretization becomes large.) However, the fact that discrete controllers exhibit less than optimal performance may not necessarily be a flaw but rather a feature. Optimality denotes, by definition, fragility; any slight change in the system degrades performance. This is in contrast to the human motor control system, which appears to be, above all else, robust.
Footnotes
This work was supported by National Institutes of Health Grants R01-HD36827 and R01-HD37397, the Burke Medical Research Institute, and a National Science Foundation graduate fellowship (B.R.).
Correspondence should be addressed to Brandon Rohrer, Sandia National Laboratories, P.O. Box 5800, MS-1010, Albuquerque, NM 87185-1010. E-mail: brrohre@sandia.gov.
REFERENCES
- 1.Ada L, O'Dwyer NJ, Neilson PD. Improvement in kinematic characteristics and coordination following stroke quantified by linear systems analysis. Hum Mov Sci. 1993;12:137–153. [Google Scholar]
- 2.Beppu H, Suda M, Tanaka R. Analysis of cerebellar motor disorders by visually guided elbow tracking movement. Brain. 1984;107:787–809. doi: 10.1093/brain/107.3.787. [DOI] [PubMed] [Google Scholar]
- 3.Berthier NE. Learning to reach: a mathematical model. Dev Psychol. 1996;32:811–823. [Google Scholar]
- 4.Bhusan N, Shadmehr R. Computational nature of human adaptive control during learning of reaching movements in force fields. Biol Cybern. 1999;81:39–60. doi: 10.1007/s004220050543. [DOI] [PubMed] [Google Scholar]
- 5.Brooks VB, Cooke JD, Thomas JS. The continuity of movements. In: Stein RB, editor. Control of posture and locomotion. Plenum; New York: 1973. pp. 257–272. [Google Scholar]
- 6.Burdet E, Milner TE. Quantization of human motions and learning of accurate movements. Biol Cybern. 1998;78:307–318. doi: 10.1007/s004220050435. [DOI] [PubMed] [Google Scholar]
- 7.Chollet F, DiPiero V, Wise RJS, Brooks DJ, Dolan RJ, Frackowiak RSJ. The functional anatomy of motor recovery after stroke in humans: a study with positron emission tomography. Ann Neurol. 1991;29:63–71. doi: 10.1002/ana.410290112. [DOI] [PubMed] [Google Scholar]
- 8.Cirstea MC, Levin MF. Compensatory strategies for reaching in stroke. Brain. 2000;123:940–953. doi: 10.1093/brain/123.5.940. [DOI] [PubMed] [Google Scholar]
- 9.Dam M, Tonin P, Casson S, Ermani M, Pizzolato G, Iaia V, Battistin L. The effects of long-term rehabilitation therapy on post stroke hemiplegic patients. Stroke. 1993;24:1186–1191. doi: 10.1161/01.str.24.8.1186. [DOI] [PubMed] [Google Scholar]
- 10.Doeringer JA, Hogan N. Serial processing in human movement production. Neural Netw. 1998;11:1345–1356. doi: 10.1016/s0893-6080(98)00083-5. [DOI] [PubMed] [Google Scholar]
- 11.Edelman S, Flash T. A model of handwriting. Biol Cybern. 1987;57:25–36. doi: 10.1007/BF00318713. [DOI] [PubMed] [Google Scholar]
- 12.Fetters L, Todd J. Quantitative assessment of infant reaching movements. J Mot Behav. 1987;19:147–166. doi: 10.1080/00222895.1987.10735405. [DOI] [PubMed] [Google Scholar]
- 13.Flash T, Henis E. Arm trajectory modifications during reaching towards visual targets. J Cognit Neurosci. 1991;3:220–230. doi: 10.1162/jocn.1991.3.3.220. [DOI] [PubMed] [Google Scholar]
- 14.Flash T, Hogan N. The coordination of arm movements: an experimentally confirmed mathematical model. J Neurosci. 1985;5:1688–1703. doi: 10.1523/JNEUROSCI.05-07-01688.1985. [DOI] [PMC free article] [PubMed] [Google Scholar]
- 15.Fugl-Meyer AR, Jaasko L, Leyman I, Olsson S, Seglind S. The post-stroke hemiplegic patient. I. A method for evaluation of physical performance. Scand J Rehabil Med. 1975;7:13–31. [PubMed] [Google Scholar]
- 16.Giszter SF, Kargo WJ. Conserved temporal dynamics and vector superposition of primitives in frog wiping reflexes during spontaneous extensor deletions. Neurocomputing. 2000;32–33:775–783. [Google Scholar]
- 17.Gribble PL, Ostry DJ. Origins of the power law relation between movement velocity and curvature: modeling the effect of muscle mechanics and limb dynamics. J Neurophysiol. 1996;76:2853–2860. doi: 10.1152/jn.1996.76.5.2853. [DOI] [PubMed] [Google Scholar]
- 18.Hogan N, Krebs HI, Sharon A, Charnnarong J (1995) U. S. Patent No. 5, 466:213.
- 19.Hogan N, Doeringer JA, Krebs HI. Arm movement control is both continuous and discrete. Cognitive Studies. 1999;6:254–273. [Google Scholar]
- 20.Kahn LE, Zygman ML, Rymer WZ, Reinkensmeyer DJ (2001) Effect of robot-assisted and unassisted exercise on functional reaching in chronic hemiparesis. Proceedings of the 23rd Annual International Conference of the Institute of Electrical and Electronics Engineers/Engineering in Medicine and Biology Society, Istanbul, Turkey, October.
- 21.Kargo WJ, Giszter SF. Rapid correction of aimed movements by summation of force-field primitives. J Neurosci. 2000;20:409–426. doi: 10.1523/JNEUROSCI.20-01-00409.2000. [DOI] [PMC free article] [PubMed] [Google Scholar]
- 22.Krebs HI, Brashers-Krug T, Rauch SL, Savage CR, Hogan N, Rubin RH, Fischman AJ, Alpert NM. Robot-aided functional imaging: application to a motor learning study. Hum Brain Mapp. 1998a;6:59–72. doi: 10.1002/(SICI)1097-0193(1998)6:1<59::AID-HBM5>3.0.CO;2-K. [DOI] [PMC free article] [PubMed] [Google Scholar]
- 23.Krebs HI, Hogan N, Aisen ML, Volpe BT. Robot-aided neurorehabilitation. IEEE Trans Rehabil Eng. 1998b;6:75–87. doi: 10.1109/86.662623. [DOI] [PMC free article] [PubMed] [Google Scholar]
- 24.Krebs HI, Aisen ML, Volpe BT, Hogan N. Quantization of continuous arm movements in humans with brain injury. Proc Natl Acad Sci USA. 1999;96:4645–4649. doi: 10.1073/pnas.96.8.4645. [DOI] [PMC free article] [PubMed] [Google Scholar]
- 25.Krylow AM, Rymer WZ. Role of intrinsic muscle properties in producing smooth movements. IEEE Trans Biomed Eng. 1997;44:165–175. doi: 10.1109/10.552246. [DOI] [PubMed] [Google Scholar]
- 26.Lauer RT, Peckham PH, Kilgore KL, Heetderks WJ. Applications of cortical signals to neuroprosthetic control: a critical review. IEEE Trans Rehabil Eng. 2000;8:205–208. doi: 10.1109/86.847817. [DOI] [PubMed] [Google Scholar]
- 27.Levin MF. Interjoint coordination during pointing movements is disrupted in spastic hemiparesis. Brain. 1996;119:281–293. doi: 10.1093/brain/119.1.281. [DOI] [PubMed] [Google Scholar]
- 28.Lum PS, Burgar CG, Kenney DE, Van der Loos HFM. Quantification of force abnormalities during passive and active-assisted upper-limb reaching movements in post stroke hemiparesis. IEEE Trans Biomed Eng. 1999;46:652–662. doi: 10.1109/10.764942. [DOI] [PubMed] [Google Scholar]
- 29.Milner TE. A model for the generation of movements requiring endpoint precision. Neuroscience. 1992;49:365–374. doi: 10.1016/0306-4522(92)90113-g. [DOI] [PubMed] [Google Scholar]
- 30.Morasso P, Mussa-Ivaldi FA. Trajectory formation in handwriting: a computational model. Biol Cybern. 1982;45:131–142. doi: 10.1007/BF00335240. [DOI] [PubMed] [Google Scholar]
- 31.Plamondon R. A kinematic theory of rapid human movements, part I: movement representation and generation. Biol Cybern. 1995;72:295–307. doi: 10.1007/BF00202785. [DOI] [PubMed] [Google Scholar]
- 32.Plamondon R, Alimi AM, Yergeau P, Leclerc F. Modeling velocity profiles of rapid movements: a comparative study. Biol Cybern. 1993;69:119–128. doi: 10.1007/BF00226195. [DOI] [PubMed] [Google Scholar]
- 33.Platz T, Denzler P, Kaden B, Mauritz K-H. Motor learning after recovery from hemiparesis. Neuropsychologia. 1994;32:1209–1223. doi: 10.1016/0028-3932(94)90103-1. [DOI] [PubMed] [Google Scholar]
- 34.Press WH, Teukolsky SA, Vetterling WT, Flannery BP. Numerical recipes in C, Ed 2. Cambridge UP; New York: 1992. Fitting data to a straight line. pp. 661–665. [Google Scholar]
- 35.Schaal S, Sternad D. Origins and violations of the 2/3 power law in rhythmic three-dimensional arm movements. Exp Brain Res. 2001;136:60–72. doi: 10.1007/s002210000505. [DOI] [PubMed] [Google Scholar]
- 36.Smith MA, Brandt J, Shadmehr R. Motor disorder in Huntington's disease begins as a dysfunction in error feedback control. Nature. 2000;403:544–549. doi: 10.1038/35000576. [DOI] [PMC free article] [PubMed] [Google Scholar]
- 37.Todorov E, Jordan MI. Smoothness maximization along a predefined path accurately predicts the speed profiles of complex arm movements. J Neurophysiol. 1998;80:696–714. doi: 10.1152/jn.1998.80.2.696. [DOI] [PubMed] [Google Scholar]
- 38.Trombly CA. Observations of improvement in reaching in five subjects with left hemiparesis. J Neurol Neurosurg Psychiatry. 1993;56:40–45. doi: 10.1136/jnnp.56.1.40. [DOI] [PMC free article] [PubMed] [Google Scholar]
- 39.Vallbo AB, Wessberg J. Organization of motor output in slow finger movements in man. J Physiol (Lond) 1993;469:673–691. doi: 10.1113/jphysiol.1993.sp019837. [DOI] [PMC free article] [PubMed] [Google Scholar]
- 40.von Hofsten C. Structuring of early reaching movements: a longitudinal study. J Mot Behav. 1991;23:280–292. doi: 10.1080/00222895.1991.9942039. [DOI] [PubMed] [Google Scholar]
- 41.Wann J, Nimmo-Smith I, Wing AM. Relation between velocity and curvature in movement: equivalence and divergence between a power law and a minimum-jerk model. J Exp Psychol Hum Percept Perform. 1988;14:622–637. doi: 10.1037//0096-1523.14.4.622. [DOI] [PubMed] [Google Scholar]
- 42.Wiener N. Cybernetics. MIT; Cambridge: 1961. [Google Scholar]
- 43.Wing AM, Lough S, Turton A, Fraser C, Jenner JR. Recovery of elbow function in voluntary position of the hand following hemiplegia due to stroke. J Neurol Neurosurg Psychiatry. 1990;53:126–1340. doi: 10.1136/jnnp.53.2.126. [DOI] [PMC free article] [PubMed] [Google Scholar]