

Abstract
Animal models of epilepsy have shown that synchronous burst firing is associated with epileptogenesis, yet the evidence from human studies linking neuronal synchrony and burst firing to epileptogenesis remains equivocal. Sleep–wake states have been shown to differentially modulate the generation of epileptiform EEG spikes between brain regions of greater and lesser seizure-generating potential, providing information that helps to identify the primary epileptogenic region. Using these state-dependent mechanisms to assist us in identifying neuronal correlates of human epilepsy, we recorded interictal neuronal activity from mesial temporal lobe (MTL) areas in epileptic patients implanted with depth electrodes required for medical diagnosis during polysomnographically defined sleep–wake states. Results show that single neurons recorded ipsilateral to seizure-initiating MTL (“epileptic”) areas had significantly higher firing rates (p = 0.01) and burst propensity (p = 0.01) and greater synchrony of discharges (p = 0.003) compared with neurons recorded from contralateral non-seizure-generating MTL (“non-epileptic”) areas. In particular, during episodes of slow wave sleep (SWS) and rapid eye movement (REM) sleep, epileptic hippocampal neurons had significantly higher burst rates compared with non-epileptic hippocampal neurons (both p = 0.01). In contrast, during episodes of wakefulness (Aw), no difference in burst firing between epileptic and non-epileptic hippocampal neurons was observed. Furthermore, synchronous firing was significantly higher between epileptic MTL neurons compared with non-epileptic MTL neurons during SWS (p = 0.04) and REM sleep (p = 0.02), but no difference in neuronal synchrony was found between epileptic and non-epileptic neurons during Aw. These results provide evidence that sleep states differentially modulate abnormal epileptogenic neuronal discharge properties within human MTL and confirm that neuronal burst firing and enhanced neuronal synchrony observed in experimental animal models of epilepsy characterizes human epilepsy as well.
Keywords: slow wave sleep, REM sleep, bursting, synchrony, epilepsy, limbic system
Numerous studies using animal models of epilepsy have shown that synchronous neuronal burst firing is associated with epileptogenicity (Wyler et al., 1975; Schwartzkroin and Prince, 1977; Perez-Velazquez et al., 1994; Jensen and Yaari, 1997;Scharfman et al., 2001). In contrast, investigations of the neuronal electrophysiological correlates of human epilepsy are few, and the evidence from human interictal recordings that does exist does not strongly agree with the data from experimental animal models. For example, Wyler and colleagues (1982) rarely observed synchronous firing between single neurons within epileptogenic areas except at the onset of an ictal event. Other investigators have reported either no difference in the distribution of burst-firing neurons or a reduction in burst firing among neurons recorded ipsilateral to seizure-generating regions compared with neurons within contralateral homotopic areas (Isokawa-Akesson et al., 1989; Colder et al., 1996a;Telfeian et al., 1999).
Most of the evidence of human neuronal correlates of epileptogenicity derives from either in vitro studies (Prince and Wong, 1981) or in vivo recordings without attention to behavioral state (Wyler and Ward, 1981; Babb et al., 1987; Isokawa-Akesson et al., 1987,1989; Colder et al., 1996a–c). However, an extensive literature indicates that epileptiform EEG abnormalities and clinical seizures are generally influenced by changes in state of vigilance, alertness, or awareness, such as those during the sleep–wake cycle (Autret et al., 1997; Jobst et al., 2001; Mendez and Radtke, 2001). Typically, episodes of non-rapid eye movement (NREM) sleep are associated with an increase in epileptogenicity, whereas episodes of REM sleep are associated with a reduction in epileptogenicity (Shouse et al., 2000). Investigations into the cellular mechanisms involved in the generation of the characteristic EEG patterns associated with sleep states offer important insights into the activation of epileptiform activity during sleep (Steriade and Contreras, 1995). Networks of cortical neurons involved in synchronizing thalamically generated δ oscillations that occur during slow wave sleep (SWS) may serve as the preferential substrate for epileptiform spike-wave activity (Steriade et al., 1998). Furthermore, polysomnographic studies of human epilepsy have provided evidence that brain regions consistently initiating seizures generate epileptiform EEG events that are more autonomous than non-seizure-initiating regions, i.e., they demonstrate less rate change across sleep–wake states. This information can be used to help localize the primary epileptogenic area for surgery (Lieb et al., 1980;Rossi et al., 1984; Sammaritano et al., 1991).
Given the importance of comparing human epileptogenic neuronal activity with that found in animal models of epilepsy, and the utility of polysomnography as an investigative tool, we asked whether changes across the sleep–wake cycle would affect the firing of neurons recorded ipsilateral to seizure-generating mesial temporal lobe (MTL) areas differently than it affects neurons recorded from contralateral MTL areas where seizure initiation did not occur. Interictal neuronal activity was recorded in epileptic patients implanted with depth electrodes required for medical diagnosis and was quantitatively evaluated during polysomnographically defined episodes of waking (Aw), SWS, and REM sleep. Measures of firing rate, burst propensity, and synchronous discharge were thus compared on the basis of epileptogenicity (ability of brain region to generate spontaneous seizures), sleep–waking state, and anatomical structure to identify single neuron discharge correlates of epileptogenesis.
MATERIALS AND METHODS
Subjects. Interictal recordings were obtained from 17 patients with medically intractable complex partial seizures. Before clinically required depth electrode implantation for the investigation and localization of seizure onset area, patients gave their informed consent for participation in these research studies under the approval of the University of California Los Angeles (UCLA) Internal Review Board. Each patient was surgically implanted with 8–14 flexible polyurethane clinical depth electrodes (1.25 mm diameter) stereotactically targeted to clinically relevant brain areas. These electrodes were monitored on a 24 hr basis along with video behavioral monitoring to find those brain areas in which spontaneous seizure activity began first (Fried et al., 1999). Patients in whom a seizure onset area could be localized became candidates for surgical removal of epileptic sites if resection of the area would not produce any unacceptable neurological deficit. Localization of the seizure onset zone was based on the recording of 3–10 seizures during the average 2 weeks that patients spent in the hospital. For each subject, functional and anatomical data from depth electrode recordings and neuroimaging were used to identify the epileptogenic region (Engel, 1996).
Electrodes and localization. Neuronal activity was recorded from bundles of nine platinum–iridium microwires, which were inserted through the lumen of the seven-contact clinical depth electrodes, so that they extended 3–5 mm beyond the tip of the clinical electrode. Microwires were 40 μm in diameter with impedances ranging from 200 and 500 kΩ. Electrode tips were localized using the combined information from post-implant computed tomography (CT) scans co-registered with pre-implant 1.5 T magnetic resonance imaging (MRI) scans and skull x-ray films (Fig. 1). The imaging software that was used (Brain Navigator, Grass-Telefactor Corp., Philadelphia, PA) allowed for visualization and highlighting of electrode tip locations on CT scans, which were automatically registered to the MRI scans. Anatomical boundaries were based on references of mesial temporal lobe anatomy by Duvernoy (1998) andAmaral and Insausti (1990). Only microwires verified to be located in hippocampus (Hip), subiculum (Sub), and entorhinal cortex (EC) were used in analyses.
Fig. 1.
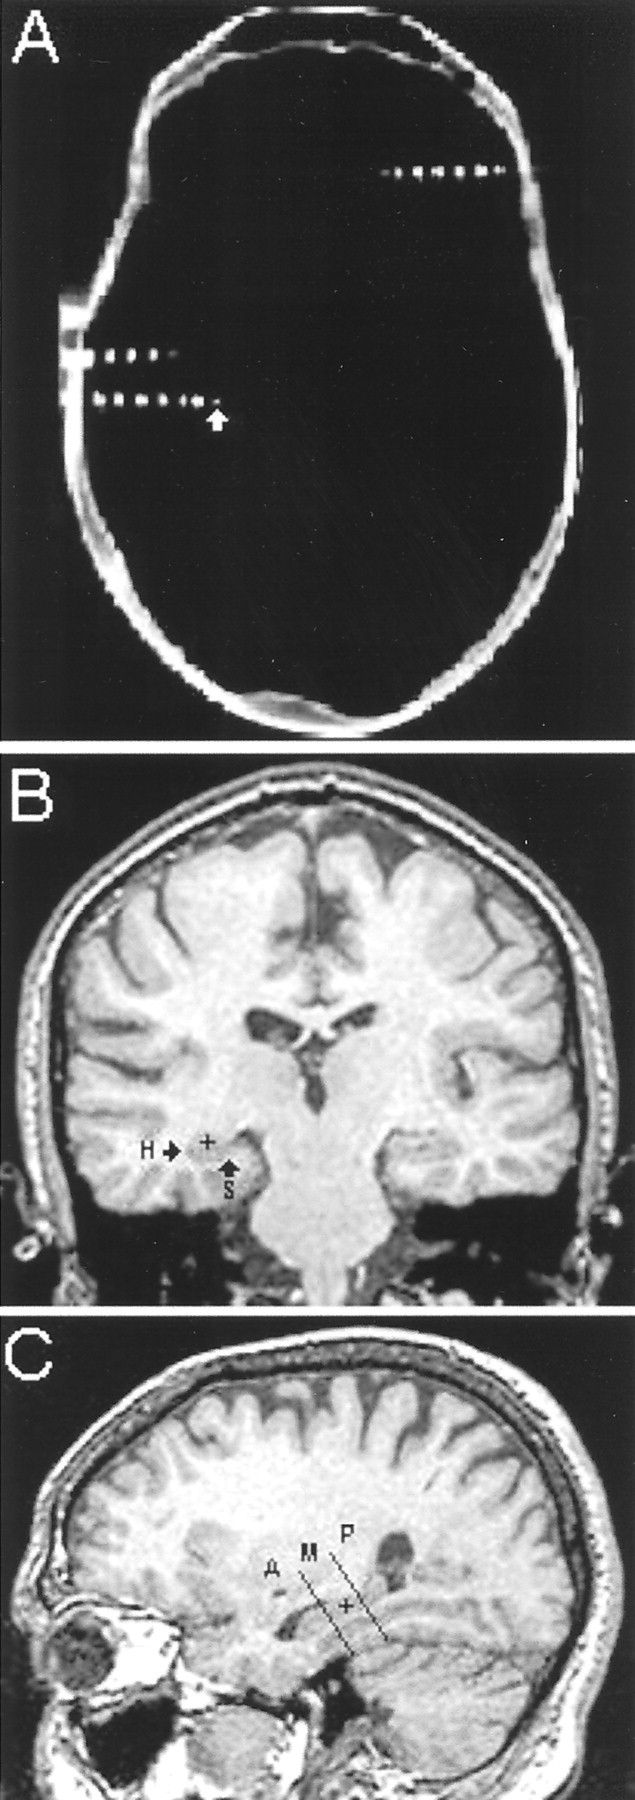
Electrode tips were localized using post-implant CT images co-registered with pre-implant MRI scans. A, An axial CT image from patient 316 shows three electrodes within the plane from which this slice was taken. Areas of bright signal intensity inside the contours of the skull designate clinical electrode contacts and microwire bundles. The white arrow points to one of the microelectrode bundles extending beyond the distal tip of a clinical electrode. B, A coronal MRI scan co-registered with the axial CT image shown above reveals that the microelectrode bundle highlighted in A was located within the left hippocampus (microelectrodeindicated by black + within hippocampus, marked H). An arrowalso points to subiculum, marked S (no microelectrode shown). C, MRI scans were reconstructed in the axial (data not shown) and sagittal planes to locate the position of electrodes in three dimensions. This sagittal MRI scan, reconstructed from the coronal MRI shown in B, shows the position of the microelectrode (black +) within the middle hippocampus. Two black lines demarcate the boundaries of the anterior (A), middle (M), and posterior (P) areas of the hippocampus.
Overnight polysomnographic sleep studies. Sleep studies were conducted on the hospital ward within each subject's room. Studies were conducted 48–72 hr after surgery and typically began between the hours of 10 P.M. and midnight and ended at 7 A.M. the following morning. Patients continued taking their standard doses of anticonvulsant medications during this period. Sleep staging was performed according to the criteria of Rechtschaffen and Kales (1968). The sleep montage consisted of two disc electrodes placed supra- and infra-orbitally to record eye movements; two disc electrodes were placed on the chin to record submental muscle tone, and two O-Flexon stainless steel needle electrodes were placed during surgery at “10–20” positions C3 and C4 on the scalp, with each referred to the contralateral auris externa to record cortical EEG activity. Sleep–wake stages were categorized as waking, stages 1 through 4 sleep, and rapid eye movement sleep. Single neurons recorded during the stages defined as Aw, stages 3 and 4, from herein referred to as SWS, and REM sleep were analyzed for firing rate, bursting activity, and synchrony of discharges. Sleep stages 1 and 2 were not included for analyses to better contrast neuronal activity during states of wakefulness and non-REM sleep.
Electrophysiology and data analysis. Continuous EEG was recorded wide band (0.1 Hz–5 kHz) and sampled at 10 kHz with 12-bit precision using RC Electronics software (Santa Barbara, CA). Data files containing up to 16 channels of EEG were copied onto compact disc for off-line analysis. Channels were visually examined for the presence of neuronal activity and high-pass filtered at 300 Hz with 36 dB roll-off (Fig. 2A). Extracellularly recorded action potentials with amplitude >3:1 signal-to-noise were triggered and separated using DataWave Technologies, CP Analysis software (Longmont, CO). Separation of action potentials (“spikes”) representing the activity from a single neuron was performed using a spike waveform-based “cluster-cutting” technique described previously (Staba et al., 2002). Briefly, spike waveform attributes, like the two illustrated in Figure2B, were extracted from each triggered spike and plotted on x–y scatterplots. Spikes with similar attributes would form clusters and would be grouped. To confirm the accurate placement of cluster boundaries and to remove any remaining artifacts, spike waveforms were visually inspected, and autocorrelograms were constructed with a time base of 100 msec and bin-width of 1 msec for each single neuron (Fig. 2C). A spike train with an absence of spikes within the 0–2 msec bins (refractory period) was considered a single neuron. A spike train with counts greater than mean firing frequency during the refractory period was considered multiple neurons and reclustered. During reclustering, a spike train with an absence of a clear refractory period was termed multiple neuron activity and omitted from the analysis. Cross-correlograms with 1 msec bin-widths were constructed for all simultaneously recorded neurons. Pairs of neurons recorded on different microwires in the same electrode bundle that demonstrated 0 msec coincident interactions exceeding 99% confidence (Abeles, 1982) were considered the same neuron, and one neuron was eliminated.
Fig. 2.

Single neuron detection and separation based on a waveform clustering method. A, High-pass-filtered signal (300 Hz) used in triggering spike waveforms. Asteriskdenotes burst of spikes (action potentials). B, Waveform separation using cluster-cutting method. Spike waveform attributes, such as peak amplitude and first positive peak amplitude, are plotted on x–y scatterplots. Waveforms with similar attributes tend to form clusters and are grouped as representative of the activity from putative single neurons. Shown above the scatterplot are the averaged waveforms of the spikes within each cluster. C, Autocorrelograms of spike activity from neuron 1 (C1) and neuron 2 (C2). Note the absence of any spikes in bins after time 0 and <5 msec, indicating that no spikes occurred within the refractory period of the neuron. Bin width = 1 msec.
Neuronal discharge activity was characterized by measuring mean firing rate and number of bursts per minute (burst rate). Burst detection involved serially scanning each spike train to identify short-duration, high-frequency discharge episodes. A burst was defined as a set of at least three consecutive spikes with all intervals <20 msec; moreover, the set had to be both preceded and followed by at least one interval >20 msec. Synchronous discharge was evaluated through the construction of cross-correlograms with a time base of ±800 msec and bin-width of 10 msec. Significant synchronous discharge was determined by the appearance of peaks exceeding the 99% confidence interval based on the mean number of coincidences expected by chance. Cross-correlograms were then interpolated with a cubic spline (up sampling factor of 10), and significant peak area was integrated with Euler's trapezoidal method to determine duration of time lead or lag. Strength of interaction was assessed by measuring the area under the significant central peak and above the mean firing rate. Areas were normalized by dividing by the mean number of coincident discharges that would be expected to occur by chance for each pair of neurons. Neurons that were successfully recorded during Aw, SWS, and REM sleep for at least 600 sec in each state were included in the analysis.
Classification of single neuron pathology. To identify single neuron recording sites as “epileptic,” two major criteria were used: electrographic seizure onsets and hippocampal atrophy. Electrographic seizure onsets were recorded during the patient's depth electrode telemetry monitoring, and attending neurologists in the UCLA Seizure Disorders Center identified locations of seizure onset on the basis of these recordings. A single neuroradiologist at UCLA evaluated every patient's MRI scans for the presence or absence of hippocampal atrophy and its location as part of the clinical evaluation. Recording sites were defined as epileptic if located ipsilateral to areas of seizure onset and either ipsilateral or contralateral to hippocampal atrophy. Also defined as epileptic were all recording sites located in MTL structures of patients (n = 3) with bilateral ictal onsets. Recording sites were defined as “non-epileptic” if seizure initiation and hippocampal atrophy were located contralaterally, or if seizure initiation was contralateral and no atrophy was detected. Recordings sites contralateral to seizure onset and ipsilateral to hippocampal atrophy were excluded from analyses.
Statistical analysis. Discharge variables were analyzed using a three-factor repeated measures ANOVA design. The factors used in the statistical model were anatomical structure or “recording site” (EC, Hip, and Sub) and “epileptogenicity” (epileptic and non-epileptic) as the between group factors, and “state” (Aw, SWS, and REM sleep) as the within group or repeated measures factor. Consistent with the requirement for normality, dependent variables were transformed with a logarithmic function such that Y′ = log (Y). Post hoc analyses of all significant main effects and interactions in the ANOVA model were performed using Scheffé's test for between group comparisons and Tukey-Kramer test for within group comparisons. Comparison of the proportion of significant cross-correlations between epileptic and non-epileptic neurons across the three states was performed using χ2 test. Comparison of the strength of significant firing interaction of these cross-correlations was performed using two-way ANOVA with epileptogenicity and state as the two factors. Significance level for all statistical tests was set atp ≤ 0.05.
RESULTS
Single neuron population
A total of 105 well isolated single neurons were recorded from the temporal lobes of 17 patients. Thirty-one single neurons recorded in 11 patients did not meet the sampling criterion of being successfully recorded during all three states. For the remaining 74 single neurons, a total of 40.4 hr of interictal activity from 13 patients was analyzed during polysomnographically defined states of Aw, SWS, and REM sleep.
Location of recording electrodes
Locations of recording electrode tips were visualized with 1.0 mm MRI coronal slices (for technique, see Materials and Methods and Fig.1). Table 1 shows the number of single neurons recorded from each MTL area. Starting at the anterior-most point and proceeding posteriorly along the longitudinal axis of the Hip, 22 of the 42 Hip neurons were located within the anterior hippocampal region (also known as uncal hippocampus or pes hippocampi). Ten Hip neurons were located in the middle or body of the hippocampus (at anterior–posterior levels identified by the presence of the lateral geniculate nuclei on the coronal slices), although the remaining 10 neurons were located in the posterior hippocampus or hippocampal tail. The black lines on the sagittal MRI section shown in Figure 1C demarcate the boundaries of the three hippocampal areas. The 13 Sub neurons were located in subicular complex beginning posterior and inferior to the amygdalohippocampal border and extending posteriorly through levels immediately preceding the presence of the lateral geniculate nuclei identified on coronal slices (Fig. 1B). The 19 EC neurons were located within cortical areas beginning anterior and inferior to levels identified by the hippocampal head and extending posteriorly to levels in which the body of the hippocampus becomes visibly distinct from the head of the hippocampus. The EC area is limited to that designated anterior hippocampus in the sagittal section in Figure1C.
Table 1.
Number of single neurons recorded within each mesial temporal lobe structure and segregated based on pathology
| Hip | Sub | EC | Total | |
|---|---|---|---|---|
| Epileptic | 21 | 4 | 11 | 36 |
| Non-epileptic | 21 | 9 | 8 | 38 |
| Total | 42 | 13 | 19 | 74 |
Neurons located ipsilateral to areas where depth electrodes recorded seizure onsets and concordant with side of MRI-detected hippocampal atrophy were termed epileptic. Neurons located contralateral to areas of seizure onset and located contralateral to atrophic hippocampi or where atrophy was undetectable were termed non-epileptic.
Results from non-primate studies suggest that a functional differentiation may exist along the septotemporal axis of the hippocampus based on differences between dorsal and ventral neuronal discharge properties and place field selectivity (for review, see Moser and Moser, 1998). To assess whether there may be differences in neuronal discharge rate and bursting along the anterior–posterior axis of the human hippocampus, we compared discharge properties among all neurons recorded within anterior, middle, and posterior hippocampal areas during sleep–wake states. Our results showed that there was no distinction among the different human hippocampal recording sites on the basis of mean firing rate (F(2,123) = 0.29; p = 0.7) or burst rate (F(2,123) = 1.01;p = 0.3). Additionally, changes across states did not assist in differentiating neurons recorded from the three hippocampal areas on the basis of firing rate (F(4,117) = 1.29; p = 0.2) or burst rate (F(4,117) = 1.34;p = 0.2). For these reasons, hippocampal neurons recorded from anterior, middle, and posterior regions were combined and analyzed as a group.
Proximity of recording sites to pathology
Of the 74 single neurons analyzed (Table 1), 36 were recorded ipsilateral to areas generating spontaneous seizures (epileptic). Twenty-one of these 36 neurons recorded were also ipsilateral to atrophic hippocampi. The remaining 15 neurons were recorded from patients without detectable atrophy in either hippocampus. The MTL neurons that we recorded ipsilateral to seizure onsets localized to the frontal lobe did not meet the sampling criterion of being successfully recorded during all three states. Thirty-eight of the 74 total neurons were recorded contralateral to area of seizure onset (non-epileptic). Of the 38 neurons recorded within non-epileptic areas, 15 neurons were recorded contralateral to atrophic hippocampi, although the remaining 23 were recorded from patients without detectable hippocampal atrophy. Additionally, 6 of the 38 neurons recorded within non-epileptic areas were recorded contralateral to seizure onsets localized to the frontal lobe, although the remaining 32 neurons were contralateral to epileptic mesial temporal lobe sites.
Epileptogenicity: epileptic versus non-epileptic
Figure 3A shows that overall single neurons within epileptic areas had significantly higher firing rates compared with neurons recorded from non-epileptic areas (F(1,220) = 5.19; p = 0.02). The mean (±SE) firing rate of epileptic neurons was 4.26 ± 0.33 spikes per second compared with the mean firing rate of non-epileptic neurons of 2.95 ± 0.29 spikes per second (p = 0.01).
Fig. 3.

Effects of epileptogenicity on mean single-neuron firing rate and burst rate. A, Neurons recorded within epileptic areas had significantly higher firing rates compared with neurons recorded in non-epileptic areas (firing rate reported as action potential or spikes per second). B, Mean burst rates were significantly higher for epileptic neurons compared with non-epileptic neurons. Values are mean ± SE in this and the remaining figures. *p = 0.01.
Spike bursts, like the ones illustrated in Figure4, A and B, were detected from single neurons recorded within epileptic and non-epileptic areas. As can be seen in the raster plots in Figure 4,A and B, the single neuron recorded within epileptic Hip demonstrates an irregular burst firing pattern (bursts denoted by black triangles) compared with less frequently occurring burst discharge of the neuron recorded within non-epileptic Hip. Autocorrelograms (Fig. 4A,B) further illustrate the propensity for the epileptic neuron to discharge at short interspike intervals (ISIs) compared with the non-epileptic neuron. Neurons recorded within epileptic areas had significantly higher burst rates (number of bursts per minute) compared with neurons within non-epileptic areas (F(1,220) = 4.20; p = 0.04) (Fig. 3B). Figure3B shows that the mean burst rate of neurons recorded from epileptic areas was 11.22 ± 1.52 bursts per minute compared with 5.79 ± 0.85 bursts per minute for neurons recorded from non-epileptic areas (p = 0.01). The mean ISI within bursts was significantly shorter for epileptic neurons (10.4 ± 0.19 msec) compared with non-epileptic neurons (11.4 ± 0.23 msec; F(1,181) = 4.17;p = 0.04). No significant difference was observed in the mean number of spikes found within each burst event between epileptic and non-epileptic neurons (3.7 ± 0.07 spikes per burst vs 3.5 ± 0.05 spikes per burst, respectively).
Fig. 4.

Burst firing from single neurons recorded within epileptic and non-epileptic hippocampal areas. The top two traces (A, B) illustrate a typical burst event detected from two single hippocampal neurons. To the right of each trace are the autocorrelograms for each neuron. The burst event on the left(A) was recorded from a neuron located within the left posterior, non-atrophic hippocampus of a patient who had seizures initiating from the left mesial temporal lobe. The burst event on theright (B) came from a neuron recorded within the left middle hippocampus of a different patient who had seizures initiating from the right mesial temporal lobe that contained a right sclerotic hippocampus. The two raster plots show 600 sec of discharge activity recorded during SWS from the two neurons illustrated above, respectively. Note the more frequently occurring bursts (denoted by black trianglesabove tick marks) and longer intervals of discharge suppression from the neuron recorded within the epileptic Hip compared with the neuron from the non-epileptic Hip. Inset(top right), Bar graph shows burst rate for each neuron. Mean firing rate for each neuron was 1.9 spikes per second. Because of the slow sweep speed, individual spikes are not distinguishable during periods of burst discharge but appear as a dense clustering oftick marks. Calibration: A,B, 10 msec.
To assess the extent of synchronous discharge, we constructed cross-correlograms, like the one in Figure5A, for all simultaneously recorded pairs of neurons. Of the 381 cross-correlograms constructed, 93 cross-correlograms had a significant peak that occurred around the origin, indicating that these neuronal pairs were discharging synchronously. More than 95% of significant correlations occurred between neurons recorded on individual tips of single microwire bundles (tips separated by millimeters), whereas <5% of significant correlations were found between neurons recorded on tips of microwire bundles from two different depth electrodes (separated by centimeters). Because 16% of epileptic neurons and 30% of non-epileptic neurons discharged at rates <1 spike per second, we were unable to reliably detect significant negative interactions (appearance of a central trough in cross-correlogram) between neuronal pairs. Seventy-eight of the 93 (84%) cross-correlograms had significant peak interactions that occurred within ±20 msec of time 0 msec. The remaining 15 cross-correlograms had peaks that occurred within ±200 msec of time 0 msec. By quantifying the incidence of synchronous firing, our results showed that there was a greater proportion of significant cross-correlations between pairs of neurons recorded within epileptic areas compared with neuron pairs recorded in non-epileptic areas (Fig.5B). Thirty-one percent of the total cross-correlations (n = 189) between neuronal pairs recorded within epileptic areas identified synchronous firing compared with 18% of cross-correlations (n = 192) between neuronal pairs within non-epileptic areas (χ2 = 8.70; df = 1; p = 0.003). There was no difference in the proportion of cross-correlograms between pairs of epileptic neurons recorded within the same structure (94%) compared with the number of cross-correlograms between pairs of non-epileptic neurons recorded within the same structure (85%; p > 0.05). We measured the strength of coincident discharge between simultaneously recorded neurons that demonstrated a significant firing interaction by calculating the area below the peak of the cross-correlograms (Fig.5A, area illustrated by shaded peak) and compared the strength of synchronous firing between epileptic and non-epileptic neurons. Although the tendency for epileptic neurons to fire synchronously was significantly greater compared with non-epileptic neurons, the results of this analysis showed no overall difference in the strength of synchronous firing between epileptic and non-epileptic neurons (F(1,91) = 1.58;p = 0.2).
Fig. 5.

Cross-correlation analysis between single neurons recorded in epileptic regions compared with single neurons recorded within non-epileptic regions. A, Cross-correlogram of a pair of single neurons simultaneously recorded from an epileptic hippocampus during SWS. Each neuron was recorded on a separate microwire from a bundle of microwires with contacts spaced at 500 μm increments from the proximal to distal tip of the bundle.Two long-dashed lines represent the upper and lower 99% confidence intervals. The short-dashed line represents the mean firing rate. The portion of the correlogram shadedblack represents the area under the significant peak used to quantitatively assess the strength of interaction. Bin size = 10 msec. B, Percentage of cross-correlograms showing significant discharge interactions between pairs of neurons recorded within epileptic areas (n = 189) compared with pairs of neurons recorded within non-epileptic areas (n = 192). Values represent the mean percentage of cross-correlograms showing significant interactions with upper and lower confidence intervals of 95%. The solid horizontal line indicates no overlap between confidence intervals.
State: sleep versus waking
Figure 6, A andB, shows that the divergence in firing rate and burst rate between epileptic and non-epileptic neurons was more pronounced during episodes of SWS and REM sleep compared with Aw. Contrary to these noticeable trends, our analyses of state-related changes in neuronal firing rate and burst rate revealed that there was no significant interaction between state and epilepsy (firing rate,F(2,219) = 1.41, p = 0.2; burst rate, F(2,219) = 0.56,p = 0.6). Interestingly, Figure 6Bshows that both epileptic and non-epileptic neurons had the highest rates of burst firing during SWS compared with REM sleep and Aw. Ignoring the effects of epileptogenicity on neuronal activity, Figure6C reveals significant state-related differences in neuronal burst firing (F(2,219) = 15.42;p < 0.0001). Mean burst rate during episodes of SWS was significantly higher compared with both Aw and REM sleep (11.17 ± 1.90 bursts per minute vs 7.50 ± 1.16 and 6.63 ± 1.35, respectively; both p = 0.05), and in addition, burst rate during Aw episodes was greater than during REM sleep (p = 0.05). In contrast, no state-related differences in firing rate were found (F(2,219) = 2.90; p = 0.06) (Fig. 6C).
Fig. 6.

Mean firing rate and burst rate during episodes of Aw, SWS, and REM sleep. A, Mean firing rate of epileptic and non-epileptic neurons during sleep–wake states. B, Comparison of burst firing between epileptic and non-epileptic neurons across states. C, Combination of epileptic and non-epileptic neurons, mean firing rate, and burst rates for each state. Burst rate was significantly higher during episodes of SWS compared with both Aw and REM sleep. Episodes of Aw were found to have higher burst rates compared with REM sleep. *p = 0.05.
Examination of the interaction between state and epileptogenicity on neuronal synchrony revealed significant differences during episodes of SWS and REM sleep. Figure 7Ashows that during SWS, 49% of the cross-correlograms between neurons recorded within epileptic areas demonstrated significant firing interactions compared with 30% of cross-correlograms between pairs of neurons recorded within non-epileptic areas (χ2 = 4.28; df = 1;p = 0.04). During REM sleep the proportion of cross-correlograms indicating significant synchronous discharge within epileptic and non-epileptic areas was 22 and 6%, respectively (χ2 = 5.41; df = 1;p = 0.02). Episodes of Aw did not discriminate synchronous firing between neurons recorded in epileptic compared with non-epileptic areas (p = 0.6).
Fig. 7.

Comparison of neuronal synchrony and strength of interaction between epileptic and non-epileptic neurons during sleep–wake states. A, The proportion of cross-correlograms (epileptic, n = 63 per state; non-epileptic, n = 64 per state) showing significant discharge interactions was significantly greater between pairs of epileptic neurons compared with non-epileptic neurons during episodes of SWS (*p = 0.04) and REM sleep (+p = 0.02). The black triangle indicates that among epileptic neurons synchronous pairs of neurons were observed during SWS significantly more often than during Aw and REM sleep. The black circle indicates that among non-epileptic neurons significantly more pairs of neurons showed synchronous interactions during SWS compared with REM sleep.B, Strength of synchronous discharge interaction. Strength of interaction was measured as the area under the central peak of the cross-correlogram and expressed as the number of coincidences. No difference was observed in the strength of neuron firing interaction between neurons recorded within epileptic areas compared with non-epileptic areas. However, across all recorded neurons, episodes of SWS were associated with greater synchronous discharge compared with episodes of Aw. *p = 0.02.
Further examination of the effect of state on neuronal synchrony using χ2 shows that both epileptic and non-epileptic neurons were similarly modulated by behavioral state. In Figure 7A, the black triangle denotes that synchronous firing between neurons recorded within epileptic areas was greater during SWS compared with Aw and REM sleep (p = 0.0008 and 0.0002). However, no difference in the proportion of neuronal discharge interactions was observed between episodes of Aw and REM sleep. Similarly, synchronous discharge between neurons recorded within non-epileptic areas was significantly greater during SWS compared with REM sleep, represented in Figure7A by the black circle (p= 0.0007). Trends but no significant differences were observed between episodes of Aw compared with SWS (p = 0.06) or between Aw compared with episodes of REM sleep (p = 0.07). It is interesting to note that differences in neuronal synchrony were found between the two desynchronized states of Aw and REM sleep. For neurons within non-epileptic areas, synchronous firing was notably reduced during REM sleep compared with episodes of Aw, whereas synchronous firing between epileptic neurons during REM sleep was comparable to levels found during episodes of Aw (Fig. 7A). Examination of the interaction between state and epileptogenicity on the strength of neuronal synchrony revealed a trend for greater strength of synchronous discharge between epileptic neurons compared with non-epileptic neurons during SWS and REM sleep (Fig. 7B). However, statistical analyses found no significant interaction between behavioral state and epileptogenicity (F(2,90) = 0.49;p = 0.6). Analysis for the effects of state alone did reveal significant state-related changes in the strength of synchronous discharge (F(2,90) = 3.48;p = 0.04). Figure 7B shows that pairs of neurons recorded during episodes of SWS demonstrated greater strength of synchronous firing compared with Aw (p = 0.02), whereas there was no significant difference in strength of neuronal synchrony between episodes of SWS and REM sleep (p = 0.4) or between episodes of Aw and REM sleep (p = 0.6).
Temporal lobe recording sites: hippocampus versus subiculum versus entorhinal cortex
Table 2 shows that significant differences were found in both firing rate (F(2,219) = 2.86; p = 0.003) and burst rate (F(2,219) = 3.11; p = 0.05) between specific MTL brain areas. The mean firing rate of Sub neurons was greater than Hip neurons (5.06 ± 0.59 vs 2.91 ± 0.28 spikes per second; p = 0.01). Similarly, mean burst rate of Sub neurons was greater than Hip neurons (14.12 ± 2.69 vs 7.47 ± 1.17 bursts per minute;p = 0.05). Comparisons of mean firing rate and burst rate between EC and Sub neurons failed to reach statistical significance, as did the comparison between EC and Hip neurons. Examination of the MTL recording site in relation to epileptogenicity did not reveal significant differences in neuronal firing rates (F(2,219) = 0.37; p = 0.7) or burst rates (F(2,219) = 0.59;p = 0.6; data not shown). Because of the low number of simultaneously recorded neurons within each epileptic and non-epileptic MTL area, we were unable to evaluate each MTL recording site in relation to epileptogenicity on the basis of neuronal synchrony.
Table 2.
Mean firing and burst rates (±SE) for single neurons recorded within EC (n = 19), Hip (n = 42), and Sub (n = 13) during episodes of Aw, SWS, REM sleep, and mean of all states combined
| Aw | SWS | REM Sleep | Overall | |
|---|---|---|---|---|
| Firing rate | ||||
| EC | 5.04 ± 0.78SW2-160RS* | 3.20 ± 0.58 | 3.98 ± 0.71 | 4.07 ± 0.41 |
| Hip | 2.76 ± 0.41 | 3.01 ± 0.48 | 2.94 ± 0.56 | 2.91 ± 0.28 |
| Sub | 5.38 ± 1.22 | 5.59 ± 0.98 | 4.22 ± 0.88 | 5.06 ± 0.59H2-160 |
| Burst rate | ||||
| EC | 8.99 ± 2.33SW*RS* | 5.58 ± 1.53 | 5.46 ± 1.40 | 6.67 ± 1.04 |
| Hip | 5.76 ± 1.48 | 9.57 ± 2.30A2-160RS2-160 | 7.08 ± 2.23 | 7.47 ± 1.17 |
| Sub | 10.93 ± 2.84 | 24.54 ± 6.53A2-160RS2-160 | 6.90 ± 1.90 | 14.12 ± 2.69H* |
The presence of superscript letters “A” (Aw), “SW” (SWS), and “RS” (REM sleep) following a value represent a significant difference between that particular state. The presence of superscript letters “E” (EC), “H” (Hip), and “S” (Sub) following a value represent a significant difference between that particular structure.
p = 0.05;
F2-160: p = 0.01.
Despite the significant differences in firing rate shown in Figure8A between epileptic Hip and Sub neurons compared with non-epileptic Hip and Sub neurons, the combined effects of state and recording site did not discriminate discharge frequencies between epileptic and non-epileptic neurons (F(4,218) = 1.03; p = 0.4). However, in contrast to mean firing rate, further analysis showed that the combination of state and recording site differentiated epileptic and non-epileptic neurons on the basis of burst rate (F(4,218) = 2.81; p = 0.03). Figure 8B shows prominent differences in burst firing between neurons recorded within epileptic Hip areas compared with non-epileptic Hip areas. Epileptic Hip neurons had significantly higher burst rates compared with non-epileptic Hip neurons during episodes of both SWS (p = 0.01) and REM sleep (p = 0.01). No difference was observed between epileptic and non-epileptic Hip neurons during episodes of Aw, nor did we observe significant differences in burst rate between epileptic and non-epileptic EC or Sub neurons during any of the sleep–wake states.
Fig. 8.

Mean firing rate and burst rate of single neurons recorded in EC, Hip, and Sub during Aw, SWS, and REM sleep.A, Comparison of mean firing rate. B, Mean burst rate was higher among neurons recorded from epileptic Hip compared with non-epileptic Hip across episodes of SWS and REM sleep. No differences were observed between neurons recorded from epileptic EC compared with non-epileptic EC or between epileptic Sub and non-epileptic Sub. **p = 0.01.
Inspection of Figure 8 also revealed that there were similar state-related changes in firing rate and burst rate between epileptic and non-epileptic neurons within each MTL area. Table 2 summarizes mean firing rate and burst rate of neurons within each structure during Aw, SWS, and REM sleep. In regard to firing rate, a significant interaction was found between state and MTL recording site (F(4,218) = 3.35; p = 0.01). Neurons recorded within EC had higher firing rates during episodes of Aw compared with both SWS (p = 0.01) and REM sleep (p = 0.05), whereas there was no difference in firing rate between SWS and REM sleep. Significant interactions were also found between state and recording site on the basis of burst rate (F(4,218) = 6.05;p = 0.0002). Both Hip and Sub neurons had higher burst rates during episodes of SWS compared with both Aw (p = 0.01) and REM sleep (p = 0.01), whereas no difference in burst rate was observed between Aw and REM sleep. Unlike both Hip and Sub, EC neurons had higher burst rates during episodes of Aw compared with both SWS (p = 0.05) and REM sleep (p = 0.05). Within EC, there was no significant difference in burst rate between SWS and REM sleep.
DISCUSSION
This study addressed, for the first time, the question of how sleep–waking states influence epileptogenic neuronal discharge frequency, pattern, and synchrony in the human mesial temporal lobe. The main findings from this study can be summarized as follows. (1) When recordings from both waking and sleeping periods are combined, neurons recorded within epileptic MTL areas demonstrated higher firing rates, increased frequency of burst discharge, and greater synchrony of discharges compared with neurons recorded within non-epileptic MTL areas; (2) episodes of SWS and REM sleep were associated with significantly greater synchronous firing between pairs of neurons recorded within epileptic MTL areas compared with non-epileptic MTL areas, whereas there was no difference in synchronous firing of neurons recorded in epileptic versus non-epileptic areas during waking; and (3) during sleep states, epileptic hippocampal neurons demonstrated higher burst rates compared with non-epileptic hippocampal neurons, whereas there was no difference in burst firing rate during waking.
Although the term non-epileptic was used to categorize those neurons recorded within an MTL area where clinical depth electrodes never recorded the onset of a seizure and MRI-identified atrophy was absent, we cannot absolutely exclude the possibility that a non-epileptic limbic area has never been involved in seizure genesis. This is because our recordings spanned only a few weeks, and all of the patients studied had seizure histories spanning years. Therefore, the terms epileptic and non-epileptic must be interpreted to represent areas of greater and lesser epileptogenic potential, respectively (Engel, 1993).
Neuronal correlates of epileptogenicity
Studies from experimental models of epilepsy have found that prolonged membrane depolarizations giving rise to multiple action potentials are characteristic of neurons within epileptogenic areas (Matsumoto and Ajmone-Marsan, 1964; Jensen and Yaari, 1997; Bertram et al., 1998; Smith and Dudek, 2001). Despite the evidence of enhanced synaptic excitability in animal models of epilepsy, many intracellular studies of neurons within resected human epileptogenic tissue (Schwartzkroin et al., 1983; Telfeian et al., 1999) and in vivo interictal studies of human epileptogenic regions (Isokawa-Akesson et al., 1989; Colder et al., 1996a,b) found no evidence of abnormal or excessive neuronal burst firing. However, a few studies have reported neuronal responses resembling paroxysmal depolarization shifts (Prince and Wong, 1981; Isokawa and Levesque, 1991; Strowbridge et al., 1992). The inconsistent findings among human studies of epilepsy (Isokawa-Akesson et al., 1989; Colder et al., 1996a,b) may be attributable to the fact that recordings were performed primarily while the patients were awake or in states of drowsiness, potentially masking the abnormal neuronal activity associated with the more epileptogenic brain region. Analyses of discharge properties during polysomnographically defined episodes of waking and sleep contributed to the overall finding in this study that higher firing rates and increased propensity for burst firing are characteristic of human seizure-generating regions. This is particularly important during SWS when epileptiform discharges are activated, and in contrast, during REM sleep when epileptiform activity is restricted to the more epileptogenic region (Montplaisir et al., 1987; Sammaritano et al., 1991).
Neurons within human MTL areas ipsilateral to the site of seizure genesis have been observed to discharge with greater synchrony than neurons contralateral to the site of seizure onset by some (Isokawa-Akesson et al., 1987, 1989) but not by others (Wyler et al., 1982; Colder et al., 1996c). By combining recordings during episodes of Aw and sleep, the present study found significantly greater synchrony of discharges between epileptic MTL neurons compared with non-epileptic MTL neurons. Dissimilarity among the previous studies may be attributable in part to differences in quantification of neuronal synchrony and the time lags within which coincident discharge was considered significant. The increased propensity for burst firing that we observed among epileptic neurons may have contributed to the higher incidence of synchronous discharge. However, Colder and colleagues (1996c) from the same studies cited above found no correlation between neuronal burst propensity and synchrony. On the other hand, evidence using whole-cell recordings from CA1 pyramidal cells suggests that bursts of action potentials may facilitate presynaptic neurotransmitter release and increase the probability of signal transmission between neurons (Stevens and Wang, 1995; Lisman, 1997).
Sleep–waking states and epileptogenicity
Transitions from periods of wakefulness to states of sleep, regulated by cholinergic and aminergic brainstem and basal forebrain systems (Steriade and McCarley, 1990; Szymusiak, 1995), are accompanied by changes in the patterns and synchrony of firing between neurons of the corticothalamic system (Steriade et al., 1993). During episodes of SWS, thalamocortical neurons discharge in a slow, rhythmic burst-firing mode that is transmitted to other thalamic nuclei and modulated by corticothalamic input resulting in widespread synchronization across neuronal assemblies (Steriade et al., 1991; Nunez et al., 1992). This global level of synchronization is characteristically observed in cortical EEG as δ oscillations. In contrast, episodes of REM sleep are accompanied by more tonic modes of neuronal discharge, synchrony becomes more localized within neuronal networks, and cortical EEG appears as low-amplitude fast activity (Destexhe et al., 1999). Consistent with sleep-related changes observed in EEG at the cortical level, in a previous study (Staba et al., 2002) and in the present study, we found that single neurons within the human MTL demonstrated the greatest probability for burst firing during SWS and the lowest probability during REM sleep. In addition, the present study found that synchronous firing between MTL neurons reaches its highest levels during SWS compared with REM sleep and that the strength of synchronous discharge was significantly greater during SWS compared with Aw, whereas REM sleep was intermediate. The SWS-related increase in human MTL burst firing and synchrony of discharges coincides with sleep episodes when the probability for hippocampal sharp waves is the greatest (Buzsaki, 1986; Suzuki and Smith, 1987). The overall increase in neuronal activity that occurs throughout the hippocampal–EC during sharp wave periods has also been implicated in hippocampal–neocortical communication during memory consolidation (Buzsaki, 1998).
Researchers studying the relation of behavioral state to the occurrence of epileptiform activity have generally found that episodes of NREM sleep activate epileptiform discharges, whereas episodes of REM sleep are associated with a suppression of epileptiform activity (Sammaritano et al., 1991; Shouse et al., 1997; Malow et al., 1998; Herman et al., 2001). In agreement with these human EEG studies, during SWS, we found significantly greater synchrony between neurons recorded within epileptic areas compared with neurons within non-epileptic areas, whereas episodes of Aw did not differentiate neuronal synchrony between epileptic neurons and non-epileptic neurons. Although synchrony between non-epileptic neurons declined to its lowest levels during REM sleep compared with both SWS and Aw, synchronous firing between epileptic neurons during REM sleep did not decline relative to Aw and was equivalent to that found during Aw (Fig. 7A). In addition, non-epileptic neuronal firing rate and burst firing showed a precipitous decline during episodes of REM sleep, whereas epileptic neuronal firing rate and burst rates were consistently maintained across all states (Fig. 6A,B). These data provide neuronal evidence supporting the “autonomy” hypothesis that the primary epileptogenic region demonstrates stability of epileptiform activity rates across sleep–wake states, especially during the epileptiform-suppressing state of REM sleep (Rossi et al., 1974; Gentilomo et al., 1975; Lieb et al., 1980).
Because all subjects in the present study were taking anti-epileptic drugs, evaluation of these data must take into consideration the possible influences of anticonvulsant medications on sleep patterns. Although there is evidence that epilepsy and anticonvulsant medication can influence sleep architecture (Gigli and Gotman, 1992; Bazil et al., 2000; Sammaritano and Sherwin, 2000), characterization of neuronal activity was based on stable, 10 min episodes of wakefulness, SWS, and REM sleep that were clearly defined by standard polysomnographic criteria.
Mesial temporal lobe structures and epileptogenicity
Studies investigating the involvement of the entorhinal–hippocampal loop in seizure genesis have found each of these MTL areas capable of initiating and propagating epileptiform activity (Walther et al., 1986; Spencer and Spencer, 1994; Nagao et al., 1996). We found higher firing rates among epileptic Hip and Sub neurons across all states compared with non-epileptic homotopic sites, and higher burst rates among epileptic EC and Hip neuron across all states compared with non-epileptic EC and Hip sites, respectively (Fig.8). However, significant differences in burst firing were found only between epileptic and non-epileptic Hip when we examined the combined effects of recording site and state on epileptogenicity; sleep states differentiated epileptogenic Hip burst firing, whereas episodes of Aw did not. Differences in local circuit interactions within each MTL structure (Traub et al., 1985; Dhillon and Jones, 2000; Harris and Stewart, 2001) and differences in the severity of damage across MTL areas that are associated with chronic epileptic seizures (Mathern et al., 1996) may explain our finding of differences in epileptogenicity between Hip and other MTL areas.
Comparison of discharge properties of neurons in Hip, Sub, and EC revealed several interesting differences. Several authors have reported that neurons within the non-primate subiculum show a propensity for burst firing (Mason, 1993; Behr et al., 1996). Consistent with these non-primate findings, in the present study human Sub neurons had significantly higher firing rates and burst rates compared with Hip neurons, whereas EC was intermediate. In addition, we observed that both Sub and Hip neurons had the greatest propensity for burst firing during SWS compared with Aw and REM sleep, similar to the SWS-related bursts found in neurons of the corticothalamic system (Steriade et al., 1993; Weyand et al., 2001). Conversely, EC neurons demonstrated higher firing rates and burst firing during Aw compared with both sleep states, counter to the observations of Ravagnati et al. (1979) who reported that human EC neurons had the highest firing rates during episodes of REM sleep. The diversity of cell types with different discharge properties that have been described within the EC may account for these discrepancies (Gloveli et al., 1997; Frank et al., 2001).
Conclusion
As observed previously from human EEG studies, the present study shows that MTL single-neuron burst firing and synchrony of discharges remain elevated even during epileptiform-suppressing episodes of REM sleep and provides neuronal evidence that the primary epileptogenic region is relatively more autonomous than non-primary regions. Investigations are needed to determine how well the single-neuron discharge properties that we reported reflect the network activity of the neuronal populations that make up the epileptogenic region, and how the modulating effect of the sleep–wake cycle may enhance epileptogenicity to precipitate ictal events. Animal experiments have shown that single neurons are capable of initiating and synchronizing the activity of the local neuronal population (Miles and Wong, 1983;Cobb et al., 1995). The increased propensity for single-neuron burst firing combined with greater synchronous firing between MTL neurons during SWS and REM sleep may augment signal transmission across neuronal networks in areas of seizure onset and create a lower threshold for initiation and spread of ictal discharges.
Footnotes
This work was supported by National Institutes of Health Grants NS-02808 and NS-33310. We thank Dr. G. Kreiman for assistance with data analysis, Dr. J. Segundo for helpful comments, and T. Fields and E. Behnke for their excellent technical assistance.
Correspondence should be addressed to Dr. Charles L. Wilson, 2155 Reed Neurological Research Center, 710 Westwood Plaza, David Greffen School of Medicine at University of California Los Angeles, Los Angeles, CA 90095. E-mail: clwilson@ucla.edu.
REFERENCES
- 1.Abeles M. Quantification, smoothing, and confidence limits for single-units' histograms. J Neurosci Methods. 1982;5:317–325. doi: 10.1016/0165-0270(82)90002-4. [DOI] [PubMed] [Google Scholar]
- 2.Amaral D, Insausti R. Hippocampal formation. In: Paxinos G, editor. The human nervous system. Academic; San Diego: 1990. pp. 711–755. [Google Scholar]
- 3.Autret A, Lucas B, Hommet C, Corcia P, de Toffol B. Sleep and the epilepsies. J Neurol. 1997;244:S10–S17. doi: 10.1007/BF03160566. [DOI] [PubMed] [Google Scholar]
- 4.Babb TL, Wilson CL, Isokawa-Akesson M. Firing patterns of human limbic neurons during stereoencephalography (SEEG) and clinical temporal lobe seizures. Electroencephalogr Clin Neurophysiol. 1987;66:467–482. doi: 10.1016/0013-4694(87)90093-9. [DOI] [PubMed] [Google Scholar]
- 5.Bazil CW, Castro LH, Walczak TS. Reduction of rapid eye movement sleep by diurnal and nocturnal seizures in temporal lobe epilepsy. Arch Neurol. 2000;57:363–368. doi: 10.1001/archneur.57.3.363. [DOI] [PubMed] [Google Scholar]
- 6.Behr J, Empson RM, Schmitz D, Gloveli T, Heinemann U. Electrophysiological properties of rat subicular neurons in vitro. Neurosci Lett. 1996;220:41–44. doi: 10.1016/s0304-3940(96)13242-0. [DOI] [PubMed] [Google Scholar]
- 7.Bertram EH, Zhang DX, Mangan P, Fountain N, Rempe D. Functional anatomy of limbic epilepsy: a proposal for central synchronization of a diffusely hyperexcitable network. Epilepsy Res. 1998;32:194–205. doi: 10.1016/s0920-1211(98)00051-5. [DOI] [PubMed] [Google Scholar]
- 8.Buzsaki G. Hippocampal sharp waves: their origin and significance. Brain Res. 1986;398:242–252. doi: 10.1016/0006-8993(86)91483-6. [DOI] [PubMed] [Google Scholar]
- 9.Buzsaki G. Memory consolidation during sleep: a neurophysiological perspective. J Sleep Res. 1998;7:17–23. doi: 10.1046/j.1365-2869.7.s1.3.x. [DOI] [PubMed] [Google Scholar]
- 10.Cobb SR, Buhl EH, Halasy K, Paulsen O, Somogyi P. Synchronization of neuronal activity in hippocampus by individual GABAergic interneurons. Nature. 1995;378:75–78. doi: 10.1038/378075a0. [DOI] [PubMed] [Google Scholar]
- 11.Colder BW, Frysinger RC, Wilson CL, Harper RM, Engel J., Jr Decreased neuronal burst discharge near site of seizure onset in epileptic human temporal lobes. Epilepsia. 1996a;37:113–121. doi: 10.1111/j.1528-1157.1996.tb00001.x. [DOI] [PubMed] [Google Scholar]
- 12.Colder BW, Wilson CL, Frysinger RC, Chao LC, Harper RM, Engel J., Jr Neuronal synchrony in relation to burst discharge in epileptic human temporal Lobes. J Neurophysiol. 1996c;75:2496–2508. doi: 10.1152/jn.1996.75.6.2496. [DOI] [PubMed] [Google Scholar]
- 13.Colder BW, Wilson CL, Frysinger RC, Harper RM, Engel J. Interspike intervals during interictal periods in human temporal lobe epilepsy. Brain Res. 1996b;719:96–103. doi: 10.1016/0006-8993(96)00107-2. [DOI] [PubMed] [Google Scholar]
- 14.Destexhe A, Contreras D, Steriade M. Spatiotemporal analysis of local field potentials and unit discharges in cat cerebral cortex during natural wake and sleep states. J Neurosci. 1999;19:4595–4608. doi: 10.1523/JNEUROSCI.19-11-04595.1999. [DOI] [PMC free article] [PubMed] [Google Scholar]
- 15.Dhillon A, Jones RSG. Laminar differences in recurrent excitatory transmission in the rat entorhinal cortex in vitro. Neuroscience. 2000;99:413–422. doi: 10.1016/s0306-4522(00)00225-6. [DOI] [PubMed] [Google Scholar]
- 16.Duvernoy HM. The human hippocampus. Springer; New York: 1998. [Google Scholar]
- 17.Engel J., Jr Intracerebral recordings: organization of the human epileptogenic region. J Clin Neurophysiol. 1993;10:90–98. doi: 10.1097/00004691-199301000-00010. [DOI] [PubMed] [Google Scholar]
- 18.Engel J., Jr Current concepts: surgery for seizures. N Engl J Med. 1996;334:647–652. doi: 10.1056/NEJM199603073341008. [DOI] [PubMed] [Google Scholar]
- 19.Frank LM, Brown EN, Wilson MA. A comparison of the firing properties of putative excitatory and inhibitory neurons from CA1 and the entorhinal cortex. J Neurophysiol. 2001;86:2029–2040. doi: 10.1152/jn.2001.86.4.2029. [DOI] [PubMed] [Google Scholar]
- 20.Fried I, Wilson CL, Maidment NT, Engel J, Jr, Behnke E, Fields TA, MacDonald KA, Morrow JW, Ackerson L. Cerebral microdialysis combined with single-neuron and electroencephalographic recording in neurosurgical patients. J Neurosurg. 1999;91:697–705. doi: 10.3171/jns.1999.91.4.0697. [DOI] [PubMed] [Google Scholar]
- 21.Gentilomo A, Colicchio G, Pola P, Rossi GF, Scerrati M. Brain depth recording of interictal epileptic potentials during sleep in man. In: Levin P, Koella WP, editors. Sleep 1974. Karger; Basel: 1975. pp. 444–446. [Google Scholar]
- 22.Gigli GL, Gotman J. Effects of seizures, kindling, and carbamazepine on sleep organization in cats. Epilepsia. 1992;33:14–22. doi: 10.1111/j.1528-1157.1992.tb02277.x. [DOI] [PubMed] [Google Scholar]
- 23.Gloveli T, Schmitz D, Empson RM, Dugladze T, Heinemann U. Morphological and electrophysiological characterization of layer III cells of the medial entorhinal cortex of the rat. Neuroscience. 1997;77:629–648. doi: 10.1016/s0306-4522(96)00494-0. [DOI] [PubMed] [Google Scholar]
- 24.Harris E, Stewart M. Propagation of synchronous epileptiform events from subiculum backward into area CA1 of rat brain slices. Brain Res. 2001;895:41–49. doi: 10.1016/s0006-8993(01)02023-6. [DOI] [PubMed] [Google Scholar]
- 25.Herman ST, Walczak TS, Bazil CW. Distribution of partial seizures during the sleep-wake cycle. Neurology. 2001;56:1453–1459. doi: 10.1212/wnl.56.11.1453. [DOI] [PubMed] [Google Scholar]
- 26.Isokawa M, Levesque MF. Increased NMDA responses and dendritic degeneration in human epileptic hippocampal neurons in slices. Neurosci Lett. 1991;132:212–216. doi: 10.1016/0304-3940(91)90304-c. [DOI] [PubMed] [Google Scholar]
- 27.Isokawa-Akesson M, Wilson CL, Babb TL. Structurally stable burst and synchronized firing in human amygdala neurons: auto-and-cross-correlation analyses in temporal lobe epilepsy. Epilepsy Res. 1987;1:17–34. doi: 10.1016/0920-1211(87)90047-7. [DOI] [PubMed] [Google Scholar]
- 28.Isokawa-Akesson M, Wilson CL, Babb TL. Inhibition in synchronously firing human hippocampal neurons. Epilepsy Res. 1989;3:236–247. doi: 10.1016/0920-1211(89)90030-2. [DOI] [PubMed] [Google Scholar]
- 29.Jensen MS, Yaari Y. Role of intrinsic burst firing, potassium accumulation, and electrical coupling in the elevated potassium model of hippocampal epilepsy. J Neurophysiol. 1997;77:1224–1233. doi: 10.1152/jn.1997.77.3.1224. [DOI] [PubMed] [Google Scholar]
- 30.Jobst BC, Williamson PD, Neuschwander TB, Darcey TM, Thadani VM, Roberts DW. Secondarily generalized seizures in mesial temporal epilepsy: clinical characteristics, lateralizing signs, and association with sleep-wake cycle. Epilepsia. 2001;42:1279–1287. doi: 10.1046/j.1528-1157.2001.09701.x. [DOI] [PubMed] [Google Scholar]
- 31.Lieb JP, Joseph JP, Engel J, Walker J, Jr, Crandall PH. Sleep state and seizure foci related to depth spike activity in patients with temporal lobe epilepsy. Electroencephalogr Clin Neurophysiol. 1980;49:538–557. doi: 10.1016/0013-4694(80)90396-x. [DOI] [PubMed] [Google Scholar]
- 32.Lisman JE. Bursts as a unit of neural information: making unreliable synapses reliable. Trends Neurosci. 1997;20:38–43. doi: 10.1016/S0166-2236(96)10070-9. [DOI] [PubMed] [Google Scholar]
- 33.Malow BA, Lin X, Kushwaha R, Aldrich MS. Interictal spiking increases with sleep depth in temporal lobe epilepsy. Epilepsia. 1998;39:1309–1316. doi: 10.1111/j.1528-1157.1998.tb01329.x. [DOI] [PubMed] [Google Scholar]
- 34.Mason A. Electrophysiological and burst-firing of rat subicular pyramidal neurons in vitro: a comparison with area CA1. Brain Res. 1993;600:174–178. doi: 10.1016/0006-8993(93)90418-m. [DOI] [PubMed] [Google Scholar]
- 35.Mathern GW, Babb TL, Leite JP, Pretorius JK, Yeoman KM, Kuhlman PA. The pathogenic and progressive features of chronic human hippocampal epilepsy. Epilepsy Res. 1996;26:151–161. doi: 10.1016/s0920-1211(96)00052-6. [DOI] [PubMed] [Google Scholar]
- 36.Matsumoto H, Ajmone-Marsan C. Cortical cellular phenomenon in experimental epilepsy: inter-ictal manifestations. Exp Neurol. 1964;9:286–304. doi: 10.1016/0014-4886(64)90025-1. [DOI] [PubMed] [Google Scholar]
- 37.Mendez M, Radtke RA. Interactions between sleep and epilepsy. J Clin Neurophysiol. 2001;18:106–127. doi: 10.1097/00004691-200103000-00003. [DOI] [PubMed] [Google Scholar]
- 38.Miles R, Wong RKS. Single neurones can initiate synchronized population discharge in the hippocampus. Nature. 1983;306:371–373. doi: 10.1038/306371a0. [DOI] [PubMed] [Google Scholar]
- 39.Montplaisir J, Laverdiere M, Saint-Hilaire JM, Rouleau I. Sleep and focal epilepsy: a study of patients implanted with depth electrodes. In: Wolf P, Dam M, Janz D, Dreifuss FE, editors. Advances in epileptology. Raven; New York: 1987. pp. 705–707. [Google Scholar]
- 40.Moser MB, Moser EI. Functional differentiation in the hippocampus. Hippocampus. 1998;8:608–619. doi: 10.1002/(SICI)1098-1063(1998)8:6<608::AID-HIPO3>3.0.CO;2-7. [DOI] [PubMed] [Google Scholar]
- 41.Nagao T, Alonso A, Avoli M. Epileptiform activity induced by pilocarpine in the rat hippocampal-entorhinal slice preparation. Neuroscience. 1996;72:1996. doi: 10.1016/0306-4522(95)00534-x. [DOI] [PubMed] [Google Scholar]
- 42.Nunez A, Amzica F, Steriade M. Intrinsic and synaptically generated delta (1–4Hz) rhythms in dorsal lateral geniculate neurons and the modulation by light-induced fast (30–70Hz) events. Neuroscience. 1992;51:269–284. doi: 10.1016/0306-4522(92)90314-r. [DOI] [PubMed] [Google Scholar]
- 43.Perez-Velazquez JL, Valiante TA, Carlen PL. Modulation of gap junctional mechanisms during calcium-free induced field burst activity: a possible role for electrotonic coupling in epileptogenesis. J Neurosci. 1994;14:4308–4317. doi: 10.1523/JNEUROSCI.14-07-04308.1994. [DOI] [PMC free article] [PubMed] [Google Scholar]
- 44.Prince DA, Wong RK. Human epileptic neurons studied in vitro. Brain Res. 1981;210:323–333. doi: 10.1016/0006-8993(81)90905-7. [DOI] [PubMed] [Google Scholar]
- 45.Ravagnati L, Halgren E, Babb TL, Crandall PH. Activity of human hippocampal formation and amygdala neurons during sleep. Sleep. 1979;2:161–173. doi: 10.1093/sleep/2.2.161. [DOI] [PubMed] [Google Scholar]
- 46.Rechtschaffen A, Kales A. A manual of standardized terminology, techniques and scoring system for sleep stages of human subjects. Neurological Information Network; Bethesda, MD: 1968. [Google Scholar]
- 47.Rossi GF, Gentilomo A, Colicchio G. Problems in the determination of epileptogenic topography. Schwei Z Arch Neurol Psychiat. 1974;115:229–270. [PubMed] [Google Scholar]
- 48.Rossi GF, Colicchio G, Pola P. Interictal epileptic activity during sleep: a stereo-EEG study in patients with partial epilepsy. Electroencephalogr Clin Neurophysiol. 1984;58:97–106. doi: 10.1016/0013-4694(84)90022-1. [DOI] [PubMed] [Google Scholar]
- 49.Sammaritano M, Sherwin A. Effect of anticonvulsants on sleep. Neurology. 2000;54:S16–S24. [PubMed] [Google Scholar]
- 50.Sammaritano M, Gigli GL, Gotman J. Interictal spiking during wakefulness and sleep and the localization of foci in temporal lobe epilepsy. Neurology. 1991;41:290–297. doi: 10.1212/wnl.41.2_part_1.290. [DOI] [PubMed] [Google Scholar]
- 51.Scharfman HE, Smith KL, Goodman JH, Sollas AL. Survival Of dentate hilar Mossy cells after pilocarpine-induced seizures and their synchronized burst discharges with area CA3 pyramidal cells. Neuroscience. 2001;104:741–759. doi: 10.1016/s0306-4522(01)00132-4. [DOI] [PMC free article] [PubMed] [Google Scholar]
- 52.Schwartzkroin PA, Prince DA. Penicillin-induced epileptiform activity in the hippocampal in vitro preparation. Ann Neurol. 1977;1:463–469. doi: 10.1002/ana.410010510. [DOI] [PubMed] [Google Scholar]
- 53.Schwartzkroin PA, Turner DA, Knowles WD, Wyler AR. Studies of human and monkey “epileptic” neocortex in the in vitro slice preparation. Ann Neurol. 1983;13:249–257. doi: 10.1002/ana.410130305. [DOI] [PubMed] [Google Scholar]
- 54.Shouse MN, Martins da Silva A, Sammaritano M. Sleep. In: Engel J Jr, Pedley TA, editors. Epilepsy: a comprehensive textbook. Lippincott-Raven; Philadelphia: 1997. pp. 1929–1942. [Google Scholar]
- 55.Shouse MN, Farber PR, Staba RJ. Physiological basis: how NREM sleep components can promote and REM sleep components can suppress seizure discharge propagation. Clin Neurophysiol. 2000;111:S9–S18. doi: 10.1016/s1388-2457(00)00397-7. [DOI] [PubMed] [Google Scholar]
- 56.Smith BN, Dudek FE. Short- and long-term changes in CA1 network excitability after kainate treatment in rats. J Physiol (Lond) 2001;85:1–9. doi: 10.1152/jn.2001.85.1.1. [DOI] [PubMed] [Google Scholar]
- 57.Spencer SS, Spencer DD. Entorhinal-hippocampal interaction in medial temporal lobe epilepsy. Epilepsia. 1994;35:721–727. doi: 10.1111/j.1528-1157.1994.tb02502.x. [DOI] [PubMed] [Google Scholar]
- 58.Staba RJ, Wilson CL, Fried I, Engel Jr J (2002) Single neuron burst firing in the human hippocampus during sleep. Hippocampus, in press. [DOI] [PubMed]
- 59.Steriade M, Contreras D. Relation between cortical and thalamic cellular events during transition from sleep patterns to paroxysmal activity. J Neurosci. 1995;15:623–642. doi: 10.1523/JNEUROSCI.15-01-00623.1995. [DOI] [PMC free article] [PubMed] [Google Scholar]
- 60.Steriade M, McCarley RW. Brainstem control of wakefulness and sleep. Plenum; New York: 1990. [Google Scholar]
- 61.Steriade M, Dossi RC, Nunez A. Network modulation of a slow intrinsic oscillation of cat thalamocortical neurons implicated in sleep delta waves: cortically induced synchronization and brainstem cholinergic suppression. J Neurosci. 1991;11:3200–3217. doi: 10.1523/JNEUROSCI.11-10-03200.1991. [DOI] [PMC free article] [PubMed] [Google Scholar]
- 62.Steriade M, McCormick DA, Sejnowski TJ. Thalamocortical oscillations in the sleeping and aroused brain. Science. 1993;262:679–685. doi: 10.1126/science.8235588. [DOI] [PubMed] [Google Scholar]
- 63.Steriade M, Amzica F, Neckelmann D, Timofeev I. Spike-wave complexes and fast components of cortically generated seizures. II. Extra- and intracellular patterns. J Neurophysiol. 1998;80:1456–1479. doi: 10.1152/jn.1998.80.3.1456. [DOI] [PubMed] [Google Scholar]
- 64.Stevens CF, Wang F. Facilitation and depression at single central synapses. Neuron. 1995;14:795–802. doi: 10.1016/0896-6273(95)90223-6. [DOI] [PubMed] [Google Scholar]
- 65.Strowbridge BW, Masukawa LM, Spencer DD, Sheperd GM. Hyperexcitability associated with localizable lesions in epileptic patients. Brain Res. 1992;587:158–163. doi: 10.1016/0006-8993(92)91440-p. [DOI] [PubMed] [Google Scholar]
- 66.Suzuki SS, Smith GK. Spontaneous EEG spikes in the normal hippocampus. I. Behavioral correlates, laminar profiles and bilateral synchrony. Electroencephalogr Clin Neurophysiol. 1987;67:348–359. doi: 10.1016/0013-4694(87)90123-4. [DOI] [PubMed] [Google Scholar]
- 67.Szymusiak R. Magnocellular nuclei of the basal forebrain: substrates of sleep and arousal regulation. Sleep. 1995;18:478–500. doi: 10.1093/sleep/18.6.478. [DOI] [PubMed] [Google Scholar]
- 68.Telfeian AE, Spencer DD, Williamson A. Lack of correlation between neuronal hyperexcitability and electrocorticographic responsiveness in epileptogenic human neocortex. J Neurosurg. 1999;90:939–945. doi: 10.3171/jns.1999.90.5.0939. [DOI] [PubMed] [Google Scholar]
- 69.Traub RD, Wong RK, Miles R, Knowles WD. Neuronal interactions during epileptic events in vitro. Fed Proc. 1985;44:2953–2955. [PubMed] [Google Scholar]
- 70.Walther H, Lambert JD, Jones RS, Heinemann U, Hamon B. Epileptiform activity in combined slices of the hippocampus, subiculum and entorhinal cortex during perfusion with low magnesium medium. Neurosci Lett. 1986;69:156–161. doi: 10.1016/0304-3940(86)90595-1. [DOI] [PubMed] [Google Scholar]
- 71.Weyand T, Boudreaux M, Guido W. Burst and tonic response modes in thalamic neurons during sleep and wakefulness. J Neurophysiol. 2001;85:1107–1118. doi: 10.1152/jn.2001.85.3.1107. [DOI] [PubMed] [Google Scholar]
- 72.Wyler AR, Ward AA., Jr Neurons in human epileptic cortex. Response to direct cortical stimulation. J Neurosurg. 1981;55:904–908. doi: 10.3171/jns.1981.55.6.0904. [DOI] [PubMed] [Google Scholar]
- 73.Wyler AR, Fetz EE, Ward AA., Jr Firing patterns of epileptic and normal neurons in the chronic alumina focus in undrugged monkeys during different behavioral states. Brain Res. 1975;98:1–20. doi: 10.1016/0006-8993(75)90506-5. [DOI] [PubMed] [Google Scholar]
- 74.Wyler AR, Ojemann GA, Ward AA., Jr Neurons in human epileptic cortex: correlation between unit and EEG activity. Ann Neurol. 1982;11:301–308. doi: 10.1002/ana.410110311. [DOI] [PubMed] [Google Scholar]