Abstract
Cholinergic neurotransmission in the basal forebrain changes across the sleep/wake cycle, and considerable data show cortical activation by ACh originating from basal forebrain neurons. These findings have stimulated efforts to elucidate molecular modulators of ACh release within the basal forebrain. Basal forebrain cholinergic neurons contain nitric oxide synthase (NOS), the enzyme that produces the gaseous neuromodulator nitric oxide. This study tested the hypothesis that administration of an NOS inhibitor to the basal forebrain would alter basal forebrain ACh release, sleep, and respiratory rate. Seven cats were instrumented for recording sleep and wakefulness and for in vivo microdialysis and microinjection. Compared with Ringer's solution (control), microdialysis delivery of the NOS inhibitorNG-nitro-l-arginine (NLA; 10 mm) increased ACh release during wakefulness (33%), non-rapid eye movement (NREM) sleep (70%), and rapid eye movement (REM) sleep (16%). Mean ± SEM ACh levels (pmol/10 min) during control and NLA dialysis, respectively, were 0.58 ± 0.03 and 0.77 ± 0.06 in wakefulness, 0.36 ± 0.01 and 0.61 ± 0.06 in NREM sleep, and 0.68 ± 0.06 and 0.79 ± 0.09 in REM sleep. Increases in ACh release were not evoked by dialysis delivery of the less active enantiomerNG-nitro-d-arginine. Dialysis administration of NLA did not alter respiratory rate. Sleep-dependent changes in basal forebrain ACh release were localized specifically to lateral basal forebrain regions and did not occur in medial basal forebrain sites. Microinjection of NLA into the lateral basal forebrain did not significantly alter the sleep/wake cycle. In contrast to NLA-induced depression of REM sleep and ACh release in the cat pons, the present results demonstrate that NLA increased ACh release in the cat basal forebrain and had no effect on sleep. The different effects of NLA on ACh release in the cat pons and cat basal forebrain may prove relevant for developing compounds that differentially alter cholinergic neurotransmission in specific brain regions.
Keywords: basal forebrain, in vivo microdialysis, nitric oxide, NG-nitro-l-arginine, sleep, substantia innominata
Acetylcholine (ACh) release changes significantly as a function of sleep and wakefulness in many brain areas, including the basal forebrain (for review, see Baghdoyan and Lydic, 2002). ACh originating from basal forebrain cholinergic neurons and released in the cortex and the hippocampus participates in cortical arousal, consciousness, and learning and memory (Sarter and Bruno, 2000; Semba, 2000; Szymusiak et al., 2000). Loss of basal forebrain cholinergic neurons results in cognitive deficits characteristic of Alzheimer's disease and may contribute to the memory deficits of normal aging (Mesulam, 1996). ACh release in the substantia innominata (SI) region of the feline basal forebrain is greatest during the rapid eye movement (REM) phase of sleep, intermediate during quiet wakefulness, and lowest during non-REM (NREM) sleep (Vazquez and Baghdoyan, 2001). Within the basal forebrain, the functional significance of sleep-dependent changes in ACh release is unknown.
ACh release in rat basal forebrain is modulated by nitric oxide (Prast and Philippu, 2001). Nitric oxide is synthesized by nitric oxide synthase (NOS), which occurs in several isoforms. The neuronal isoform is activated by Ca2+/calmodulin and catalyzes the reaction of l-arginine and oxygen to producel-citrulline and nitric oxide (for review, see Leonard and Lydic, 1999; Law et al., 2001). Several studies have shown that systemic or intracerebroventricular administration of NOS inhibitors alters control of the sleep cycle (Dzoljic and de Vries, 1994; Kapas et al., 1994a,b; Dzoljic et al., 1996; Burlet et al., 1999). However, few studies have localized the effects of NOS inhibitors on sleep and ACh release to specific brain regions (Leonard and Lydic, 1995, 1997).
Data from both rats and cats show that basal forebrain cholinergic neurons containing NOS are found in the lateral and medial septal nuclei, the horizontal and vertical divisions of the diagonal band of Broca, the anterior hypothalamic area (HAA), and the substantia innominata (Mizukawa et al., 1989; Pasqualotto and Vincent, 1991;Kitchener and Diamond, 1993; Bickford et al., 1994; Sugaya and McKinney, 1994). The presence of NOS in cholinergic basal forebrain neurons and previous data showing that an NOS inhibitor decreased basal forebrain ACh release in rats (Prast and Philippu, 1992) suggested that nitric oxide may play a role in regulating ACh release within the feline basal forebrain. No previous data have described how administration of an NOS inhibitor to the cat basal forebrain affects sleep or basal forebrain ACh release. Therefore, the present study using intact, unanesthetized cats examined the hypothesis that administration of an NOS inhibitor to the basal forebrain would alter basal forebrain ACh release and sleep. Because dialysis delivery of an NOS inhibitor to the pons significantly altered the rate of breathing (Leonard and Lydic, 1997) and because basal forebrain has been shown to modulate respiratory rate (Bringmann and Klingberg, 1989), the present experiments also quantified the rate of breathing during dialysis delivery of an NOS inhibitor to the basal forebrain. Finally, the basal forebrain is composed of neurochemically distinct regions with different afferent (Sarter and Bruno, 2000) and efferent (Semba, 2000) regulation. Thus microdialysis was used to test the hypothesis that ACh release varies as a function of medial versus lateral basal forebrain region. Portions of these data have been presented previously in abstract form (Vazquez et al., 2001).
MATERIALS AND METHODS
Animal model and electrographic recordings of sleep, wakefulness, and respiratory rate. All experiments followed theGuide for the Care and Use of Laboratory Animals (1996). Seven adult, male cats were anesthetized with isoflurane (2–3% in O2) and implanted with electrodes for polysomnographic monitoring of sleep and wakefulness (Ursin and Sterman, 1981). A plastic head-cap was built to contain the recording electrodes and to permit access to the basal forebrain through the cranium. Cats were trained to sleep in a veterinary examination bag while in a head-stable position.
Electrographic recordings of the cortical electroencephalogram, eye movements, muscle tone, and ponto-geniculo-occipital (PGO) waves were made using a Grass Model 7 polygraph (Grass Instruments, West Warwick, RI). These variables were used to objectively define states of sleep and wakefulness according to standard criteria (Ursin and Sterman, 1981). Briefly, wakefulness was scored when the animals demonstrated a low-voltage, high-frequency cortical EEG; the eyes were open and the electrooculogram (EOG) showed frequent eye movements; and the amplitude of the nuchal electromyogram (EMG) indicated the presence of muscle tone and reflected posture shifts. NREM sleep was scored when there was a high-voltage, low-frequency EEG with spindles or slow waves; the eyes were closed and the EOG revealed infrequent, slow eye movements; and the EMG showed a lower amplitude than during wakefulness. REM sleep was identified by the presence of a low-voltage, high-frequency EEG similar to the EEG of wakefulness; closed eyes and rapid eye movements in the EOG; skeletal muscle atonia in the EMG; and PGO waves in the lateral geniculate bodies of the thalamus. Wakefulness, NREM sleep, and REM sleep were scored for each minute of an experiment. Respiratory rate (breaths per minute) was recorded using a thermistor placed at the nares.
Basal forebrain microdialysis. In vivomicrodialysis procedures using intact, unanesthetized cats have been described in detail previously (Leonard and Lydic, 1997; Vazquez and Baghdoyan, 2001). The microdialysis probe membranes were polycarbonate with a 20 kDa pore size, 0.5 mm diameter, and 2 mm length (CMA Microdialysis, North Chelmsford, MA). Before beginning each experiment, a probe was perfused continuously with Ringer's solution (147 mm NaCl, 2.4 mmCaCl2, 4.0 mm KCl, and 10 μm neostigmine, pH 5.8) using a CMA/100 pump (3 μl/min; CMA Microdialysis). When the animal was in a state of quiet wakefulness, the microdialysis probe was aimed stereotaxically for the basal forebrain. Stereotaxic coordinates for dialysis aim sites were divided into two groups. One group of aim sites ranged from lateral (L) 3.0 to L5.5 mm from the midline, anterior (A) 16.0 to A14.5, and horizontal (H) −2.0 (Berman and Jones, 1982). This area subsequently is referred to as the lateral basal forebrain region and includes the SI and the diagonal band of Broca, horizontal division (DBH). A second group of basal forebrain aim sites for dialysis ranged from L1.0 to L2.5, A16.0 to A14.5, and H−2.0 (Berman and Jones, 1982). This area subsequently is referred to as the medial basal forebrain region and includes the HAA and diagonal band of Broca, vertical division (DBV). These lateral and medial dialysis aim sites include basal forebrain regions known to contain choline acetyltransferase immunoreactive neurons (Kimura et al., 1981; Steriade et al., 1987;Vincent and Reiner, 1987; Parent et al., 1988; Gritti et al., 1998). The minimal distance between each dialysis aim site in the same animal was 1 mm. Only one experiment was performed at each aim site to avoid the possibility of alterations in ACh levels caused by repeated microdialysis sampling from the same site (Moore et al., 1995). Microdialysis experiments in the same cat were separated by at least 1 week.
After insertion of the dialysis probe, ACh was quantified in several serially collected dialysis samples (10 min/sample) to ensure stable levels of release. Control dialysis samples (30 μl) then were collected during polygraphically and behaviorally defined states of wakefulness, NREM sleep, and REM sleep while the probe was perfused with Ringer's solution. After 2–3 hr of sampling, a liquid switch was used to perfuse the dialysis probe with Ringer's solution containing either the NOS inhibitorNG-nitro-l-arginine (NLA) (10 mm; Research Biochemicals, Natick, MA) or the less active enantiomerNG-nitro-d-arginine (NDA) (Wang et al., 1993) (10 mm; Research Biochemicals). The change from control dialysis to dialysis with NLA or NDA was always made when animals were awake. Dialysis samples (30 μl/10 min) were collected across the sleep/wake cycle during drug administration. All dialysis samples were obtained during intervals comprised entirely of a single state. The order of experiments delivering NLA or NDA by dialysis was randomized.
HPLC with electrochemical detection.Dialysis samples were analyzed for ACh immediately after collection using a standard HPLC with electrochemical detection (EC) system (Bioanalytical Systems, West Lafayette, IN) (Baghdoyan et al., 1998; Vazquez and Baghdoyan, 2001). Samples were carried in a 50 mmNa2HPO4 mobile phase solution, pH 8.5, to an analytical column at a flow rate of 1.0 ml/min. The analytical column separated ACh, which then passed through an immobilized enzyme reactor column that produced hydrogen peroxide in amounts proportional to the amount of ACh in the sample. Hydrogen peroxide was measured at a 0.5 V applied potential on a platinum electrode referenced to an Ag+/AgCl electrode. Chromatograms were digitized and stored using ChromGraph software (Bioanalytical Systems). The area under the chromatographic peak for each dialysis sample was compared with peak areas generated from known ACh amounts to determine the picomole amount of ACh in each sample. ACh values are expressed as picomoles/10 min of dialysis.
Basal forebrain microinjections. An additional set of experiments characterized the effect of basal forebrain NLA microinjections on sleep-cycle control. The rationale for the microinjection studies was to deliver a known amount of NLA in a single bolus. A limitation of drug delivery by microdialysis is that the amount of drug administered cannot be specified. As described previously (Baghdoyan et al., 1993), microinjections into the lateral basal forebrain region were made using a 31 gauge stainless-steel injector. Polyethylene 20 gauge tubing connected the injector to a 1 μl Hamilton syringe (Thomas Scientific, Swedesboro, NJ). Saline (0.9%, 0.25 μl, pH 5.8) or NLA dissolved in saline (10 mm, 0.55 μg/0.25 μl, pH 5.8) was microinjected over a 30 sec period using a manual microdrive. Microinjections into the same site in the same animal were separated by a minimum of 3 d. The order of administration of NLA and saline was randomized. Microinjections were always made when the animal was in a state of quiet wakefulness, and states of sleep and wakefulness were recorded and quantified for 2 hr after the injection. Dependent measures included the amount of time spent in wakefulness, NREM sleep, and REM sleep; latency to onset of the first NREM sleep and REM sleep episodes; frequency of wakefulness, NREM sleep, and REM sleep epochs; duration of wakefulness, NREM sleep, and REM sleep epochs; and the number of state transitions (a measure of sleep fragmentation).
Histological analyses. After the final experiment, cats were deeply anesthetized with pentobarbital (35–40 mg/kg, i.v.) and perfused transcardially with saline followed by formalin (10%). The brains were removed and soak fixed in 10% formalin for 2–3 weeks. Forebrain blocks then were placed in 30% sucrose formalin for 7 d and serial, coronal sections were cut on a freezing microtome. Every other section (40 μm thick) was stained with cresyl violet and float-mounted onto gelatin-coated glass slides. Alternate sections were processed for glial fibrillary acidic protein (GFAP) (Benevento and McCleary, 1992; Miasnikov et al., 1999) before being mounted on slides. All brain sections were defatted and coverslipped. Glial tracts caused by microdialysis probes or microinjection cannulas were localized by comparing the stained tissue sections with a cat forebrain atlas (Berman and Jones, 1982). This technique permitted assignment of stereotaxic coordinates to each microdialysis and microinjection site and made it possible to distinguish dialysis experiments performed in lateral and medial basal forebrain regions. Stereotaxic coordinates were assigned to the deepest part of each lesion.
Statistical analysis. Results are reported as means ± SEM. p < 0.05 was considered statistically significant. ANOVA, the Tukey–Kramer multiple-comparison test, and the Student's t test were used to evaluate significant effects of drugs on sleep, ACh release, and respiratory rate.
RESULTS
Lateral basal forebrain acetylcholine release was increased by dialysis delivery ofNG-nitro-l-arginine
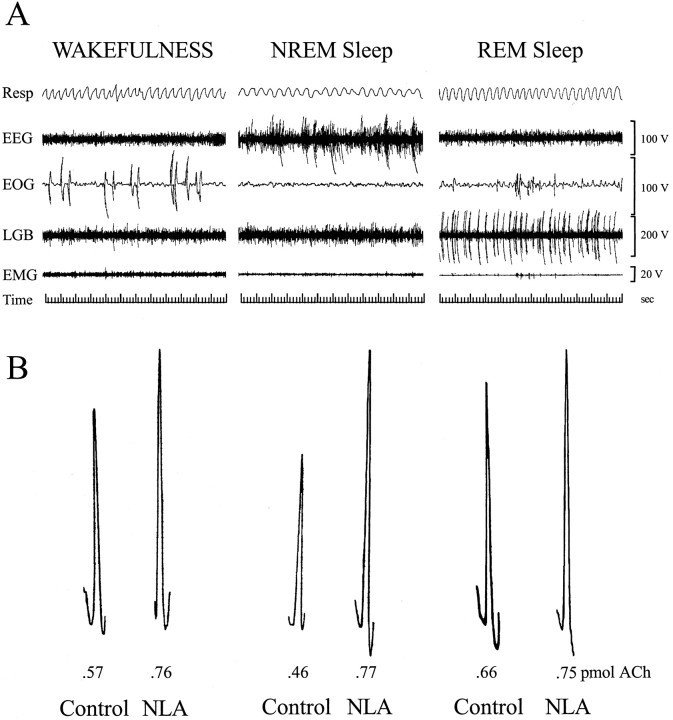
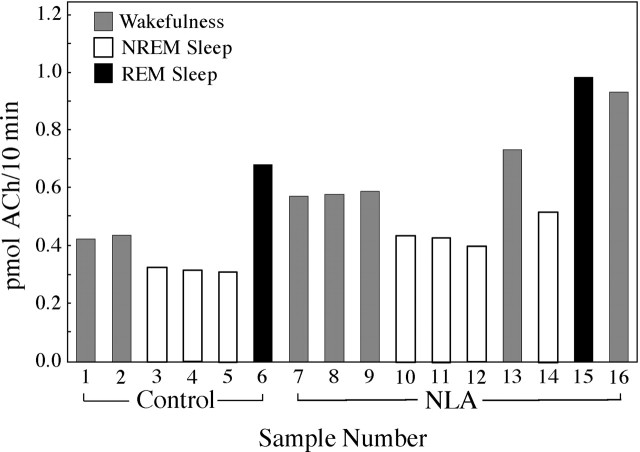
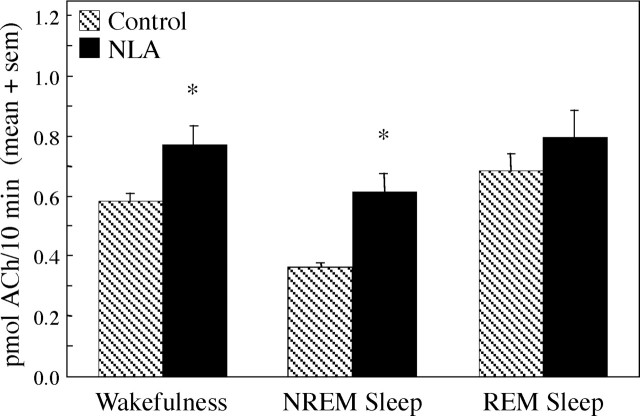
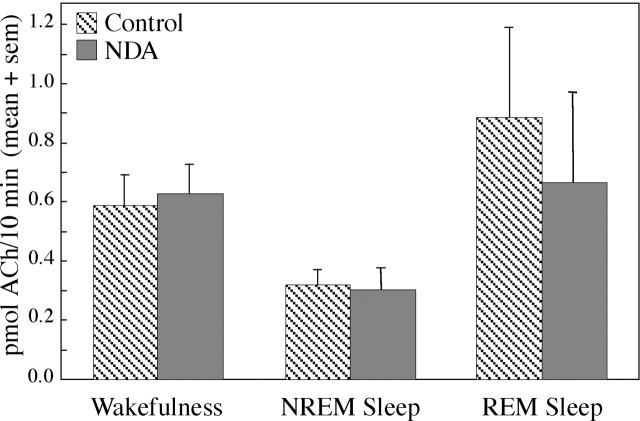
Basal forebrain ACh release was measured during behaviorally and electrographically defined sleep/wake states (Fig.1A). Representative chromatograms (Fig. 1B) show examples of the raw data used to quantify ACh release during Ringer's solution (control) dialysis and during dialysis with Ringer's solution containing the NOS inhibitor NLA. The time course of ACh release during a typical experiment is illustrated in Figure 2. This study used an intensive, within-subjects design, and the number of dialysis samples collected during each behavioral state varied from experiment to experiment. One to five dialysis samples typically were collected during each state (wakefulness, NREM sleep, and REM sleep) to yield control levels of ACh release. A liquid switch was then activated to begin dialysis delivery of NLA or NDA. The experimental goal was to obtain an additional one to five ACh measures during each sleep/wake state. Figure 3 summarizes ACh measures obtained during 3780 min of dialysis. Dialysis delivery of NLA into the lateral basal forebrain region increased ACh release over control levels by 33% during wakefulness, 70% during NREM sleep, and 16% during REM sleep. Figure 4 plots basal forebrain ACh during dialysis delivery of NDA, the less active NOS inhibitor. NDA did not significantly change ACh, indicating that the NLA-induced increase in ACh release (Fig. 3) was stereospecific.
Fig. 1.
A, Polygraph recordings used to identify and quantify states of sleep and wakefulness. Eachpanel shows a 60 sec recording obtained from the same cat. B, ACh chromatograph peaks obtained using microdialysis and HPLC/EC. Representative ACh samples collected during Ringer's solution dialysis (Control) and during dialysis with Ringer's solution containing NLA are shown for wakefulness (left), NREM sleep (middle), and REM sleep (right). Note the increase in peak height, indicating an increase in amount of ACh (in picomoles) caused by dialysis administration of NLA. Resp, Respiration;LGB, lateral geniculate body.
Fig. 2.
ACh release in the lateral basal forebrain region during one experiment. Each histogram represents the amount of ACh in one 10 min dialysis sample. Six samples (sample numbers 1–6) were collected during dialysis with Ringer's solution to obtain control levels of ACh release during wakefulness (1, 2), NREM sleep (3–5), and REM sleep (6). The dialysis probe then was perfused with Ringer's solution containing NLA and 10 dialysis samples (7–16) were collected during wakefulness (7–9, 13, 16), NREM sleep (10–12, 14), and REM sleep (15).
Fig. 3.
Dialysis delivery of NLA to the lateral basal forebrain region significantly increased ACh release. ACh release is plotted as a function of arousal state and drug administration. Data were obtained from 18 experiments using five cats. Two-way ANOVA revealed significant (p < 0.0001) drug and state main effects on ACh release and no significant drug-by-state interaction. The Tukey–Kramer test showed that NLA significantly (*p < 0.05) increased ACh over control levels during wakefulness (n = 73 control dialysis samples and 73 NLA samples) and NREM sleep (n = 109 control and 80 NLA samples). During REM sleep (n = 18 control and 25 NLA samples), the NLA-induced increase in ACh release did not reach statistical significance. Portions of the control microdialysis data have been reported previously (Vazquez and Baghdoyan, 2001).
Fig. 4.
Dialysis delivery of NDA to the lateral basal forebrain region had no effect on ACh release. ACh release is plotted as a function of arousal state and drug administration. Data were obtained from 930 min of dialysis during five experiments in four cats. Two-way ANOVA showed no significant drug main effect on ACh release, a significant (p = 0.0145) state main effect, and no significant drug-by-state interaction. ACh release was quantified during wakefulness (n = 19 control dialysis samples and 19 NDA samples), NREM sleep (n= 26 control and 17 NDA samples), and REM sleep (n= 7 control and 6 NDA samples).
Dialysis delivery ofNG-nitro-l-arginine did not alter respiratory rate
For 12 microdialysis experiments in three animals, the respiratory rate (breaths per minute) was quantified during control and NLA dialysis. Two-way ANOVA showed a significant (p< 0.0001) state main effect on respiratory rate, no drug main effect, and no state-by-drug interaction. During dialysis with Ringer's solution alone, respiratory rate (mean ± SEM) was 46.1 ± 1.5 during wakefulness, 22.2 ± 0.6 during NREM sleep, and 34.3 ± 1.8 during REM sleep. During dialysis administration of NLA, the respiratory rate was 48.6 ± 1.7 during wakefulness, 23.1 ± 0.8 during NREM sleep, and 32.3 ± 1.5 during REM sleep.
Acetylcholine release varied as a function of basal forebrain laterality
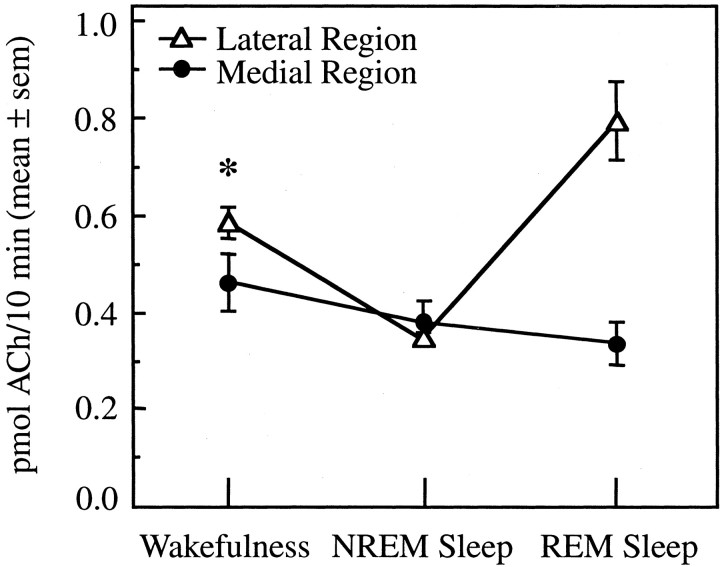
All results described above were obtained from microdialysis experiments localized to lateral regions of the basal forebrain. Additional experiments were designed to place microdialysis probes in medial regions of the basal forebrain for measurement of ACh release across the sleep/wake cycle. Figure 5illustrates how GFAP immunohistochemistry facilitated localization of microdialysis sites within lateral and medial basal forebrain regions. Figure 6 summarizes the stereotaxic coordinates for all basal forebrain microdialysis sites. Histological analysis showed that all lateral region microdialysis sites were localized to the SI and DBH and that all medial region microdialysis sites were localized to the HAA and DBV. Stereotaxic coordinates for microdialysis sites in the lateral basal forebrain region (Fig. 6,gray cylinders) ranged from L3.5 to L6.5, A14.0 to A16.5, and H−2.0. Mean ± SEM stereotaxic coordinates for lateral region dialysis sites were as follows: L4.9 ± 0.1; A15.1 ± 0.1; and H−2.0. Microdialysis sites in the medial basal forebrain region (Fig. 6, white cylinders) ranged from L0.5 to L2.0, A14.5 to L16.0, and H−2.0, with a mean ± SEM of L1.6 ± 0.2; A15.3 ± 0.2; and H−2.0. Thus, the anterior and horizontal coordinates of the dialysis sites were held constant between the lateral and medial basal forebrain regions. Figure7 plots ACh release as a function of basal forebrain dialysis region (lateral, medial) and arousal state (wakefulness, NREM sleep, REM sleep). ACh release in the medial basal forebrain region (Fig. 7, solid circles) did not change significantly as a function of the sleep/wake state. This is in contrast to ACh release in the lateral basal forebrain region (Fig. 7,open triangles), which was significantly decreased during NREM sleep and significantly increased during REM sleep relative to wakefulness. Within-state comparisons revealed that ACh release was significantly greater in the lateral than in the medial basal forebrain region during wakefulness (Fig. 7, asterisk). ACh release was not different between lateral and medial regions during NREM sleep. The small number of dialysis samples (n = 4) obtained from the medial region during REM sleep did not permit a statistical comparison with the lateral region.
Fig. 5.
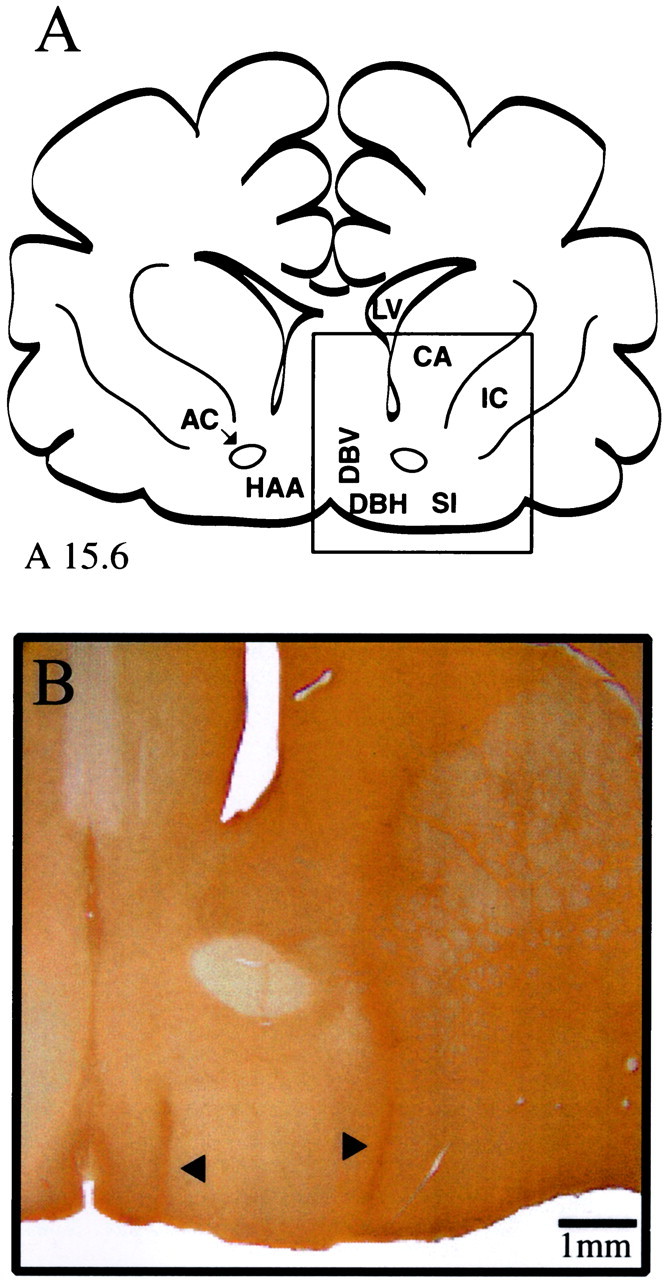
Histological localization of basal forebrain microdialysis sites. A, Line drawing of a cat forebrain adapted from coronal atlas plate A15.6 of Berman and Jones (1982). (Theboxed area is enlarged in B.)B, Coronal section processed for GFAP shows a lesion from one representative dialysis site in the lateral basal forebrain region (right arrowhead) and one representative dialysis site in the medial basal forebrain region (left arrowhead). The lateral dialysis site is located in the SI ∼4 mm from the midline. The medial dialysis site is localized within the DBV ∼1 mm from the midline. AC, Anterior commissure;CA, caudate; IC, internal capsule;LV, lateral ventricle.
Fig. 6.
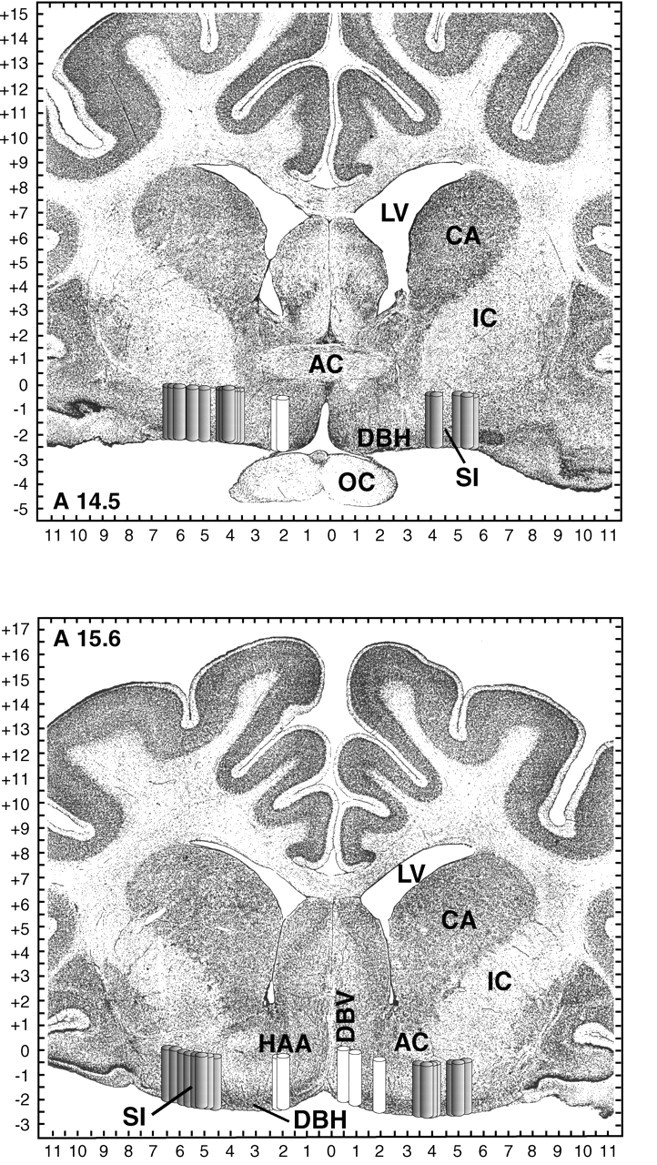
Schematic localization of basal forebrain dialysis sites. Dialysis sites are represented as 2-mm-long, 0.5-mm-widecylinders to indicate the length and diameter of the dialysis probe membrane. Gray cylinders localize 31 lateral basal forebrain dialysis sites in six cats; white cylinders localize seven medial basal forebrain dialysis sites in four cats. Cylinders are shown on coronal atlas plates at 14.5 and 15.6 mm anterior to stereotaxic zero [modified fromBerman and Jones (1982)]. Tick marks on axes indicate 0.5 mm increments. AC, Anterior commissure;CA, caudate; IC, internal capsule;LV, lateral ventricle; OC, optic chiasm.
Fig. 7.
State-dependent changes in ACh release are localized to lateral regions of the basal forebrain. ACh release is plotted as a function of the sleep/wake state for lateral and medial basal forebrain regions. There was no significant effect of arousal state on ACh release in medial basal forebrain regions. One-way ANOVA showed that ACh release in lateral sites was state-dependent (p < 0.0001). Lateral site data are based on 3530 min of dialysis, including 133 dialysis samples collected during wakefulness, 187 NREM sleep samples, and 33 REM sleep samples obtained from 31 experiments in six cats. Medial site data are based on 940 min of dialysis, including 37 dialysis samples collected during wakefulness, 53 NREM sleep samples, and four REM sleep samples obtained from seven experiments in four cats. The asteriskindicates a significant difference in ACh release between the lateral and medial basal forebrain regions.
Microinjection ofNG-nitro-l-arginine into the lateral basal forebrain region did not alter sleep
The findings that sleep-dependent changes in basal forebrain ACh release were localized to the lateral basal forebrain region (Fig. 7) and that NLA increased ACh release in this lateral region (Fig. 3) imply a functional role for nitric oxide and ACh within the lateral basal forebrain. Published data show that pontine administration of NLA decreased both ACh release and REM sleep (Leonard and Lydic, 1997). Therefore, this study also examined the hypothesis that microinjection of NLA into the lateral basal forebrain would significantly alter the sleep/wake cycle. Three cats each received three microinjections of saline and three microinjections of NLA. The results showed that the amounts of sleep and wakefulness after saline (control) injections were within normal ranges (Baghdoyan et al., 1993) and that microinjection of NLA had no significant effect on any dependent measure of sleep or wakefulness. Histological analysis (Fig.8) revealed that NLA microinjection sites were localized to the same lateral basal forebrain region in which dialysis delivery of NLA significantly increased ACh release. Stereotaxic coordinates of the microinjection sites ranged from L4.5 to L5.0, A14.5 to A15.0, and H−2.0, with a mean ± SEM of L4.8 ± 0.2; A14.7 ± 0.2; and H−2.0.
Fig. 8.
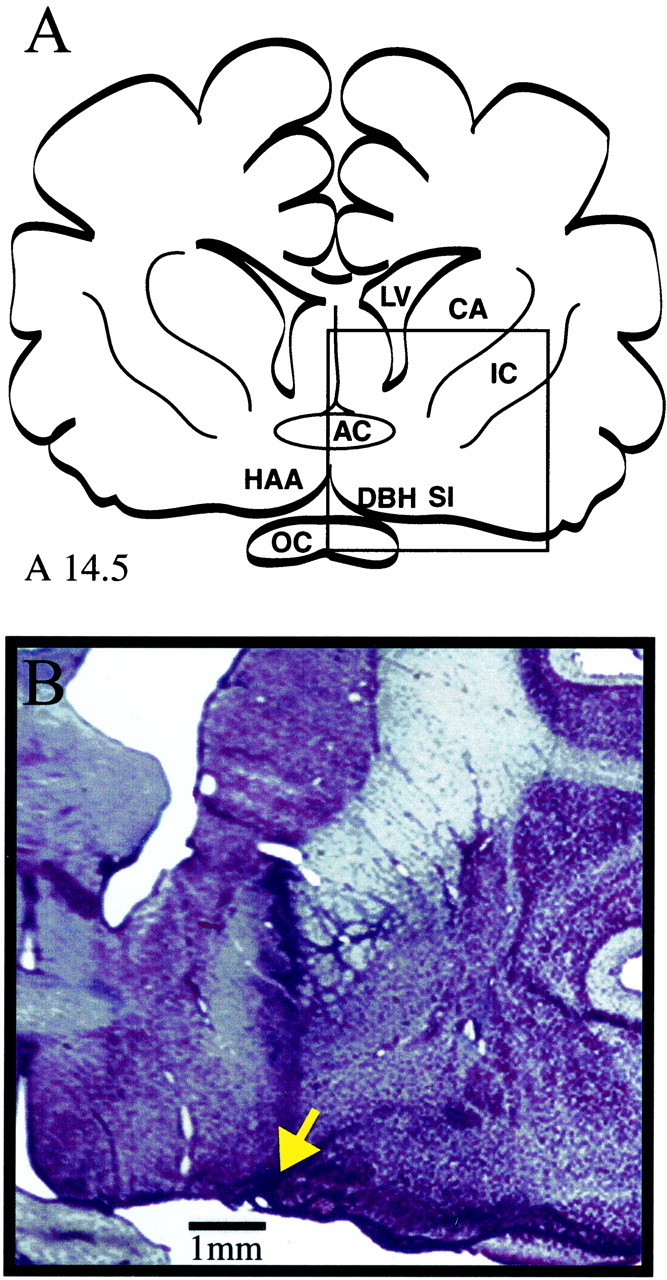
Histological localization of basal forebrain microinjection sites. A, Cat forebrain, adapted from coronal atlas plate A14.5 of Berman and Jones (1982). (The boxed area is enlarged in B.) B, Coronal section stained with cresyl violet shows a representative microinjection-induced lesion (arrow) in the lateral basal forebrain region. The microinjection site is located in the SI ∼4 mm from the midline. Comparison with Figure 6 confirms that NLA was microinjected into the same lateral basal forebrain region where NLA was administered by microdialysis. AC, Anterior commissure; CA, caudate; IC, internal capsule; LV, lateral ventricle; OC, optic chiasm.
DISCUSSION
The nitric oxide synthase inhibitorNG-nitro-l-arginine increased acetylcholine release in the lateral basal forebrain region
Only one previous study has quantified ACh release across the sleep/wake cycle within the feline basal forebrain. ACh release in the substantia innominata region of the cat basal forebrain was greatest during REM sleep, intermediate during wakefulness, and lowest during NREM sleep (Vazquez and Baghdoyan, 2001). Those data, and evidence that pontine ACh release was significantly decreased by dialysis administration of NLA to cat pons (Leonard and Lydic, 1997), encouraged the present investigation. In contrast to decreasing pontine ACh release, dialysis delivery of NLA increased ACh release in the lateral basal forebrain region (Figs. 1-3). The mechanisms underlying the opposite effects of NLA on ACh release in the cat pons and basal forebrain are unknown. Nitric oxide is thought to facilitate transmitter release (Garthwaite and Boulton, 1995; Zhang and Snyder, 1995); thus, a decrease in nitric oxide levels attributable to inhibition of the synthetic enzyme NOS would be expected to cause a decrease in transmitter release, as was observed in the pons. One speculation is that in the basal forebrain the NLA-induced decrease in nitric oxide caused a decrease in the release of GABA, thereby reducing GABAergic inhibition of basal forebrain cholinergic neurons. NOS has been localized to some GABAergic neurons (Valt-schanoff et al., 1993; Meng et al., 1996), GABAergic neurons outnumber cholinergic neurons by ∼2:1 within the feline basal forebrain (Gritti et al., 1993), and GABA inhibits basal forebrain cholinergic neurons (Khateb et al., 1998). Nitric oxide also has been shown to modulate ACh release via NMDA receptor mechanisms (Ikarashi et al., 1998). The question of whether NLA increased basal forebrain ACh release by a direct action on cholinergic neurons or by an indirect action remains to be addressed.
The NLA-induced increase in basal forebrain ACh release also was surprising in light of previous data showing that administration of NLA to the basal forebrain of conscious rats decreased basal forebrain ACh release (Prast and Philippu, 1992). Differences in species (rat vs cat), drug delivery technique (push/pull perfusion vs microdialysis), and drug concentration (0.1 vs 10 mm) preclude direct comparisons between the previous study, which used rats (Prast and Philippu, 1992), and the present study using cats. In addition, the basal forebrain region examined in rats (Prast and Philippu, 1992) was not homologous to the lateral basal forebrain region tested in the present study. These differences encourage a future study specifically designed to determine the extent to which the direction of the NLA-induced change in ACh release is a function of species, drug concentration, and site of drug delivery within the basal forebrain.
NLA increased basal forebrain ACh release during all arousal states, and this increase achieved statistical significance only during wakefulness and NREM sleep (Fig. 3). The reason NLA did not significantly enhance ACh release during REM sleep is not clear. Basal forebrain ACh release reaches maximal levels during REM sleep (Fig. 3) (Vazquez and Baghdoyan, 2001), perhaps making it difficult for NLA to cause an additional increase in ACh release.
Basal forebrain dialysis delivery of NDA, the less actived-enantiomer of NLA, did not significantly alter basal forebrain ACh release (Fig. 4). The finding that NLA stereoselectively increased basal forebrain ACh release (Figs. 3, 4) is consistent with the interpretation that NLA inhibited NOS and decreased production of nitric oxide (Fukuto and Chaudhuri, 1995). NLA-induced inhibition of ACh release in the pontine reticular formation also was stereoselective (Leonard and Lydic, 1997). Pontine ACh release is regulated by laterodorsal and pedunculopontine tegmental (LDT/PPT) neurons. Electrical stimulation of LDT/PPT causes a monotonic increase in pontine ACh release (Lydic and Baghdoyan, 1993), and electrical stimulation of LDT in a brain-slice preparation significantly enhances LDT levels of nitric oxide (Leonard et al., 2001). Thus, independent evidence from in vivo and in vitro studies demonstrates parallel changes in levels of nitric oxide and pontine ACh release.
NG-nitro-l-arginine administered to the lateral basal forebrain region did not alter sleep or respiratory rate
Microinjection of 10 mm NLA into the lateral basal forebrain had no effect on sleep. Previous studies have shown that microinjection of cholinergic agonists into the lateral basal forebrain increases wakefulness in cats (Baghdoyan et al., 1993) and normal dogs (Nishino et al., 1995) and triggers cataplexy in narcoleptic dogs (Nishino et al., 1995). The finding that basal forebrain microinjection of NLA did not alter sleep may mean that naturally occurring, sleep-dependent changes in basal forebrain ACh release (Vazquez and Baghdoyan, 2001) do not regulate sleep. This interpretation is consistent with the finding that the sleep/wake state does not determine the discharge rate of putatively cholinergic neurons in the lateral basal forebrain (Szymusiak et al., 2000). Another possible interpretation is that NLA may have altered the release of other basal forebrain transmitters that have effects on sleep opposite to those of ACh. The lack of an effect of basal forebrain NLA on sleep differs from findings in the pontine reticular formation, in which microinjection of NLA significantly decreased REM sleep (Leonard and Lydic, 1997). This comparison emphasizes the importance of taking the brain region into account when evaluating the effects of NLA on sleep.
The concentration of NLA that decreased REM sleep when microinjected into the pontine reticular formation was 22.8 mm (Leonard and Lydic, 1997). The present study systematically quantified the effects on sleep of microinjecting 10 mm NLA into the basal forebrain; it is possible that a higher NLA concentration microinjected into the basal forebrain may have altered sleep. However, this possibility is unlikely, based on the fact that in two cats basal forebrain microinjection of 20 mm NLA did not alter any dependent measure of sleep or wakefulness.
Respiratory rate was quantified after basal forebrain dialysis administration of NLA, because forebrain structures receiving basal forebrain cholinergic input contribute to respiratory control (King et al., 1999). Central motor command to respiratory muscles produces a perception of respiratory effort that is processed by multiple forebrain regions. The sensation of breathlessness (dyspnea) is a clinically significant problem (Manning and Schwartzstein, 1995), and the corollary discharge hypothesis postulates that projections from medullary respiratory neurons to the forebrain account for sensations of breathlessness (Spengler et al., 1998). Respiratory rate also is modulated by the parabrachial nuclei (for review, see Gilbert and Lydic, 1994), and basal forebrain and parabrachial nuclei share reciprocal neuroanatomical projections (Wild et al., 1990). These projections likely mediate changes in the respiratory rate caused by electrically stimulating the basal forebrain and parabrachial cuneiform nucleus (Bringmann and Klingberg, 1989).
Although the basal forebrain contributes to respiratory control (Harper et al., 1996), and cuneiform neurons may be an important source of nitric oxide (Pose et al., 2000), the rate of breathing in the present study was not altered by dialysis delivery of 10 mm NLA to the basal forebrain. The lack of a respiratory response to basal forebrain NLA is in contrast to the finding that microinjection of 22.8 mm NLA into the medial pontine reticular formation blocked the cholinergically induced respiratory rate depression (Leonard and Lydic, 1997). These different respiratory effects of NLA may be a function of dose (10 vs 22.8 mm), method of NLA delivery (microdialysis vs microinjection), or brain region (basal forebrain vs pontine reticular formation). Whether basal forebrain NLA administration can diminish or block decreases in the rate of breathing caused by pontine cholinomimetics is open to investigation.
State-dependent changes in acetylcholine release are region-specific within the basal forebrain
An additional new finding to emerge from this study is that ACh release in the medial basal forebrain region did not change significantly as a function of the sleep/wake state (Figs. 5-7). Thus, sleep-dependent changes in ACh release are localized to the lateral basal forebrain region (SI, DBH). This lateral-to-medial difference in state-dependent ACh release profiles cannot be explained on the basis of a differential distribution of cholinergic neurons. The medial basal forebrain region (HAA, DBV) also contains choline acetyltransferase-positive (i.e., cholinergic) neurons (Kimura et al., 1981; Steriade et al., 1987; Vincent and Reiner, 1987; Parent et al., 1988; Gritti et al., 1998). Because of the lack of sleep-dependent changes in ACh release within the medial basal forebrain region, this study did not examine the effects on ACh release of NLA administered to the medial basal forebrain region.
The few dialysis samples obtained from the medial basal forebrain region during REM sleep must be acknowledged as a limitation. Several factors account for this low number of REM sleep samples. First, the relatively small size of the medial region permitted only one dialysis experiment per hemisphere per cat. Second, the HPLC/EC system used to quantify ACh requires a dialysis sample volume of 30 μl. At a dialysis flow rate of 3 μl/min, 10 min of REM sleep are necessary to obtain one dialysis sample. When a cat spends <10 min in REM sleep during an experiment, it is not possible to obtain ACh measures during REM sleep. Third, REM sleep occupies only ∼15% of total recording time in cats (Ursin and Sterman, 1981). Thus, Figure 7presents only descriptive data for ACh release in the medial basal forebrain region during REM sleep.
Conclusions
The data reported here characterize, for the first time, the effects of basal forebrain NLA administration on basal forebrain ACh release, states of sleep and wakefulness, and rate of breathing. Dialysis delivery of NLA significantly increased ACh release in the lateral basal forebrain during sleep and wakefulness. This novel finding suggests that nitric oxide modulates basal forebrain ACh release. These data emphasize the importance of taking into account the site of drug action within the brain, because dialysis delivery of the same NLA concentration to the pontine reticular formation significantly decreased pontine ACh release (Leonard and Lydic, 1997). Administration of NLA into the basal forebrain did not alter the sleep/wake cycle, implying that sleep-dependent changes in basal forebrain ACh release follow, rather than cause, normal alternations between sleep and wakefulness.
This study also provides the first comparison of ACh release across the sleep/wake cycle in lateral and medial regions of the basal forebrain. State-dependent changes in basal forebrain ACh release were localized to the lateral basal forebrain region. The functional significance of differential state-dependent changes in ACh release in medial versus lateral basal forebrain regions is not clear. ACh facilitates rhythmic discharge in cholinergic basal forebrain neurons in vitro, and it has been suggested that this facilitation may contribute to the rhythmic modulation of cortical EEG (Khateb et al., 1997; Manns et al., 2000). Whether ACh levels in medial versus lateral basal forebrain regions differentially alter the cortical EEG remains to be studied.
Understanding the modulators of basal forebrain ACh release has potential for drug development and animal models of Alzheimer's disease (Buccafusco and Terry, 2000). Recent evidence suggests that nitric oxide may play a role in dementia-related neuronal degeneration (de la Torre and Stefano, 2000; Law et al., 2001). The degree to which future drugs can serve as effective countermeasures for the cognitive decline and sleep-cycle disruptions characteristic of Alzheimer's disease must be balanced against the side-effect profiles of such agents. There is wide agreement that the diminished cognitive function of Alzheimer's disease originates, at least in part, from the loss of basal forebrain cholinergic neurons (Mesulam, 1996; Felder et al., 2000). Therefore, maximum therapeutic efficacy with minimal undesirable side effects can be achieved by developing drugs that have localized, site-specific actions.
Footnotes
This work was supported by National Institutes of Health Grants MH45361, HL40881, HL57120, and HL65272, and by the Department of Anesthesiology at the University of Michigan. C. A. Lapham and M. Wilcox provided expert assistance. We thank Dr. Kelli Sullivan and the University of Michigan Juvenile Diabetes Research Foundation Center for the Study of Complications in Diabetes for help with GFAP immunohistochemistry and microscopy.
Correspondence should be addressed to Dr. Helen A. Baghdoyan, Department of Anesthesiology, University of Michigan, 7433 Medical Sciences I, 1150 West Medical Center Drive, Ann Arbor, MI 48109-0615. E-mail: helenb@umich.edu.
REFERENCES
- 1.Baghdoyan HA, Lydic R. Neurotransmitters and neuromodulators regulating sleep. In: Bazil C, Malow B, Sammaritano M, editors. Sleep and epilepsy: the clinical spectrum. Elsevier Science; New York: 2002. pp. 17–44. [Google Scholar]
- 2.Baghdoyan HA, Spotts JL, Snyder SG. Simultaneous pontine and basal forebrain microinjections of carbachol suppress REM sleep. J Neurosci. 1993;13:229–242. doi: 10.1523/JNEUROSCI.13-01-00229.1993. [DOI] [PMC free article] [PubMed] [Google Scholar]
- 3.Baghdoyan HA, Lydic R, Fleegal MA. M2 muscarinic autoreceptors modulate acetylcholine release in the medial pontine reticular formation. J Pharmacol Exp Ther. 1998;286:1446–1452. [PubMed] [Google Scholar]
- 4.Benevento LA, McCleary LB. An immunocytochemical method for marking microelectrode tracks following single-unit recordings in long surviving, awake monkeys. J Neurosci Methods. 1992;41:199–204. doi: 10.1016/0165-0270(92)90085-r. [DOI] [PubMed] [Google Scholar]
- 5.Berman AL, Jones EG. The thalamus and basal telencephalon of the cat. University of Wisconsin; Madison: 1982. [Google Scholar]
- 6.Bickford ME, Günlük AE, Van Horn SC, Sherman SM. GABAergic projection from the basal forebrain to the visual sector of the thalamic reticular nucleus in the cat. J Comp Neurol. 1994;348:481–510. doi: 10.1002/cne.903480402. [DOI] [PubMed] [Google Scholar]
- 7.Bringmann A, Klingberg F. Electrical stimulations of the basal forebrain and the nucleus cuneiformis differently modulate behavioural activation of freely moving rat. Biomed Biochim Acta. 1989;48:781–791. [PubMed] [Google Scholar]
- 8.Buccafusco JJ, Terry AV. Multiple central nervous system targets for eliciting beneficial effects on memory and cognition. J Pharmacol Exp Ther. 2000;295:438–446. [PubMed] [Google Scholar]
- 9.Burlet S, Leger L, Cespuglio R. Nitric oxide and sleep in the rat: a puzzling relationship. Neuroscience. 1999;92:627–639. doi: 10.1016/s0306-4522(99)00031-7. [DOI] [PubMed] [Google Scholar]
- 10.de la Torre JC, Stefano GB. Evidence that Alzheimer's disease is a microvascular disorder: the role of constitutive nitric oxide. Brain Res Brain Res Rev. 2000;34:119–136. doi: 10.1016/s0165-0173(00)00043-6. [DOI] [PubMed] [Google Scholar]
- 11.Dzoljic MR, de Vries R. Nitric oxide synthase inhibition reduces wakefulness. Neuropharmacology. 1994;33:1505–1509. doi: 10.1016/0028-3908(94)90055-8. [DOI] [PubMed] [Google Scholar]
- 12.Dzoljic MR, de Vries R, van Leeuwen R. Sleep and nitric oxide: effects of 7-nitro indazole, inhibitor of brain nitric oxide synthase. Brain Res. 1996;718:145–150. doi: 10.1016/0006-8993(96)00102-3. [DOI] [PubMed] [Google Scholar]
- 13.Felder CC, Bymaster FP, Ward J, DeLapp N. Therapeutic opportunities for muscarinic receptors in the central nervous system. J Med Chem. 2000;43:4333–4353. doi: 10.1021/jm990607u. [DOI] [PubMed] [Google Scholar]
- 14.Fukuto JM, Chaudhuri G. Inhibition of constitutive and inducible nitric oxide synthase: potential selective inhibition. Annu Rev Pharmacol Toxicol. 1995;35:165–194. doi: 10.1146/annurev.pa.35.040195.001121. [DOI] [PubMed] [Google Scholar]
- 15.Garthwaite J, Boulton CL. Nitric oxide signaling in the central nervous system. Annu Rev Physiol. 1995;57:683–706. doi: 10.1146/annurev.ph.57.030195.003343. [DOI] [PubMed] [Google Scholar]
- 16.Gilbert KA, Lydic R. Pontine cholinergic reticular mechanisms cause state-dependent changes in the discharge of parabrachial neurons. Am J Physiol. 1994;266:R136–R150. doi: 10.1152/ajpregu.1994.266.1.R136. [DOI] [PubMed] [Google Scholar]
- 17.Gritti I, Mainville L, Jones BE. Codistribution of GABA- with acetylcholine-synthesizing neurons in the basal forebrain of the rat. J Comp Neurol. 1993;329:438–457. doi: 10.1002/cne.903290403. [DOI] [PubMed] [Google Scholar]
- 18.Gritti I, Mariotti M, Mancia M. GABAergic and cholinergic basal forebrain and preoptic-anterior hypothalamic projections to the mediodorsal nucleus of the thalamus in the cat. Neuroscience. 1998;85:149–178. doi: 10.1016/s0306-4522(97)00573-3. [DOI] [PubMed] [Google Scholar]
- 19.Guide for the care and use of laboratory animals (1996) Washington, DC: National Academy of Sciences.
- 20.Harper RM, Rector D, Poe G, Frysinger RC, Kristensen M, Gozal D. Rostral brain regions contributing to respiratory control. Prog Brain Res. 1996;107:145–156. doi: 10.1016/s0079-6123(08)61863-4. [DOI] [PubMed] [Google Scholar]
- 21.Ikarashi Y, Takahashi A, Ishimaru H, Shiobara T, Maruyama Y. The role of nitric oxide in striatal acetylcholine release induced by N-methyl-d-aspartate. Neurochem Int. 1998;33:255–261. doi: 10.1016/s0197-0186(98)00029-1. [DOI] [PubMed] [Google Scholar]
- 22.Kapas L, Fang J, Krueger JM. Inhibition of nitric oxide synthesis inhibits rat sleep. Brain Res. 1994a;664:189–196. doi: 10.1016/0006-8993(94)91969-0. [DOI] [PubMed] [Google Scholar]
- 23.Kapas L, Shibata M, Kimura M, Krueger JM. Inhibition of nitric oxide synthesis suppresses sleep in rabbits. Am J Physiol. 1994b;266:R151–R157. doi: 10.1152/ajpregu.1994.266.1.R151. [DOI] [PubMed] [Google Scholar]
- 24.Khateb A, Fort P, Williams S, Serafin M, Jones BE, Mühlethaler M. Modulation of cholinergic nucleus basalis neurons by acetylcholine and N-methyl-d-aspartate. Neuroscience. 1997;81:47–55. doi: 10.1016/s0306-4522(97)00167-x. [DOI] [PubMed] [Google Scholar]
- 25.Khateb A, Fort P, Williams S, Serafin M, Muhlethaler M, Jones BE. GABAergic input to cholinergic nucleus basalis neurons. Neuroscience. 1998;86:937–947. doi: 10.1016/s0306-4522(98)00094-3. [DOI] [PubMed] [Google Scholar]
- 26.Kimura H, McGeer PL, Peng JH, McGeer EG. The central cholinergic system studied by choline acetyltransferase immunohistochemistry in the cat. J Comp Neurol. 1981;200:151–201. doi: 10.1002/cne.902000202. [DOI] [PubMed] [Google Scholar]
- 27.King AB, Menon RS, Hachinski V, Cechetto DF. Human forebrain activation by visceral stimuli. J Comp Neurol. 1999;413:527–582. [PubMed] [Google Scholar]
- 28.Kitchener PD, Diamond J. Distribution and colocalization of choline acetyltransferase immunoreactivity and NADPH diaphorase reactivity in neurons within the medial septum and diagonal band of Broca in the rat basal forebrain. J Comp Neurol. 1993;335:1–15. doi: 10.1002/cne.903350102. [DOI] [PubMed] [Google Scholar]
- 29.Law A, Gauthier S, Quirion R. Say NO to Alzheimer's disease: the putative links between nitric oxide and dementia of the Alzheimer's type. Brain Res Brain Res Rev. 2001;35:73–96. doi: 10.1016/s0165-0173(00)00051-5. [DOI] [PubMed] [Google Scholar]
- 30.Leonard TO, Lydic R. Nitric oxide synthase inhibition decreases pontine acetylcholine release. NeuroReport. 1995;6:1525–1529. doi: 10.1097/00001756-199507310-00015. [DOI] [PubMed] [Google Scholar]
- 31.Leonard TO, Lydic R. Pontine nitric oxide modulates acetylcholine release, rapid eye movement sleep generation, and respiratory rate. J Neurosci. 1997;17:774–785. doi: 10.1523/JNEUROSCI.17-02-00774.1997. [DOI] [PMC free article] [PubMed] [Google Scholar]
- 32.Leonard TO, Lydic R. Nitric oxide: a diffusible modulator of physiological traits and behavioral states. In: Mallick BN, Inoue S, editors. Rapid eye movement sleep. Narosa; New Delhi: 1999. pp. 167–193. [Google Scholar]
- 33.Leonard CS, Michaelis EK, Mitchell KM. Activity-dependent nitric oxide concentration dynamics in the laterodorsal tegmental nucleus in vitro. J Neurophysiol. 2001;86:2159–2172. doi: 10.1152/jn.2001.86.5.2159. [DOI] [PubMed] [Google Scholar]
- 34.Lydic R, Baghdoyan HA. Pedunculopontine stimulation alters respiration and increases ACh release in the pontine reticular formation. Am J Physiol. 1993;264:R544–R554. doi: 10.1152/ajpregu.1993.264.3.R544. [DOI] [PubMed] [Google Scholar]
- 35.Manning HL, Schwartzstein RM. Pathophysiology of dyspnea. N Engl J Med. 1995;333:1547–1553. doi: 10.1056/NEJM199512073332307. [DOI] [PubMed] [Google Scholar]
- 36.Manns ID, Alonso A, Jones BE. Discharge properties of juxtacellularly labeled and immunohistochemically identified cholinergic basal forebrain neurons recorded in association with the electroencephalogram in anesthetized rats. J Neurosci. 2000;20:1505–1518. doi: 10.1523/JNEUROSCI.20-04-01505.2000. [DOI] [PMC free article] [PubMed] [Google Scholar]
- 37.Meng X-W, Ohara PT, Ralston HJ., III Nitric oxide synthase immunoreactivity distinguishes a sub-population of GABA-immunoreactive neurons in the ventrobasal complex of the cat. Brain Res. 1996;728:111–115. [PubMed] [Google Scholar]
- 38.Mesulam M-M. The systems-level organization of cholinergic innervation in the human cerebral cortex and its alterations in Alzheimer's disease. Prog Brain Res. 1996;109:285–297. doi: 10.1016/s0079-6123(08)62112-3. [DOI] [PubMed] [Google Scholar]
- 39.Miasnikov AA, Webster HH, Dykes RW. Temporally structured impulse activity in spontaneously discharging somatosensory cortical neurons in the awake cat: recognition and quantitative description of four different patterns of bursts, post-recording GFAP immunohistology and computer reconstruction of the studied cortical surface. Brain Res Brain Res Protoc. 1999;4:49–68. doi: 10.1016/s1385-299x(99)00004-5. [DOI] [PubMed] [Google Scholar]
- 40.Mizukawa K, Vincent SR, McGeer PL, McGeer EG. Distribution of reduced-nicotinamide-adenine-dinucleotide-phosphate diaphorase-positive cells and fibers in the cat central nervous system. J Comp Neurol. 1989;279:281–311. doi: 10.1002/cne.902790210. [DOI] [PubMed] [Google Scholar]
- 41.Moore H, Stuckman S, Sarter M, Bruno JP. Stimulation of cortical acetylcholine efflux by FG 7142 measured with repeated microdialysis sampling. Synapse. 1995;21:324–331. doi: 10.1002/syn.890210407. [DOI] [PubMed] [Google Scholar]
- 42.Nishino S, Tafti M, Reid MS, Shelton J, Siegel JM, Dement WC, Mignot E. Muscle atonia is triggered by cholinergic stimulation of the basal forebrain: implication for the pathophysiology of canine narcolepsy. J Neurosci. 1995;15:4806–4814. doi: 10.1523/JNEUROSCI.15-07-04806.1995. [DOI] [PMC free article] [PubMed] [Google Scholar]
- 43.Parent A, Pare D, Smith Y, Steriade M. Basal forebrain cholinergic and noncholinergic projections to the thalamus and brainstem in cats and monkeys. J Comp Neurol. 1988;277:281–301. doi: 10.1002/cne.902770209. [DOI] [PubMed] [Google Scholar]
- 44.Pasqualotto BA, Vincent SR. Galanin and NADPH-diaphorase coexistence in cholinergic neurons of the rat basal forebrain. Brain Res. 1991;551:78–86. doi: 10.1016/0006-8993(91)90916-j. [DOI] [PubMed] [Google Scholar]
- 45.Pose I, Sampogna S, Chase MH, Morales FR. Cuneiform neurons activated during cholinergically induced active sleep in the cat. J Neurosci. 2000;20:3319–3327. doi: 10.1523/JNEUROSCI.20-09-03319.2000. [DOI] [PMC free article] [PubMed] [Google Scholar]
- 46.Prast H, Philippu A. Nitric oxide releases acetylcholine in the basal forebrain. Eur J Pharmacol. 1992;216:139–140. doi: 10.1016/0014-2999(92)90223-q. [DOI] [PubMed] [Google Scholar]
- 47.Prast H, Philippu A. Nitric oxide as a modulator of neuronal function. Prog Neurobiol. 2001;64:51–68. doi: 10.1016/s0301-0082(00)00044-7. [DOI] [PubMed] [Google Scholar]
- 48.Sarter M, Bruno JP. Cortical cholinergic inputs mediating arousal, attentional processing and dreaming: differential afferent regulation of the basal forebrain by telencephalic and brainstem afferents. Neuroscience. 2000;95:933–952. doi: 10.1016/s0306-4522(99)00487-x. [DOI] [PubMed] [Google Scholar]
- 49.Semba K. Multiple output pathways of the basal forebrain: organization, chemical heterogeneity, and roles in vigilance. Behav Brain Res. 2000;115:117–141. doi: 10.1016/s0166-4328(00)00254-0. [DOI] [PubMed] [Google Scholar]
- 50.Spengler CM, Banzett RB, Systrom DM, Shannon DC, Shea SA. Respiratory sensations during heavy exercise in subjects without respiratory chemosensitivity. Respir Physiol. 1998;114:65–74. doi: 10.1016/s0034-5687(98)00073-5. [DOI] [PubMed] [Google Scholar]
- 51.Steriade M, Parent A, Pare D, Smith Y. Cholinergic and non-cholinergic neurons of cat basal forebrain project to reticular and mediodorsal thalamic nuclei. Brain Res. 1987;408:372–376. doi: 10.1016/0006-8993(87)90408-2. [DOI] [PubMed] [Google Scholar]
- 52.Sugaya K, McKinney M. Nitric oxide synthase gene expression in cholinergic neurons in the rat brain examined by combined immunocytochemistry and in situ hybridization histochemistry. Mol Brain Res. 1994;23:111–125. doi: 10.1016/0169-328x(94)90217-8. [DOI] [PubMed] [Google Scholar]
- 53.Szymusiak R, Alam N, McGinty D. Discharge patterns of neurons in cholinergic regions of the basal forebrain during waking and sleep. Behav Brain Res. 2000;115:171–182. doi: 10.1016/s0166-4328(00)00257-6. [DOI] [PubMed] [Google Scholar]
- 54.Ursin R, Sterman M. A manual for standardized scoring of sleep and waking states in the adult cat. Brain Information Services/Brain Research Institute, University of California; Los Angeles: 1981. [Google Scholar]
- 55.Valtschanoff JG, Weinberg RJ, Kharazia VN, Nakane M, Schmidt HHHW. Neurons in rat hippocampus that synthesize nitric oxide. J Comp Neurol. 1993;331:111–121. doi: 10.1002/cne.903310107. [DOI] [PubMed] [Google Scholar]
- 56.Vazquez J, Baghdoyan HA. Basal forebrain acetylcholine release during REM sleep is significantly greater than during waking. Am J Physiol. 2001;280:R598–R601. doi: 10.1152/ajpregu.2001.280.2.R598. [DOI] [PubMed] [Google Scholar]
- 57.Vazquez J, Wilcox M, Lydic R, Baghdoyan HA. A nitric oxide synthase (NOS) inhibitor increases acetylcholine (ACh) release in feline basal forebrain (BF). Soc Neurosci Abstr. 2001;27:522.3. [Google Scholar]
- 58.Vincent SR, Reiner PB. The immunohistochemical localization of choline acetyltransferase in the cat brain. Brain Res Bull. 1987;18:371–415. doi: 10.1016/0361-9230(87)90015-3. [DOI] [PubMed] [Google Scholar]
- 59.Wang Y-X, Poon CI, Pang CCY. In vitro and ex vivo inhibitory effects of l- and d-enantiomers of NG-nitro-arginine on endothelium-dependent relaxation of rat aorta. J Pharmacol Exp Ther. 1993;265:112–119. [PubMed] [Google Scholar]
- 60.Wild JM, Arends JJ, Zeigler HP. Projections of the parabrachial nucleus in the pigeon. J Comp Neurol. 1990;293:499–523. doi: 10.1002/cne.902930402. [DOI] [PubMed] [Google Scholar]
- 61.Zhang J, Snyder SH. Nitric oxide in the nervous system. Annu Rev Pharmacol Toxicol. 1995;35:213–233. doi: 10.1146/annurev.pa.35.040195.001241. [DOI] [PubMed] [Google Scholar]


