

Abstract
The representation of visual objects in short-term memory has been shown to be related to increased gamma-band activity in the electroencephalogram. Using a similar paradigm, we investigated oscillatory magnetoencephalographic activity in human subjects during a delayed matching-to-sample task requiring working memory of auditory spatial information. The memory task involved same–different judgments about the lateralization angle of pairs of filtered noise stimuli (S1 and S2) separated by 800 msec delays of background noise. This was compared with a control condition requiring the detection of a possible change in the background noise volume appearing instead of S2 (volume task). Statistical probability mapping revealed increased spectral activity at 59 Hz over left parietal cortex during the delay phase of the memory condition. In addition, 59 Hz coherence was enhanced between left parietal and right frontal sensors. During the end of the delay and during the presentation of S2, enhanced gamma-band activity at 67 Hz was observed over right frontal and later over midline parietal areas. In contrast, the volume task was characterized by increased left inferior frontotemporal 59 Hz spectral amplitude after S1. Apparently representation of the spatial position of a sound source is associated both with synchronization of networks in parietal areas involved in the auditory dorsal stream and with increased coupling between networks serving representation of audiospatial information and frontal executive systems. The comparison with S2 seemed to activate frontal and parietal neuronal ensembles. Gamma-band activity during the volume task may reflect auditory pattern encoding in auditory ventral stream areas.
Keywords: gamma-band activity (GBA), audiospatial working memory, statistical probability mapping, magnetoencephalography (MEG), auditory dorsal stream, auditory ventral stream, parietofrontal coherence
Human gamma-band activity (GBA) is thought of as a signature of synchronized cortical networks involved in the generation of mental representations (Pulvermüller et al., 1999; Tallon-Baudry and Bertrand, 1999). In electroencephalogram (EEG), increased GBA has been found during the perception of meaningful or gestalt-like stimuli (Lutzenberger et al., 1994, 1995; Tallon et al., 1995; Müller et al., 1996; Tallon-Baudry et al., 1996, 1997;Pulvermüller et al., 1997; Keil et al., 2001). GBA has also been demonstrated during a visual object working memory task, when an object representation had to be held active in the absence of external stimulation (Tallon-Baudry et al., 1998, 1999).
Traditionally, working memory is thought to involve both central executive processes, governing encoding and retrieval of information, and active maintenance of information in sensory buffer or “slave” systems (Baddeley, 1986). Both single-cell recordings in animals (Fuster and Alexander, 1971; Funahashi et al., 1993; Constantinidis et al., 2001), evoked potential (Mecklinger and Pfeifer, 1996; Ruchkin et al., 1997; Bosch et al., 2001), and brain imaging studies (Jonides et al., 1993; Courtney et al., 1997, 1998; Martinkauppi et al., 2000) have demonstrated working memory-dependent activation of both prefrontal and posterior brain regions. In line with these findings, GBA during visual object working memory was located under occipitotemporal and frontal electrodes (Tallon-Baudry et al., 1998). The posterior activity was interpreted as reflecting the rehearsal of the stimulus representation, whereas the frontal GBA may have indicated active maintenance processes.
In contrast to EEG studies where GBA tends to be topographically widely distributed, in magnetoencephalogram (MEG) we have found relatively focal increases over posterior parietotemporal regions both during passive listening to sound-source lateralization changes (Kaiser et al., 2000b, 2002a) and during the translation of auditory spatial information into motor responses (Kaiser and Lutzenberger, 2001). In contrast, GBA was enhanced over anterior temporal and inferior frontal regions during processing of auditory pattern changes (Kaiser et al., 2002b). This suggests that oscillatory activity may be recorded in MEG with both a good spatial and temporal resolution. Furthermore, considering the good topographical agreement with brain imaging studies of auditory processing (Griffiths et al., 1998; Bushara et al., 1999;Belin et al., 2000), GBA in MEG may provide valuable insights into the dynamics of cortical network activity. Adapting the paradigm used byTallon-Baudry et al. (1998) to the auditory domain, the present study investigated GBA during the delay phase of an audiospatial delayed matching-to-sample task compared with a control task not requiring memory. If GBA reflects networks involved in stimulus maintenance, it should be enhanced over posterior parietal and, possibly, prefrontal regions belonging to the putative auditory dorsal “where” processing stream (Kaas et al., 1999; Rauschecker and Tian, 2000). Given the relevance of communication between frontal and posterior parietal regions, we also investigated parietofrontal coherence during the working memory task.
MATERIALS AND METHODS
Subjects
Twelve adults (five males, seven females; mean age, 24.0 years; SD 2.8) gave their informed and written consent to participate in the study. Audiometric tests before the study showed normal hearing in all subjects with thresholds of <30 dB (hearing level) at 1000 Hz for each ear. All subjects showed a strong right-hand preference as measured with the Edinburgh Handedness Inventory (Oldfield, 1971). The study was approved by the ethics committee of the University of Tübingen Medical Faculty.
Procedure and stimulus material
Subjects were seated upright in a magnetically shielded room (Vakuum-Schmelze, Hanau, Germany). They were instructed to sit still and keep their eyes open, looking at a fixation cross in the center of their visual field ∼2 m in front of them. Auditory stimuli were presented binaurally via air-conducting tubes with ear inserts. The experiment was divided into two recording conditions: an audiospatial memory condition and a volume task serving as a control condition. The order in which the conditions were presented was counterbalanced between subjects. Before the recordings, participants were informed about which task they were to perform. The trial structure of both tasks is depicted in Figure 1. In the memory condition (Fig. 1a), the onset of the trial was signaled by low-pass-filtered midline noise (at 6 kHz: −24 dB/octave) presented for 300 msec with an intensity of 52 dB (A). Then a lateralized noise stimulus S1 was presented for 200 msec with an intensity of 70 dB (A). Lateralized sounds were generated by convolution with head-related transfer functions (Gardner and Martin, 1995, see: http://sound.media.mit.edu/KEMAR.html) yielding the impression of realistic lateralized sounds in extrapersonal space. This is achieved by introducing both intrapersonal amplitude and time differences and by simulating the localization-dependent filtering properties of head and outer ears. During the following delay phase, the midline noise [52 dB (A)] was presented again for 800 msec. This was followed by a second task-relevant lateralized noise stimulus S2 at 70 dB (A). The subjects were instructed to compare the lateralization of S1 and S2. If the lateralization was identical, they had to trigger a light barrier by raising both index fingers, whereas they were not to respond if lateralization angles differed between S1 and S2. S1 was presented either on the right or on the left with deviations of either 15° or 45° from the midsagittal plane. S2 was always presented on the same side as S1. If S1 was presented at 15°, S2 could appear at either 15° (same direction, go trial), at 0° or at 60° (different directions, no-go trials). If S1 was presented at 45°, S2 appeared at either 45°(go trial), at 5° or at 90° (no-go trials). The lateralization of S1 was randomized between trials with equal probabilities for the four angles. The lateralization of S2 was identical to S1 in 20% of the trials, whereas the probability for nonidentical lateralization angles was 80%. The duration of the intertrial interval was randomized between 1700 and 2700 msec.
Fig. 1.

Trial structure of memory and volume conditions. In both conditions, low-pass-filtered midline noise (pre-S1) and the presentation of the first lateralized noise stimulus (S1) were followed by a delay phase of 800 msec midline noise. Then in the memory condition (a), a second lateralized stimulus (S2) appeared for 200 msec. Subjects had to compare the sound source lateralization angle of S1 with the lateralization angle of S2 and detect matching stimuli.Arrows symbolize the lateralization angle of S1 and S2. In the volume condition (b), after the delay phase, another 200 msec of midline noise appeared with the same or with a slightly higher or lower intensity. Subjects had to detect whether the noise volume remained the same or increased or decreased at the end of the stimulus. The dark gray bar at the end of thebottom figure indicates a constant volume (go trial), whereas the light gray bars indicate changed volume (no-go trial). The duration of the intertrial interval was randomized between 1700 and 2700 msec in both conditions. The twohorizontal bars above the time axis show the two latency windows for spectral analysis (a1, 600–1200 msec;a2, 800–1400 msec).
In the volume condition (Fig. 1b), subjects had to detect noise intensity changes after the equivalent of the delay phase in the memory condition. Up to S2, the trial structure was identical to the memory condition. Then, instead of S2, the midline noise of the delay phase was prolonged for another 200 msec either at the same intensity of 52 dB (A) or at a slightly higher or lower intensity [64 or 46 dB (A), respectively]. These intensity levels were determined on the basis of previous behavioral testing to obtain comparable difficulty levels for both conditions. Subjects were instructed to lift their index fingers when the intensity remained the same (go trials, 20%), whereas no response was required when there was an intensity change (no-go trials, 80%).
In both conditions subjects were instructed to pay more attention to accuracy than to speed. Answers had to be given within 1000 msec after the onset of S2. Each condition comprised 150 trials, i.e., 30 go and 120 no-go trials. Before each experimental condition subjects performed up to 100 practice trials. In the first half of the practice phase they received single example trials followed by a high- or low-pitch beep signaling a go or a no-go trial, respectively. Immediately afterward, subjects heard the same trial again. In the second half of the practice phase, subjects had to respond to the stimuli and were given visual feedback about their performance by the experimenter.
Recordings
MEG was recorded using a whole-head system (CTF Inc., Vancouver, Canada) comprising 151 first-order magnetic gradiometers with an average distance between sensors of ∼2.5 cm. The amplitude resolution of the CTF system amounts to 0.3 fT, enabling the detection of low-amplitude signal changes. The signals were sampled at a rate of 250 Hz with an anti-aliasing filter at 80 Hz. Recording epochs lasted from 200 msec before trial onset to 2300 msec after trial onset, allowing 1000 msec after the onset of S2 for the response. The subject's head position was determined with localization coils fixed at the nasion and the preauricular points at the beginning and the end of each recording to ensure that head movements did not exceed 0.5 cm. To reduce eye movement and blink artifacts, we rejected trials containing signals exceeding 3.5 pT in frontotemporal sensors. This left an average of 114.8 ± 0.5 trials in the memory condition and 113.6 ± 0.9 trials in the volume condition.
Data analysis
Data analysis was based on the following procedure. First, spectral analysis served to identify the frequency ranges with the most robust differences between memory and volume conditions. To enable the detection of temporally dynamic processes, this was done for two overlapping time windows. Significance of the observed spectral power values for each frequency bin and MEG sensor was tested using a statistical probability mapping procedure described in detail in the next paragraph. Second, time courses across the entire recording epoch and topography of these effects were assessed after filtering in the frequency ranges with the most pronounced differences between conditions. The latency ranges with the most significant spectral amplitude differences between conditions were identified using statistical probability mapping. Third, task-related coherence changes were investigated. Here the analyses were restricted both to the relevant frequency ranges and to those pairwise combinations between those sensors with spectral amplitude effects and the remaining 150 sensors. Again, statistical probability mapping was applied to identify significant coherence changes.
Statistical probability mapping. The present statistical probability mapping approach was fully based on permutation tests (Noreen, 1989; Blair and Karniski, 1993) and included corrections both for multiple comparisons and for possible correlations between data either from neighboring frequency bins (for spectral and coherence analysis) or time points (for time course analysis). Starting point was the observed distribution of the t values for all frequency bins (time points) × sensors. To ensure that tests for two consecutive frequency bins (time points) were significant, a new distribution of the minimal t values, tm, was computed for all pairs of neighboring frequency bins (time points)i and sensors j:
Now the t value tm and its correspondingp value p0.05 was determined for which 5% of the observedtmi,j were greater. In the case of highly correlated data, p0.05 would be ≤0.05, whereas for highly independent data,p0.05 would be >0.05. Then the distribution of the maximal t values,tmax, was computed for each of thenrand = 2n permutations across nsubjects of the observed values for the two conditions for all frequency bins (time points) i × sensors j:
The critical t valuetcrit was now defined as the value where p0.05 ×nrand of the obtainedtmax were greater. This criticalt value tcrit was then applied as significance criterion to the observed data.
Spectral analysis. Spectral analysis was conducted on single trial basis in the range of 30–80 Hz for two overlapping 600 msec time windows (Fig. 1). The first window, a1, was chosen from 600 to 1200 msec after trial onset, thus excluding the first 100 msec immediately after the offset of S1 to avoid contamination with the “off-response” to S1. The second window, a2, was chosen from 800 to 1400 msec, thus including the later part of the delay phase and the first 100 msec of S2. Selecting a time window of 600 msec resulted in records of 150 points which were zero-padded to obtain 256 points. To reduce the frequency leakage for the different frequency bins, the records were multiplied by Welch windows (Press et al., 1992). Then a Fast Fourier Transform was performed with a frequency resolution of 0.98 Hz. Square roots of the power values were computed to obtain more normally distributed spectral amplitude values. These values were averaged across epochs to obtain measures of the total spectral activity for both conditions. This comprised both phase-locked and nonphase-locked, induced oscillatory responses. The latter has been related to higher-level cognitive processes (Pulvermüller et al., 1999; Tallon-Baudry and Bertrand, 1999). Spectral activity was compared between memory and volume conditions applying a statistical probability mapping method described below.
Exploration of source structure. Previous studies have always yielded only single areas of spectral amplitude enhancement at the surface (Kaiser et al., 2000b,c, 2002a,b; Kaiser and Lutzenberger, 2001). Single activation areas suggested that the generator was not a dipole, which in MEG would give rise to two areas of surface activation corresponding to the inflowing and outflowing flux wells of the dipole. In the case of dual activation areas at the surface, one would have to conclude that the source dipole was located in an area in between the two surface areas. In contrast, as we have shown and discussed in detail previously (Kaiser et al., 2000b), a quadrupolar or octopolar arrangement of multiple dipoles produces a strong field over the area circumscribed by the dipoles but much weaker outer fields. This would imply that the sources should be located close to the area below the sensor with the highest GBA. Narrowly localized single areas of gamma-band activity enhancements at the surface could only be generated by single dipoles in extremely lateral cortical regions because their second maximum would not be covered by the sensor helmet. Deep sources are implausible as generators for the observed narrow areas of enhanced activity because they would give rise to much more broadly distributed surface fields. However, to exclude the possibility that our significance criterion was too strict to find a second maximum generated by a single dipole source, we explored the observed spectral amplitude enhancements by repeating the statistical probability mapping with an uncorrected criterion of p < 0.05 for two adjacent frequency bins. In addition, we assessed phase relationships for the sensor pairs with coherence increases, because a single dipole source would produce two areas of increased coherence with an inverse (180°) phase angle.
Time course and topographical localization. To explore the time course and the topographical localization of the observed spectral amplitude changes between volume and memory condition, the signals across the entire recording interval of 2500 msec (625 points) were padded to obtain 1024 points, multiplied with cosine windows at their beginnings and ends and filtered in the frequency range in which the statistical probability mapping had yielded significant effects. Noncausal, Gaussian curve-shaped Gabor filters (width, ±2.5 Hz) in the frequency domain were applied to the signals on a single-epoch basis for both conditions. The filtered data were amplitude-demodulated by means of a Hilbert transformation (Clochon et al., 1996) and then averaged across epochs for each condition. Differences in amplitude between memory and volume condition in the filtered frequency band were assessed with the statistical mapping procedure described above. To reduce the number of comparisons, time courses were collapsed to 40 msec windows.
To depict the topographical localization of the observed differential spectral amplitude enhancements, we assigned the sensor positions of significant amplitude values of each subject to common spatial coordinates (“common coil system”). The sensor positions with respect to the underlying cortical areas were determined using a volumetric magnetic resonance image of one representative subject. The error that is introduced by not using individual sensor locations was estimated in previous studies by using a single dipole localization of the first auditory-evoked component (N1m) (Kaiser et al., 2000b) and of the somatosensory evoked field (Kaiser et al., 2000c). The comparison of individual sensor locations and the “common coil system” revealed differences ranging below the spatial resolution determined by the sensor spacing of 2.5 cm. This justified the application of a “common coil system” for the purpose of the present study where no exact source localization was attempted.
Coherence analysis. Because feature binding and mental representations are thought to be related to the activity of coherently oscillating cortical networks (Singer, 1995; Singer et al., 1997;Miltner et al., 1999), gamma-band coherence was investigated for sensors showing significant GBA differences between the memory condition and the volume condition. We computed coherence for all pairwise combinations, including only those sensors with a significant difference in gamma-band spectral amplitudes between conditions. This means that for each sensor, 150 coherence values were entered into the analysis. Moreover, coherence analysis was restricted to those frequency bands where significant effects were found. Coherence between two waveforms x and y is defined as γxy2 (f)= (Gxy(f))2/(Gxx (f) Gyy (f)), whereGxy (f) is the mean cross-power spectral density and Gxx (f) andGyy (f) are the respective mean autopower spectral densities (Glaser and Ruchkin, 1976). Differences in coherence between memory and volume condition were statistically evaluated in the whole sample with the statistical mapping procedure described above.
RESULTS
Three subjects were excluded because of their poor performance on the tasks (false alarm rates between 54 and 58%). One additional subject was excluded because of excessive eye-blink artifacts. This left data from eight subjects for analysis (three males, five females; mean age, 24.4 years; SD 3.2).
Behavioral data
Subjects showed an overall performance of 64.8 ± 8.5% hits and 88.9 ± 31.7% correct rejections for the memory condition and 68.4 ± 8.0% hits and 92.0 ± 30.8% correct rejections for the volume condition. There were no significant differences between sums of misses (memory: 11.3 ± 9.7; volume: 10.8 ± 7.6) and false alarms (memory: 13.1 ± 5.0; volume: 9.3 ± 4.0) in both conditions. For reaction times, an ANOVA with factors of task (memory vs volume) and response type (hits vs false alarms) showed no significant main effects or interactions. Reaction times for hits were 691 ± 23 msec in the memory and 652 ± 25 msec in the volume condition, whereas reaction times for false alarms were 738 ± 28 msec in the memory and 637 ± 70 msec in the volume condition.
GBA
Spectral amplitudes
Figure 2 depicts frequency spectra between 55 and 75 Hz for the two conditions in the sensors for which significant effects were identified. For the window from 600 to 1200 msec after trial onset, the following effects met the criterion oftcrit = 5.20. Higher spectral amplitude in the memory condition compared with the volume condition was found at ∼59 Hz in a sensor over left parietal cortex (Fig. 2,left column). In the volume condition, an increase in spectral amplitude relative to the memory condition was also found at ∼59 Hz in a sensor over the left inferior frontotemporal cortex (Fig.2, center column). For the time window of 800–1400 msec after trial onset, the only effect meetingtcrit = 5.16 was a spectral amplitude enhancement in a frontal sensor at ∼67 Hz in the memory task compared with the volume condition (Fig. 2, right column). Comparison of the frequency spectra in Figure 2 shows that although the enhancements at 59 and 67 Hz in the memory condition were restricted to a rather narrow frequency range, the inferior frontotemporal 59 Hz increase in the volume condition was more extended in the frequency domain.
Fig. 2.

Frequency spectra in those sensors showing significant differences between conditions for the entire sample ofN = 8 subjects (after subtraction of system noise). The top row of graphs depicts spectral amplitude absolute values in femtotesla between 55 and 75 Hz for both memory and volume conditions (bold and thin lines, respectively). The bottom row of graphs shows the results (p values) of ttests comparing spectral amplitudes between conditions. Vertical connecting dotted lines indicate the borders of the frequency ranges where the differences between both conditions reached significance. Sensor locations (cortical regions) and the center frequency for the most significant difference are given in the headings above each column.
Time course and topographical localization
To explore the time course and the topography of spectral amplitude differences, the data records were Gabor filtered in the frequency range where the spectral analysis had yielded significant differences between both conditions. Filters with center frequencies of 59 and 67 Hz and widths of ±2.5 Hz were applied to the signals from 100 msec before trial onset to 1600 msec after trial onset. Figure3 gives the topography of the significant enhancements in the 59 and 67 Hz ranges both with the corrected statistical mapping and with a more liberal, uncorrected criterion ofp < 0.05 for two consecutive time windows. The top part of Figure 4 gives a summary of findings, including topography, time courses of p values, and coherence increases. The bottom left part of Figure 4 shows time–frequency plots for spectral amplitude differences at a right frontal sensor for the eight individual subjects. The bottom right part of Figure 4 depicts p value distributions across time points and frequencies of t tests for spectral amplitude differences between memory and volume conditions in the entire group at the four relevant sensors showing the statistically most pronounced effects (left parietal, right frontal, midline parietal, and left frontotemporal). In addition, Figure 5gives absolute amplitude time courses at the relevant frequencies for the same four sensors.
Fig. 3.
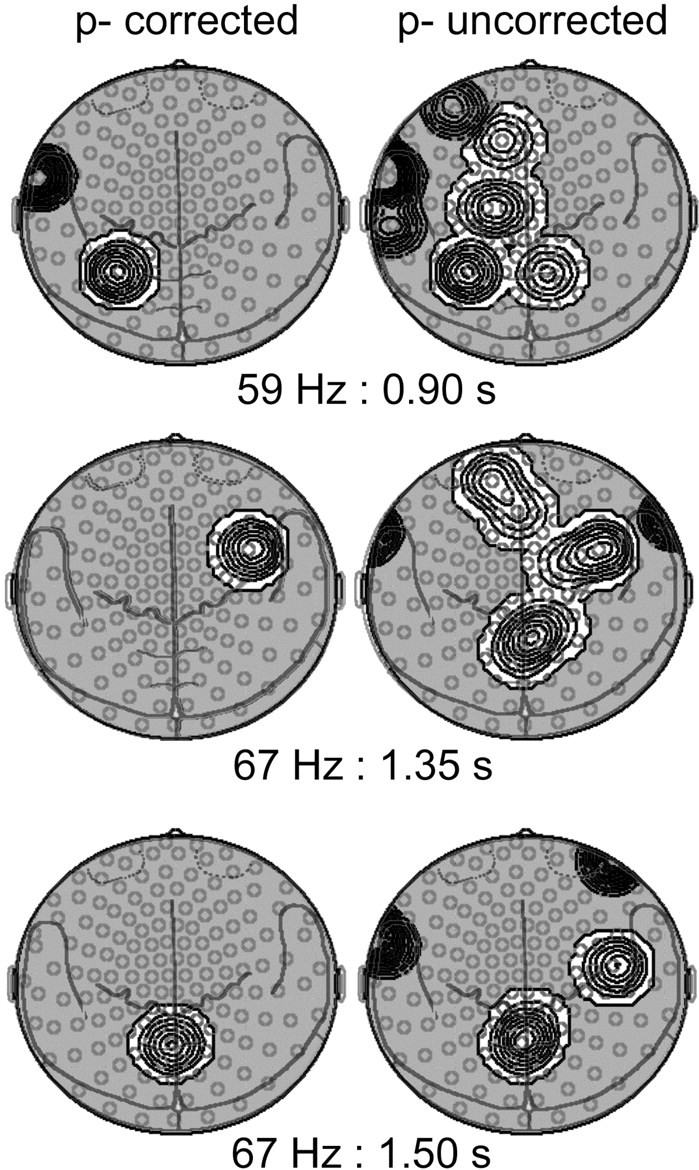
Statistical probability mapping of spectral amplitude differences between memory and volume conditions. Topographies are shown for the entire group for signals filtered at 59 ± 2.5 Hz at 900 msec after trial onset (top row) and at 67 ± 2.5 Hz at 1350 and 1500 msec (center and bottom rows, respectively) projected onto two-dimensional MEG sensor maps including anatomical landmarks (seen from above, nose up). The left columndepicts isocontour plots of significant spectral amplitude increases (white areas) and decreases (shaded areas) in the memory compared with the volume condition meeting the critical t values derived from the bootstrap method correcting for multiple comparisons described in Materials and Methods. Relative amplitude enhancements in the memory condition were found over left parietal cortex at ∼59 Hz and both over right frontal and midline parietal cortex at ∼67 Hz, whereas there was a relative spectral amplitude decrease over left temporal regions at 59 Hz. Theright column shows the results after application of a more liberal, uncorrected p value of 0.05 for two consecutive time windows. Here areas of spectral amplitude increases were more extended over frontal and parietal areas. Such extended areas could in principle be caused by the second maximum generated by a dipolar source. However, as the analysis of phase relationships in the coherencies between these sensors did not reveal a phase reversal, it can be excluded that the surface structure was generated by a single dipole.
Fig. 4.
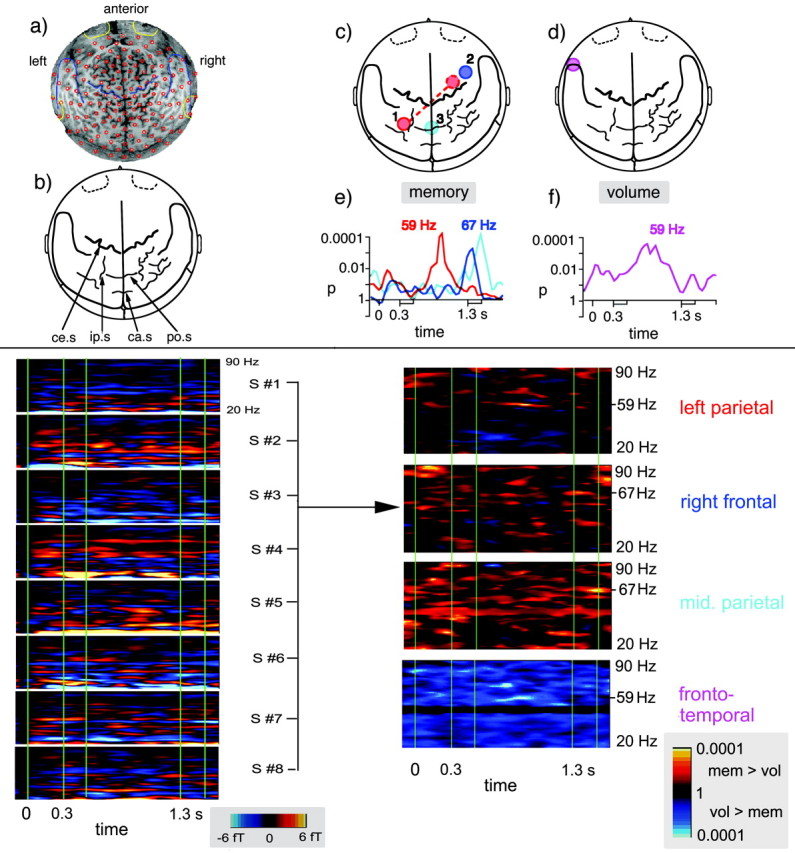
Top panel, MEG sensor mapping and summary of findings. a, Projection of the MEG sensor positions (small red circles) onto a two-dimensional magnetic resonance surface image obtained from a representative subject (seen from above, nose up). b, Map with anatomical landmarks derived from the magnetic resonance image.ce.s, Central sulcus, ip.s, intraparietal sulcus, ca.s, calcarine sulcus, po.s, parieto-occipital sulcus. The locations of the MEG sensor positions were projected onto this map to depict the topography of spectral amplitude changes. c, Locations of the sensors showing relative spectral amplitude and coherence increases in the memory condition. There was a GBA increase at 59 ± 2.5 Hz over left posterior parietal cortex in the vicinity of the intraparietal sulcus (solid red circle). Here a coherence increase (symbolized by the broken red line) was observed with a right frontal sensor (broken red circle). At 67 ± 2.5 Hz, GBA enhancements were observed over right frontal and midline parietal areas (blue and turquoise circles, respectively). d, Location of the inferior frontotemporal sensor showing a relative spectral amplitude increase at 59 ± 2.5 Hz in the volume condition. e, f, Time courses of spectral amplitude differences for the sensors that showed significant effects. The curves depict the results of t test comparisons between both conditions, i.e.,p values for time points between 50 msec before and 1800 msec after trial onset. The curves are displayed in the same colors as the corresponding sensors. Bottom panel, On theright, time–frequency plots show the distribution ofp values for t tests of spectral amplitude differences between memory and volume conditions in the entire group. Here the four relevant sensors are presented that showed the statistically most pronounced effects (color coding as in thetop panel). p values are shown for the entire trial (smoothed with 8 msec windows) and between 20 and 90 Hz. Warm colors indicate higher spectral amplitude in the memory compared with the volume condition, whereas cold colors represent higher spectral amplitude in the volume compared with the memory condition. The center frequencies for the most significant effects are indicated; they were 59 Hz for the left parietal and the left frontotemporal sensors and 67 Hz for the right frontal and midline parietal sensors. The left half of the bottom panel shows the spectral amplitude differences between conditions in femtotesla for the right frontal sensor in each of the eight subjects.
Fig. 5.

Absolute spectral amplitude time courses (after subtraction of system noise) between 50 msec before and 1800 msec after trial onset for the sensors with significant GBA enhancements. Thetop graph shows time courses for the signals filtered at 59 ± 2.5 Hz in the left parietal and left inferior frontotemporal sensors, whereas the bottom graph shows time courses for the signals filtered at 67 ± 2.5 Hz in the midline parietal and right frontal sensors. See Figure 4, e andf for corresponding significance values.
The following spectral amplitude differences met the criterion oftcrit = 5.20 for signals filtered in the frequency range of 59 ± 2.5 Hz. In the memory condition we found spectral amplitude enhancements relative to the volume condition in a left parietal sensor (Fig. 3) peaking at ∼900 msec after trial onset, i.e., in the middle of the delay phase (Fig. 4c,e). The average difference between both conditions in this time interval amounted to 0.87 ± 0.11 fT (t(7)= 7.83; p < 0.001) in the latency window of 850–950 msec at this sensor. In the volume condition, a 59 Hz spectral amplitude increase relative to the memory task was found for a sensor over left inferior frontotemporal cortex (Fig. 4d). This effect peaked between 700 and 900 msec where the average difference between both conditions amounted to 1.25 ± 0.20 fT (t(7) = 6.41; p < 0.001). Absolute spectral amplitude time courses (Fig. 5) showed that both at the parietal and at the inferior frontotemporal sensor, task-related differences were present even before the onset of S1. This was reflected by a condition (memory vs volume) × sensor (left parietal versus left inferior frontotemporal) interaction for 59 ± 2.5 Hz spectral amplitudes between 100 msec before and 300 msec after trial onset (F(1,7) = 59.4;p < 0.001).
The following spectral amplitude differences met the criterion oftcrit = 5.09 for the frequency range of ∼67 Hz. Here effects were limited to the memory condition, and there were no relative enhancements for the volume condition. The GBA increases at ∼67 Hz were located in two sensors over the right frontal and midline parietal cortex (Figs. 3, 4c). The frontal sensor peaked at 1350 msec after trial onset, whereas the parietal sensor peaked at 1500 msec, i.e., at the beginning and end of the presentation of S2, respectively (Fig. 4e). At the frontal site, the average amplitude difference between both conditions amounted to 0.84 ± 0.15 fT (t(7)= 5.67; p = 0.001) in the latency window of 1300–1400 msec; at the parietal site the difference was 1.13 ± 0.14 fT (t(7) = 7.98; p < 0.001) in the latency window of 1450–1550 msec. As for the effects at ∼59 Hz, spectral amplitude time courses (Fig. 5) showed that the relative enhancements of 67 ± 2.5 Hz activity were present throughout the trial but reached significance only after the end of the delay period.
We explored the question of the source structure of the observed GBA effects by repeating the statistical probability mapping with a more liberal, uncorrected significance criterion of p < 0.05 for two adjacent time windows (Fig. 3, right column). These analyses demonstrated that for the 59 Hz increase in the volume condition at 700–900 msec after trial onset, there was no further maximum, contradicting a single dipole activation pattern. For both the 59 and 67 Hz spectral amplitude increases in the memory condition, the less strict criterion revealed extended areas of activation over the parietal and the frontal cortex, respectively. Such extended areas could in principle reflect the second maximum generated by a dipolar source. However, because the analysis of phase relationships in the coherencies between these sensors did not reveal a phase reversal, it can be excluded that the surface structure was generated by a single dipolar source.
Coherence
We conducted coherence analysis for the sensors that showed spectral amplitude enhancements in the frequency ranges of 59–60 Hz and 66–68 Hz. At 59–60 Hz local coherence increases (between adjacent sensors) were observed both for the parietal sensor in the memory condition and for the inferior frontotemporal sensor in the volume condition. Only one coherence increase across distances between sensors of >3 cm met the criterion of tcrit = 3.08. This coherence enhancement was observed in the memory condition between the left parietal and a right frontal sensor (Fig. 4c, top) and amounted to 0.07 ± 0.02 (t(7) = 4.03; p = 0.005). At 66–68 Hz, only local coherence increases were found for the right frontal sensor. All of these local coherences showed near-zero phase shifts. Because local coherence increases may be caused by neighboring sensors measuring activity from the same electromagnetic source, only the parietofrontal 59 Hz coherence change will be considered relevant as a putative correlate of corticocortical coupling.
DISCUSSION
Magnetoencephalographic GBA in humans was investigated during a working memory task for sound lateralization angles and a control condition requiring the detection of background noise volume changes. A statistical probability mapping approach was used that included corrections both for multiple comparisons and for serial correlations between adjacent data points. In the memory task, relative increases were disclosed during the middle of the delay phase at ∼59 Hz both for left parietal spectral amplitude and left parietal–right frontal coherence. This was followed by enhanced GBA at ∼67 Hz over right frontal and midline parietal cortex peaking at the end of the delay phase and during S2. In the volume condition, relative increases of 59 Hz spectral amplitude were restricted to left inferior frontotemporal cortex, and neither task-related corticocortical coherence changes nor GBA enhancements over frontal areas were observed.
GBA increases were restricted to narrow frequency ranges in the memory condition at 59 and 67 Hz, whereas the increase in the volume condition was more spectrally extended (Fig. 2). Whereas findings of spectrally narrow differences are in keeping with earlier MEG studies using a similar statistical probability mapping approach (Kaiser et al., 2000b,2002a, b; Kaiser and Lutzenberger, 2001), they are in contrast to findings of wider-band GBA measured intracranially in animals ( Freeman and van Dijk, 1987; Eckhorn et al., 1993; Singer and Gray, 1995) or in human EEG (Keil et al., 1999; Tallon-Baudry et al., 1999). This discrepancy may be explained by two factors. First studies finding wider-band activity usually compared GBA during stimulus processing with prestimulation baselines, whereas we directly compared two highly comparable conditions. The latter approach does not detect ranges of common activation but only differences between conditions. Second, group analysis further limits the bandwidth of GBA that may be wider in single subjects but also interindividually variable.
The present statistical mapping procedure yielded GBA enhancements that were limited to single sensors. Before interpreting the topography of these findings, one has to consider that unlike for hemodynamic functional imaging methods, in MEG there is no one-to-one relationship between sensor position and the location of the cortical generator. Instead, theoretical considerations are necessary to assign MEG activations to underlying sources. The application of a more liberal, uncorrected significance criterion of p < 0.05 revealed spatially more extended surface activations than the stricter analysis. However, there were no phase reversals in the coherencies between sensors over these areas, excluding the existence of simple dipoles as generators of the surface activation. Instead, based on simulations presented previously (Kaiser et al., 2000b), we propose distributed, multiple dipoles as possible sources of the observed surface patterns. These generators would give rise to much stronger magnetic fields over the area they circumscribe than outside and would thus be located in the vicinity of the cortical area underneath the surface activation.
The posterior parietal topography of GBA at 59 Hz during the delay in the memory condition is in keeping with the putative role of this area in auditory spatial processing suggested in human functional imaging (Griffiths et al., 1998; Bushara et al., 1999; Weeks et al., 1999;Alain et al., 2001) and MEG studies (Kaiser et al., 2000b, 2002a;Kaiser and Lutzenberger, 2001). Conversely, the left inferior frontotemporal GBA in the volume condition could be interpreted as reflecting the processing of auditory pattern information (here: sound volume) in areas belonging to the putative auditory ventral “what” pathway (Engelien et al., 1995; Binder et al., 1997; Belin et al., 2000; Scott et al., 2000; Rauschecker and Tian, 2000; Kaiser et al., 2002b). Although both of these task-related differences were statistically most pronounced during the middle of the delay phase and disappeared before its end, the activations were already elevated at trial onset and not attributable to relative suppressions in the other condition. This suggested an anticipatory synchronization of networks involved in the performance of auditory spatial versus pattern processing tasks (Engel et al., 2001). Anticipatory GBA over parietal cortex has already been observed during auditory-motor integration when subjects knew in advance about the task to be performed (Kaiser and Lutzenberger, 2001). These findings highlight the limitations of comparing stimulus-induced activations with prestimulus baselines where task-related, anticipatory activity differences may already exist.
In the memory task, additional GBA increases were disclosed at ∼67 Hz over frontal and midline parietal cortex. The present topography of frontal and parietal GBA enhancements was in keeping with functional magnetic resonance imaging studies of auditory spatial working memory where bilateral superior frontal, and both bilateral and small medial parietal areas were found to be activated (Martinkauppi et al., 2000; Alain et al., 2001). However, our GBA enhancements reaching significance did not cover the whole activation pattern found in those studies. Figure 5 shows that GBA over these areas was already enhanced before S2 but reached significance only toward the end of the delay phase and during the presentation of S2. Comparison with earlier work (Kaiser et al., 2000b, 2002a, b) shows that the frontal effect peaked too early to be induced by S2, suggesting that it may reflect a network involved in the preparation for the comparison of a representation of S1 with S2. In contrast, the parietal GBA enhancement could be associated with the representation of S2.
While there were no coherence changes between sensors at distances of >3 cm in the volume condition, coherence in the 59 Hz range was increased between left parietal and right frontal cortex during the delay phase of the memory condition. This may reflect increased coupling between areas forming part of a working memory network necessary to actively remember the perceived localization of the first stimulus during the delay period. Both increased parietofrontal coupling, as reflected by the coherence increase at 59 Hz and the 67 Hz GBA increases over these areas were in keeping with previous research showing concurrent activations in these areas during spatial working memory (Funahashi et al., 1993; Jonides et al., 1993; Mecklinger and Pfeifer, 1996; Ruchkin et al., 1997; Courtney et al., 1998; Sarnthein et al., 1998; Martinkauppi et al., 2000; Constantinidis et al., 2001;Bosch et al., 2001).
The memory task was distinguished from the volume condition both by parietofrontal coherence enhancements and later GBA increases over frontal and parietal cortex. Although it may be argued that any comparison of nonsimultaneous auditory stimuli, including the present volume change detection involves a memory component because a current sound has to be compared with a previous one, the present conditions clearly involved different types of memory. The volume task required auditory mismatch detection (Näätänen and Winkler, 1999; Kaiser et al., 2000a) based on echoic, ultra-short-term representations of the background noise involving areas along the auditory ventral stream but not frontal cortex. In contrast, the lateralization angle of S1 had to be held active in working memory over a period of 800 msec. This required not just a categorical left–right decision but a more precise representation of the lateralization angle of a sound source within one hemifield. This appeared to involve both auditory dorsal stream regions and right frontal cortex.
Despite identical external stimulation, the auditory spatial working memory task led to “top–down” guided GBA increases over posterior parietal, putative auditory dorsal “where” stream areas, whereas the volume change detection task was accompanied by activations of networks in inferior frontotemporal, ventral pathway regions involved in auditory pattern processing (Rauschecker and Tian, 2000). The working memory task involved in addition frontal areas and was associated with increased parietofrontal coupling. The latter findings could indicate an activation of the “frontal executive” and enhanced cross-talk between frontal and posterior “slave systems” (Baddeley, 1986) during the delay phase of the memory task. However, the present data do not allow for a decision on whether the representation of S1 is maintained in frontal (Owen et al., 1998, 1999;D'Esposito et al., 1999; Petrides, 2000) or parietal networks because GBA did not show a time course that was strictly specific to the delay phase. Such maintenance-specific prefrontal activations as found in single-cell recordings (Miller and Cohen, 2001) may have been too small to be detectable in MEG. In summary, GBA served to confirm and extend functional imaging results on spatial working memory by providing additional information on time courses of cortical activation and corticocortical coupling.
Footnotes
This work was supported by Deutsche Forschungsgemeinschaft Grant SFB 550/C1.
Correspondence should be addressed to Jochen Kaiser, Institute of Medical Psychology and Behavioral Neurobiology, University of Tübingen, Gartenstrasse 29, 72074 Tübingen, Germany. E-mail: jochen.kaiser@uni-tuebingen.de.
REFERENCES
- 1.Alain C, Arnott SR, Hevenor S, Graham S, Grady CL. “What” and “where” in the human auditory system. Proc Natl Acad Sci USA. 2001;98:12301–12306. doi: 10.1073/pnas.211209098. [DOI] [PMC free article] [PubMed] [Google Scholar]
- 2.Baddeley AD. Working memory. Oxford UP; Oxford: 1986. [Google Scholar]
- 3.Belin P, Zatorre RJ, Lafaille P, Ahad P, Pike B. Voice-selective areas in human auditory cortex. Nature. 2000;403:309–312. doi: 10.1038/35002078. [DOI] [PubMed] [Google Scholar]
- 4.Binder JR, Frost JA, Hammeke TA, Cox RW, Rao SM, Prieto T. Human brain language areas identified by functional magnetic resonance imaging. J Neurosci. 1997;17:353–362. doi: 10.1523/JNEUROSCI.17-01-00353.1997. [DOI] [PMC free article] [PubMed] [Google Scholar]
- 5.Blair RC, Karniski W. An alternative method for significance testing of waveform difference potentials. Psychophysiology. 1993;30:518–524. doi: 10.1111/j.1469-8986.1993.tb02075.x. [DOI] [PubMed] [Google Scholar]
- 6.Bosch V, Mecklinger A, Friederici AD. Slow cortical potentials during retention of object, spatial and verbal information. Brain Res Cogn Brain Res. 2001;10:219–237. doi: 10.1016/s0926-6410(00)00040-9. [DOI] [PubMed] [Google Scholar]
- 7.Bushara KO, Weeks RA, Ishii K, Catalan MJ, Tian B, Rauschecker JP, Hallett M. Modality-specific frontal and parietal areas for auditory and visual spatial localization in humans. Nat Neurosci. 1999;2:759–766. doi: 10.1038/11239. [DOI] [PubMed] [Google Scholar]
- 8.Clochon P, Fontbonne J, Lebrun N, Etevenon P. A new method for quantifying EEG event-related desynchronization: amplitude envelope analysis. Electroencephalogr Clin Neurophysiol. 1996;98:126–129. doi: 10.1016/0013-4694(95)00192-1. [DOI] [PubMed] [Google Scholar]
- 9.Constantinidis C, Franowicz MN, Goldman-Rakic PS. The sensory nature of mnemonic representation in the primate prefrontal cortex. Nat Neurosci. 2001;4:311–316. doi: 10.1038/85179. [DOI] [PubMed] [Google Scholar]
- 10.Courtney SM, Ungerleider LG, Keil K, Haxby JV. Transient and sustained activity in a distributed neural system for human working memory. Nature. 1997;386:608–611. doi: 10.1038/386608a0. [DOI] [PubMed] [Google Scholar]
- 11.Courtney SM, Petit L, Maisog JM, Ungerleider LG, Haxby JV. An area specialized for spatial working memory in human frontal cortex. Science. 1998;279:1347–1351. doi: 10.1126/science.279.5355.1347. [DOI] [PubMed] [Google Scholar]
- 12.D'Esposito M, Postle BR, Ballard D, Lease J. Maintenance versus manipulation of information held in working memory: an event-related fMRI study. Brain Cogn. 1999;41:66–86. doi: 10.1006/brcg.1999.1096. [DOI] [PubMed] [Google Scholar]
- 13.Eckhorn R, Frien A, Bauer R, Woelbern T, Kehr H. High frequency (60–90 Hz) oscillations in primary visual cortex of awake monkey. NeuroReport. 1993;4:243–246. doi: 10.1097/00001756-199303000-00004. [DOI] [PubMed] [Google Scholar]
- 14.Engel AK, Engel AK, Fries P, Singer W. Dynamic predictions: Oscillations and synchrony in top-down processing. Nat Rev Neurosci. 2001;2:704–716. doi: 10.1038/35094565. [DOI] [PubMed] [Google Scholar]
- 15.Engelien A, Silbersweig D, Stern E, Huber W, Doring W, Frith C, Frackowiak RS. The functional anatomy of recovery from auditory agnosia. A PET study of sound categorization in a neurological patient and normal controls. Brain. 1995;118:1395–1409. doi: 10.1093/brain/118.6.1395. [DOI] [PubMed] [Google Scholar]
- 16.Freeman WJ, van Dijk BW. Spatial patterns of visual cortical fast EEG during conditioned reflex in a rhesus monkey. Brain Res. 1987;422:267–276. doi: 10.1016/0006-8993(87)90933-4. [DOI] [PubMed] [Google Scholar]
- 17.Funahashi S, Chafee MV, Goldman-Rakic PS. Prefrontal neuronal activity in rhesus monkeys performing a delayed anti-saccade task. Nature. 1993;365:753–756. doi: 10.1038/365753a0. [DOI] [PubMed] [Google Scholar]
- 18.Fuster JM, Alexander GE. Neuron activity related to short-term memory. Science. 1971;173:652–654. doi: 10.1126/science.173.3997.652. [DOI] [PubMed] [Google Scholar]
- 19.Gardner WG, Martin KD. HRTF measurements of a KEMAR. J Acoust Soc Am. 1995;97:3907–3908. [Google Scholar]
- 20.Glaser EM, Ruchkin DS. Principles of neurobiological signal analysis. Academic Press; New York: 1976. [Google Scholar]
- 21.Griffiths TD, Rees G, Rees A, Green GG, Witton C, Rowe D, Büchel C, Turner R, Frackowiak RS. Right parietal cortex is involved in the perception of sound movement in humans. Nat Neurosci. 1998;1:74–79. doi: 10.1038/276. [DOI] [PubMed] [Google Scholar]
- 22.Jonides J, Smith EE, Koeppe RA, Awh E, Minoshima S, Mintun MA. Spatial working memory in humans as revealed by PET. Nature. 1993;363:623–625. doi: 10.1038/363623a0. [DOI] [PubMed] [Google Scholar]
- 23.Kaas JH, Hackett TA, Tramo MJ. Auditory processing in primate cerebral cortex. Curr Opin Neurobiol. 1999;9:164–170. doi: 10.1016/s0959-4388(99)80022-1. [DOI] [PubMed] [Google Scholar]
- 24.Kaiser J, Lutzenberger W. Parietal gamma-band activity during auditory spatial precueing of motor responses. NeuroReport. 2001;12:3479–3482. doi: 10.1097/00001756-200111160-00021. [DOI] [PubMed] [Google Scholar]
- 25.Kaiser J, Lutzenberger W, Birbaumer N. Simultaneous bilateral mismatch response to right- but not leftward sound lateralization. NeuroReport. 2000a;11:2889–2892. doi: 10.1097/00001756-200009110-00012. [DOI] [PubMed] [Google Scholar]
- 26.Kaiser J, Lutzenberger W, Preissl H, Ackermann H, Birbaumer N. Right-hemisphere dominance for the processing of sound-source lateralization. J Neurosci. 2000b;20:6631–6639. doi: 10.1523/JNEUROSCI.20-17-06631.2000. [DOI] [PMC free article] [PubMed] [Google Scholar]
- 27.Kaiser J, Lutzenberger W, Preissl H, Mosshammer D, Birbaumer N. Statistical probability mapping reveals high-frequency magnetoencephalographic activity in supplementary motor area during self-paced finger movements. Neurosci Lett. 2000c;283:81–84. doi: 10.1016/s0304-3940(00)00921-6. [DOI] [PubMed] [Google Scholar]
- 28.Kaiser J, Birbaumer N, Lutzenberger W. Magnetic oscillatory responses to lateralization changes of natural and artificial sounds in humans. Eur J Neurosci. 2002a;15:345–354. doi: 10.1046/j.0953-816x.2001.01857.x. [DOI] [PubMed] [Google Scholar]
- 29.Kaiser J, Lutzenberger W, Ackermann H, Birbaumer N. Dynamics of gamma-band activity induced by auditory pattern changes in humans. Cereb Cortex. 2002b;12:212–221. doi: 10.1093/cercor/12.2.212. [DOI] [PubMed] [Google Scholar]
- 30.Keil A, Müller MM, Ray WJ, Gruber T, Elbert T. Human gamma band activity and perception of a gestalt. J Neurosci. 1999;19:7152–7161. doi: 10.1523/JNEUROSCI.19-16-07152.1999. [DOI] [PMC free article] [PubMed] [Google Scholar]
- 31.Keil A, Gruber T, Müller MM. Functional correlates of macroscopic high-frequency brain activity in the human visual system. Neurosci Biobehav Rev. 2001;25:527–534. doi: 10.1016/s0149-7634(01)00031-8. [DOI] [PubMed] [Google Scholar]
- 32.Lutzenberger W, Pulvermüller F, Birbaumer N. Words and pseudowords elicit distinct patterns of 30-Hz EEG responses in humans. Neurosci Lett. 1994;176:115–118. doi: 10.1016/0304-3940(94)90884-2. [DOI] [PubMed] [Google Scholar]
- 33.Lutzenberger W, Pulvermüller F, Elbert T, Birbaumer N. Visual stimulation alters local 40-Hz responses in humans: An EEG study. Neurosci Lett. 1995;183:39–42. doi: 10.1016/0304-3940(94)11109-v. [DOI] [PubMed] [Google Scholar]
- 34.Martinkauppi S, Rämä P, Aronen HJ, Korvenoja A, Carlson S. Working memory of auditory localization. Cereb Cortex. 2000;10:889–898. doi: 10.1093/cercor/10.9.889. [DOI] [PubMed] [Google Scholar]
- 35.Mecklinger A, Pfeifer E. Event-related potentials reveal topographical and temporal distinct activation patterns for spatial and object working memory. Brain Res Cogn Brain Res. 1996;4:211–224. doi: 10.1016/s0926-6410(96)00034-1. [DOI] [PubMed] [Google Scholar]
- 36.Miller EK, Cohen JD. An integrative theory of prefrontal cortex function. Annu Rev Neurosci. 2001;24:167–202. doi: 10.1146/annurev.neuro.24.1.167. [DOI] [PubMed] [Google Scholar]
- 37.Miltner WH, Braun C, Arnold M, Witte H, Taub E. Coherence of gamma-band EEG activity as a basis for associative learning. Nature. 1999;397:434–436. doi: 10.1038/17126. [DOI] [PubMed] [Google Scholar]
- 38.Müller MM, Bosch J, Elbert T, Kreiter A, Sosa MV, Sosa PV, Rockstroh B. Visually induced gamma-band responses in human electroencephalographic activity: a link to animal studies. Exp Brain Res. 1996;112:96–102. doi: 10.1007/BF00227182. [DOI] [PubMed] [Google Scholar]
- 39.Näätänen R, Winkler I. The concept of auditory stimulus representation in cognitive neuroscience. Psychol Bull. 1999;125:826–859. doi: 10.1037/0033-2909.125.6.826. [DOI] [PubMed] [Google Scholar]
- 40.Noreen EW. Computer intensive methods for testing hypotheses: an introduction. Wiley; New York: 1989. [Google Scholar]
- 41.Oldfield R. The assessment and analysis of handedness: The Edinburgh inventory. Neuropsychologia. 1971;9:97–113. doi: 10.1016/0028-3932(71)90067-4. [DOI] [PubMed] [Google Scholar]
- 42.Owen AM, Stern CE, Look RB, Tracey I, Rosen BR, Petrides M. Functional organization of spatial and nonspatial working memory processing within the human lateral frontal cortex. Proc Natl Acad Sci USA. 1998;95:7721–7726. doi: 10.1073/pnas.95.13.7721. [DOI] [PMC free article] [PubMed] [Google Scholar]
- 43.Owen AM, Herrod NJ, Menon DK, Clark JC, Downey SP, Carpenter TA, Minhas PS, Turkheimer FE, Williams EJ, Robbins TW, Sahakian BJ, Petrides M, Pickard JD. Redefining the functional organization of working memory processes within human lateral prefrontal cortex. Eur J Neurosci. 1999;11:567–574. doi: 10.1046/j.1460-9568.1999.00449.x. [DOI] [PubMed] [Google Scholar]
- 44.Petrides M. Dissocable roles of mid-dorsolateral prefrontal and anterior inferotemporal cortex in visual working memory. J Neurosci. 2000;20:7496–7503. doi: 10.1523/JNEUROSCI.20-19-07496.2000. [DOI] [PMC free article] [PubMed] [Google Scholar]
- 45.Press WH, Teukolsky SA, Vetterling WT, Flannery BP. Numerical recipes. Cambridge UP; Cambridge: 1992. [Google Scholar]
- 46.Pulvermüller F, Birbaumer N, Lutzenberger W, Mohr B. High-frequency brain activity: its possible role in attention, perception and language processing. Prog Neurobiol. 1997;52:427–445. doi: 10.1016/s0301-0082(97)00023-3. [DOI] [PubMed] [Google Scholar]
- 47.Pulvermüller F, Keil A, Elbert T. High-frequency brain activity: perception or active memory? Trends Cogn Sci. 1999;3:250–252. doi: 10.1016/s1364-6613(99)01344-3. [DOI] [PubMed] [Google Scholar]
- 48.Rauschecker JP, Tian B. Mechanisms and streams for processing of “what” and “where” in auditory cortex. Proc Natl Acad Sci USA. 2000;97:11800–11806. doi: 10.1073/pnas.97.22.11800. [DOI] [PMC free article] [PubMed] [Google Scholar]
- 49.Ruchkin DS, Johnson R, Grafman J, Jr, Canoune H, Ritter W. Multiple visuospatial working memory buffers: Evidence from spatiotemporal patterns of brain activity. Neuropsychologia. 1997;35:195–209. doi: 10.1016/s0028-3932(96)00068-1. [DOI] [PubMed] [Google Scholar]
- 50.Sarnthein J, Petsche H, Rappelsberger P, Shaw GL, von Stein A. Synchronization between prefrontal and posterior association cortex during human working memory. Proc Natl Acad Sci USA. 1998;95:7092–7096. doi: 10.1073/pnas.95.12.7092. [DOI] [PMC free article] [PubMed] [Google Scholar]
- 51.Scott SK, Blank CC, Rosen S, Wise RJ. Identification of a pathway for intelligible speech in the left temporal lobe. Brain. 2000;123:2400–2406. doi: 10.1093/brain/123.12.2400. [DOI] [PMC free article] [PubMed] [Google Scholar]
- 52.Singer W. Time as coding space in neocortical processing: A hypothesis. In: Gazzanigga MS, editor. The cognitive neurosciences. MIT; Cambridge: 1995. pp. 91–104. [Google Scholar]
- 53.Singer W, Gray CM. Visual feature integration and the temporal correlation hypothesis. Annu Rev Neurosci. 1995;18:555–586. doi: 10.1146/annurev.ne.18.030195.003011. [DOI] [PubMed] [Google Scholar]
- 54.Singer w, Engel AK, Kreiter AK, Munk MHJ, Neunschwander S, Roelfsema PR. Neuronal assemblies: necessity, signature and detectibility. Trends Cogn Sci. 1997;1:252–261. doi: 10.1016/S1364-6613(97)01079-6. [DOI] [PubMed] [Google Scholar]
- 55.Tallon-Baudry C, Bertrand O. Oscillatory gamma activity in humans and its role in object representation. Trends Cogn Sci. 1999;3:151–162. doi: 10.1016/s1364-6613(99)01299-1. [DOI] [PubMed] [Google Scholar]
- 56.Tallon C, Bertrand O, Bouchet P, Pernier J. Gamma-range activity evoked by coherent visual stimuli in humans. Eur J Neurosci. 1995;7:1285–1291. doi: 10.1111/j.1460-9568.1995.tb01118.x. [DOI] [PubMed] [Google Scholar]
- 57.Tallon-Baudry C, Bertrand O, Delpuech C, Pernier J. Stimulus specificity of phase-locked and non-phase-locked 40 Hz visual responses in humans. J Neurosci. 1996;16:4240–4249. doi: 10.1523/JNEUROSCI.16-13-04240.1996. [DOI] [PMC free article] [PubMed] [Google Scholar]
- 58.Tallon-Baudry C, Bertrand O, Wienbruch C, Ross B, Pantev C. Combined EEG, MEG recordings of visual 40 Hz responses to illusory triangles in human. NeuroReport. 1997;8:1103–1107. doi: 10.1097/00001756-199703240-00008. [DOI] [PubMed] [Google Scholar]
- 59.Tallon-Baudry C, Bertrand O, Peronnet F, Pernier J. Induced gamma-band activity during the delay of a visual short-term memory task in humans. J Neurosci. 1998;18:4244–4254. doi: 10.1523/JNEUROSCI.18-11-04244.1998. [DOI] [PMC free article] [PubMed] [Google Scholar]
- 60.Tallon-Baudry C, Kreiter A, Bertrand O. Sustained and transient oscillatory responses in the gamma and beta bands in a visual short-term memory task in humans. Vis Neurosci. 1999;16:449–459. doi: 10.1017/s0952523899163065. [DOI] [PubMed] [Google Scholar]
- 61.Weeks RA, Aziz-Sultan A, Bushara KO, Tian B, Wessinger CM, Dang N, Rauschecker JP, Hallett M. A PET study of human auditory spatial processing. Neurosci Lett. 1999;262:155–158. doi: 10.1016/s0304-3940(99)00062-2. [DOI] [PubMed] [Google Scholar]