Abstract
Activation of motoneurons innervating leech muscles causes the appearance of a two-dimensional vector field of deformations on the skin surface that can be fully characterized using a new technique (Zoccolan et al., 2001) based on the computation of the optical flow, the two-dimensional vector field describing the point displacements on the skin. These vector fields are characterized by their origin (i.e., the singular point) and by four elementary components that combine linearly: expansion (or compression), rotation, longitudinal shear, and oblique shear. All motoneurons can be classified and recognized according to the components of the deformations they elicit: longitudinal motoneurons give rise almost exclusively to longitudinal negative shear, whereas circular motoneurons give rise to both positive longitudinal shear and significant negative expansion. Oblique motoneurons induce strong oblique shear, in addition to longitudinal shear and negative expansion. Vector fields induced by the contraction of longitudinal, circular, and oblique fibers superimpose linearly. Skin deformations can therefore be attributed rather reliably to the contraction of distinct longitudinal, circular, and oblique muscle fibers. We compared the deformation patterns produced by touching the skin with those produced by intracellular stimulation of P, T, and N cells: vector fields resulting from the activation of P cells were almost identical to those produced by mechanical stimulation. Therefore, motor responses triggered by light or moderate touch are almost entirely mediated by excitation of P cells, with minor contributions from T and N cells.
Keywords: sensory-motor interaction, motoneurons, optical flow, videomicroscopy, leech, mechanosensory neurons, computer vision
A major goal of neuroscience is describing the neuronal pathways linking sensory input and motor output. Exhaustive analysis of these pathways is difficult in higher vertebrates, but is possible in invertebrates (Nicholls and Baylor, 1968; Stuart, 1970; Byrne et al., 1974; Castellucci and Kandel, 1974;Stent et al., 1978; Kristan, 1982; Wittenberg and Kristan, 1992a,b;Tsau et al., 1994; Frost and Kandel, 1995). In the leech, mechanical inputs are transduced by seven pairs of mechanosensory neurons; three specific for light pressure (touch or T cells), two for strong pressure (pressure or P cells), and two for noxious mechanical stimuli (N cells), (Nicholls and Baylor, 1968; Kristan et al., 1982; Lewis and Kristan, 1998a; Pinato and Torre, 2000). The leech motor system consists of 19 pairs of excitatory motoneurons in each ganglion that innervate longitudinal, oblique, and circular fibers (Stuart, 1970; Ort et al., 1974; Mason and Kristan, 1982; Norris and Calabrese, 1987). These motoneurons have been extensively investigated using force and length transducers and electrophysiology tools (Stuart, 1970; Kristan, 1982; Mason and Kristan, 1982; Norris and Calabrese, 1987). However, exhaustive analysis of the relation between mechanosensory stimulation and motoneuron activation has not been performed.
We characterize here skin contractions of a segment of the leechHyrudo medicinalis by using videomicroscopy and computing optical flow from these images (Zoccolan et al., 2001). Stimulation of each motoneuron induces a characteristic optical flow, a two-dimensional vector field that can be characterized by specifying where the contraction occurs, the location of the singular point (the stationary point of the contraction), and the elementary deformations of the vector field (Giachetti and Torre, 1996; Zoccolan et al., 2001). The deformations induced by longitudinal, circular, and oblique motoneurons are sufficiently different so that these classes can be easily distinguished. Furthermore, deformations induced by different motoneurons sum linearly, i.e., add in the simplest way. Any given skin deformation can be decomposed into components caused by contraction of longitudinal, circular, and oblique muscles. Therefore, by viewing a piece of skin when different mechanosensory neurons are stimulated, it is possible to identify which classes of motoneurons are activated.
We show that motor responses initiated by light or moderate mechanical stimulation are almost entirely mediated by P cells. Mechanical stimulation and electrical excitation of P cells induce contractions with an almost identical shape and sustained by coactivation of both longitudinal and circular fibers. T cells, when individually activated, induce a much weaker skin contraction, with a different shape. They have a minor role in mediating local motor responses, although when coactivated with P cells, they can potentiate the contraction (Kristan, 1982). The N cells are not activated by light mechanical stimulation and do not contribute to local motor responses. These results indicate that the local bending response (Kristan, 1982; Lockery and Kristan, 1990a,b; Lewis and Kristan, 1998b), during which the leech bends away from the stimulated site, is sustained by coactivation of circular and longitudinal motoneurons and is almost entirely mediated by P cell activation.
MATERIALS AND METHODS
Animals and preparations. Hirudo medicinalis were obtained from Ricarimpex (Eysines, France) and kept at 5°C in tap water dechlorinated by aeration for 24 hr. Three preparations were used.
The first preparation consisted of a hemisection of the leech skin, approximately three segments in length (15 annuli), isolated from the rest of the body. One boundary of this preparation was formed by the dorsal midline of the animal; the other boundary was between the lateral line and the ventral midline of the animal. The skin was flattened and fixed with small pins to the bottom of the recording chamber, but allowed to deform during muscle contraction. The middle segment was kept innervated by its ganglion. The connective and the roots emerging from the opposite side of the ganglion were pinned to allow easy intracellular recordings from the cell bodies of motoneurons and mechanosensory neurons in the ganglion.
A second preparation was used to more precisely study the dependence of motor response on the region of skin touched during mechanical stimulation. In comparison with the previous preparation, the differences were: (1) the inferior boundary coincided precisely with the ventral midline of the animal body and (2) the ganglion innervating the central segment was not exposed. This preparation offered two main advantages: (1) the skin could be stimulated near the ventral midline and (2) the roots innervating skin and muscles were perfectly intact because they had not been cleaned and exposed. For these reasons this preparation was used to verify that motor responses observed in the first kind of preparation were not affected by some dissection induced abnormality in muscle and skin innervation.
The third preparation was an intact leech. The head and the tail of the animal were pinned on a Sylgard dish, and the body was stretched. Two or three central segments were flattened and secured to the Sylgard dish with four pins. This portion of body wall and various free segments along the body were mechanically stimulated to verify the consistency of the motor responses in the intact animal and reduced preparations.
All preparations were kept in a Sylgard-coated dish at room temperature (20–24°C). During dissection the preparation was bathed in a Ringer's solution with the following composition (mm): 115 NaCl, 1.8 CaCl2, 4 KCl, 12 glucose, and 10 mm Tris maleate, buffered to pH 7.4 with NaOH (Muller et al., 1981).
Imaging. One standard CCD camera (640 × 480 pixels) was mounted on a dissecting microscope. Images of the contracting leech skin were acquired at 5 or 8.3 Hz and stored on a personal computer using a frame grabber DT3155 (Data Translation, Marlboro, MA) and the acquisition software Axon Imaging Workbench 2.2 (Axon Instruments, Foster City, CA).
Electrical recordings. The electrical activity of motoneurons and mechanosensory neurons was monitored by intracellular recordings with sharp electrodes (input resistance 30 MΩ filled with 4 m potassium acetate) using Axoclamp-2b amplifiers (Axon Instruments). Depolarizing current pulses were passed through the electrodes into the cell bodies to evoke a spike discharge. Intracellular and extracellular voltage recordings were digitized at 10 kHz, stored on a personal computer, and analyzed with the program Clampex 8 (Axon Instruments). Axon Imaging Workbench 2.2 and Clampex 8 can run simultaneously on the same computer, allowing the synchronized acquisition of images and electrical signals.
Mechanical stimulation. In some experiments a brief (200–400 msec) mechanical stimulus was delivered to the skin. The stimulus consisted of a poke with a nylon filament driven by a solenoid (347–652 RS components), as previously described (Lewis and Kristan, 1998a; Pinato and Torre, 2000). Different stimulus intensities were achieved by changing the diameter and the length of the filaments (Levin et al., 1978). A force transducer (HONEYWELL FSG-15N1A) measured the force exerted by each filament that was used. Filaments delivering stimulus intensities of ∼20 and 50 mN were used.
Analysis of the skin deformations. Muscle fiber contraction evokes in tissue a two-dimensional force field. Force or displacement transducers, providing a single scalar measure, cannot properly quantify this vector field. As described in Zoccolan et al. (2001), this problem can be circumvented by acquiring image sequences of the contracting tissue and using standard vector analysis techniques to analyze them.
Computing the optical flow. A window-matching algorithm that searches for the most similar patterns of gray levels in consecutive images is used to track points from one image to the next one (Aggarwal and Nandhakumar, 1988; Anadan, 1989; Aschwanden and Guggenbuhl, 1992;Giachetti, 2000; Zoccolan et al., 2001). When applied over a dense grid of points, this algorithm obtains a dense representation of the occurring displacements, referred to in computer vision as optical flow (Horn and Schunck, 1981; Verri and Poggio, 1989; Giachetti, 2000;Zoccolan et al., 2001). Given a sequence of imagesI(x, y, i), withi = 1,… ,N, and given a grid of points x⃗ = (x, y) on the image plane, the optical flow O⃗Ti(x⃗) = (uTi(x⃗), vTi(x⃗)) is the total displacement of the features centered on from image 1 to image i. uTi(x⃗) andvTi(x⃗) are, respectively, thex and y component of the displacement at every point x⃗. In the following, the vector field of deformations represented by the optical flow computed from an image sequence will be simply referred to as the vector field induced by that particular skin contraction.
To monitor the time evolution of a deformation, a sequence of instantaneous optical flows O⃗i can be computed, where each flow O⃗i is the instantaneous displacement, i.e., the displacement from imagei − 1to image i, of the featuresx⃗ (Zoccolan et al., 2001).
Linear deformation theory. The obtained optical flows can be further analyzed by linearizing them. In the case of a planar deformation, the optical flowO⃗Ti(x⃗) can often be very well approximated by a linear vector field (Giachetti and Torre, 1996) V⃗D(x⃗) =L(x⃗ − p⃗), where p⃗ is the stationary point of the deformation (referred to in the following as singular point) and L is the matrix describing the linear planar deformation. It is well known (Sommerfeld, 1974) that the matrixL can be decomposed as:
| Equation 1 |
where
| Equation 2 |
are the elementary deformation components: expansion, rotation, and shears, respectively (Giachetti and Torre, 1996). Equation 1 states that each linear planar vector fieldV⃗D is simply the sum of four elementary deformations, defined by the four matrixes in which matrixL is decomposed. The coefficients E,ω, S1, andS2 determine which is the relative weight of each elementary deformation ofV⃗D. A sketch of these four elementary fields is provided in Figure1.
Fig. 1.
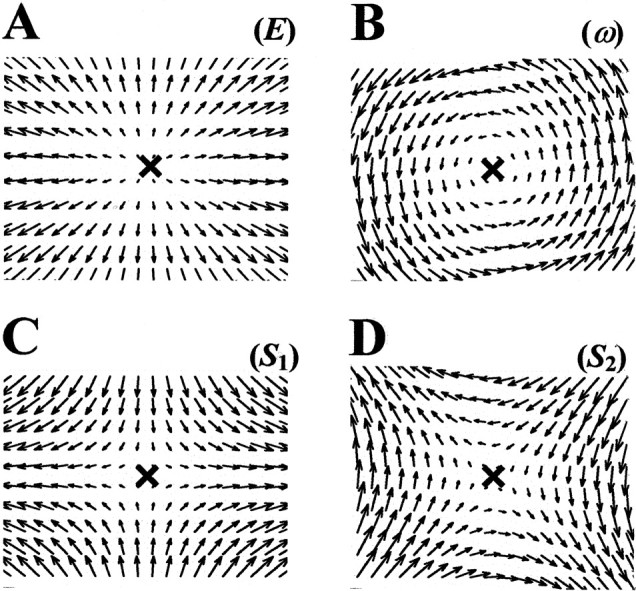
A sketch of the elementary deformations.A, Expansion (E).B, Rotation (ω). C, Horizontal shear (S1).D, Oblique shear (S2).
The parameters E, ω,S1 andS2, together with the coordinatespx and py of the singular point p⃗, completely determine every linear planar vector field V⃗D.In the following, the set of parameters E, ω,S1 andS2 will be referred to as the elementary deformations.
The singular point coordinates px andpy are measured in pixels. The elementary deformation components E, ω,S1, andS2 are pure numbers, and their magnitude varies from deformation to deformation. Usually a component can be considered negligible when its absolute value is at least five times lower than the absolute value of the biggest component.
RESULTS
Characterization of the contractions induced by leech motoneurons
The first preparation described in Materials and Methods was used to characterize the leech skin contractions induced by excitatory motoneurons. Individual leech motoneurons were stimulated to obtain a strong, sustained contraction of the corresponding muscles. The resulting skin movements were viewed with a CCD camera mounted on a dissecting microscope. Image sequences of the contracting skin were acquired at 5 Hz and analyzed as described in Zoccolan et al. (2001)and Materials and Methods to obtain optical flows: the two-dimensional vector fields that described the displacement of a 30 × 20 point grid on the leech skin. Each optical flow was computed from the resting state to the time of maximal contraction.
Figure 2 shows the optical flows obtained during maximal contraction produced by the stimulation of nine motoneurons: longitudinal L (A); dorsal longitudinal excitatory (DE) 3 (B); DE 5 (C); DE 107 (D); ventral longitudinal excitatory (VE) 8 (E); VE 108 (F); oblique excitatory (OE) 110 (G); circular ventral (CV) (H); and flattener excitatory (FE) 109 (I). In each panel the arrowheads indicate movement direction and the arrow length indicates displacement. The optical flows are drawn on a gray background showing pieces of body wall whose contractions were analyzed.
Fig. 2.
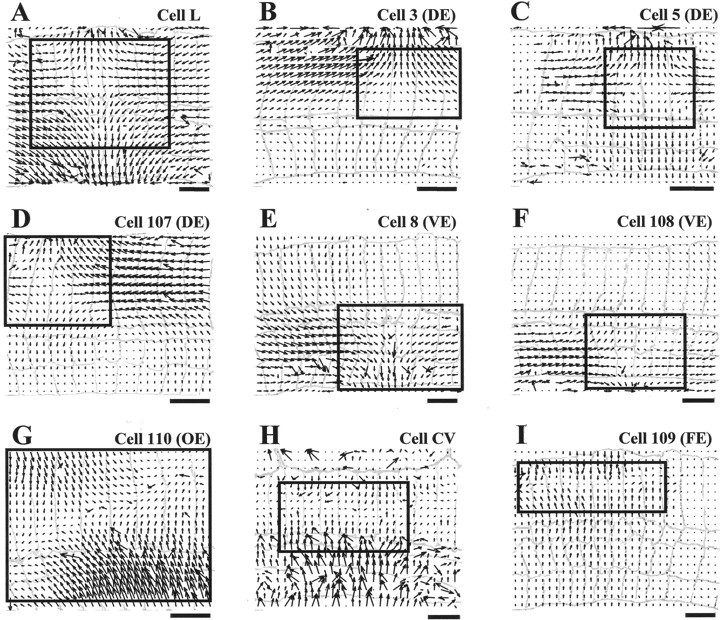
Optical flows associated with nine different leech motoneurons. A–I show the optical flow computed on a 30 × 20 grid for the skin deformations caused by intracellular stimulation of motoneurons L, 3, 5, 107, 8, 108, 110, CV, and 109, respectively. The data were obtained from seven different preparations. Each motoneuron was stimulated with a depolarizing step of current causing a spike discharge between 30 and 40 Hz and lasting from 1 to 6 sec. Optical flows were obtained as described in Zoccolan et al. (2001)and Materials and Methods. A drawing of the segment annuli is shown ingray in each panel, and annulus width is between 0.5 and 0.8 mm. Scale bars, 2 mm. The top boundary of the preparation is the dorsal midline of the body; thebottom boundary is between the lateral line and the ventral midline. Anterior is to the left. The central annulus of the innervated segment is, starting fromleft: the sixth for A, G,H, and I; the fifth for B,D, and F; the fourth forC; and the eighth for E. The region of optical flow framed by the solid box was used to compute the linear approximations shown in Figure 3. To make the direction of the movement more clear, the fields shown in E,F, G, and I are drawn with a magnification respectively 1.5, 2, 1.5, and 2× larger.
These flows are in excellent agreement with the deformations expected from previous descriptions of these motoneurons (Stuart, 1970). Motoneurons L, 3, 5, 107, 8, and 108 innervate longitudinal muscles, muscles that run parallel to the length of the leech and are responsible for its shortening (Nicholls and Purves, 1970; Stuart, 1970; Kristan, 1982; Mason and Kristan, 1982). The L motoneuron innervates the whole half-segment, and the corresponding contraction involves all of the skin, with the center approximately in the middle of the half-segment. Motoneurons 3, 5, and 107 are dorsal excitors, innervating only the dorsal fibers of the longitudinal muscles, and their contraction involves mainly the dorsal side of the half-segment. Motoneurons 8 and 108 are ventral excitors and deform the ventral part of the skin. Cell 110 (Stuart, 1970) excites oblique muscle fibers and induces a contraction in an oblique direction in respect to the length of the leech. The CV motoneuron innervates circular fibers situated in the lateral ventral side of the half segment (Stuart, 1970) and induces a contraction in the transverse direction with a displacement field perpendicular to that induced by the longitudinal motoneurons. Motoneuron 109, referred to as the flattener (Stuart, 1970), innervates dorsoventral fibers, responsible for the flattening of the leech body. Its activation induces a transverse contraction similar to that produced by the CV motoneuron.
The optical flows shown in Figure 2 can be approximated with linear vector fields. Figure 3A–Iillustrates the best linear vector fields approximating the corresponding optical flows reported in Figure 2. For each deformation, the linear approximation was computed in a region surrounding the stationary point. This linearization region is indicated by the window drawn in each panel of Figures 2 and 3 (the position of the stationary point is indicated by the X). Comparison of corresponding panels in Figures 2 and 3 shows that the linear approximation is satisfactory in the area of skin where the original optical flow (Fig. 2) is large and poor outside it. This is not surprising because almost all leech motoneurons innervate selectively just a narrow region of muscles in a half segment. For this reason, in almost all the panels of Figure 2 the contraction is restricted to a small area of the skin. By definition, the amplitude of a planar vector field increases linearly while moving away from the singular point (Fig. 3). This explains why linear approximations have large amplitude in areas where corresponding real optical flows are almost zero. For example, in cell 3 (a dorsal excitor) the linear approximation is good not only inside the linearization region but also in a wider dorsal area of the skin where the deformation amplitude is significantly greater than zero (compare Figs. 2B and3B). On the contrary, in the ventral region the deformation is almost zero and a comparison with the linear approximation is not appropriate. In summary, the contraction induced by each motoneuron is approximately linear in the skin area that is being functionally innervated. In this area, the optical flow and its linear approximation are highly repeatable from preparation to preparation, allowing a precise classification of the different classes of motoneurons (Fig.5). Outside this area the optical flow is almost null, and its shape is variable from preparation to preparation. This is because the observed deformation is passively driven by the active part of the skin and it is significantly influenced by the location of pins holding the preparation.
Fig. 3.
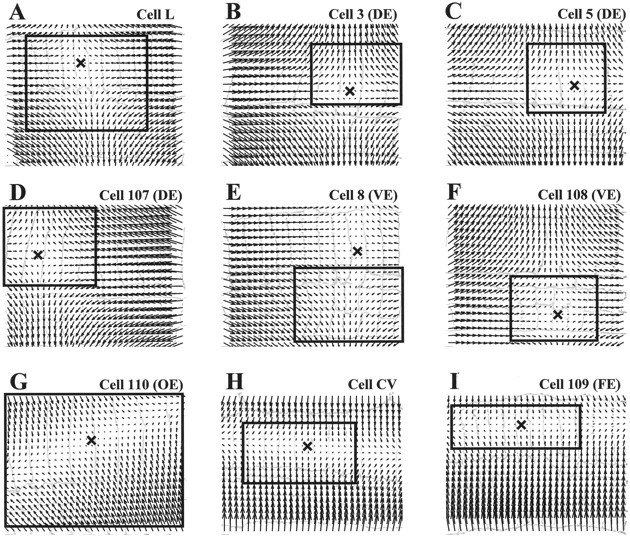
Linear approximations of the optical flows.A–I show the vector fields obtained by linearly approximating the optical flows shown in the solid boxesin the corresponding panels of Figure 2. In each, the Xindicates the position of the singular point. The drawings of the segment annuli are the same as Figure 2. The agreement between the original optical flow (Fig. 2), and the linear approximation (Fig. 3) is good within the box and in the skin area mainly involved in the contraction and poor outside.
Fig. 5.
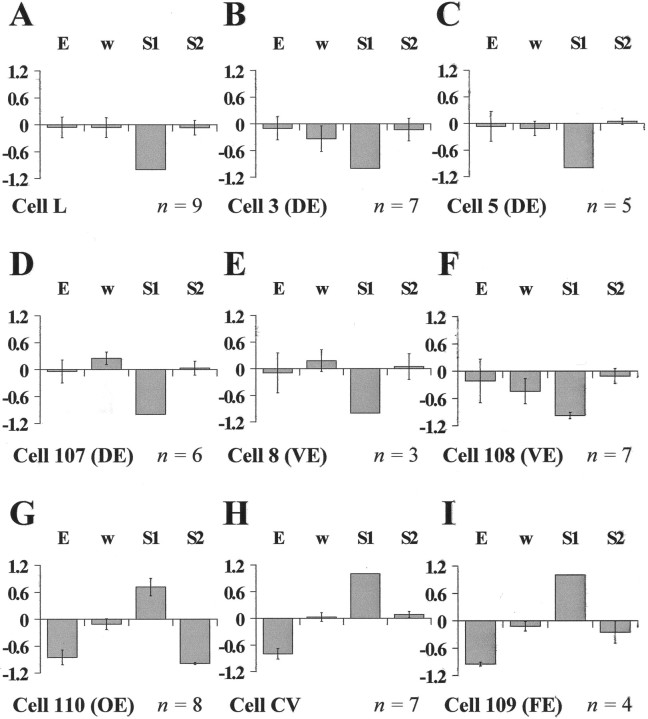
The average relative weights of the elementary deformations for different leech motoneurons. A–I show the mean relative weight of expansion (E), rotation (ω), and the two shearsS1 and S2 for the nine motoneurons analyzed in Figures 2 and 3. All components were normalized to the largest of them before averaging. The number of preparations used for each motoneuron is reported in the bottom right corner of each panel. Error bars indicate SEM.
Note that the use of linear approximations in characterizing motoneuron contractions was primarily suggested by the finding that almost all optical flows induced by leech motoneurons had only one singular point, i.e., only one stationary point. This is the first requirement for a vector field to be linear (Sommerfeld, 1974). Indeed, all optical flows shown in Figure 2 and in the following figures have only one singular point. The only exception is the optical flow shown in Figure2D, which has another singular point located in the ventral side of the skin (sixth annulus from left; the vector field rotates around it). This area, which is only passively moving, is not included in the linearization region (Figs. 2D,3D, box) for the reasons previously discussed. In characterizing the contraction the only relevant singular point is located inside the linearization region, in the dorsal side of the skin, where the deformation is large (Fig. 3D, X).
Approximating skin deformations with linear vector fields is a powerful tool, because, as recalled in Materials and Methods, every planar linear field is uniquely characterized by a set of six parameters (Giachetti and Torre, 1996; Zoccolan et al., 2001). These parameters are the coordinates px andpy of the singular point and the four elementary deformations E, ω,S1, andS2, defined by Equation 2. The computation of these six parameters allows a quantitative and reliable comparison among the deformations induced by different types of motoneurons in the same preparation and in segments dissected from different animals. The result of this comparison, for the nine types of motoneurons previously analyzed in Figures 2 and 3, is reported in Figures 4 and5.
Fig. 4.
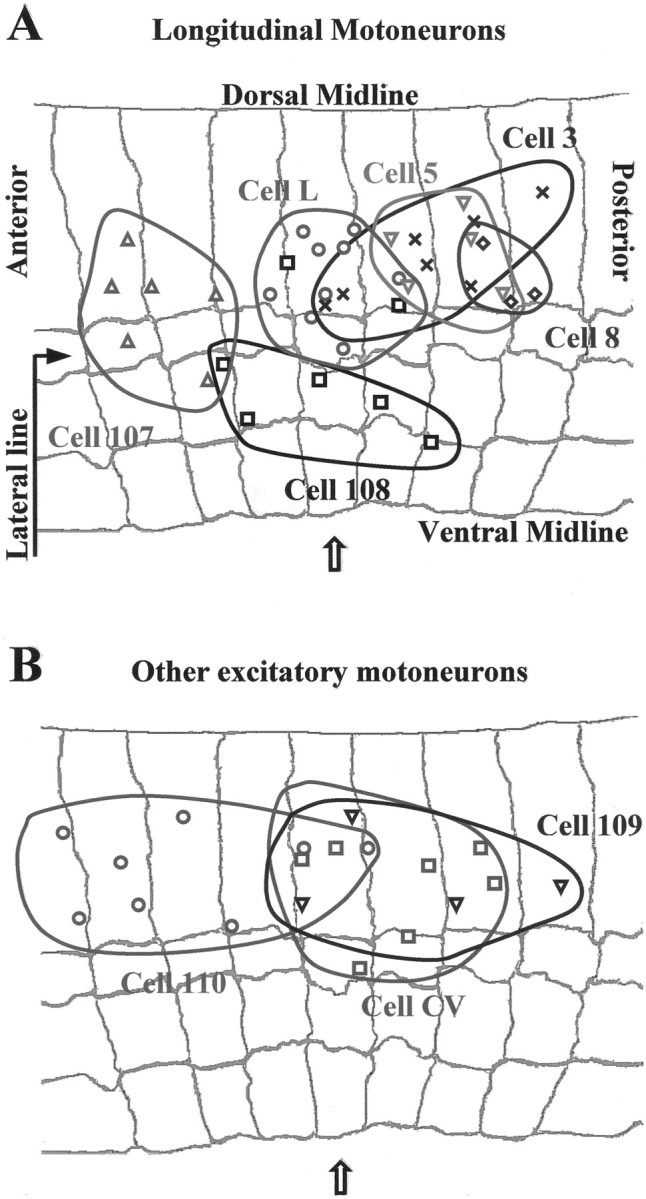
Distribution of the location of the singular points for the skin deformations induced by individual motoneurons in different preparations. A, The singular points of longitudinal motoneurons L (○), 3 (X), 5 (▿), 107 (Δ), 8 (⋄), and 108 (■) in nine, seven, five, six, three, and seven, different preparations, respectively. B, The singular points of the oblique motoneuron 110 (○), the circular motoneuron CV (■), and the flattener motoneuron 109 (▿) in eight, seven, and four different preparations, respectively. The gray background in A and B reproduces the annular margins of a representative body wall preparation; thearrow indicates the central annulus.
Figure 4 shows the singular point positions of the various motoneurons in different preparations. The gray background reproduces the annular margins of a representative body wall preparation; the central annulus is indicated by the arrow. A shows the singular point positions for the contractions induced by longitudinal motoneurons 3, 5, 8, 107, 108, and L. In A six specific regions, in which singular points of each motoneuron aggregate, are apparent. The size of these regions varies from 1.5 to 3 mm in the longitudinal direction (2–4 annuli) and from 1 to 2.5 mm in the transverse direction. As shown in B, singular points of oblique, circular, and flattener motoneurons aggregate in clusters of slightly wider area (the singular points of motoneuron 110 span approximately five annuli).
Figure 5 summarizes the relative weights of the four elementary deformations E, ω,S1 andS2, for the nine motoneuron types shown in the previous figures. In each histogram, the gray bars are the mean relative weights of each elementary deformations (before being averaged, the elementary deformations were normalized to the absolute value of the largest of them). Negative longitudinal shearS1 was the main deformation component in contractions induced by longitudinal motoneurons (S1 = −1, with SD = 0, for almost all of the longitudinal motoneurons analyzed in the figure). The other elementary deformation components were negligible. Their mean relative weight was usually lower than 0.15 (in absolute value) and if it reached higher values (as the rotation component ‖ω‖ > 0.25 for motoneurons 3, 107, and 108), its uncertainty was large. Motoneurons inducing transverse contractions (cell CV and cell 109) were characterized by high-positive longitudinal shearS1 and high-negative expansionE. The oblique motoneuron (cell 110) was characterized by high-negative oblique shear S2, high-positive S1, and high-negative expansion E. For all motoneurons inducing longitudinal and transverse contractions, the main elementary deformation was ‖S1‖ = 1 with no uncertainty, i.e., 0 SD. The only exception was cell 108, in which, in one of seven experiments, ‖ω‖ was bigger than ‖S1‖, and for this reason the uncertainty, and the SD, on S1 is not 0. The same consideration applies to cell 110, in which, in one of eight experiments, ‖E‖ was bigger than the main elementary deformation ‖S2‖.
Figure 5 shows that the contractions induced by single motoneurons can be classified on the basis of their main elementary deformations. This classification is highly reliable because the uncertainty of the relative weight of the main elementary deformations is low (see the error bars in Fig. 5). Moreover, this classification is in strict agreement with the anatomical arrangement of the leech muscle fibers (Stuart, 1970): (1) longitudinal (highS1 < 0); (2) circular and flattener (high S1 > 0 andE1 < 0); (3) oblique (highS2, S1 > 0, and E < 0). More precise classification of the contractions can be achieved by exploiting the differences in the location of the singular point for contractions induced by motoneurons belonging to the same class (Fig. 4). Even finer classification can be obtained by looking at the region of the skin involved in the contraction, as originally done by visual inspection by Stuart (1970). For example, motoneurons L and 3 produce almost a pure negative longitudinal shear S1 (Fig.5A,B), and the regions in which the singular points can be found are partially overlapping (Fig. 4A). Nevertheless, the deformation induced by motoneuron 3 is restricted to the dorsal side of the skin (Fig. 2B), whereas the contraction of motoneuron L affects both the ventral and dorsal part of the skin (Fig. 2A). Also, the motoneurons CV and 109 have similar elementary deformations (Fig. 5H,I), but the contraction of motoneuron 109 is primarily evident in the dorsal part (Fig. 2I), whereas that of the CV motoneuron is in the ventral part (Fig. 2H).
Table 1 summarizes these properties for nearly well characterized excitatory motoneurons of the leech segmental ganglion. In addition to the nine motoneurons previously described, the classification of other longitudinal (cells 4 and 106), circular (cells 12 and 112), and oblique (cell 111) motoneurons is provided on the base of: (1) the area of skin involved in the contraction, (2) the location of its singular point, and (3) its major elementary deformations. The number of preparations used to validate the classification presented in Table 1 ranges from 3 to 10, depending on the analyzed motoneuron.
Table 1.
Properties of excitatory leech motoneurons
| Motoneuron | Area of contraction | Location of singular point | Major components |
|---|---|---|---|
| 3 | Dorsal | Dorsal/middle-post. | S1< 0 |
| 4 | Ventral | Dorsolateral/post. | S1 < 0 |
| 5 | Dorsal | Dorsal/post. | S1 < 0 |
| 8 | Ventral | Dorsal/post. | S1 < 0 |
| 12 | Ventrolateral | Lateral/middle | S1 > 0; E < 0 |
| 106 | Whole segment | Dorsolateral/middle | S1< 0 |
| 107 | Dorsal | Lateral/ant. | S1 < 0 |
| 108 | Ventral | Ventrolateral/middle | S1 < 0 |
| 109 | Dorsolateral | Dorsal/middle-post. | S1 > 0; E < 0 |
| 110 | Whole segment | Dorsal/middle-ant. | S2< 0; S1 > 0; E < 0 |
| 111 | Whole segment | Dorsal/middle-post. | S2 > 0; S1> 0; E < 0 |
| 112 | Dorsolateral | Dorsal/middle-post. | S1 > 0; E < 0 |
| CV | Ventrolateral | Dorsolateral/middle-post. | S1> 0; E < 0 |
| L | Whole segment | Dorsolateral/middle | S1 < 0 |
Four classes of motoneurons are analyzed: (1) longitudinal motoneurons 3, 4, 5, 8, 106, 107, 108, and L; (2) circular motoneurons 12, 112, and CV; (3) oblique motoneurons 110 and 111; and flattener motoneuron 109. The classification of the motoneurons is provided on the basis of (1) the area of skin involved in the contraction (from ventral to dorsal, along the transverse direction, parallel to the body annuli); (2) the location of its singular point (from ventral to dorsal, along the transverse direction and from anterior to posterior, along the longitudinal direction); (3) its major elementary deformations. The number of preparations used to validate the classification ranges from 3 to 10, depending on the analyzed motoneuron.
Time evolution of the contractions induced by single motoneurons
Figure 6 shows the time evolution of the elementary deformations for the contractions induced by motoneurons 107 (A), 110 (B), and 12 (C), chosen as representative of the three possible classes of motoneuron contractions. The instantaneous values of the elementary deformations for cells 107 and 110 were obtained by computing and linearizing a sequence of 19 optical flows every five frames of the original image sequence (100 images). In the same way, nine optical flows were computed and linearized from the sequence of 50 images describing the contraction induced by cell 12. The bar in the top of each panel gives the duration of the spike discharge induced in each motoneuron. Note that the ordinate values are velocities; these plots show how the rates of change of each elementary deformation proceed throughout the contraction that each motoneuron induces.
Fig. 6.
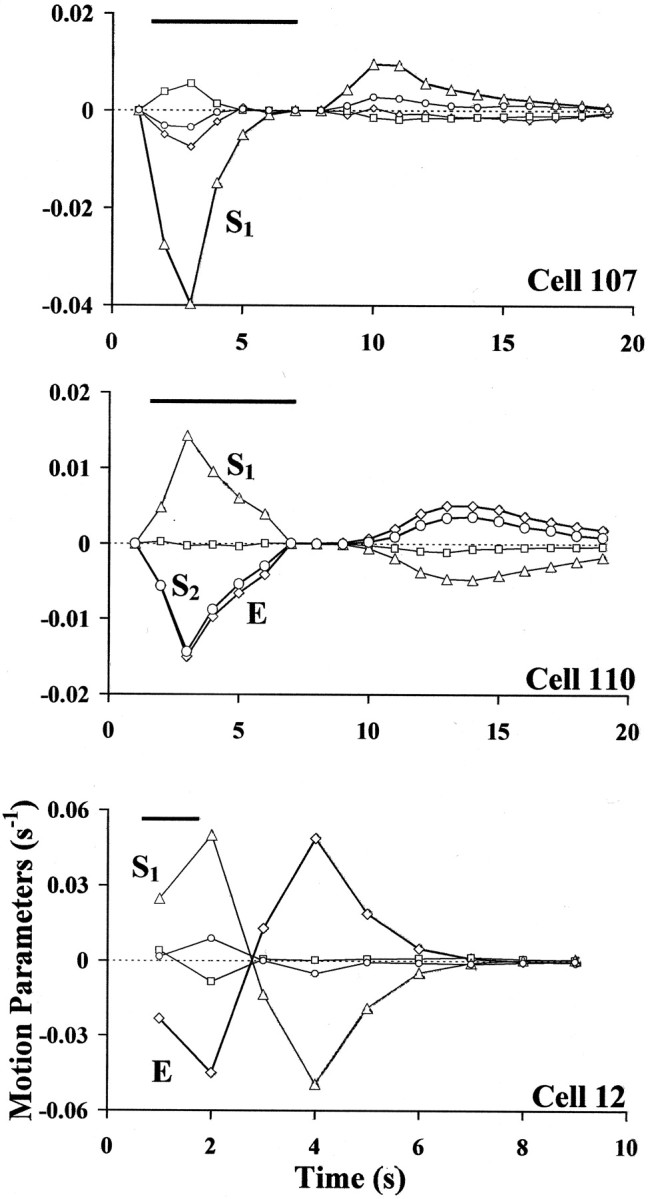
Dynamics of the deformations induced by three different classes of motoneurons. The time course of the elementary deformations for the contractions induced by motoneurons 107 (A), 110 (B), and 12 (C) were obtained from the sequence of instantaneous optical flows. The motoneurons were stimulated to fire at a frequency between 20 and 40 Hz for 6 (cell 107 and 110) or 1 (cell 12) sec. The bar at the top of each panel shows stimulation duration. The units in which the time varying deformations are expressed in seconds−1 because the data were calculated from every fifth image and the images were acquired at 5 Hz. Each panel shows the time evolution of expansion E(⋄), rotation ω (■), longitudinal shearS1 (Δ), and oblique shearS2 (○).
Motoneuron 107 is an excitor of the ventral longitudinal muscles. Its main elementary deformation was a negative longitudinal shearS1 (Fig. 5D). The contraction phase lasted from second 2 to second 6; the relaxation phase started at second 9, 2 sec after the cessation of the stimulus. From second 7 to second 8 the skin reached a stationary phase with not appreciable movements. Figure 6A shows that the relative amplitude of the four elementary deformations did not appreciably change during the whole deformation.S1 was consistently the main component of the deformation, simply reversing its sign in the transition from the contraction to the relaxation phase. Figure 6Aalso shows that, for cell 107, the contraction phase was much shorter and faster (high and narrow negative peak ofS1) than the relaxation phase (smaller and broader positive peak of S1).
The time course of the deformation of motoneuron 110 was similar; the deformation consisted of a short and rapid contraction, a stationary phase, and a long slow relaxation. The main elementary deformations (S2,S1, and E), had an almost identical time course.
Cell 12 (an excitor of the ventrolateral circular muscles) showed a similar time course of its main elementary deformations:S1 and E. The main difference from the previous contractions was that the relaxation phase was shorter and faster: the peaks ofS1 and E in the relaxation phase were as large as their peaks in the contraction phase. As a general rule, contractions induced by the excitors of circular muscles always relaxed faster than the contractions induced by longitudinal and oblique motoneurons (data not shown).
The elementary deformations of the other longitudinal and circular motoneurons had similar time courses. For each motoneuron the relative amplitudes of the four elementary deformations did not appreciably change during the whole deformation. That is, although the amplitude of the vectors changed with time, according to the intensity of the contraction, the direction of the vectors was substantially constant, simply reversing sign from contraction to relaxation.
Combination of vector fields induced by single motoneurons
The characterization of skin deformations described in the previous sections was obtained when each motoneuron was stimulated individually. We next investigated how skin deformations induced by individual motoneurons add when two or more motoneurons are simultaneously activated.
Let us first consider the case when two longitudinal motoneurons, such as the L motoneuron and the dorsal longitudinal motoneuron 5, were coactivated. Figure 7, A andB, shows the optical flows induced by stimulation of motoneurons L and 5 individually. C shows the optical flow induced by identical simultaneous stimulation of the two motoneurons.D compares the vector field shown in C(black) to the vector field obtained by linear superposition of the vector fields shown in A and B(red). The black and red vector fields are very similar, indicating a simple linear summation of the skin deformations induced by the individual motoneurons. E shows the values of the elementary deformations for the contractions induced by the individual stimulation of cells L (gray histogram) and 5 (white histogram). F shows: (1) in gray, the elementary deformations for the contraction obtained by the simultaneous stimulation of the two motoneurons and (2) in red, the sum of the elementary deformations obtained for the individual stimulation of the two neurons (each red bar in F is the sum of the corresponding gray and white bars inE). E and F show that all three vector fields drawn in A–C are characterized by a large negative value of S1 and negligible values ofE, S2, and ω, showing that the contraction resulting from the simultaneous activation of two longitudinal motoneurons is still an almost pure negative longitudinal shear. Moreover the gray and red bars in F are almost identical, indicating that also the elementary deformations add linearly.
Fig. 7.
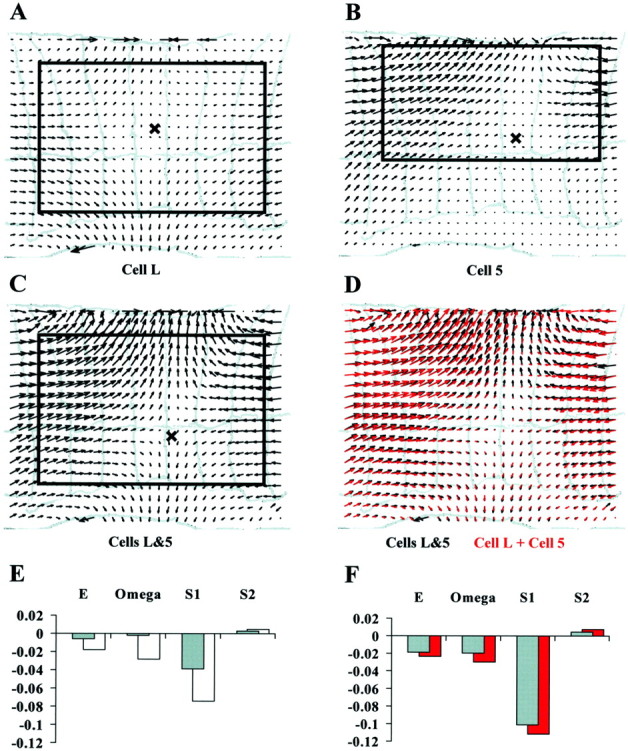
Superposition of the deformations evoked by motoneurons innervating the same class of muscle fibers.A, Optical flow after longitudinal motoneuron L stimulation with a current pulse lasting 5 sec and evoking a spike discharge of ∼14 Hz. B, Optical flow after longitudinal motoneuron 5 stimulation with a current pulse lasting 5 sec and evoking a spike discharge of ∼34 Hz. C,Optical flow after identical simultaneous stimulations of both longitudinal motoneurons. D, Sum of the optical flows shown in A and B (red) compared with the optical flow shown in C(black). E, Elementary deformations of the optical flows shown in A and B (L,gray bars; 5, white bars).F, Sum of the elementary deformations of motoneurons L and 5 (red bars) compared with the elementary deformations of the optical flow shown in C(gray bars). The width of the annuli inA–D is ∼0.8 mm. Equal normalization inE and F.
Let us now consider the case when two motoneurons innervating different muscle fibers are simultaneously stimulated. Figure8, A and B, shows the optical flows induced by individual stimulation of circular motoneuron 112 and of longitudinal motoneuron 5. C shows the optical flow obtained by identical simultaneous stimulation of the two motoneurons. D compares the vector field shown inC (black) to the linear superposition of the vector fields shown in A and B (red). The black and red vector fields in D are very similar, indicating that simultaneous activation of cells 5 and 112 induces a skin deformation that is an almost perfect linear summation of the deformations the individual motoneurons induced.
Fig. 8.
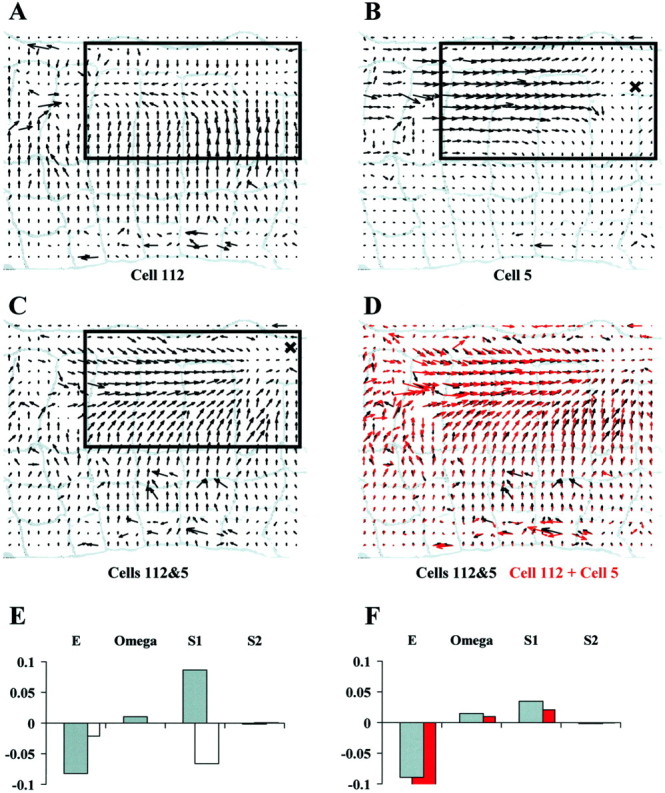
Superposition of the deformations evoked by motoneurons innervating different muscle fiber classes.A, Optical flow after circular motoneuron 112 stimulation with a current pulse lasting 5 sec and evoking a spike discharge of ∼28 Hz. B, Optical flow after longitudinal motoneuron 5 stimulation with a current pulse lasting 5 sec and evoking a spike discharge of ∼42 Hz. C, Optical flow after identical simultaneous stimulation of both motoneurons. D, Sum of the optical flows shown inA and B (red) compared with the optical flow shown in C (black).E, Elementary deformations computed for the optical flows shown in A and B (112, gray bars; 5, white bars). F, Sum of the elementary deformations of motoneurons 112 and 5 (red bars) compared with the elementary deformations of the optical flow shown in C (gray bars). The width of the annuli in A–D is ∼1 mm. Equal normalization in E and F.
The analysis of the elementary deformations shows that the combination of a longitudinal and of a circular motoneuron leads to a vector field characterized by a large negative value of E as the main deformation component. In the following, we will refer to this kind of skin deformation (characterized by large E and smaller values of S1,S2, and ω) as acompression. Figure 8E reports the values of the elementary deformations induced by individual stimulation of cells 112 (gray histogram) and 5 (white histogram). As expected, the contraction induced by the longitudinal motoneuron is almost entirely characterized by a large negative value of S1, whereas that induced by the circular motoneuron by a large positive value ofS1 and a large negative value ofE. Figure 8D shows the elementary deformations induced by simultaneous stimulation of the two motoneurons (gray bars) and the sum of the elementary deformations induced by individual stimulation of the two neurons (red bars). The gray and red bars in F are almost identical, indicating that the elementary deformations add linearly. Because of this linear summation, when a longitudinal and a circular motoneuron are simultaneously activated the resulting vector field has a small value of S1 but a significant negative value of E, corresponding to a local compression. This suggests that a compression requires the simultaneous activation of at least one longitudinal and one circular motoneuron.
This deduction was supported by simultaneous recordings from different pairs of longitudinal and circular (or flattener) motoneurons, such as: motoneurons 3 and 112 (data not shown); motoneurons 108 and 12 (data not shown); motoneurons L and 109 (data not shown). These experiments clearly showed that when a longitudinal and a circular (or flattener) motoneuron were coactivated, the resulting skin deformation was a compression. Similarly, simultaneous recordings from different pairs of longitudinal motoneurons confirmed the result shown in Figure 7: when two longitudinal motoneurons were simultaneously stimulated, the resulting skin deformation was an almost pure negative longitudinal shear. When motoneurons innervating oblique muscles, such as motoneurons 110 or 111, and a longitudinal or circular motoneuron were simultaneously activated by depolarizing current, vector fields induced on the leech skin similarly added linearly.
In summary, these experiments strongly support the hypothesis that skin deformations induced by different motoneurons, during a light or moderate mechanical stimulation, sum linearly as a general rule. In turn this property of linear superposition enables complex deformations to be decomposed into the muscle types sustaining them. For example, when a skin deformation caused by a mechanical stimulation is indeed a local compression, characterized by a large value of Ewithout a simultaneous large S1 or/andS2, it can be inferred that longitudinal and circular fibers are coactivated.
Note that real skin deformations sum linearly, but in general this is not the true for their linear approximations. The linear sum of linear approximations only holds for pairs of motoneurons innervating skin areas that are at least partially overlapping. This is the case for cells 112 and 5, both innervating dorsal muscles, and cells 5 and L, whose deformations overlap in a wide dorsal area of the skin (Figs.7F, 8F). On the contrary, when two motoneurons innervating nonoverlapping skin regions are coactivated, their elementary deformations do not add linearly (data not shown). Nevertheless, the skin deformation resulting from their coactivation is still generally linear around the singular point. Its elementary deformations are strictly related to those of individual motoneurons, so that it is still easy to infer which classes of motoneurons sustain the contraction.
Comparison of skin deformations caused by mechanical stimulation and electrical excitation of mechanosensory neurons
As a further example of the ability of optical flow analysis in neurobiology, we analyzed the optical flows induced by mechanical stimulation of the leech skin to identify which muscle fibers are primarily activated and which mechanosensory neurons mediate that activation. In these experiments an intracellular electrode was inserted into an identified mechanosensory neuron to: (1) measure the number of spikes the mechanical stimulation induced in that neuron and (2) characterize the vector fields induced by a controlled number of spikes elicited in the mechanosensory neuron.
Ventral and dorsal P cells
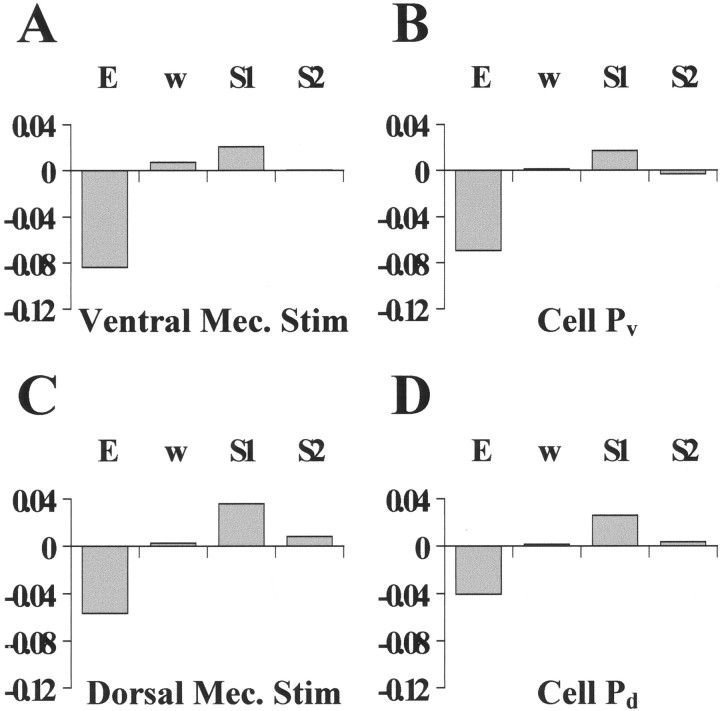
Figure 9 shows data obtained from a preparation in which both the ventral (A and B) and dorsal (C and D) P cells were impaled. Mechanical stimulation of the skin in the ventral side, exerting a force of ∼20 mN for 300 msec (touch location is indicated by thecircle in A), induced 12 ventral P cell spikes (bottom trace in A), and the vector field of skin deformations shown in the top part of A. Induction of similar P cell firing by current injection (bottom trace inB), induced a very similar vector field and singular point location (top part, B; singular points are indicated by the “X” in A and B). Both vector fields have the characteristic shape of a ventral compression with the arrows pointing toward the center of the deformation. This qualitative observation was confirmed by computing their elementary deformations (Fig. 10A,B); both vector fields have similar large negative E values. On the base of the considerations reported in the previous section (Fig. 8C), we concluded that both deformations were sustained by simultaneous activation of longitudinal and circular muscles.
Fig. 9.
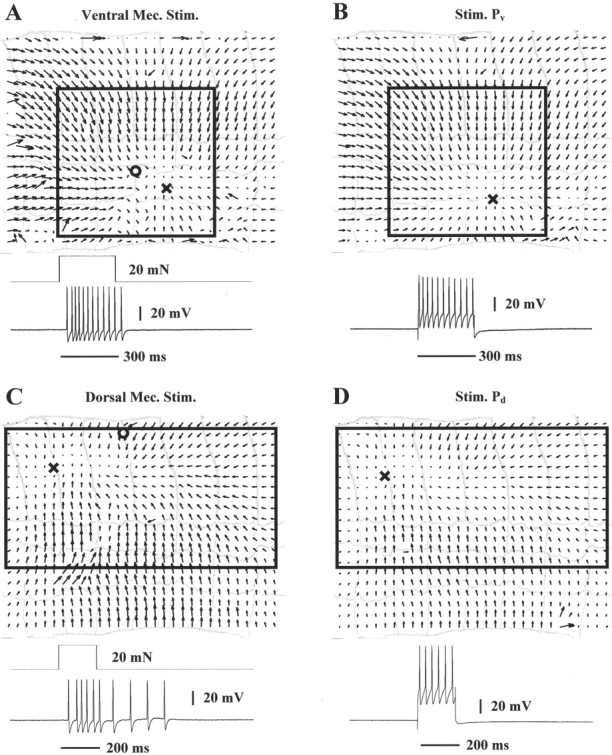
Skin deformations caused by mechanical stimulation and P cell intracellular stimulation. A, Optical flow induced by mechanical stimulation (20 mN for 300 msec;circle) in the ventral side of the segment. TheX is the location of the singular point. Thebottom traces show stimulus duration and the ventral P cell response. B, Optical flow induced by ventral P cell intracellular stimulation; note marked similarity. C, Optical flow and dorsal P cell response induced by mechanical stimulation (20 mN for 200 msec) in the dorsal side of the segment. Symbols as in A. D, Optical flow induced by dorsal P cell intracellular stimulation; note marked similarity. The width of the annuli is ∼0.9 mm.
Fig. 10.
The elementary deformations induced by mechanical stimulation and intracellular P cell stimulation. A–Dshow the elementary deformations of the optical flows in the corresponding panels of Figure 9. The elementary deformations were computed by linearizing the optical flows shown in Figure 9 in the regions indicated by the solid boxes. Equal normalization in all panels.
Mechanical stimulation in the dorsal side of the skin (circle) induced the vector field and dorsal P cell firing shown in Figure 9C. Induction of similar P cell firing induced a very similar vector field and singular point location (Fig.9D, singular points marked by X). Both contractions are characterized by a similar high negative value of the expansion E (Fig. 10C,D). The higher values ofE and S1 in Figure10C in comparison to those in Figure 10Dindicate that the compression induced by the mechanical stimulation was slightly stronger than that induced by dorsal P cell intracellular stimulation, in accordance with the higher number of spikes elicited by the mechanical stimulus.
Monitoring T cells
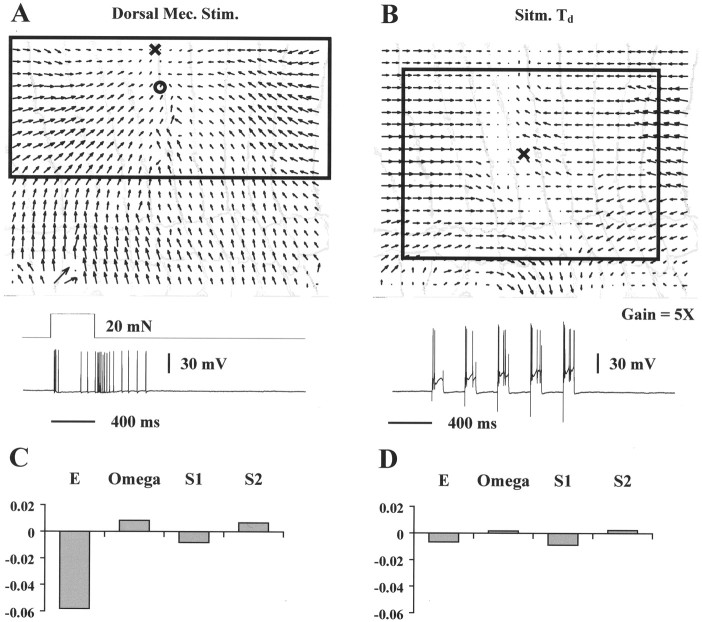
Figure 11 shows the results obtained when a dorsal T cell was impaled. Mechanical stimulation of the dorsal skin (circle, A) induced an ON discharge of ∼4 spikes in the T cell followed by an OFF response of >10 spikes (bottom trace in A). The induced vector field on the leech skin was again a compression, characterized by a high negative value of the expansion E, as is shown in C, which plots the elementary deformations for the optical flow in A. When the same T cell was forced to fire similarly by successive depolarizing current pulses, the induced vector field was qualitatively different and of much smaller amplitude (Fig. 9B) (note that the magnification-gain is fivefold greater in this panel than inA). The large difference in optical flow induced by mechanical stimulation and T cell stimulation is also apparent in the elementary deformation plots (Fig. 11C,D).
Fig. 11.
T cell contribution to motor response.A, Optical flow induced by mechanical stimulation (20 mN for 400 msec) in the dorsal side of the segment. Symbols as in Figure9. The bottom traces show the duration of the stimulus and the spikes that it evoked in the dorsal T cell. B, Optical flow induced by intracellular dorsal T stimulation cell with successive depolarizing current pulses (bottom trace).C, Elementary deformations computed for the vector field shown in A. D, Elementary deformations computed for the vector field shown in B. The boxes inA and B are linearization regions for the corresponding optical flows. The width of the annuli inA and B is ∼0.6 mm. Equal normalization in C and D.
Relative contribution of P and T cells
The data presented so far clearly show that motor responses initiated by a localized mechanical stimulation are primarily mediated by P cells. This result is in agreement with previous studies (Kristan, 1982; Lockery and Kristan, 1990a; Wittenberg and Kristan, 1992a) and extends their findings to the global shape of the field of deformations. One of these studies (Kristan, 1982), however, reported data showing: (1) response to skin stimulation approximately fourfold greater than response to individual stimulation of P cell and (2) large contribution of T cells in mediating the reflex when coactivated simultaneously to P cells. We addressed these two points in a series of experiments.
Skin deformation induced by intracellular stimulation of ventral or dorsal P cell was compared with deformation induced by mechanical stimulation of the skin in several different preparations. In 15 of 17 preparations the shape of the optical flow and the relative weight of the elementary deformations were almost identical for contractions induced by P cell and mechanical stimulation. Alternatively, each T cell stimulation (seven of seven) evoked a vector field of deformation with a structure significantly different from that obtained by mechanical stimulation.
An exact comparison between the intensities of deformations induced by mechanical stimulation of the skin or electrical stimulation of a P cell requires evoking the same number of spikes in the P cell in both stimulations. In these cases (five experiments) the contraction induced by mechanical stimulation was only slightly stronger than that evoked by P cell stimulation (usually 1.1–1.5-fold larger) (compare Fig.10A,B).
The role of T cells was further investigated by experiments in which a T and a P cell were first alternatively and then simultaneously stimulated. Collected data exhibited some variability: four of seven experiments clearly showed that the individual stimulation of T cells was only slightly effective (Fig. 11), but the coactivation of T and P cells was able to induce a contraction 1.5- to 2-fold greater than the contraction induced by individual stimulation of P cells. In three of seven experiments the skin deformations elicited by electrical stimulation of the P cell or of the same P cell and another T cell were identical.
Experiments in which P and T cells were alternatively hyperpolarized during mechanical stimulation were also performed. Hyperpolarization of the P cell was able to reduce the strength of the contraction, without changing its shape, in proportion to the reduction in the number of evoked spikes. Hyperpolarization of T cells had a much lower effect on the contraction strength.
Monitoring N cells
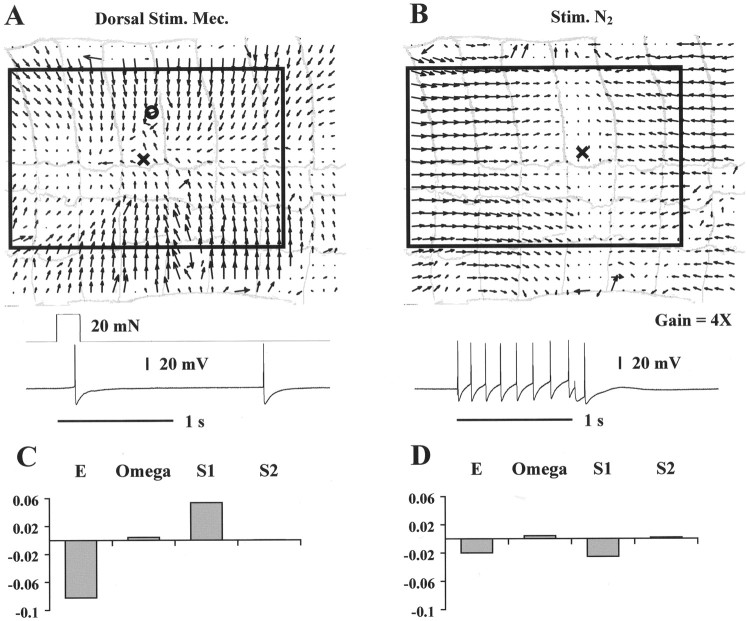
Figure 12 shows data obtained when the medial N cell was impaled. Mechanical stimulation (circle, A) induced in the medial N cell just 1 or 2 spikes or no spikes at all (bottom trace, A). Measurable skin deformation could only be evoked firing at least six spikes in the medial N cell (nine spikes were elicited in the experiment shown inB). Despite this increase in the N cell activity, the deformation vector field induced by N cell firing was much smaller (note magnification change in B) and qualitatively different from that induced by the mechanical stimulation (A).C and D, which report the elementary deformations for the optical flows drawn in A and B, support the qualitative data shown in Figure 12, A and B; mechanical stimulation induced a large negative E and a slightly smaller positive S1, but N cell stimulation evoked equally small negative E andS1. Similar results were obtained by impaling the lateral N cell.
Fig. 12.
N cell contribution to motor response.A, Optical flow induced by mechanical stimulation (20 mN for 200 msec) in the dorsal side of the segment. Symbols as in Figure9. B, Optical flow induced by intracellular medial N cell stimulation. C, Elementary deformations computed for the vector field shown in A. D, Elementary deformations computed for the vector field shown in B. The boxes in A and B are the linearization regions for the corresponding optical flows. The width of the annuli in A and B is ∼0.8 mm. Equal normalization in C and D.
Mechanical stimulation in more intact preparations and in intact leech
The experimental results presented so far were obtained in isolated leech segments. Some of these results, such as the major contribution of the P cells to the motor responses induced by mechanical stimulation, confirm and extend the classical descriptions of the local reflexes in the leech (Kristan, 1982; Lockery and Kristan, 1990a; Wittenberg and Kristan, 1992a). In particular, coactivation of longitudinal and circular muscles after mechanical stimulation (Figs.9A,B, 11A, 12A) has not previously been reported and suggests a more complex pattern of activation for motoneurons and interneurons involved in such reflexes (Lockery and Kristan, 1990a,b; Wittenberg and Kristan, 1992a,b). To verify these data, these mechanical stimulations were repeated in more intact preparations.
The second kind of preparation described in Materials and Methods (an intact hemisection of body wall in which the ganglion and the roots were not exposed and cleaned) was used to verify coactivation of longitudinal and circular muscles by moderate mechanical stimulation of leech skin. Vector fields similar to those shown in Figures9A,B, 11A, and12A, i.e., compressions with high negative values of the expansion E as main elementary deformation, were consistently observed in the great majority of intact body-wall preparations. The location of the singular point followed approximately the location of the mechanical stimulus. In a few preparations, almost pure transverse (high-positive S1 and high-negative E) or longitudinal (high-negativeS1) contractions were observed, indicating some degree of variability in motoneuron activation in different preparations. A possible explanation to this variability is suggested by three preparations that were kept under observation for several hours, in which variability in the response to the same mechanical stimulation, repeated at intervals of 30 min, was observed. In these preparations, the transverse component of the deformation, sustained by the circular muscles, decreased with time so that only the longitudinal component was visible at the end of the experimental session (after 3 or 4 hr). This is likely attributable to a faster deterioration of circular muscle fibers in comparison to the longitudinal muscle fibers.
Analysis of the vector fields induced by mechanical stimulation was also repeated in intact leeches in which two or three segments were secured to the Sylgard dish with four pins (the third preparation described in Materials and Methods). In intact leeches, the mechanical stimulations used in the experiments shown in Figures 9, 11, and 12induced optical flows similar to those obtained in isolated segments. However, whereas results in isolated segments were reproducible (except for the slow run-down of circular muscle response), in intact leeches the effect of mechanical stimulations was more variable. Often the same mechanical stimulation evoked a clear local compression in some trials but a longitudinal or a transverse deformation in others. This variability in the intact leech may arise from the greater complexity of the whole animal and the presence of feedback from other segments and input from the head and tail brains.
Time evolution of the contraction caused by mechanical stimulation
As shown in the previous section, mechanical stimulation can evoke a complex pattern of skin deformations in which different classes of motoneurons and muscles are involved. The dynamics of this complex deformation, i.e., the timing with which different sets of muscles are recruited, can again be described by analyzing the sequence of instantaneous optical flows computed for each video frame.
Figure 13 shows the dynamics of a deformation induced by touching the skin in the lateral side (the location of the touch is indicated by the circle inA). Every fifth frame of the original image sequence (50 images) acquired at 5 Hz was selected, and a sequence of nine instantaneous optical flows was obtained. A–C show the instantaneous vector fields at three different times during the skin contraction. D shows the time course of the elementary deformations during the first 9 sec of the deformation. The thick horizontal bars on the top of D indicate the time intervals in which longitudinal and circular muscles are supposed to contract (gray) or relax (white). The thin black bar indicates the duration of the mechanical stimulus (20 mN for 200 msec).
Fig. 13.
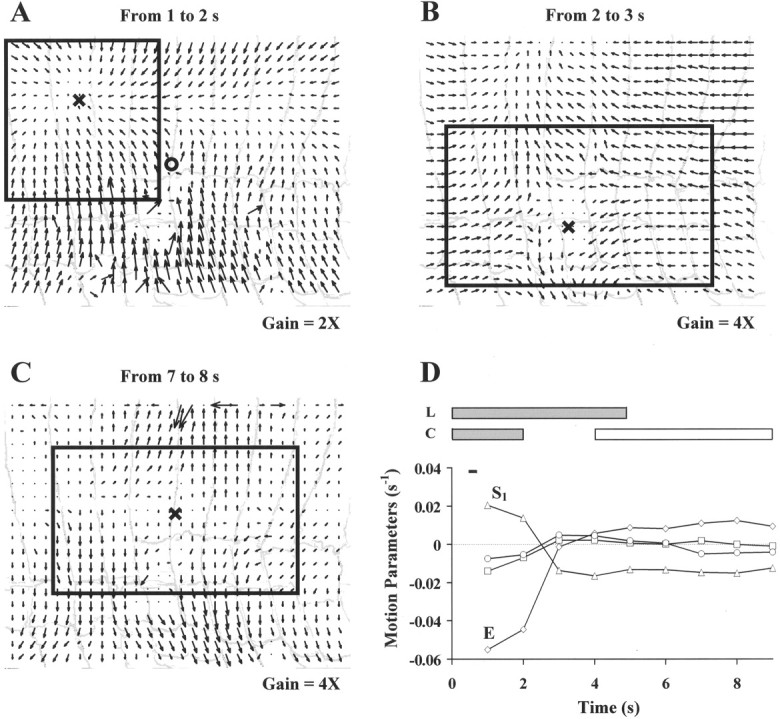
Dynamics of a complex contraction induced by a mechanical stimulation. A–C show the instantaneous vector fields at three different times during skin contraction. The location of the mechanical stimulus is indicated in A by the circle. The Xs represent the positions of singular points. The time interval during which each flow occurred is shown in the top of each panel.D shows the time course of the elementary deformations: expansion E (⋄), rotation ω (■), longitudinal shear S1 (Δ), and oblique shear S2 (○), during the first 9 sec of the deformation. The thick horizontal bars on thetop of D indicate the time intervals in which longitudinal and circular muscles are presumed to contract (gray) or relax (white). Thethin bar indicates the duration of the mechanical stimulus (20 mN for 200 msec). The boxes in A–C are the linearization regions for the corresponding optical flows. The width of the annuli in A–C is ∼0.7 mm.
Direct observation of the shape of the vector fields reveals at least three different phases of the deformation. The initial phase shown inA is a dorsal local compression. The successive phase (B) is a ventral longitudinal shear. The third phase (C), computed several seconds later when the deformation is in the relaxation phase, looks like a longitudinal shear, but the parallel direction of the arrows suggests the presence also of a strong expansion component. These qualitative observations are confirmed by the time course of the elementary deformations (D). In the initial phase of the contraction, from second 0 to second 2, the main component of the deformation was the negative expansion E. We concluded that in this phase the longitudinal and circular muscles were coactivated to produce the dorsal compression drawn in A. Immediately after (from seconds 2–4), the expansion coefficient vanished, and the contraction was sustained by only negative longitudinal shearS1 (B). Presumably in this phase circular muscles had ceased contracting and the deformation was driven only by the longitudinal muscles. At second 5 the circular muscles started to relax. The expansion coefficientE became positive and increased until it reached the same magnitude as S1, but with opposite sign (compare with the transverse relaxation in C). The longitudinal relaxation began later, after the termination of the acquired image sequence.
Figure 13 shows that the dynamics of a deformation induced by a mechanical stimulation can be complex. The dynamics exhibited some variability from preparation to preparation, but in the same preparation were usually reproducible over 30–40 min. Sometimes longitudinal and circular muscles seemed to contract and relax in clearly distinct phases, as for the experiment described in Figure 13, but other times the longitudinal and circular muscles seemed to contract and relax simultaneously.
DISCUSSION
We have shown here that, by using a recently developed technique based on the computation of optical flow (Zoccolan et al., 2001), a more accurate classification of the contraction different muscles induce, and a better characterization of sensory-motor responses, in leech skin can be obtained. Using this technique it is possible to infer which muscles are activated by mechanical stimuli and to identify which mechanosensory neurons primarily mediate these local reflexes.
Motoneuron classification and optical flow
Table 1 and Figures 4 and 5 show that by analyzing the optical flow of contracting pieces of skin, it is possible to more completely characterize leech excitatory motoneuron actions. This is possible because optical flow provides a two-dimensional characterization of muscle contraction that cannot be adequately measured by conventional force transducers, which measure only scalar quantities. Quantitative properties of the optical flow (i.e., the location of the singular point and its elementary deformations) produced by the excitation of a given motoneuron were highly reproducible in different leech segments and in different leeches. This quantitative two-dimensional description represents a new and more complete characterization of leech excitatory motoneuron actions.
All longitudinal motoneurons induce vector fields with a large negativeS1, circular motoneurons induce fields with a large positive S1 and a negative E, and oblique muscles induce fields with a large negative S2. Different longitudinal and circular muscles, however, produce distinct vector fields in specific skin areas caused by the characteristic location of their singular points.
Validity of linear approximations
All quantitative analysis reported in the present work are based on computation of the elementary deformations, used to characterize contractions induced by single motoneurons (Figs. 3, 4) as well as by local mechanosensory stimulation (Figs. 9-13). The computation of these deformations requires approximating the real vector field with a linear vector field. It is well known that all smooth, i.e., regular, vector fields can be locally approximated by linear vector fields (Sommerfeld, 1974). Linear vector fields are characterized by the presence of just one singular point, i.e., of an immobile point. Indeed all vector fields with just one singular point can usually be well approximated by linear vector fields. All vector fields analyzed in this manuscript, evoked by a single mechanical stimulation and by the electrical stimulation of one or pairs of motoneurons, had only one singular point within the area where the skin contracted. Therefore to provide a simple and compact description of the analyzed contraction, we adopted a linear approximation.
We expect that different patterns of motoneuron activation evoked by more complex mechanical stimulation can produce nonlinear patterns of skin deformations, with more than one singular point in the optical flow. In this case, however, a piecewise linear approximation can be used (Campani and Verri, 1992): separate linear approximations can be computed in distinct windows around each singular point.
Linear summation and motoneuron identification
Sensory motor responses are not mediated by single motoneurons (Lockery and Kristan, 1990a; Wittenberg and Kristan, 1992a; Shaw and Kristan, 1995; Arisi et al., 2001), and it is therefore important to establish the relevance of the proposed motoneuron characterization when motoneurons are coactivated. This was investigated by simultaneously impaling pairs of motoneurons innervating the same (Fig.7) or different (Fig. 8) muscle fibers and applying an electrical stimulation evoking a contraction not larger than that evoked by a light or moderate mechanical stimulation (i.e., exerting a force not >50 mN). In all experiments (nine of nine), the deformations produced by impaled motoneurons added almost linearly (Figs. 7, 8). Although all possible motoneuron pairs were not examined and no triplets or larger groups of motoneurons were simultaneously stimulated, collected data strongly supports the linear superposition of skin deformations as a general rule for light and moderate stimulations. We cannot exclude that, for some pairs of motoneurons, the sum of deformations might not be perfectly linear. Nevertheless, we expect that possible deviations from linearity will mainly affect the strength of a contraction sustained by coactivated motoneurons but not its global shape and the relative weight of its elementary deformations.
The linear sum of skin deformations is the basis for analyzing complex muscle contractions because it allows us to infer which classes of motoneurons, i.e., longitudinal, circular or oblique, are activated in them. For instance, as is shown in Figures 9-12, mechanical stimulation of the skin or P cell stimulation produces local compression, i.e., a deformation field with large E < 0 and relatively low values of the remaining elementary deformations. This deformation can be explained by the coactivation of longitudinal and circular muscles so that the large negativeS1 value associated with longitudinal motoneurons is balanced by the large positiveS1 value associated with circular motoneurons (Table 1, Fig. 8). In this case longitudinal and circular fibers were almost equally activated. Alternatively, when T or N cells are forced to fire, the induced vector field in the skin has large-negative values of both S1 andE. This deformation can be explained as again being attributable to longitudinal and circular fiber coactivation, but with circular fibers being activated to a lesser degree than before.
The proposed approach thus seems adequate to identify which muscle classes (longitudinal, circular and oblique) are activated during skin deformations, but cannot identify which specific longitudinal or circular motoneuron is activated.
Motoneuron activation in sensory motor responses
The analysis of deformations induced on the leech skin by a brief mechanical stimulation in isolated segments indicated coactivation of both longitudinal and circular motoneurons (Figs. 9,11A, 12A). Analysis of elementary deformations supported this conclusion (Figs. 10, 11C,12C, 13D). Also in intact leeches longitudinal and circular motoneurons seemed to be coactivated, but the degree of contraction of longitudinal and circular fibers was more variable.
These results indicate that during local bending, a local withdrawal reflex of the leech (Kristan, 1982; Lockery and Kristan, 1990a,b; Lewis and Kristan, 1998b), circular motoneurons are activated. This extends the classical description of this reflex, which has before this work been considered to arise from contraction of longitudinal muscles at the stimulated site and relaxation of those on the opposite side of the body (Kristan, 1982; Lockery and Kristan, 1990a,b). Figures 9, 11, and12 suggest a slightly different paradigm in which circular muscles are also activated to withdraw the body from the stimulus site. This response is reminiscent of circumferential indentation, a reflex induced by moderate mechanical stimulation, observed in young leech embryos by Reynolds et al. (1998). This reflex, presumably mediated by activation of the segment circular muscles, wanes in late embryos and is replaced in adults by local bending. The results presented here show that circular muscle activation is maintained in adult animals as a fundamental component of the local bending. The experiments performed in intact animals suggest an involvement of circular muscles in other local reflexes such as local shortening, a defensive reflex involving several segments anterior and posterior to the stimulus usually paired with local bending (Wittenberg and Kristan, 1992a,b).
The analysis of the dynamics of the motor responses (Fig. 13) shows that distinct muscles can be recruited in different phases of the response, suggesting a selective activation of the corresponding pools of motoneurons at specific times.
Role of mechanosensory neurons in local motor responses
The results shown in Figure 9 clearly show that motor responses evoked by mechanical stimulation are primarily mediated by P cells. In almost all tested preparations, the field of deformation induced by touching the skin dorsally or ventrally had the same shape as the field induced by intracellular stimulation of dorsal or ventral P cells. The relative weight of the elementary deformations was the same in both kinds of stimulation, indicating that the structure of this local motor reflex is almost exclusively mediated by P cells. In comparison with mechanical stimulation, the strength of the motor response was slightly weaker when induced by P cell firing, suggesting an involvement of T cells in enhancing the response. T cells, when individually activated, gave a poor and often negligible contribution to skin contraction (Fig.11), but when they were forced to fire simultaneously with P cells, the resulting contraction could potentiate up to twofold in comparison to individual P cell stimulation (see Results).
These results confirm the role of T cells in potentiating contractions when coactivated together with P cells, but to a more minor extent than previously reported (Kristan, 1982). We never observed deformations induced by skin stimulation up to fourfold greater than P induced deformations (Kristan, 1982). This discrepancy could be explained by the fact that different stimulation protocols were used in the present work and that of Kristan (1982).
The N cells are not activated by light mechanical stimulation and do not contribute to these motor responses (Fig. 12), as expected by previous reports (Kristan, 1982).
Footnotes
This work was partially funded by European Union Grant Parallel 960211. We thank Marco Cappello for help in developing the software to compute the optical flow, Alessandro Bisso for help in developing the Matlab application for the vector field analysis, and Jane Wolfe for editing the text.
Correspondence should be addressed to Vincent Torre, c/o Scuola Internazionale Superiore di Studi Avanzati, Via Beirut 2, 34014 Trieste, Italy. E-mail: torre@sissa.it.
REFERENCES
- 1.Aggarwal JK, Nandhakumar N. On the computation of motion from sequences of images: a review. Proc IEEE. 1988;76:917–935. [Google Scholar]
- 2.Anadan P. A computational framework and an algorithm for the measurement of visual motion. Int J Comput Vision. 1989;3:283–310. [Google Scholar]
- 3.Arisi I, Zoccolan D, Torre V. Distributed motor pattern underlying whole-body shortening in the medicinal leech. J Neurophysiol. 2001;86:2475–2488. doi: 10.1152/jn.2001.86.5.2475. [DOI] [PubMed] [Google Scholar]
- 4.Aschwanden P, Guggenbuhl W. Experimental results from a comparative study on correlation-type registration algorithms. In: Forster A, Ruwiedel A, editors. Robust computer vision. Wichmann; Karlsruhe, Germany: 1992. pp. 268–287. [Google Scholar]
- 5.Byrne J, Castellucci VF, Kandel ER. Receptive fields and response properties of mechanoreceptor neurons innervating siphon skin and mantle shelf in Aplysia. J Neurophysiol. 1974;37:1041–1064. doi: 10.1152/jn.1974.37.5.1041. [DOI] [PubMed] [Google Scholar]
- 6.Campani M, Verri A. Motion Analysis from first-order properties of optical flow. CVGIP: Image Understanding. 1992;56:90–107. [Google Scholar]
- 7.Castellucci VF, Kandel ER. A quantal analysis of the synaptic depression underlying habituation of the gill-withdrawal reflex in Aplysia. Proc Natl Acad Sci USA. 1974;71:5004–5008. doi: 10.1073/pnas.71.12.5004. [DOI] [PMC free article] [PubMed] [Google Scholar]
- 8.Frost WN, Kandel ER. Structure of the network mediating siphon-elicited siphon mediated withdrawal in Aplysia. J Neurophysiol. 1995;73:2413–2427. doi: 10.1152/jn.1995.73.6.2413. [DOI] [PubMed] [Google Scholar]
- 9.Giachetti A. Matching techniques to compute image motion. Image Vision Comput. 2000;18:245–258. [Google Scholar]
- 10.Giachetti A, Torre V. The use of optical flow for the analysis of non-rigid motions. Int J Comput Vision. 1996;18:255–279. [Google Scholar]
- 11.Horn BKP, Schunck BG. Determining optical flow. Artif Intell. 1981;17:185–203. [Google Scholar]
- 12.Kristan WB., Jr Sensory and motor neurones responsible for the local bending response in leeches. J Exp Biol. 1982;96:161–180. [Google Scholar]
- 13.Kristan WB, Jr, McGirr SJ, Simpson GV. Behavioural and mechanosensory neurone responses to skin stimulation in leeches. J Exp Biol. 1982;96:143–160. [Google Scholar]
- 14.Levin S, Pearsall G, Ruderman RJ. Von Frey's method of measuring pressure sensibility in the hand: an engineering analysis of the Weinstein-Semmes pressure aesthesiometer. J Hand Surg (Am) 1978;3:211–216. doi: 10.1016/s0363-5023(78)80084-7. [DOI] [PubMed] [Google Scholar]
- 15.Lewis JE, Kristan WB., Jr Representation of touch location by a population of leech sensory neurons. J Neurophysiol. 1998a;80:2584–2592. doi: 10.1152/jn.1998.80.5.2584. [DOI] [PubMed] [Google Scholar]
- 16.Lewis JE, Kristan WB., Jr Quantitative analysis of a directed behavior in the medicinal leech: implications for organizing motor output. J Neurosci. 1998b;18:1571–1582. doi: 10.1523/JNEUROSCI.18-04-01571.1998. [DOI] [PMC free article] [PubMed] [Google Scholar]
- 17.Lockery SR, Kristan WB., Jr Distributed Processing of sensory information in the leech. I. Input-output relations of the local bending reflex. J Neurosci. 1990a;10:1811–1815. doi: 10.1523/JNEUROSCI.10-06-01811.1990. [DOI] [PMC free article] [PubMed] [Google Scholar]
- 18.Lockery SR, Kristan WB., Jr Distributed Processing of sensory information in the leech. II. Identification of interneurons contributing to the local bending reflex. J Neurosci. 1990b;10:1811–1815. doi: 10.1523/JNEUROSCI.10-06-01811.1990. [DOI] [PMC free article] [PubMed] [Google Scholar]
- 19.Mason A, Kristan WB., Jr Neuronal excitation, inhibition and modulation of leech longitudinal muscle. J Comp Physiol [A] 1982;146:527–536. [Google Scholar]
- 20.Muller KJ, Nicholls JG, Stent GS. Neurobiology of the leech. Cold Spring Harbor Laboratory; New York: 1981. [Google Scholar]
- 21.Nicholls JG, Baylor DA. Specific modalities and receptive fields of sensory neurones in CNS of the leech. J Neurophysiol. 1968;31:740–756. doi: 10.1152/jn.1968.31.5.740. [DOI] [PubMed] [Google Scholar]
- 22.Nicholls JG, Purves D. Monosynaptic chemical and electrical connexions between sensory and motor cells in the central nervous system of the leech. J Physiol (Lond) 1970;209:647–667. doi: 10.1113/jphysiol.1970.sp009184. [DOI] [PMC free article] [PubMed] [Google Scholar]
- 23.Norris BJ, Calabrese RL. Identification of motor neurons that contain a FMRFamidelike peptide and the effects of FMRFamide on longitudinal muscle in the medicinal leech, Hirudo medicinalis. J Comp Neurol. 1987;266:95–111. doi: 10.1002/cne.902660108. [DOI] [PubMed] [Google Scholar]
- 24.Ort CA, Kristan WB, Jr, Stent GS. Neuronal control of swimming in the medicinal leech II. Identification and connections of motor neurons. J Comp Physiol. 1974;94:121–154. [Google Scholar]
- 25.Pinato G, Torre V. Coding and adaptation during mechanical stimulation in the leech nervous system. J Physiol (Lond) 2000;529:747–762. doi: 10.1111/j.1469-7793.2000.00747.x. [DOI] [PMC free article] [PubMed] [Google Scholar]
- 26.Reynolds SA, French KA, Baader A, Kristan WB., Jr Development of spontaneous and evoked behaviors in the medicinal leech. J Comp Neurol. 1998;402:168–180. [PubMed] [Google Scholar]
- 27.Shaw BK, Kristan WB., Jr The whole-body shortening reflex of the medicinal leech: motor pattern, sensory basis, and interneuronal pathways. J Comp Physiol [A] 1995;177:667–681. doi: 10.1007/BF00187626. [DOI] [PubMed] [Google Scholar]
- 28.Sommerfeld A. Mechanics of deformable bodies. Academic; New York: 1974. [Google Scholar]
- 29.Stent GS, Kristan WB, Jr, Friesen WO, Ort CA, Poon M, Calabrese RL. Neuronal generation of the leech swimming movement. Science. 1978;200:1348–1357. doi: 10.1126/science.663615. [DOI] [PubMed] [Google Scholar]
- 30.Stuart AE. Physiological and morphological properties of motoneurones in the central nervous system of the leech. J Physiol (Lond) 1970;209:627–646. doi: 10.1113/jphysiol.1970.sp009183. [DOI] [PMC free article] [PubMed] [Google Scholar]
- 31.Tsau Y, Wu JY, Hopp HP, Cohen LB, Schiminovich D, Falk CX. Distributed aspects of the response to siphon touch in Aplysia: spread of stimulus information and cross-correlation analysis. J Neurosci. 1994;14:4167–4184. doi: 10.1523/JNEUROSCI.14-07-04167.1994. [DOI] [PMC free article] [PubMed] [Google Scholar]
- 32.Verri A, Poggio T. Motion field and optical flow: qualitative properties. IEEE Trans Pattern Anal Machine Intell. 1989;11:490–498. [Google Scholar]
- 33.Wittenberg G, Kristan WB., Jr Analysis and modelling of the multisegmental coordination of shortening behavior in the medicinal leech. I. Motor output pattern. J Neurophysiol. 1992a;68:1683–1692. doi: 10.1152/jn.1992.68.5.1683. [DOI] [PubMed] [Google Scholar]
- 34.Wittenberg G, Kristan WB., Jr Analysis and modelling of the multisegmental coordination of shortening behavior in the medicinal leech. II. Role of identified interneurons. J Neurophysiol. 1992b;68:1693–1707. doi: 10.1152/jn.1992.68.5.1693. [DOI] [PubMed] [Google Scholar]
- 35.Zoccolan D, Giachetti A, Torre V. The use of optical flow to characterize muscle contraction. J Neurosci Methods. 2001;110:65–80. doi: 10.1016/s0165-0270(01)00418-6. [DOI] [PubMed] [Google Scholar]


