

Abstract
Several extracellular matrix (ECM) molecules have been identified as potent inhibitors of neurite outgrowth in vitro and are believed to limit axonal growth after CNS injury. Recent studies have shown that different members of the chondroitin sulfate proteoglycan (CSPG) class of putatively inhibitory ECM molecules are expressed after a number of CNS injuries. The purpose of this study was to evaluate the relative amounts of individual CSPGs expressed after spinal cord injury (SCI) and identify their cells of origin. Evaluation of total soluble CSPGs 2 weeks after dorsal column lesion in the rat demonstrated that NG2 is highly upregulated and is a major CSPG species. Immunocytochemical analysis further demonstrated that NG2 expression is upregulated within 24 hr of injury, peaks at 1 week, and remains elevated for at least an additional 7 weeks. NG2 expression results from a multicellular response to injury, including both reactive macrophages and oligodendrocyte progenitors; astrocytes were not identified as a major source of NG2. Immunocytochemical analysis of other CSPG family members 7 d after injury showed moderate upregulation of versican, brevican, and neurocan, and downregulation of phosphacan. Axonal tracing experiments demonstrated dense NG2 labeling adjacent to the forward processes of transected corticospinal tract axons in a spatial profile that could restrict axonal growth. Thus, NG2 is a major component of this putatively inhibitory class of ECM molecules expressed at sites of SCI and may restrict axonal regeneration.
Keywords: NG2, spinal cord injury, chondroitin sulfate proteoglycan, macrophage, corticospinal tract, inhibition, regeneration, astrocytes
Although the “glial scar” is a well known pathological hallmark of CNS injury, its formation, molecular composition, and function are only partially understood. Studies in several CNS experimental lesion models demonstrate that scarring is a multicomponent process consisting of glial reactivity, alteration in the extracellular matrix (ECM) and, in some cases, collagen deposition. This reaction is the result of a multicellular response to injury involving astrocytes, microglia, macrophages, oligodendrocyte progenitors, fibroblasts, leptomeningeal cells, and Schwann cells (Bunge et al., 1997; Fawcett and Asher, 1999; Fitch and Silver, 1999; Dawson et al., 2000). Among the molecules known to contribute to scarring at sites of CNS injury are the chondroitin sulfate proteoglycans (CSPGs) (Levine, 1994; Fitch and Silver, 1997;Haas et al., 1999; Lemons et al., 1999; McKeon et al., 1999; Chang et al., 2000; Thon et al., 2000; Yamaguchi, 2000), a family of putatively inhibitory ECM molecules that may limit axonal regeneration after injury.
The various members of the CSPG family of molecules share two common features: (1) a protein core, which varies in structure among the member molecules NG2, versican, brevican, neurocan, and phosphacan, and (2) glycosylated chondroitin side chains, which also differ from member to member in number, size, and complexity (for review, see Yamaguchi, 2000). In vitro, many CSPG family members have been reported to inhibit neurite outgrowth. In particular, NG2, versican, brevican, neurocan, and phosphacan have been reported to inhibit neurite outgrowth from various classes of cultured neurons (Dou and Levine, 1994; Milev et al., 1994; Yamada et al., 1994; Braunewell et al., 1995; Fidler et al., 1999; Schmalfeldt et al., 2000), thereby providing a potential mechanism for defining limitations to growth trajectories of extending axons during development.
After injury in the adult nervous system, re-expression of CSPGs has been reported in a variety of experimental paradigms. CSPG expression is generally upregulated after cortical injury (Fitch and Silver, 1997), fornix lesions (Stichel et al., 1999), and after spinal cord injury (SCI) (Fitch and Silver, 1997; Lemons et al., 1999; Pasterkamp et al., 2001; Plant et al., 2001). Some reports have noted that CSPG molecules in general are upregulated after injury, whereas other reports have focused on an examination of changes in expression of single family members after different lesion paradigms (Levine, 1994;Nishiyama et al., 1997; Keirstead et al., 1998; Levine et al., 1998;Redwine and Armstrong, 1998; Haas et al., 1999; Levine and Reynolds, 1999; McKeon et al., 1999; Ong and Levine, 1999; Thon et al., 2000; Bu et al., 2001; Zhang et al., 2001). However, to date, no study has systematically examined which members of the CSPG family predominate after injury. Such knowledge, together with an identification of the cells producing CSPGs, is essential for designing strategies aimed at limiting CSPG expression after injury and potentially enhancing axonal regeneration. Indeed, recent studies reported that general degradation of CSPGs after brain injury (Moon et al., 2001) and SCI (Bradbury et al., 2001) enhances axonal growth and functional recovery to a partial extent; greater efficacy might be achieved by more specific identification and targeting of specific ECM components limiting growth after injury.
Thus, the present study used a spinal cord model to evaluate the relative expression of specific CSPG family members after injury and to identify cellular sources of their production. Findings from this study reveal for the first time that NG2 is a major CSPG component expressed after SCI, that macrophages and oligodendrocyte progenitors constitute the predominant source of NG2, and that NG2 is produced in a spatial gradient that may limit the growth of corticospinal tract (CST) axons after injury.
MATERIALS AND METHODS
Animal subjects and surgery. Adult female Fischer 344 rats (160–200 gm) were subjects of this study. National Institutes of Health guidelines for laboratory animal care and safety were strictly followed. Animals had ad libitum access to food and water throughout the study. All surgeries were performed under anesthesia with a combination (2 ml/kg) of ketamine (25 mg/ml), xylazine (1.3 gm/ml) and acepromazine (0.25 mg/ml). A total of 45 rats were used in this study (26 for immunocytochemistry experiments, 16 for SDS-PAGE and immunoblotting experiments, and 3 for anterograde axonal tracing experiments).
To study the temporal expression of CSPGs after SCI, a dorsal column spinal cord lesion was performed at C3 level as described previously (Weidner et al., 2001). Briefly, rats were deeply anesthetized, and C3 laminectomies were performed. A tungsten wire knife (Kopf Instruments, Tujunga, CA) was stereotaxically positioned at the spinal dorsal midline, then moved 0.6 mm to the left of the midline and lowered to a depth of 1.1 mm ventral to the dorsal surface. The tip of the knife was extruded, forming a 2.25-mm-wide wire arc that was raised 2 mm and simultaneously met by a blunt glass rod that added compression from above to insure full transection of the tissue. This lesioned the dorsal columns bilaterally, including the CST. The wire arc was retracted back into the wire knife device and removed.
Silver staining and immunoblotting. Isolation of proteoglycans was performed by ion exchange chromatography combined with chondroitinase ABC treatment using soluble extracts of rat spinal cord from intact animals and from animals that had undergone lesions 2 weeks earlier (see above). In lesioned animals, the analyzed cord sample consisted of a 6-mm-long block of tissue centered at the injury site. Samples from intact animals were also centered at C3 and were 6 mm in length. Measurements were repeated in two separate experiments, using four animals per group for each time period (16 animals total). Two hundred milligrams of pooled tissue, intact and lesioned, respectively, was subjected to DEAE-Sepharose chromatography protocols, and sequential washing steps were performed, as described previously (Herndon and Lander, 1990; Yamada et al., 1994). We collected 100 μl final eluents from DEAE-Sepharose by a 0.20–0.75m NaCl gradient as total soluble proteoglycans. Samples were incubated at 37°C overnight with chondroitinase ABC (Seikagaku America, Falmouth, MA); chondroitinase ABC omission controls were incubated without addition of the enzyme. Thirty microliters of sample were run on 8–16% SDS-polyacrylamide gels (NOVEX, San Diego, CA). Gels were either processed for silver stain visualization (Roche Molecular Biochemicals, Indianapolis, IN) or blotted onto 0.45 μm pore nitrocellulose membranes (Fisher Scientific, Pittsburgh, PA) for immunoblot analysis. For immunoblotting, nitrocellulose blots were blocked with 5% milk in PBS for 1 hr, incubated overnight at room temperature with polyclonal rabbit anti-rat NG2 antibody 1:200 (Goretzki et al., 1999), washed with PBS, incubated for 1 hr with a horseradish peroxidase-conjugated anti-rabbit IgG secondary antibody (1:3000; Bio-Rad, Hercules, CA), washed with PBS, and visualized using a SuperSignal chemiluminescence system (Pierce, Rockford, IL).
Tissue processing for histological analysis. After induction of deep anesthesia, animals were transcardially perfused with 4% paraformaldehyde in 0.1 m phosphate buffer. Spinal cords were dissected, post-fixed overnight at 4°C, and then transferred to 30% sucrose in phosphate buffer for 2–5 d. Spinal cords were sagittally sectioned on a cryostat set at 35 μm. One in seven sections was mounted on gelatin-coated glass slides for Nissl staining. Remaining sections were serially collected into 24-well plates for immunocytochemical labeling.
Immunocytochemistry. Based on findings of silver staining and immunoblotting (described below), immunolabeling was performed on tissue from 1 d (n = 4), 4 d (n = 4), 7 d (n = 4), 14 d (n = 4), 28 d (n = 3), and 56 d (n = 4) after SCI to determine the distribution patterns of NG2 deposition and relative intensity of NG2 labeling over an extended time period after injury. Nonlesioned, intact animals were used as controls (n = 3). All sections were processed free-floating, and endogenous peroxidase activity was blocked with 0.6% hydrogen peroxide as described previously (Grill et al., 1997). Nonspecific antibody reactions were blocked with 5% horse serum (for monoclonal antibodies) or 5% goat serum (for polyclonal antibodies) for 1 hr at room temperature. Sections were incubated overnight at 4°C with one of the following primary antibodies: rabbit polyclonal anti-rat NG2 1:8000 (Goretzki et al., 1999), mouse monoclonal anti-neurocan (1F6) 1:6000 [University of Iowa, Developmental Studies Hybridoma Bank (DSHB), Iowa City, IA], mouse monoclonal anti-brevican (RB18) 1:400 (Yamada et al., 1997), mouse monoclonal anti-phosphacan (3F8) 1:6000 (DHSB), and mouse monoclonal anti-versican (12C5) 1:8000 (DHSB). After washing in Tris-buffered saline (TBS), sections were incubated with biotinylated conjugated IgG anti-mouse or IgG anti-rabbit secondary antibodies 1:200 (Vector Laboratories, Burlingame, CA) for 1 hr at room temperature followed by 1 hr incubation in avidin-biotinylated peroxidase complex 1:100 (Elite kit; Vector Laboratories) at room temperature. For both the monoclonal and polyclonal antibodies, a primary antibody omission control was included to test for possible nonspecific binding of the secondary antibody. Diaminobenzidine (0.05%) with nickel chloride (0.04%) were used as chromagens, with reactions sustained for 3 min at room temperature. The sections were mounted on gelatin-coated slides, dehydrated, and coverslipped with DPX mounting medium (BDH Laboratory Supplies, Poole, UK).
Quantification of NG2-immunoreactive density was performed using NIH image software. Standardized areas for sampling in two sections from each animal in each group were identified as a 600-μm-wide band of spinal cord adjoining the cord–lesion interface in each section (see Fig. 3A). The mean number of pixels containing immunolabeled reaction product in the sampled area was measured and divided by the area of the sampled region to obtain a mean density value for the lesioned tissue. This value was subtracted from background immunolabel intensity, as measured in a separate 1 mm2area of tissue located 5 mm rostral to the lesion site. Mean values for each animal were then compared. Light intensity and thresholding values were maintained at constant levels for all analyses.
Fig. 3.

Quantification of NG2 time course after SCI.A, The method for quantification of NG2-immunoreactive density is indicated. Standardized areas for sampling in two sections from each animal in each group were identified as a 600-μm-wide band of spinal cord adjoining the cord–lesion interface in each section (A). The mean number of pixels containing immunolabeled reaction product in the sampled area was measured and divided by the area of the sampled region to obtain a mean density value for the lesioned tissue. This value was subtracted from background immunolabel intensity, as measured in a separate 1 mm2 area of tissue located 5 mm rostral to the lesion site. Mean values for each animal were then compared. Scale bar, 220 μm. B, NG2 peaks in expression 7 d after injury and then gradually declines and approaches basal levels during the following weeks. ANOVA multiple group analysis,p < 0.0001. Asterisks indicate a significant difference from intact subjects.
In addition, immunofluorescent double labeling was performed to identify cellular sources of NG2. After blocking nonspecific antibody reactions with 5% goat serum for 1 hr at room temperature, free-floating sections were incubated overnight at 4°C with a mouse monoclonal antibody specific to rat-NG2 1:800 (Stallcup et al., 1983,1990) and simultaneously with one of the following polyclonal antibodies for specific cell types: anti-rat platelet-derived growth factor (PDGF) α-receptor 1:1000 to identify oligodendrocyte progenitors (see description below), anti-rat ionized calcium-binding adapter molecule-1 (IBA1) 1:1000 (generous gift from Dr. Imai, National Institute of Neuroscience, Tokyo, Japan), to identify microglia and macrophages (Ito et al., 1998; Ohsawa et al., 2000), and anti-bovine glial fibrillary acidic protein (GFAP) 1:750 (Dako, Glostrup, Denmark), to identify astrocytes (Palfreyman et al., 1979). Sections were washed with TBS, incubated with Alexa 488 fluorophore goat anti-rabbit 1:150 (Molecular Probes, Eugene, OR) for 2.5 hr at room temperature and Alexa 594 fluorophore goat anti-mouse 1:150 (Molecular Probes). The sections were then washed with TBS, mounted on uncoated slides, and coverslipped with Fluoromount G (Southern Biotechnology Associates, Birmingham, AL). Primary antibody omission controls were performed to control for nonspecific binding. Fluorescent visualization was performed on an Olympus America (Melville, NY) confocal microscope with an omnichrome series 43 argon–krypton laser and appropriate filter sets. Fluorescent bleedthrough controls were performed to test for detection of Alexa 488 fluorophore in the 594 channel, using tissue only stained with Alexa 488 fluorophore and detection only with the 594 channel. The same method was used for the Alexa 594 fluorophore and the 488 channel.
For labeling oligodendrocyte progenitors, a rabbit antibody was prepared against the extracellular domain of the rat PDGF α-receptor. To generate the receptor fragment needed for immunization, we added a C-terminal his-6 sequence to the cDNA segment coding for the N-terminal 515 amino acids of the receptor (Lee et al., 1990). This cDNA was ligated into the PCEP/4 vector and transfected into 293 EBNA cells (Tillet et al., 1997), followed by hygromycin selection to obtain positive colonies. After establishment of confluent monolayers of the transfected cells, the his-tagged receptor fragment was purified from serum-free culture supernatant by chromatography on Ni2+-agarose (Qiagen, Valencia, CA). Authenticity of the purified material was confirmed by amino acid sequencing. Rabbit antisera produced against this immunogen were affinity purified on a column constructed by coupling the purified receptor fragment to cyanogens bromide-activated Sepharose CL4B (Amersham Pharmacia Biotech, Peapack, NJ).
Anterograde CST labeling and comparison with NG2 deposition.To evaluate the spatial morphological response of injured CST axons to SCI in the context of NG2 deposition, animals were traced with biotinylated dextran amine (BDA) 10,000 molecular weight (Molecular Probes). Three hundred nanoliters of a 10% solution of BDA were injected into each of 18 sites per hemisphere of the rat forelimb sensorimotor cortex (Paxinos and Watson, 1998), using a PicoSpritzer II (General Valve, Fairfield, NJ), as described previously (Grill et al., 1997; Blesch et al., 1999). Animals were killed 7 d (n = 3) after SCI.
Anterogradely traced injured corticospinal tract axons were visualized using streptavidin Alexa 488 1:300 (Molecular Probes). Simultaneous staining of NG2 deposition was performed using the rabbit polyclonal anti-rat NG2 antibody 1:1000 (Goretzki et al., 1999) and an anti-rabbit Alexis 594 secondary antibody. Sections were blocked for 1 hr with 5% goat serum at room temperature, incubated overnight at 4°C with 1:6000 anti-NG2 and streptavidin Alexa 488 fluorophore 1:300 (Molecular Probes), washed three times with TBS, incubated for 2.5 hr with anti-rabbit Alexis 594 fluorophore, washed three times with TBS, and coverslipped with Fluoromount G. Confocal scans were then performed.
Statistics. Multiple group comparisons were made by ANOVA and post hoc Fisher's tests, using a significance level of 95%. Data are presented as mean ± SEM.
RESULTS
Silver stain and immunoblot analysis: NG2 is a major CSPG present 2 weeks after SCI
Using DEAE-Sepharose proteoglycan isolation protocols (Herndon and Lander, 1990; Yamada et al., 1994, 1997), chondroitinase ABC and silver stain analysis, we systematically characterized the relative amounts of individual CSPGs 2 weeks after SCI. In the injured tissue, CSPG core proteins were separated on 8–16% SDS-polyacrylamide gels, which allowed for a better separation of proteoglycan core proteins that mainly migrate in the range of 80–400 kDa, and four CSPG core proteins were identified corresponding to ∼400, ∼300, ∼145, and ∼80 kDa (Fig. 1, lane 1). Among them, the 300 kDa band clearly represented the most prominent CSPG species in the injured tissue. These molecular weights corresponded to published molecular weights of the core proteoglycans versican (Schmalfeldt et al., 2000), NG2 (Nishiyama et al., 1991), full-length brevican, and C-terminal fragment brevican, respectively (Yamada et al., 1994,1995). However, analysis of the intact tissue showed only weak visualization of a band at 300 kDa, with no bands at 400, 145, and 80 kDa (Fig. 1, lane 3). These results indicate upregulation of three species of CSPGs after SCI, and, among these, the NG2 band was the strongest in tissue taken from the injury site. Samples not treated with chondroitinase ABC did not show strong visualization of core proteins based on the remaining glycosylated chondroitin sulfate moieties that resulted in a weak diffuse band or no visualization of the proteoglycan (Fig. 1, lanes 2, 4). This highlights the importance of the chondroitinase ABC digestion in these procedures.
Fig. 1.

Silver stain and immunoblot analysis of total soluble CSPG proteoglycans 2 weeks after SCI. Silver Stain, Lanes 1–4; Immunoblot, lanes 5, 6;lane 1,visualization of prominent core CSPG proteoglycans, 2 weeks after SCI. Core proteoglycans are matched to previously established molecular weights: versican, ∼400 kDa; NG2, ∼300 kDa; brevican full-length, ∼145 kDa; and brevican C-terminal fragment, ∼80 kDa. Use of an 8–16% SDS stacking gel allows for comparison of relative levels of proteoglycan expression, demonstrating that NG2 is a major CSPG species after injury. The asterisk denotes the chondroitinase ABC (CHASE) enzyme added after CSPG isolation.Lane 2, CHASE omission control. A diffuse band corresponding to NG2 runs at a higher level in the gel because of chondroitin sulfates attached to the core protein. CHASE digestion of these sugars allows for clear visualization of the core proteoglycans.Lanes 3, 4, Samples from control tissue. Note the low-level, constitutive expression of a number of CSPGs in lane 3. Lanes 5, 6, NG2 immunoblot shows strong upregulation of NG2 after injury and demonstrates that this proteoglycan runs at the same molecular weight (∼300 kDa) as the band identified with silver stain analysis, confirming the identity of this band as NG2.
Immunoblotting analysis was subsequently performed to provide positive confirmation that NG2 was the band visualized at 300 kDa. Results confirmed a strong upregulation of NG2 after injury and demonstrated that NG2 runs at the same molecular weight as the 300 kDa band visualized in the silver stain (Fig. 1, lanes 5, 6). Based on the strong expression of NG2 in comparison with other CSPGs, subsequent experiments focused on examining the expression, cellular sources, and distribution of NG2 after SCI, using immunocytochemistry, immunofluorescent labeling, and axonal tracing.
Immunocytochemistry for NG2: NG2 is rapidly expressed and peaks 1 week after SCI
In the intact spinal cord, immunocytochemical analysis revealed low-level, constitutive expression of NG2 in both the intact white and gray matter (Fig. 2A). As soon as 24 hr after SCI, upregulation of NG2 was localized to cellular profiles in close proximity to the lesion (Fig.2B). Three days after injury, NG2 labeling had become markedly more extensive around the lesion site and in the host cord (Fig. 2C). Labeling further increased 7 d after injury, densely surrounding the injury site (Fig. 2D). Two weeks after injury, NG2 remained elevated yet slightly reduced compared with 1 week, and within closer proximity to the lesion site (Fig.2E). Expression was further diminished 4 weeks after injury and was present only in the immediate wall of the lesion cyst at 8 weeks after injury. Quantification of NG2 immunolabel density over the 8 week time course confirmed this overall pattern of expression, with a peak of NG2 density 7 d after injury (Fig.3B). These overall changes in NG2 expression were highly significant over time (p < 0.0001).
Fig. 2.
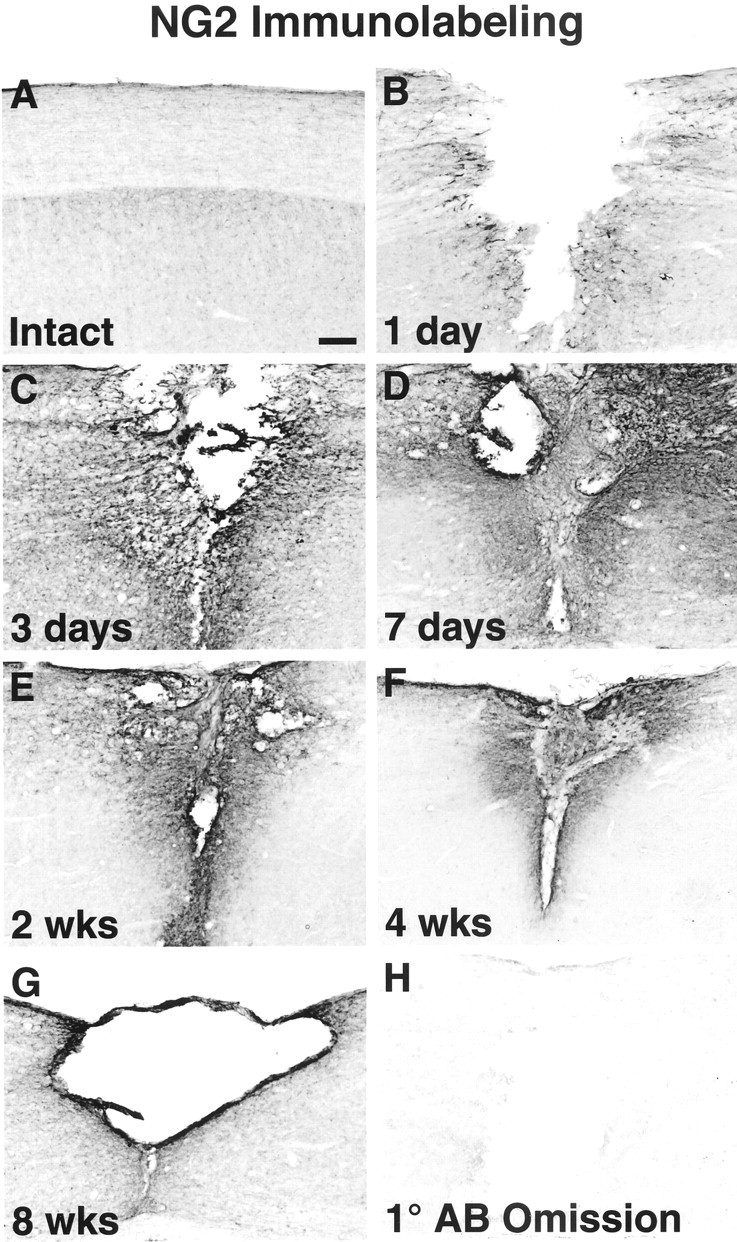
Immunocytochemical labeling of NG2 time course after SCI. A, NG2 is expressed at low constitutive levels in both the white and gray matter in the intact spinal cord. B, Twenty-four hours after SCI, NG2 is upregulated on the surface of cells in close proximity to the lesion.C, Three days after injury, NG2 deposition continues to increase in the injured cord parenchyma. D, Heavy deposition of NG2 is seen surrounding the lesion at 1 week after injury. E–G, NG2 continues to be expressed within the lesion site in the following weeks and gradually declines.H, The primary antibody omission control (1° AB Omission) exhibits only low-level background staining. Sagittal sections are positioned so that the left side is always representative of the tissue rostral to the lesion. Scale bar, 177 μm.
Immunolabeling for several other CSPGs also revealed regulation of expression after SCI (Fig.4A–J). Seven days after injury, expression of versican (Fig. 4C,D) and brevican (Fig. 4E,F) was restricted to the immediate vicinity of the lesion. Neurocan expression was only weakly upregulated (Fig. 4G,H), and phosphacan was actually downregulated in injured tissue bordering the lesion (Fig.4I,J). These results agree with patterns observed with silver stain analysis, which demonstrated modest regulation of bands corresponding to versican and brevican (Fig. 1,lane 1).
Fig. 4.

Immunocytochemical labeling of CSPGs after SCI. A–H, Immunolabeling of several members of the family of CSPG molecules demonstrates only moderate regulation at 7 d after SCI, when NG2 expression is peaking. B,As shown previously in Figure 2, NG2 is strongly expressed and surrounds the injury site. C–H, At the same time point, the CSPGs versican and brevican are moderately upregulated, and neurocan is only weakly expressed. I, J, Phosphacan is downregulated after injury. Dashed lines outline the border of the lesion. Note the absence of phosphacan labeling in the damaged tissue in direct proximity to the lesion. Sagittal sections are positioned so that the left side is representative of the tissue rostral to the lesion. Scale bar, 177 μm.
NG2 is produced by oligodendrocyte progenitors
High-resolution confocal microscopy identified oligodendrocyte progenitors as a cellular source of NG2 in the injured site (Fig.5A–C). To identify oligodendrocyte progenitor cells, we developed a rabbit polyclonal antibody specific to rat PDGF α-receptor, a cellular marker previously shown to be specific to oligodendrocyte progenitors (Nishiyama et al., 1996). Cells labeled with anti-PDGF α-receptor exhibited long, thin processes extending from the cell body (Fig.5B). Double label experiments demonstrated distinct colocalization of NG2 with these oligodendrocyte progenitors (Fig.5C). After injury, PDGF α-receptor cells were greater in quantity in the injured tissue surrounding the lesion. These cells retained their long cellular processes and exhibited high colocalization to NG2 (Fig. 5A–C). The cellular response to injury by the oligodendrocyte progenitors was particularly evident in the injured tissue up to 400 μm from the wall of the lesion cavity between 3 d and 4 weeks after lesion, but was still noticeable 8 weeks after injury.
Fig. 5.
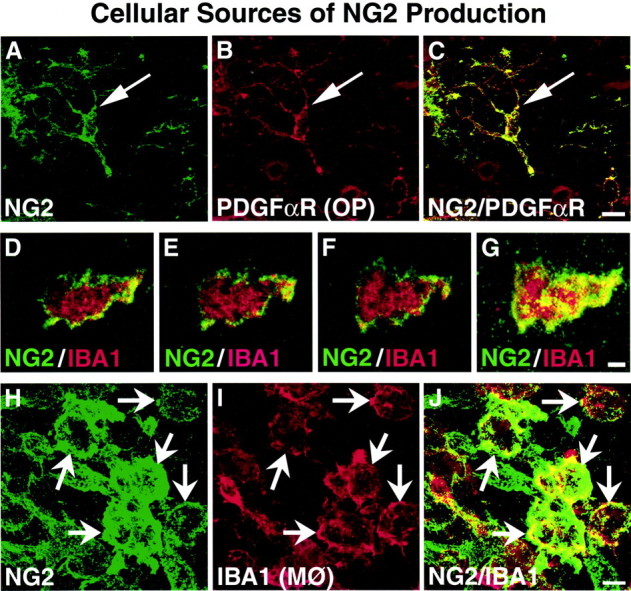
NG2 is produced by oligodendrocyte progenitors and macrophages after SCI. A–C, PDGF α-receptor is a cellular marker for oligodendrocyte precursor (OP) cells; colocalization studies 3 d after SCI demonstrate that NG2 is colocalized with this cell type. NG2 is present in the perikaryon (arrows) and throughout the cellular processes. Scale bar, 11 μm. D–J, IBA1 is a cellular marker for macrophages (MØ) and microglia. During the early time points after SCI, a large number of IBA1-labeled macrophages is seen at the immediate lesion site. D–F, Thin serial section confocal images of an individual macrophage 1 d after lesion reveal that NG2 labeling is associated with the surface of macrophages.G, Serial images combined in a Z-stack exhibit the large extent of the total macrophage surface covered by NG2. Scale bar, 3 μm. H–J, NG2 is highly colocalized to IBA1 macrophages in spinal cord parenchyma 3 d after injury.J, Numerous macrophages show punctate labeling of NG2 (arrows) along the entire cellular surface. Scale bar, 7 μm.
NG2 is produced by macrophages but not by microglia or astrocytes after SCI
Macrophages were identified as another source of NG2 after SCI. The combination of IBA1 immunolabeling and morphological analysis indicated that macrophages constitute the primary source of NG2 labeling at the immediate site of SCI (Fig. 5D–G), particularly the injured tissue adjoining the wall of the lesion cavity and in the lesion cavity itself. Macrophages were identified based on observations of typical ameboid macrophage morphology (Kreutzberg, 1996), with ruffled membranes and oblong cell bodies of IBA1-labeled cells. This is in contrast to the IBA1-labeled microglia that have a highly structured, ramified morphology. As soon as 1 d after SCI, ameboid macrophages were observed at the immediate site of injury and in close proximity to the lesion (Fig. 5D–G). Thin-section confocal images (1 μm) reconstituted through a 20 μm Z-stack revealed that NG2 labeling was associated with the cellular surface of macrophages in the injury site (Fig. 5D–G) as soon as 1 d after injury. By 3 d after injury, IBA1-labeled ameboid macrophages had greatly increased in number compared with observations 1 d after lesion and were observed both as individual cells and grouped in clusters. NG2-labeled macrophages predominantly lined the wall of the lesion cavity and penetrated the host tissue in regions of tissue degeneration (Fig. 5I). Similar to 1 d post-lesion, punctate NG2 labeling was highly specific to the cell surface of the ameboid macrophages (Fig. 5H–J). NG2 macrophages were most prominent during the first 2 weeks after SCI and contributed to the general deposition of NG2 in the injured tissue closest to the wall of the lesion cavity and in regions of parenchymal degeneration. Farther into the host tissue, away from regions of massive degeneration, oligodendrocyte progenitors, as opposed to macrophages, appeared to be the primary source of NG2. By 4 weeks after injury, the number of NG2-labeled macrophages was markedly reduced, with only scattered, individual cells adjacent to the lesion cavity. NG2-labeled macrophages were no longer observed 8 weeks after SCI.
On the other hand, microglia were not sources of NG2. In the intact spinal cord, immunocytochemical analysis with IBA1, a marker of both microglia and macrophages, identified the typical ramified morphology of microglia throughout the white and gray matter. Double labeling did not reveal colocalization of NG2 with IBA1-labeled ramified microglia in the intact cord. After SCI, partially ramified IBA1 cells were present in the lesioned region (Fig.6B). However, no NG2 labeling was found on ramified or partially ramified IBA1 cells at any time (1 d to 8 weeks) after SCI (Fig. 6A–C). Three-dimensional rotation of confocal Z-stack images did reveal that NG2 labeling at times was close to the IBA1 ramified cells (microglia), but this NG2 labeling was not present on the cell surface.
Fig. 6.
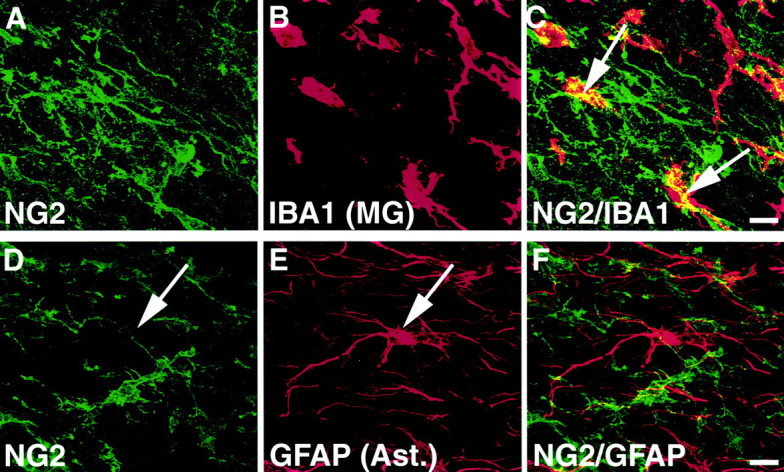
NG2 does not colocalize with microglia or to astrocytes. A–C, Partially ramified IBA1-labeled microglia were present in close proximity to the lesion but did not colocalize to NG2. Rotation of confocal Z-stack images in three dimensions clearly revealed NG2 labeling that was merely in the vicinity of, but not associated with, the cell surface (arrows). Scale bar, 11 μm. D–F,Colocalization experiments also exhibit no association of NG2 with GFAP-labeled astrocytes (arrows). Scale bar, 11 μm.
Notably, NG2 did not colocalize with GFAP-labeled astrocytes in either intact or injured tissue (Fig. 6D–F). NG2-labeled processes occasionally appeared close to the surface of reactive astrocytes. However, thin-section confocal images (1 μm) reconstituted through a 20 μm Z-stack revealed that NG2 labeling was not present on the cellular surface of the astrocytes but was instead associated with neighboring GFAP-negative cellular processes.
NG2 expression surrounds CST axons after injury
The anterograde tracer BDA was used to determine the association of NG2 deposition with injury to an important functional system, the CST, of the spinal cord. Double labeling for CST axons with BDA and anti-NG2 demonstrated that, 7 d after injury, transected CST axons were directly apposed to a dense region of NG2 labeling; only rare axons were observed actually within parenchymal deposits of NG2 (Fig.7). Short distance growth of CST axons was observed, however, in gray matter underlying the transected axons where NG2 labeling was weak or absent. Thus, where forward processes of injured CST axons are juxtaposed to heavy NG2 deposition, axonal extension failed to occur.
Fig. 7.
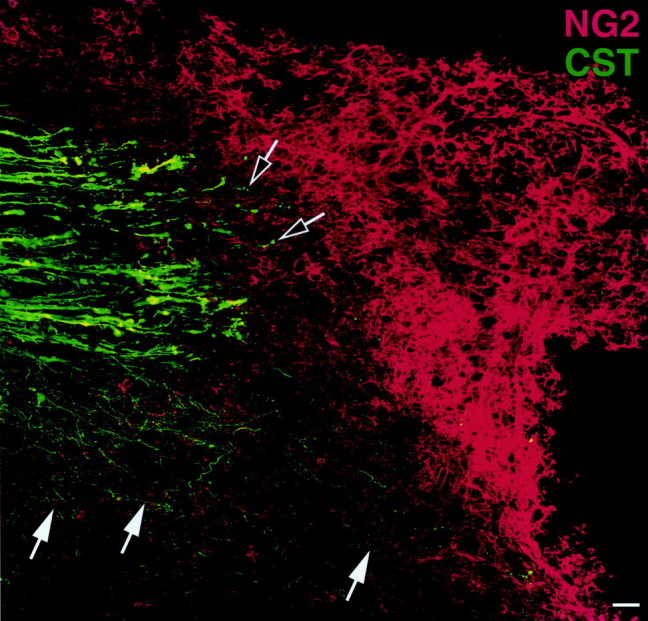
Expression of NG2 in relation to transected corticospinal axons. Confocal analysis of BDA-traced transected CST axons demonstrates deposition of NG2 at the transected ends of the CST axons 7 d after injury. Black and white arrowsindicate that very few CST axons are present in the region of dense NG2 labeling. Notably, sprouting of CST axons (white arrows) occurs in the underlying gray matter where NG2 expression is least prominent. Thus, NG2 deposition could limit axonal regeneration after CNS injury. This figure is a composite of 12 individual images. Scale bar, 39 μm.
DISCUSSION
Inhibition of axonal growth after SCI is thought to play a significant role in preventing regeneration and functional recovery. Several in vitro and in vivo reports postulate that inhibitory CSPGs are one component of a series of inhibitory substrates that are expressed after SCI; other inhibitory substrates include the myelin-associated inhibitors NoGo and myelin-associated glycoprotein (McKerracher et al., 1994; Filbin, 1995; Huber and Schwab, 2000). The purpose of the present study was to evaluate the relative amounts and temporal–spatial expression patterns of the individual CSPG species to better understand their individual contribution to inhibition of axonal growth after injury. Our results demonstrate that NG2 is a major CSPG family member expressed 2 weeks after SCI. NG2 expression peaks 7 d after injury and is the result of a multicellular response to SCI, involving both oligodendrocyte progenitors and macrophages. We also find that NG2 deposition surrounds the injured corticospinal tract within 7 d of injury, potentially inhibiting axonal regeneration. Together with potent inhibitory effects on neurite outgrowth in vitro (Dou and Levine, 1994; Fidler et al., 1999), our results suggest that NG2 is an important putatively inhibitory CSPG expressed after SCI.
The inhibitory potential of CSPGs on neurite outgrowth has been characterized in vitro (Dou and Levine, 1994; Friedlander et al., 1994; Milev et al., 1994; Braunewell et al., 1995; Yamada et al., 1997; Fidler et al., 1999; Schmalfeldt et al., 2000). However, it remains unknown whether the inhibitory moiety of CSPGs is the chondroitin sulfate side chains coupled to all of the core proteoglycans of this class of molecules, or whether it is actually the core protein of individual proteoglycans that is inhibitory. Thus, expression profiles of both the family of CSPGs as well as the individual CSPG species after CNS injury are important in further identifying the inhibitory properties of these ECM molecules.
Although it is known that CSPGs are generally upregulated after CNS injury (Fitch and Silver, 1997; Stichel et al., 1999), including SCI (Fitch and Silver, 1997; Lemons et al., 1999; Pasterkamp et al., 2001;Plant et al., 2001), the relative quantities of individual CSPGs after CNS injury have not previously been characterized. Relative amounts of the different CSPGs have been difficult to determine because immunocytochemical and immunoblotting methods only allow comparison of a single CSPG to itself (in different tissues or under different conditions, e.g., intact vs injured); expression across different CSPG species cannot be compared because antibodies bear different affinities to their respective antigens. To allow relative comparisons of total soluble CSPGs to one another, we therefore used SDS-PAGE silver staining after DEAE isolation of proteoglycans, followed by chondroitinase ABC digestion. Successful DEAE isolation of brain CSPGs was first established by Herndon and Lander (1990) and later confirmed and extended independently to demonstrate relative proportions of proteoglycans in the developing nervous system (Yamada et al., 1994,1997). Whereas DEAE–silver staining has been an accepted method for demonstrating differences in relative amounts of proteoglycans, there remain caveats to be considered in drawing conclusions regarding total levels of various substances assessed by this method. For example, because various proteoglycan core proteins are known to contain different numbers of glycosaminoglycan chains, differences in binding affinity to the DEAE matrix could occur on the basis of the total negative charge contributed by these chains. Core proteins that have highly substituted residues might therefore be preferentially bound to the DEAE matrix, even if they are present in lower amounts in the tissue. In the case of NG2, however, only one sulfated chondroitin moiety is associated with the core protein (a ratio of 1:1) (Stallcup and Dahlin-Huppe, 2001), a ratio that is far lower than the other CSPGs including brevican (three sulfated chondroitin moieties per core protein, a ratio of 3:1), neurocan (7:1), and versican (20:1) (for review, see Yamaguchi, 2000). Thus, NG2 would be predicted to bind less efficiently during DEAE chromatography than the other CSPG family members, based on side chain ratios, tending, if anything, to underestimate its total abundance. Other factors that can also influence band intensity on silver staining include amino acid composition of the core proteoglycan (Wray et al., 1981) and the presence of nonchondroitin glycosaminoglycan moieties.
Another factor to consider when comparing relative quantities of CSPGs after SCI is the solubility of a given species. NG2 originates as a cell surface molecule and becomes a soluble component of the extracellular matrix after cleavage from its transmembrane domain (Nishiyama et al., 1995). However, a pool of NG2 may remain membrane-bound as an insoluble pool. DEAE/SDS-PAGE was performed on the soluble pool in the present study, and versican, brevican, and neurocan exist only in soluble forms (Yamaguchi, 2000). Thus, additional undetected quantities of NG2 may have existed in an insoluble pool, again potentially underestimating total quantities of NG2 in the present study.
It is also hypothetically possible that the relative abundance of NG2 observed in the silver stain analysis was the result of increased cleavage of the transmembrane (soluble) form into an insoluble pool. However, immunocytochemical labeling confirmed that the overall expression of NG2 did in fact increase after SCI (Fig. 2).
Thus, the present findings support the conclusion that NG2 is a major component of CSPG expression after SCI, thereby potentially exerting an important role in limiting axonal regeneration. Indeed, with the preceding caveats acknowledged, NG2 could represent the predominant CSPG species present after spinal cord injury.
Among the other CSPG family members, phosphacan was not detected with our DEAE/silver staining analysis. However, immunocytochemical labeling using a monoclonal antibody specific to phosphacan (Maurel et al., 1994; Meyer-Puttlitz et al., 1996) demonstrated a downregulation of phosphacan (Fig. 4), consistent with a previous report (McKeon et al., 1999).
To date, NG2 expression in the CNS and its upregulation after injury has been primarily attributed to oligodendrocyte progenitor cells (for review, see Dawson et al., 2000). In the present study, we confirm that oligodendrocyte progenitors express NG2 after injury, but we also identify macrophages as another cell type that substantially contributes to NG2 deposition after SCI. Indeed, the predominant cell type contributing to NG2 deposition at the immediate injury site is the macrophage (Fig. 5). These IBA1- and NG2-labeled macrophages were predominantly present in and on the perimeter of the lesion cavity, and in regions of tissue degeneration. Resident CNS microglia in the intact tissue, and partially ramified microglia in close proximity to the lesion, did not express NG2 (Fig. 6A–C). The fact that IBA1-labeled cells with morphological features of macrophages are observed only acutely and subacutely after injury and only in the immediate area of injury and regeneration, suggests that NG2-expressing macrophages arise from blood and not from CNS microglia. Interestingly, a recent study reported macrophage expression of NG2 in the hippocampus after a kainate excitotoxic lesion (Bu et al., 2001). The latter study did not observe NG2-labeled macrophages in hippocampal slice cultures treated with kainic acid. This further suggests that NG2-labeled macrophages are derived from blood and migrate into the degenerating tissue, because hippocampal slices were first treated with kainic acid after they were placed in a controlled environment. A second study also reported NG2 expression by macrophages in the dorsal root entry zone after rhizotomy (Bu et al., 2001; Zhang et al., 2001). These NG2-labeled macrophages appeared on the outer portion of the lesioned tissue and could also be peripheral macrophages.
Although recent in vitro studies report that astrocytes can produce NG2 (Fidler et al., 1999; Hirsch and Bahr, 1999), we were unable to identify astrocytes as an in vivo source of NG2 after SCI. Using sequential analysis confocal imagery, we showed that GFAP-labeled astrocytes do not express NG2 within the time frame of 1 d to 8 weeks after SCI (Fig. 6D–F). NG2-labeled, GFAP-negative processes occasionally appeared near the surface of reactive astrocytes, but cellular astrocyte NG2 labeling was not observed. This suggests that NG2 expression by astrocytes may not be a prominent feature of the more complex cascade of cellular and inflammatory changes that accompany in vivo CNS injury.
NG2 has been identified as a potent inhibitor of neurite outgrowthin vitro (Dou and Levine, 1994; Fidler et al., 1999). Thus, deposition of NG2 after CNS injury could form a barrier blocking axonal regeneration. Data from this study demonstrated extensive NG2 deposition in the vicinity of transected corticospinal axons that could contribute to inhibition of growth (Fig. 7). Interestingly, some growth of dorsal CST axons did occur into gray matter underlying the transected axons, and in this region NG2 labeling was weak. Indeed, a recent study suggests that general degradation of CSPGs enhances axonal growth in the injured CNS (Moon et al., 2001), although the specific contribution of NG2 or other specific CSPG family members to these observations remains to be determined.
Results from the current study define NG2 as a major CSPG species expressed after SCI and suggest that regeneration of CST axons may be inhibited by substantial deposition of NG2 at the lesion site. Targeted reduction of NG2 deposition at the injury site, which could be attempted by antisense technology or by pharmacological protocols that limit the macrophage and oligodendrocyte precursor cell response to injury, may create a less inhibitory environment and augment axonal growth after injury. Alternatively, strategies might focus on counterbalancing potentially inhibitory properties of NG2 with positive growth-promoting molecules, such as neurotrophic factors (Tetzlaff et al., 1994; Jones et al., 2001). Interestingly, the neurotrophic factor NGF increases the accumulation of existing integrin ECM receptors on growth cones (Grabham and Goldberg, 1997). Such a mechanism could potentially stimulate sensitivity of regenerating axons to existing permissive ECM substrates and enhance axonal growth. A recent study further demonstrates that overexpression of integrin ECM receptors above basal levels augments the ability of adult axons to overcome inhibitory properties of CSPGs in vitro (Condic, 2001). Combining protocols that both reduce NG2 and that trigger intrinsic axonal mechanisms to overcome inhibitory cues in the ECM may represent a useful combination for enhancing axonal regeneration in vivo.
Footnotes
This work was supported by National Institutes of Health Grants NS10927, NS32717, RO1NS42291, and RO1NS37083, the Christopher Reeve Paralysis Foundation, the Veterans Administration, and the Hollfelder Foundation. The IBA1 polyclonal antibody was a generous gift from Dr. Yoshinori Imai (National Institute of Neuroscience, Tokyo, Japan). The versican monoclonal antibody (12C5), the phosphacan monoclonal antibody (3F8), and the neurocan monoclonal antibody (IF6) were obtained from the Developmental Studies Hybridoma Bank. We thank Dana Sajed for his excellent technical assistance.
Correspondence should be addressed to Dr. Mark H. Tuszynski, Department of Neurosciences-0626, University of California, San Diego, 9500 Gilman Drive, La Jolla, CA 92093. E-mail: mtuszyns@ucsd.edu.
REFERENCES
- 1.Blesch A, Uy HS, Grill RJ, Cheng JG, Patterson PH, Tuszynski MH. Leukemia inhibitory factor augments neurotrophin expression and corticospinal axon growth after adult CNS injury. J Neurosci. 1999;19:3556–3566. doi: 10.1523/JNEUROSCI.19-09-03556.1999. [DOI] [PMC free article] [PubMed] [Google Scholar]
- 2.Bradbury EJ, Moon LD, King VR, Priestley JV, Fawcett JW, McMahon SB (2001) Chondroitinase ABC promotes regeneration and functional recovery following spinal cord injury. 31st Annual Meeting, Society for Neuroscience, San Diego, CA, November.
- 3.Braunewell KH, Pesheva P, McCarthy JB, Furcht LT, Schmitz B, Schachner M. Functional involvement of sciatic nerve-derived versican- and decorin-like molecules and other chondroitin sulphate proteoglycans in ECM-mediated cell adhesion and neurite outgrowth. Eur J Neurosci. 1995;7:805–814. doi: 10.1111/j.1460-9568.1995.tb00683.x. [DOI] [PubMed] [Google Scholar]
- 4.Bu J, Akhtar N, Nishiyama A. Transient expression of the NG2 proteoglycan by a subpopulation of activated macrophages in an excitotoxic hippocampal lesion. Glia. 2001;34:296–310. doi: 10.1002/glia.1063. [DOI] [PubMed] [Google Scholar]
- 5.Bunge RP, Puckett WR, Hiester ED. Observations on the pathology of several types of human spinal cord injury, with emphasis on the astrocyte response to penetrating injuries. Adv Neurol. 1997;72:305–315. [PubMed] [Google Scholar]
- 6.Chang A, Nishiyama A, Peterson J, Prineas J, Trapp BD. NG2-positive oligodendrocyte progenitor cells in adult human brain and multiple sclerosis lesions. J Neurosci. 2000;20:6404–6412. doi: 10.1523/JNEUROSCI.20-17-06404.2000. [DOI] [PMC free article] [PubMed] [Google Scholar]
- 7.Condic ML. Adult neuronal regeneration induced by transgenic integrin expression. J Neurosci. 2001;21:4782–4788. doi: 10.1523/JNEUROSCI.21-13-04782.2001. [DOI] [PMC free article] [PubMed] [Google Scholar]
- 8.Dawson MR, Levine JM, Reynolds R. NG2-expressing cells in the central nervous system: are they oligodendroglial progenitors? J Neurosci Res. 2000;61:471–479. doi: 10.1002/1097-4547(20000901)61:5<471::AID-JNR1>3.0.CO;2-N. [DOI] [PubMed] [Google Scholar]
- 9.Dou CL, Levine JM. Inhibition of neurite growth by the NG2 chondroitin sulfate proteoglycan. J Neurosci. 1994;14:7616–7628. doi: 10.1523/JNEUROSCI.14-12-07616.1994. [DOI] [PMC free article] [PubMed] [Google Scholar]
- 10.Fawcett JW, Asher RA. The glial scar and central nervous system repair. Brain Res Bull. 1999;49:377–391. doi: 10.1016/s0361-9230(99)00072-6. [DOI] [PubMed] [Google Scholar]
- 11.Fidler PS, Schuette K, Asher RA, Dobbertin A, Thornton SR, Calle-Patino Y, Muir E, Levine JM, Geller HM, Rogers JH, Faissner A, Fawcett JW. Comparing astrocytic cell lines that are inhibitory or permissive for axon growth: the major axon-inhibitory proteoglycan is NG2. J Neurosci. 1999;19:8778–8788. doi: 10.1523/JNEUROSCI.19-20-08778.1999. [DOI] [PMC free article] [PubMed] [Google Scholar]
- 12.Filbin MT. Myelin-associated glycoprotein: a role in myelination and in the inhibition of axonal regeneration? Curr Opin Neurobiol. 1995;5:588–595. doi: 10.1016/0959-4388(95)80063-8. [DOI] [PubMed] [Google Scholar]
- 13.Fitch MT, Silver J. Glial cell extracellular matrix: boundaries for axon growth in development and regeneration. Cell Tissue Res. 1997;290:379–384. doi: 10.1007/s004410050944. [DOI] [PubMed] [Google Scholar]
- 14.Fitch MT, Silver J. Beyond the glial scar. In: Tuszynski MH, Kordower JH, editors. CNS regeneration. Academic; San Diego: 1999. pp. 55–88. [Google Scholar]
- 15.Friedlander DR, Milev P, Karthikeyan L, Margolis RK, Margolis RU, Grumet M. The neuronal chondroitin sulfate proteoglycan neurocan binds to the neural cell adhesion molecules Ng-CAM/L1/NILE and N-CAM, and inhibits neuronal adhesion and neurite outgrowth. J Cell Biol. 1994;125:669–680. doi: 10.1083/jcb.125.3.669. [DOI] [PMC free article] [PubMed] [Google Scholar]
- 16.Goretzki L, Burg MA, Grako KA, Stallcup WB. High-affinity binding of basic fibroblast growth factor and platelet- derived growth factor-AA to the core protein of the NG2 proteoglycan. J Biol Chem. 1999;274:16831–16837. doi: 10.1074/jbc.274.24.16831. [DOI] [PubMed] [Google Scholar]
- 17.Grabham PW, Goldberg DJ. Nerve growth factor stimulates the accumulation of beta1 integrin at the tips of filopodia in the growth cones of sympathetic neurons. J Neurosci. 1997;17:5455–5465. doi: 10.1523/JNEUROSCI.17-14-05455.1997. [DOI] [PMC free article] [PubMed] [Google Scholar]
- 18.Grill R, Murai K, Blesch A, Gage FH, Tuszynski MH. Cellular delivery of neurotrophin-3 promotes corticospinal axonal growth and partial functional recovery after spinal cord injury. J Neurosci. 1997;17:5560–5572. doi: 10.1523/JNEUROSCI.17-14-05560.1997. [DOI] [PMC free article] [PubMed] [Google Scholar]
- 19.Haas CA, Rauch U, Thon N, Merten T, Deller T. Entorhinal cortex lesion in adult rats induces the expression of the neuronal chondroitin sulfate proteoglycan neurocan in reactive astrocytes. J Neurosci. 1999;19:9953–9963. doi: 10.1523/JNEUROSCI.19-22-09953.1999. [DOI] [PMC free article] [PubMed] [Google Scholar]
- 20.Herndon ME, Lander AD. A diverse set of developmentally regulated proteoglycans is expressed in the rat central nervous system. Neuron. 1990;4:949–961. doi: 10.1016/0896-6273(90)90148-9. [DOI] [PubMed] [Google Scholar]
- 21.Hirsch S, Bahr M. Immunocytochemical characterization of reactive optic nerve astrocytes and meningeal cells. Glia. 1999;26:36–46. doi: 10.1002/(sici)1098-1136(199903)26:1<36::aid-glia4>3.0.co;2-c. [DOI] [PubMed] [Google Scholar]
- 22.Huber AB, Schwab ME. Nogo-A, a potent inhibitor of neurite outgrowth and regeneration. J Biol Chem. 2000;381:407–419. doi: 10.1515/BC.2000.053. [DOI] [PubMed] [Google Scholar]
- 23.Ito D, Imai Y, Ohsawa K, Nakajima K, Fukuuchi Y, Kohsaka S. Microglia-specific localisation of a novel calcium binding protein, Iba1. Brain Res Mol Brain Res. 1998;57:1–9. doi: 10.1016/s0169-328x(98)00040-0. [DOI] [PubMed] [Google Scholar]
- 24.Jones LL, Oudega M, Bunge MB, Tuszynski MH. Neurotrophic factors, cellular bridges and gene therapy for spinal cord injury. J Physiol (Lond) 2001;533:83–89. doi: 10.1111/j.1469-7793.2001.0083b.x. [DOI] [PMC free article] [PubMed] [Google Scholar]
- 25.Keirstead HS, Levine JM, Blakemore WF. Response of the oligodendrocyte progenitor cell population (defined by NG2 labelling) to demyelination of the adult spinal cord. Glia. 1998;22:161–170. [PubMed] [Google Scholar]
- 26.Kreutzberg GW. Microglia: a sensor for pathological events in the CNS. Trends Neurosci. 1996;19:312–318. doi: 10.1016/0166-2236(96)10049-7. [DOI] [PubMed] [Google Scholar]
- 27.Lee KH, Bowen-Pope DF, Reed RR. Isolation and characterization of the alpha platelet-derived growth factor receptor from rat olfactory epithelium. Mol Cell Biol. 1990;10:2237–2246. doi: 10.1128/mcb.10.5.2237. [DOI] [PMC free article] [PubMed] [Google Scholar]
- 28.Lemons ML, Howland DR, Anderson DK. Chondroitin sulfate proteoglycan immunoreactivity increases following spinal cord injury and transplantation. Exp Neurol. 1999;160:51–65. doi: 10.1006/exnr.1999.7184. [DOI] [PubMed] [Google Scholar]
- 29.Levine JM. Increased expression of the NG2 chondroitin-sulfate proteoglycan after brain injury. J Neurosci. 1994;14:4716–4730. doi: 10.1523/JNEUROSCI.14-08-04716.1994. [DOI] [PMC free article] [PubMed] [Google Scholar]
- 30.Levine JM, Reynolds R. Activation and proliferation of endogenous oligodendrocyte precursor cells during ethidium bromide-induced demyelination. Exp Neurol. 1999;160:333–347. doi: 10.1006/exnr.1999.7224. [DOI] [PubMed] [Google Scholar]
- 31.Levine JM, Enquist LW, Card JP. Reactions of oligodendrocyte precursor cells to alpha herpesvirus infection of the central nervous system. Glia. 1998;23:316–328. [PubMed] [Google Scholar]
- 32.Maurel P, Rauch U, Flad M, Margolis RK, Margolis RU. Phosphacan, a chondroitin sulfate proteoglycan of brain that interacts with neurons and neural cell-adhesion molecules, is an extracellular variant of a receptor-type protein tyrosine phosphatase. Proc Natl Acad Sci USA. 1994;91:2512–2516. doi: 10.1073/pnas.91.7.2512. [DOI] [PMC free article] [PubMed] [Google Scholar]
- 33.McKeon RJ, Jurynec MJ, Buck CR. The chondroitin sulfate proteoglycans neurocan and phosphacan are expressed by reactive astrocytes in the chronic CNS glial scar. J Neurosci. 1999;19:10778–10788. doi: 10.1523/JNEUROSCI.19-24-10778.1999. [DOI] [PMC free article] [PubMed] [Google Scholar]
- 34.McKerracher L, David S, Jackson DL, Kottis V, Dunn RJ, Braun PE. Identification of myelin-associated glycoprotein as a major myelin- derived inhibitor of neurite growth. Neuron. 1994;13:805–811. doi: 10.1016/0896-6273(94)90247-x. [DOI] [PubMed] [Google Scholar]
- 35.Meyer-Puttlitz B, Junker E, Margolis RU, Margolis RK. Chondroitin sulfate proteoglycans in the developing central nervous system. II. Immunocytochemical localization of neurocan and phosphacan. J Comp Neurol. 1996;366:44–54. doi: 10.1002/(SICI)1096-9861(19960226)366:1<44::AID-CNE4>3.0.CO;2-K. [DOI] [PubMed] [Google Scholar]
- 36.Milev P, Friedlander DR, Sakurai T, Karthikeyan L, Flad M, Margolis RK, Grumet M, Margolis RU. Interactions of the chondroitin sulfate proteoglycan phosphacan, the extracellular domain of a receptor-type protein tyrosine phosphatase, with neurons, glia, and neural cell adhesion molecules. J Cell Biol. 1994;127:1703–1715. doi: 10.1083/jcb.127.6.1703. [DOI] [PMC free article] [PubMed] [Google Scholar]
- 37.Moon LD, Asher RA, Rhodes KE, Fawcett JW. Regeneration of CNS axons back to their target following treatment of adult rat brain with chondroitinase ABC. Nat Neurosci. 2001;4:465–466. doi: 10.1038/87415. [DOI] [PubMed] [Google Scholar]
- 38.Nishiyama A, Dahlin KJ, Prince JT, Johnstone SR, Stallcup WB. The primary structure of NG2, a novel membrane-spanning proteoglycan. J Cell Biol. 1991;114:359–371. doi: 10.1083/jcb.114.2.359. [DOI] [PMC free article] [PubMed] [Google Scholar]
- 39.Nishiyama A, Lin XH, Stallcup WB. Generation of truncated forms of the NG2 proteoglycan by cell surface proteolysis. Mol Biol Cell. 1995;6:1819–1832. doi: 10.1091/mbc.6.12.1819. [DOI] [PMC free article] [PubMed] [Google Scholar]
- 40.Nishiyama A, Lin XH, Giese N, Heldin CH, Stallcup WB. Co-localization of NG2 proteoglycan and PDGF alpha-receptor on O2A progenitor cells in the developing rat brain. J Neurosci Res. 1996;43:299–314. doi: 10.1002/(SICI)1097-4547(19960201)43:3<299::AID-JNR5>3.0.CO;2-E. [DOI] [PubMed] [Google Scholar]
- 41.Nishiyama A, Yu M, Drazba JA, Tuohy VK. Normal and reactive NG2+ glial cells are distinct from resting and activated microglia. J Neurosci Res. 1997;48:299–312. doi: 10.1002/(sici)1097-4547(19970515)48:4<299::aid-jnr2>3.0.co;2-6. [DOI] [PubMed] [Google Scholar]
- 42.Ohsawa K, Imai Y, Kanazawa H, Sasaki Y, Kohsaka S. Involvement of iba1 in membrane ruffling and phagocytosis of macrophages/microglia. J Cell Sci. 2000;113:3073–3084. doi: 10.1242/jcs.113.17.3073. [DOI] [PubMed] [Google Scholar]
- 43.Ong WY, Levine JM. A light and electron microscopic study of NG2 chondroitin sulfate proteoglycan-positive oligodendrocyte precursor cells in the normal and kainate-lesioned rat hippocampus. Neuroscience. 1999;92:83–95. doi: 10.1016/s0306-4522(98)00751-9. [DOI] [PubMed] [Google Scholar]
- 44.Palfreyman JW, Thomas DG, Ratcliffe JG, Graham DI. Glial fibrillary acidic protein (GFAP): purification from human fibrillary astrocytoma, development and validation of a radioimmunoassay for GFAP-like immunoactivity. J Neurol Sci. 1979;41:101–113. doi: 10.1016/0022-510x(79)90144-8. [DOI] [PubMed] [Google Scholar]
- 45.Pasterkamp RJ, Anderson PN, Verhaagen J. Peripheral nerve injury fails to induce growth of lesioned ascending dorsal column axons into spinal cord scar tissue expressing the axon repellent Semaphorin3A. Eur J Neurosci. 2001;13:457–471. doi: 10.1046/j.0953-816x.2000.01398.x. [DOI] [PubMed] [Google Scholar]
- 46.Paxinos G, Watson C. The rat brain in stereotaxic coordinates. Academic; San Diego: 1998. [DOI] [PubMed] [Google Scholar]
- 47.Plant GW, Bates ML, Bunge MB. Inhibitory proteoglycan immunoreactivity is higher at the caudal than the rostral Schwann cell graft-transected spinal cord interface. Mol Cell Neurosci. 2001;17:471–487. doi: 10.1006/mcne.2000.0948. [DOI] [PubMed] [Google Scholar]
- 48.Redwine JM, Armstrong RC. In vivo proliferation of oligodendrocyte progenitors expressing PDGFalphaR during early remyelination. J Neurobiol. 1998;37:413–428. doi: 10.1002/(sici)1097-4695(19981115)37:3<413::aid-neu7>3.0.co;2-8. [DOI] [PubMed] [Google Scholar]
- 49.Schmalfeldt M, Bandtlow CE, Dours-Zimmermann MT, Winterhalter KH, Zimmermann DR. Brain derived versican V2 is a potent inhibitor of axonal growth. J Cell Sci. 2000;113:807–816. doi: 10.1242/jcs.113.5.807. [DOI] [PubMed] [Google Scholar]
- 50.Stallcup WB, Dahlin-Huppe K. Chondroitin sulfate and cytoplasmic domain-dependent membrane targeting of the NG2 proteoglycan promotes retraction fiber formation and cell polarization. J Cell Sci. 2001;114:2315–2325. doi: 10.1242/jcs.114.12.2315. [DOI] [PubMed] [Google Scholar]
- 51.Stallcup WB, Beasley L, Levine J. Cell-surface molecules that characterize different stages in the development of cerebellar interneurons. Cold Spring Harb Symp Quant Biol. 1983;48:761–774. doi: 10.1101/sqb.1983.048.01.078. [DOI] [PubMed] [Google Scholar]
- 52.Stallcup WB, Dahlin K, Healy P. Interaction of the NG2 chondroitin sulfate proteoglycan with type VI collagen. J Cell Biol. 1990;111:3177–3188. doi: 10.1083/jcb.111.6.3177. [DOI] [PMC free article] [PubMed] [Google Scholar]
- 53.Stichel CC, Niermann H, D'Urso D, Lausberg F, Hermanns S, Muller HW. Basal membrane-depleted scar in lesioned CNS: characteristics and relationships with regenerating axons. Neuroscience. 1999;93:321–333. doi: 10.1016/s0306-4522(99)00112-8. [DOI] [PubMed] [Google Scholar]
- 54.Tetzlaff W, Kobayashi NR, Giehl KM, Tsui BJ, Cassar SL, Bedard AM. Response of rubrospinal and corticospinal neurons to injury and neurotrophins. Prog Brain Res. 1994;103:271–286. doi: 10.1016/s0079-6123(08)61142-5. [DOI] [PubMed] [Google Scholar]
- 55.Thon N, Haas CA, Rauch U, Merten T, Fassler R, Frotscher M, Deller T. The chondroitin sulphate proteoglycan brevican is upregulated by astrocytes after entorhinal cortex lesions in adult rats. Eur J Neurosci. 2000;12:2547–2558. doi: 10.1046/j.1460-9568.2000.00109.x. [DOI] [PubMed] [Google Scholar]
- 56.Tillet E, Ruggiero F, Nishiyama A, Stallcup WB. The membrane-spanning proteoglycan NG2 binds to collagens V and VI through the central nonglobular domain of its core protein. J Biol Chem. 1997;272:10769–10776. doi: 10.1074/jbc.272.16.10769. [DOI] [PubMed] [Google Scholar]
- 57.Weidner N, Ner A, Salimi N, Tuszynski MH. Spontaneous corticospinal axonal plasticity and functional recovery after adult central nervous system injury. Proc Natl Acad Sci USA. 2001;98:3513–3518. doi: 10.1073/pnas.051626798. [DOI] [PMC free article] [PubMed] [Google Scholar]
- 58.Wray W, Boulikas T, Wray VP, Hancock R. Silver staining of proteins in polyacrylamide gels. Anal Biochem. 1981;118:197–203. doi: 10.1016/0003-2697(81)90179-2. [DOI] [PubMed] [Google Scholar]
- 59.Yamada H, Watanabe K, Shimonaka M, Yamaguchi Y. Molecular cloning of brevican, a novel brain proteoglycan of the aggrecan/versican family. J Biol Chem. 1994;269:10119–10126. [PubMed] [Google Scholar]
- 60.Yamada H, Watanabe K, Shimonaka M, Yamasaki M, Yamaguchi Y. cDNA cloning and the identification of an aggrecanase-like cleavage site in rat brevican. Biochem Biophys Res Commun. 1995;216:957–963. doi: 10.1006/bbrc.1995.2713. [DOI] [PubMed] [Google Scholar]
- 61.Yamada H, Fredette B, Shitara K, Hagihara K, Miura R, Ranscht B, Stallcup WB, Yamaguchi Y. The brain chondroitin sulfate proteoglycan brevican associates with astrocytes ensheathing cerebellar glomeruli and inhibits neurite outgrowth from granule neurons. J Neurosci. 1997;17:7784–7795. doi: 10.1523/JNEUROSCI.17-20-07784.1997. [DOI] [PMC free article] [PubMed] [Google Scholar]
- 62.Yamaguchi Y. Chondroitin sulfate proteoglycans in the nervous system. In: Iozzo RV, editor. Proteoglycans: structure, biology, and molecular interactions. Marcel Dekker; New York: 2000. pp. 379–402. [Google Scholar]
- 63.Zhang Y, Tohyama K, Winterbottom JK, Haque NS, Schachner M, Lieberman AR, Anderson PN. Correlation between putative inhibitory molecules at the dorsal root entry zone and failure of dorsal root axonal regeneration. Mol Cell Neurosci. 2001;17:444–459. doi: 10.1006/mcne.2000.0952. [DOI] [PubMed] [Google Scholar]