

Abstract
The neural mechanisms underlying ground-level spatial navigation have been investigated, but little is known about other kinds of spatial navigation. Functional magnetic resonance imaging was used to identify differences in brain activation for two types of spatial information, information from the ground-level perspective (route) and information from a global perspective (survey). Participants were scanned during the encoding of two different virtual reality environments, one from each perspective. Comparisons of brain activation during route and survey encoding suggested that both types of information recruited a common network of brain areas, but with important differences. Survey encoding recruited a subset of areas recruited by route encoding, but with greater activation in some areas, including inferior temporal cortex and posterior superior parietal cortex. Route encoding, in contrast, recruited regions that were not activated by survey encoding, including medial temporal lobe structures, anterior superior parietal cortex, and postcentral gyrus. These differences in brain activation are associated with differences in memory performance for the two types of spatial information and contribute to specification of brain components of spatial knowledge.
Keywords: spatial representation, navigation, memory, medial temporal lobe, parietal cortex, functional MRI
Successful navigation requires learning the spatial layout of the environment. Understanding how the brain acquires spatial knowledge has been explored in humans (Aguirre and D'Esposito, 1997; Ghaëm et al., 1997; Maguire et al., 1997;Aguirre et al., 1998; Epstein and Kanwisher, 1998), nonhuman primates (Ono et al., 1993; Rolls, 1999), and rats (McNaughton et al., 1996;Cooper and Mizumori, 2001). The result has been the identification of a network of brain areas for processing spatial information, including parahippocampal cortex, hippocampus, posterior cingulate, precuneus, retrosplenial cortex, and premotor cortex. In rats and primates, much of the focus has been on brain processes underlying spatial navigation. Human neuroimaging and patient studies have focused, more specifically, on how spatial information (i.e., relationships among objects) differs from other types of visual information (i.e., the appearance of individual objects). However, little is known about how different types of spatial information are encoded and represented in the brain.
Evidence for a fundamental distinction between two types of spatial information, route and survey knowledge, comes from behavioral analysis of human spatial cognition (Siegel and White, 1975; Perrig and Kintsch, 1985; Tversky, 1991). Route-based knowledge is characterized as knowledge of spatial layout from the perspective of a ground-level observer navigating the environment. In contrast, survey knowledge is characterized by an external perspective, such as an aerial or map-like view, allowing direct access to the global spatial layout. Both perspectives afford information about spatial layout, but they can have different behavioral consequences (Thorndyke and Hayes-Roth, 1982;Streeter et al., 1985). For example, after participants studied virtual environments from either route or survey perspectives, recognition memory for scenes was superior when the environment was studied and tested in the same perspective. Facilitation was equivalent for route and survey learning, suggesting different mental representations for the two types of spatial knowledge (A. L. Shelton and T. P. McNamara, unpublished observations).
The present study was designed to use functional magnetic resonance imaging (fMRI) to explore how route and survey knowledge are encoded in the brain. Previous neuroimaging work has used navigation as the primary source of spatial information, reflecting primarily the route perspective. Mellet et al. (2000) studied brain activation during mental imagery after route and survey learning. There was right hippocampus activation for both route and survey imagery, but bilateral activation of parahippocampal gyrus for route imagery exclusively. However, the study relied on imagining previously learned environments and not the encoding of novel environments. In the present study, participants were scanned while learning two different large-scale virtual environments, one from the route perspective and one from the survey perspective. We hypothesized that different perspectives would lead to differences in brain activation. Specifically, we were interested in whether the two types of spatial information are distinguished in the brain by recruitment of different areas or differential activation within the same spatial processing network. Symmetrical dissociation between route and survey encoding in the brain would support the perspective-specific facilitation observed in memory retrieval.
MATERIALS AND METHODS
Participants. Twelve healthy, right-handed volunteers (six females, six males; mean age, 23.1 years) participated in return for monetary compensation. All participants gave informed written consent.
Experimental task. Three novel environments (convention center, city park, and market place) were constructed in desktop virtual reality using Virtus WalkThrough Pro (Fig.1, bottom panel). Each environment measured 110 × 130 feet (330 × 390 m) in virtual space and contained 10 large landmarks and 7 small landmarks in addition to fixed features such as external walls and sidewalks. Environments were designed to be visually distinct from each other, with no overlap of landmarks. Two navigation movies were recorded for each environment, one from the ground-level perspective (route movie; Fig. 1, left panel) and one from an aerial perspective (survey movie; Fig. 1, right panel). The route movie was recorded from the perspective of a 6-foot-tall observer walking through the environment. The route began at the entrance to the environment (always in the southwest corner) and consisted of four route legs joined by turns (walk north, turn right, walk east, turn right, walk south, turn right, walk west, turn left to face entrance again). The survey movie was taken from the perspective of an aerial observer (70 feet above ground level in virtual space), looking straight down with 20% of the environment visible at any moment. The path began in the southwest corner, panned north, east, south, and west without any changes in heading. The different natures of the two perspectives did not allow for equating the objects visible from frame to frame, but the number of exposures to landmarks was kept similar by following the same paths in both perspectives. One complete run of each movie lasted 46 sec, and the same movie was used for a given environment throughout the encoding. Each participant was assigned to learn two environments, one as a route and one as a survey. Pairs of environments (e.g., convention center–market, convention center–park, and market–park) were used four times each across participants. Each environment appeared as a route or survey movie equally often across participants. Before scanning, participants viewed each movie one time to familiarize them with the virtual reality presentation. During this initial viewing, the landmarks were identified by the experimenter in the order they were encountered. Participants were informed that they did not need to recall the landmark names. During the scan, each movie served as a 46 sec block. Route and survey movies were repeated six times along with six, 24 sec blocks of fixation. During fixation blocks, participants were instructed to fixate on a white cross in the middle of the black screen. Block order was determined by using all possible orders of conditions (route, survey, and fixation) across the six repetitions, with the constraint that there be no direct repetitions of any condition. Two different orders were used to counterbalance which environment was seen first (route or survey). Participants were asked to learn each environment as well as possible for a later memory test. They were also instructed to use the fixation periods to rest.
Fig. 1.
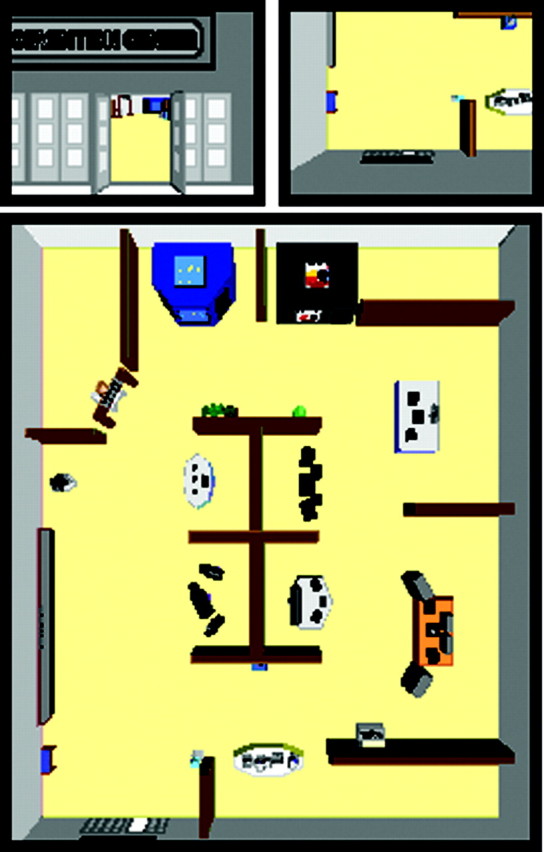
Still images of one of the virtual environments (convention center) shown from the route (top left panel) and survey (top right panel) perspectives. Bottom panel shows entire convention center layout.
To assess whether environments were learned, participants were given recognition memory tests for images of each environment. Participants saw still images of each environment from the route and survey perspectives and had to indicate whether the image was from the correct environment or from a distractor environment. Distractors were created by randomly rearranging the same landmarks within the environment. Participants judged a total of 64 correct images and 64 distractors for each environment. After the entire session, participants were also asked to draw a map of each environment from memory.
Procedure. The scan session began with anatomical scans followed by the functional scan for encoding the environment (12 min). [Additional functional scans were acquired during recognition of each environment, but the data will not be discussed here.]
FMRI data acquisition and analysis. Whole-brain imaging data were acquired on a 3 Tesla MRI Signa LX Horizon Echospeed (General Electric Medical Systems, 8.2.5 system revisions). Three-dimensional (3-D) high-resolution T1-weighted spoiled gradient echo anatomical images were acquired in 124 contiguous 1.5 mm slides [minimum full echo time (TE); 30° flip angle; 24 cm field of view]. T2-weighted spin-echo anatomical images were acquired in 29 contiguous 6 mm coronal slices [30 msec TE; 4000 msec reaction time (TR)]. Functional images were acquired in the same slices using T2*-sensitive gradient echo spiral pulse sequence (Glover and Lai, 1998) (30 msec TE; 2000 msec TR; 76° flip angle; 20 cm field of view; 64 × 64 acquisition matrix). Head motion was minimized with a bitebar using the participant's dental impression.
Using SPM99 (Wellcome Department of Cognitive Neurology, London, UK), the data for each participant were corrected for motion, normalized to a T2-weighted template image, and smoothed with a smoothing kernel of 8 mm. Individual models were calculated for each participant using a general linear model (Friston et al., 1995). Contrast images from each participant's model were subjected to random effects analyses (Holmes and Friston, 1998) for all of the effects of interest. Areas of statistical significance were identified using a height and extent threshold of p < 0.05 corrected for the number of comparisons.
RESULTS
Behavioral data
To verify that participants learned both environments, we compared the speed and accuracy of recognition for the route environment and the survey environment. Response latencies did not differ for route (mean, 1777 msec; SD, 56.6) and survey (mean, 1743 msec; SD, 54.3),t(11) = 1.66; p = 0.13. Accuracy (hits − false alarms) did not differ either (for route, mean, 78%; SD, 7.3; for survey, mean, 82%; SD, 6.0),t(11) = 1.36; p = 0.20. The degree of distortion in the sketch maps was measured using bidimensional regression and a distortion index (Waterman and Gordon, 1984). Distortion indices for route (mean, 20.13%; SD, 1.55) and survey (mean, 19.47%; SD, 1.51) encoding were not significantly different, t(11) = 0.94;p = 0.37. Map drawing was further evaluated according to whether the participant used a sequential drawing strategy (drawing in the landmarks in the order they were encountered during the movie), a hierarchical drawing strategy (drawing the central then peripheral features and/or filling in spatial quadrants), or a random strategy (no clear pattern of placement). All 12 participants drew maps of the route environment sequentially, whereas 11 of the 12 participants drew the survey environment in a hierarchical manner (entered the central features then filled in spatial quadrants out of sequence). The remaining participant drew the survey map by first drawing the central features then proceeding sequentially around the periphery. These drawing strategy differences occurred in the same person following different types of encoding, suggesting differences in underlying representations after route and survey encoding.
Imaging data
Comparison with fixation
The route and survey blocks were first compared individually against fixation (Tables 1,2). Many areas of activation were revealed, including large portions of the dorsal and ventral visual processing streams and frontal cortex. Activation for fixation was greater than either route or survey encoding only in the insular cortex.
Table 1.
Areas of activation for route encoding versus fixation
| Areas of activation (p < 0.001) | BA | x | y | z | T |
|---|---|---|---|---|---|
| Route encoding-fixation | |||||
| L fusiform gyrus | 37, 19 | −30 | −54 | −9 | 16.25 |
| R fusiform gyrus | 37, 19 | 24 | −69 | 0 | 15.49 |
| L lingual gyrus/calcarine fissure | 18, 17 | −6 | −81 | 0 | 14.8 |
| R precuneus | 7 | 6 | −45 | 54 | 9.31 |
| R posterior cingulate | 31 | 11 | −60 | 30 | 8.77 |
| L superior parietal cortex | 7 | −18 | −63 | 60 | 15.27 |
| R superior parietal cortex | 7 | 15 | −63 | 57 | 15.82 |
| R superior parietal cortex | 7 | 33 | −75 | 36 | 13.39 |
| L inferior parietal cortex | 40 | −21 | −30 | 48 | 7.41 |
| R inferior parietal cortex | 7, 19 | 33 | −75 | 36 | 13.39 |
| L superior and middle frontal gyri | 6 | −12 | 15 | 54 | 10.89 |
| R middle frontal gyrus | 6 | 30 | 12 | 51 | 10.84 |
| R middle frontal gyrus | 10, 46 | 30 | 48 | 12 | 7.96 |
| R middle frontal gyrus | 9 | 33 | 45 | 36 | 7.96 |
| R medial frontal gyrus | 9 | 15 | 39 | 24 | 5.43 |
| L inferior frontal gyrus | 44 | −42 | 15 | 21 | 5.84 |
| L parahippocampal cortex and posterior hippocampus | −18 | −42 | −9 | 8.92 | |
| R parahippocampal cortex and posterior hippocampus | 21 | −42 | −6 | 13.39 | |
| Fixation–route encoding | |||||
| L insular cortex | −45 | −9 | 9 | 11.66 |
Coordinates are based on MNI brain (Montreal Neurologic Institute). L, Left; R, right.
Table 2.
Areas of activation for survey encoding versus fixation
| Areas of activation (p < 0.001) | BA | x | y | z | T |
|---|---|---|---|---|---|
| Survey encoding-fixation | |||||
| L fusiform gyrus | 37 | −30 | −66 | −15 | 12.3 |
| R fusiform and lingual gyri | 36, 37, 19 | 24 | −72 | 0 | 15.97 |
| L lingual and fusiform gyri | 18, 19 | −18 | −81 | −9 | 10.24 |
| L lingual gyrus/calcarine fissure | 18, 17 | −6 | −81 | 0 | 24.16 |
| R middle occipital gyrus | 19 | 39 | −81 | 21 | 10.3 |
| R superior occipital gyrus | 19 | 33 | −78 | 39 | 11.02 |
| R cuneus | 18, 19 | 15 | −93 | 24 | 11.69 |
| L superior parietal cortex | 7, 19 | −18 | −66 | 60 | 16.62 |
| R superior parietal cortex | 7 | 15 | −63 | 57 | 13.63 |
| L superior and middle frontal gyri | 6 | −15 | 15 | 57 | 14.65 |
| L middle frontal gyrus | 6 | −24 | 0 | 60 | 10.48 |
| L middle frontal gyrus | 9 | −51 | 21 | 33 | 7.41 |
| R middle frontal gyrus | 6 | 30 | 12 | 51 | 10.41 |
| R pulvinar | 24 | −30 | 9 | 10.16 | |
| Fixation-survey encoding | |||||
| L insular cortex | −36 | −15 | 18 | 8.60 | |
| R insular cortex | 45 | −15 | 15 | 6.74 |
Coordinates are based on MNI brain (Montreal Neurologic Institute). L, Left; R, right.
Effects of encoding type
To assess differences between route and survey encoding, these conditions were contrasted directly. There was greater activation for route encoding in bilateral medial temporal lobes (MTL) incorporating parahippocampal cortex and posterior hippocampus, bilateral postcentral gyrus (BA 5 and 7), right superior parietal cortex (BA 7), bilateral posterior cingulate and precuneus (BA 31), right inferior parietal cortex (BA 40), left cuneus and middle occipital gyrus (BA 18), right superior temporal/insular cortex (BA 22 and 13), and left medial frontal gyrus (BA 6) (Fig. 2, left panel, Table 3). There was greater activation for survey encoding in bilateral fusiform and inferior temporal gyri (BA 37, 19), bilateral superior parietal cortex (BA 7, posterior to the region observed for route > survey), left insula/clautrum (BA 13), and left superior frontal gyrus (BA 8) (Fig.2, right panel, Table 3).
Fig. 2.

Areas of significant activation for direct comparisons of route and survey encoding.
Table 3.
Areas of activation for direct comparisons between route and survey encoding
| Areas of activation (p < 0.001) | BA | x | y | z | T |
|---|---|---|---|---|---|
| Route encoding-survey encoding | |||||
| L post-central gyrus | 5, 7 | −12 | −45 | 60 | 6.10 |
| R post-central gyrus | 5, 7 | 9 | −48 | 69 | 6.07 |
| L parahippocampal cortex and post. hippocampus | −12 | −42 | −18 | 7.09 | |
| R parahippocampal cortex and post. hippocampus | 21 | −39 | −12 | 5.01 | |
| R precuneus/superior parietal cortex | 7 | 21 | −78 | 48 | 6.78 |
| R posterior cingulate/ precuneus | 31 | 24 | −60 | 21 | 5.69 |
| L posterior cingulate | 24, 31 | −9 | −18 | 48 | 5.39 |
| R cuneus/middle occipital gyrus | 18 | 18 | −84 | 15 | 5.58 |
| R superior temporal/insula | 22, 13 | 54 | −51 | 15 | 9.16 |
| R inferior parietal | 40 | 54 | −48 | 24 | 6.11 |
| L medial frontal gyrus | 6 | −15 | −15 | 48 | 5.24 |
| Survey encoding-route encoding | |||||
| L fusiform gyrus/inferior temporal gyrus | 19, 37 | −33 | −57 | −15 | 9.15 |
| L middle occipital gyrus | 37 | −45 | −60 | 0 | 6.86 |
| R fusiform and inferior temporal gyri | 19, 37 | 39 | −63 | −3 | 10.36 |
| L superior parietal cortex | 7 | −24 | −66 | 51 | 8.96 |
| R superior parietal cortex | 7, 18 | 36 | −81 | 21 | 6.43 |
| L insula/claustrum | 13 | −33 | −9 | 27 | 9.49 |
| L superior frontal gyrus | 8 | −6 | 39 | 57 | 6.82 |
Coordinates are based on the MNI brain (Montreal Neurologic Institute). L, Left; R, right.
To determine whether these areas were exclusive to the particular type of encoding or were shared areas that showed differential activation, functional regions of interest (ROI) were analyzed. Percentage of signal change was calculated for route and survey encoding relative to fixation. These signal change values were compared with a signal change of zero using one-sample t tests. (For areas that showed bilateral activation, laterality was also analyzed using ANOVA; however, no differences reached statistical significance.)
Figure 3 shows percentage of signal change relative to fixation for the ROIs that were more active for route encoding. Given that these were functionally defined ROIs, we expected all regions to show activation for route encoding. The key question was whether the survey encoding was also activating these areas. Several clusters did not show activation for survey encoding, including: postcentral gyrus (BA 5,7),t(11) = 0.32, p = 0.75, and t(11) = 1.66,p = 0.13, for left and right clusters, respectively; MTL, t(11) = 1.78, p = 0.10, and t(11) = 0.58,p = 0.57, for left and right clusters, respectively; left posterior cingulate (BA 31),t(11) = 0.37; and left medial frontal gyrus (BA 6), t(11) = 0.74,p = 0.47. For the right posterior cingulate, there was marginal activation for survey encoding,t(11) = 1.99, p = 0.07. The right precuneus and the cuneus/middle occipital gyrus cluster were both activated during survey encoding,t(11) = 4.83, p = 0.0005, and t(11) = 10.26,p = 0.0001, respectively. Finally, the right insular cortex (BA 13) and the right inferior parietal cortex showed significant deactivation for survey encoding,t(11) = −3.07, p = 0.01 and t(11) = −3.22,p = 0.008, respectively. Therefore, all of the areas present in the direct comparison map (Fig. 2), except for small clusters in the parietal and occipital cortex, were activated exclusively by the route encoding.
Fig. 3.
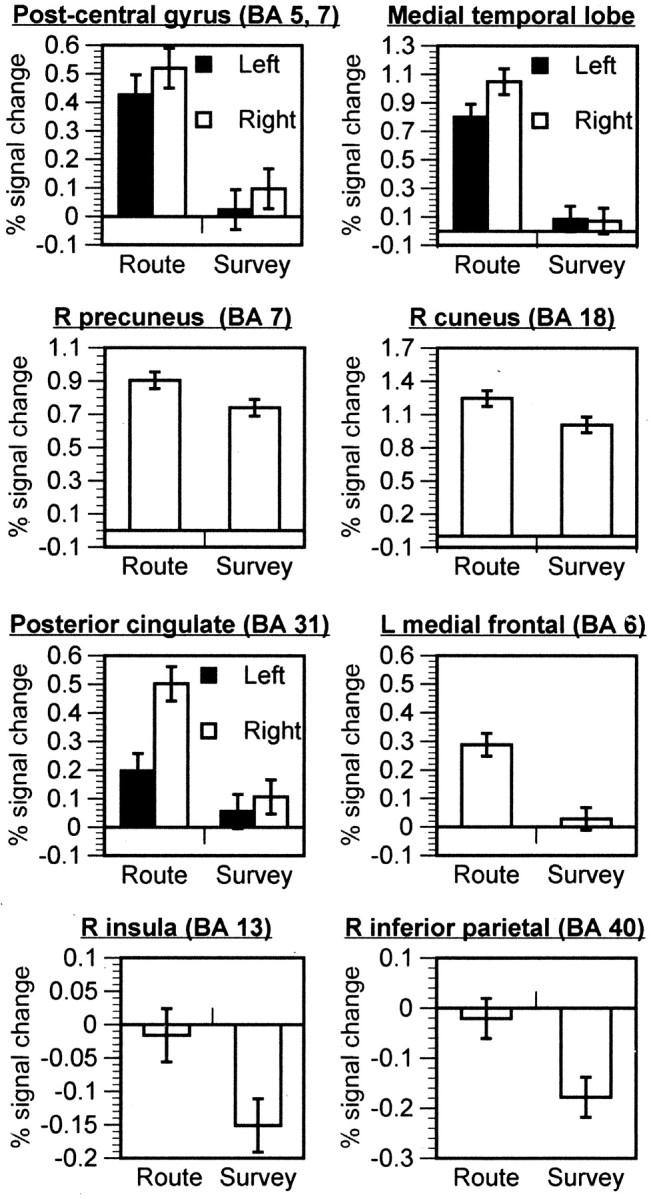
Mean percentage of signal change as a function of encoding type for clusters that had greater activation for route encoding than for survey encoding. Error bars reflect ±1 SEM.
Figure 4 shows percentage of signal change relative to fixation for the ROIs that were more active for survey encoding. As shown, all of these clusters show significant activation for both route and survey encoding, allt(11) > 5, p < 0.001, except for the left insula (BA 13) for which neither encoding condition showed significant activation, botht(11) < 1, and left superior frontal gyrus (BA 8), which showed significant deactivation for route encoding,t(11) = −3.53, p = 0.005, and was not different from fixation for survey,t(11) = −1.39, p = 0.19. These results suggest that there were no areas of activation exclusive to the survey encoding.
Fig. 4.

Mean percentage of signal change as a function of encoding type for clusters that had greater activation for survey encoding. Error bars reflect ±1 SEM.
DISCUSSION
The aim of this study was to determine how encoding route and survey information differed in the brain. Route versus survey encoding led to different mental representations of the spatial environments. Route encoding resulted in sequentially drawn maps, whereas survey encoding resulted in hierarchically drawn maps. Both types of encoding, however, yielded nearly equivalent accuracy by recognition and map-drawing measures. As such, differences in brain activation cannot be attributed to encoding success or failure; rather they reflect differences in the underlying processing. Route and survey encoding led to different patterns of brain activation. These differences, however, did not reflect separate neural systems, but rather differential activation within the same spatial learning system. Specifically, survey encoding appeared to recruit a subset of brain areas recruited by route encoding.
Many brain regions broadly associated with spatial navigation participated exclusively in route encoding. Route, but not survey, encoding activated bilateral MTL, postcentral gyrus, right posterior cingulate, and left medial frontal gyrus. The spatial processes mediated by these structures appear to be unnecessary for effective survey encoding. Rather, survey encoding resulted in greater activation than route encoding in a number of areas also active for route encoding, including bilateral fusiform and inferior temporal gyri and posterior superior parietal cortex. Heightened activation of a specialized subset of regions by survey encoding suggests that the survey-based learning system may develop as a secondary system within a larger route-learning system. Developmental studies support this hierarchical relationship between route and survey knowledge, demonstrating that children develop route learning before survey learning (Siegel and White, 1975).
Previous imaging studies, which have not distinguished between route and survey knowledge, have typically probed route learning or its consequences. In some cases, participants were explicitly instructed to explore an environment at the route level. Such exploration and its subsequent memory activated a number of the same areas found in the route, but not survey, condition of the present study, including parahippocampal cortex, precuneus, and posterior cingulate (Aguirre et al., 1998). When London taxi drivers recalled familiar routes, there was greater activation of the right hippocampus, bilateral parahippocampal cortex, and bilateral precuneus (Maguire et al., 1997). Parahippocampal cortex has also been associated with memory for scenes (Epstein and Kanwisher, 1998). Although they do not explicitly require navigation, these scenes are presented as route-perspective images.
Two important differences between route and survey encoding may be critical to the observed brain differences. First, route perspectives facilitate a sense of immersion relative to survey perspectives. Participants in the present study reported feeling as if they had actually been in the environment for route encoding, suggesting that they perceived the route as their local environment during encoding. No such experience was reported for survey encoding; instead participants described the condition as a map, suggesting that the survey perspective did not invoke a sense of immersion. Differences in the parietal cortex for route and survey encoding may be related to this immersion difference. In studies of near (peripersonal) and far (extrapersonal) space, dorsal visuomotor regions of parietal and premotor cortices have been associated with experiences and deficits in peripersonal space (Halligan and Marshall, 1991; Weiss et al., 2000). In the present study, route encoding likely invoked learning in both peripersonal and extrapersonal space, whereas survey encoding may have been limited to extrapersonal space.
A second property distinguishing route and survey perspectives is the form of updating involved. To learn the spatial layout from a route perspective, the observer must continuously update changes in the local environment based on movements through and turns within the space. As one turns a corner, for example, the association between two very different views must be established. Thus, global spatial structure must be constructed from a series of views with only limited visual information available at any given moment. MTL and parietal areas identified for spatial navigation may be responsible for binding together the different aspects of local environment as it changes. Conversely, survey encoding allows more direct access to the global structures of the environment and requires updating that is continuous with this global structure rather than relative to bodily orientation in space. For example, the extent of a wall and its relationship to adjacent walls is readily available from the visual information. The presence of continuous global structure in a survey perspective may induce participants to treat the environment more like a map rather than a local, navigable environment.
These psychological differences between route and survey information may provide clues to interpreting brain regions that were more active for survey than for route encoding. Although there were no survey-specific activations, greater survey than route activation was observed in inferior temporal cortex and posterior superior parietal cortex. The temporal activation may reflect greater object processing (Tanaka et al., 1991) because of the map-like nature of the survey encoding. In addition to providing spatial information, maps can be treated as individual physical objects themselves. Perhaps participants were recruiting more effort from object areas to maintain a representation of the environment as an object itself. Greater activation in posterior superior parietal cortex for survey encoding may also reflect the tendency to treat the survey environment as an object. Parietal areas have been associated with spatial attention and mental rotation of objects (Cohen et al., 1996; Alvisatos and Petrides, 1997). Perhaps increased activation for survey encoding may have resulted from greater attention to global properties and the use of those properties to build a complete representation of the environment as a map. Although both route and survey encoding required attention to the spatial configuration, the way in which these spatial relations were gleaned likely involved different reference systems (Shelton and McNamara, 2001).
Robust MTL activation for route encoding may reflect the need to update one's local environment as one moves through space. This MTL activation may be related to ideas about hippocampal participation in spatial memory. The hippocampus has been described as supporting “cognitive maps” (O'Keefe and Nadel, 1978); greater activation for route encoding may reflect greater demand on the “map-building” properties of this region. Subsequent research, however, has demonstrated that rat hippocampal neurons encode both spatial and nonspatial aspects of an experience (Wood et al., 1999), suggesting that hippocampus is more generally involved in binding different features of an episode together in a hippocampal “memory space” (Eichenbaum et al., 1999). In the present study, route encoding required participants to link steps in a sequence that had a beginning, middle, and end. The entire layout of the space could only be extracted if successive steps were bound together appropriately. As seen in the map-drawing strategies, the sequence was preserved after route encoding, but had little importance after survey encoding. This difference may have lead to different mnemonic demands, thus producing differential activation of MTL structures.
Differences between the perspectives provide plausible explanations for route encoding yielding greater MTL activation than survey encoding. It is unclear, however, why survey encoding failed to activate MTL, given the equivalent memory performance in the two conditions. MTL activation occurs during the encoding of novel stimuli (Gabrieli et al., 1997;Brewer et al., 1998), and bilateral damage to MTL structures yields a global deficit for remembering new material that likely extends to survey spatial knowledge (Scoville and Milner, 1957; Squire, 1992). Failure to measure MTL activation for survey encoding may be related to the fixation baseline. Comparisons of baseline tasks suggest that MTL activation is greater during fixation than during other baseline tasks (Stark and Squire, 2001). Moreover, there was a trend for left MTL activation in survey encoding (p = 0.1). Thus, it is likely that the MTL structures participate at some level during both types of spatial encoding. The present results, however, indicate greater MTL participation in route learning.
Spatial information has often been treated as a unitary type of information. Numerous behavioral studies, however, have established a fundamental distinction between route and survey spatial information (Siegel and White, 1975; Perrig and Kintsch, 1985; Tversky, 1991). Behavioral performance has suggested that route and survey information rely on different neural systems (Shelton and McNamara, unpublished observations) (Thorndyke and Hayes-Roth, 1982). Our results provide initial evidence to the contrary. Route and survey encoding recruited a common spatial learning system in the brain, with survey encoding recruiting a specialized subset of route-encoding areas. Notably, these are not the same brain areas previously associated with spatial navigation. These results provide new insights into the role of these regions, suggesting that the degree to which they are responsible for “spatial processing” may depend on the particular type of spatial processing involved. To our knowledge, the present study was the first to explore route and survey distinctions in the brain during encoding of novel environments. The brain bases of other types of spatial knowledge, including tactile or text-based, remain to be investigated. Understanding how spatial information, in its many forms, is represented in the brain provides new approaches for linking encoding processes to their behavioral consequences.
Footnotes
This work was supported by National Institutes of Health Postdoctoral Training Grant MH12638 and Raytheon Systems Corporation. We thank Jennifer Burrows, Barbara Tversky, Timothy P. McNamara, John Desmond, Gary Glover, Silvia Bunge, Joanna Salidis, and two anonymous reviewers for their contributions.
Correspondence should be addressed to Amy Lynne Shelton at her present address: Department of Psychological and Brain Sciences, Johns Hopkins University, Ames Hall, 3400 North Charles Street, Baltimore, MD 21218. E-mail: ashelton@jhu.edu.
REFERENCES
- 1.Aguirre GK, D'Esposito M. Environmental knowledge is subserved by separable dorsal/ventral neural areas. J Neurosci. 1997;17:2512–2518. doi: 10.1523/JNEUROSCI.17-07-02512.1997. [DOI] [PMC free article] [PubMed] [Google Scholar]
- 2.Aguirre GK, Zarahn E, D'Esposito M. Neural components of topographical representation. Proc Natl Acad Sci USA. 1998;95:839–846. doi: 10.1073/pnas.95.3.839. [DOI] [PMC free article] [PubMed] [Google Scholar]
- 3.Alvisatos B, Petrides M. Functional activation of the human brain during mental rotation. Neuropsychologia. 1997;35:111–118. doi: 10.1016/s0028-3932(96)00083-8. [DOI] [PubMed] [Google Scholar]
- 4.Brewer JB, Zhao Z, Desmond JE, Glover GH, Gabrieli JDE. Making memories: brain activity that predicts how well visual experience will be remembered. Science. 1998;281:1185–1187. doi: 10.1126/science.281.5380.1185. [DOI] [PubMed] [Google Scholar]
- 5.Cohen MS, Kosslyn SM, Breiter HC, DiGirolamo DJ, Thompson WL, Anderson AK, Brookheimer SY, Rosen BR, Belliveau JW. Changes in cortical activity during mental rotation: a mapping study using functional MRI. Brain. 1996;119:89–100. doi: 10.1093/brain/119.1.89. [DOI] [PubMed] [Google Scholar]
- 6.Cooper BG, Mizumori SJY. Temporary inactivation of the retrosplenial cortex causes a transient reorganization of spatial coding in the hippocampus. J Neurosci. 2001;21:3986–4001. doi: 10.1523/JNEUROSCI.21-11-03986.2001. [DOI] [PMC free article] [PubMed] [Google Scholar]
- 7.Eichenbaum H, Dudchenko P, Wood E, Shapiro M, Tanila H. The hippocampus, memory, and place cells: is it spatial memory or a memory space? Neuron. 1999;23:209–226. doi: 10.1016/s0896-6273(00)80773-4. [DOI] [PubMed] [Google Scholar]
- 8.Epstein R, Kanwisher N. A cortical representation of the local visual environment. Nature. 1998;392:598–601. doi: 10.1038/33402. [DOI] [PubMed] [Google Scholar]
- 9.Friston KJ, Homes AP, Worsley KJ, Poline JB, Frith CD, Frackowiak RSJ. Statistical parametric maps in functional imaging: a general linear approach. Hum Brain Mapp. 1995;4:189–210. [Google Scholar]
- 10.Gabrieli JDE, Brewer JB, Desmond JE, Glover GH. Separate neural bases of two fundamental memory processes in the human medial temporal lobe. Science. 1997;276:264–266. doi: 10.1126/science.276.5310.264. [DOI] [PubMed] [Google Scholar]
- 11.Ghaëm O, Mellet E, Crivello F, Tzourio N, Mazoyer B, Berthoz A, Denis M. Mental navigation along memorized routes activates the hippocampus, precuneus, and insula. NeuroReport. 1997;8:739–744. doi: 10.1097/00001756-199702100-00032. [DOI] [PubMed] [Google Scholar]
- 12.Glover GH, Lai S. Self-navigated spiral fMRI: Interleaved versus single-shot. Magn Reson Med. 1998;39:361–368. doi: 10.1002/mrm.1910390305. [DOI] [PubMed] [Google Scholar]
- 13.Halligan PW, Marshall JC. Left neglect in near but not far space in man. Nature. 1991;350:498–500. doi: 10.1038/350498a0. [DOI] [PubMed] [Google Scholar]
- 14.Holmes AP, Friston KJ. Gernealisability, random effects and population inference. NeuroImage. 1998;7:S754. [Google Scholar]
- 15.Maguire EA, Frackowiak RSJ, Frith CD. Recalling routes around London: Activation of the right hippocampus in taxi drivers. J Neurosci. 1997;17:7103–7110. doi: 10.1523/JNEUROSCI.17-18-07103.1997. [DOI] [PMC free article] [PubMed] [Google Scholar]
- 16.McNaughton BL, Barnes CA, Gerrard JL, Gothard K, Jung MW, Knierim JJ, Kudrimoti H, Qin Y, Skaggs WE, Suster M, Weaver KL. Deciphering the hippocampal polyglot: the hippocampus as a path integration system. J Exp Biol. 1996;199:173–185. doi: 10.1242/jeb.199.1.173. [DOI] [PubMed] [Google Scholar]
- 17.Mellet E, Bricogne S, Tzourio-Mazoyer N, Ghaëm O, Petit L, Zago L, Etard O, Berthoz A, Mazoyer B, Denis M. Neural correlates of topographic mental exploration: the impact of route versus survey learning. NeuroImage. 2000;12:588–600. doi: 10.1006/nimg.2000.0648. [DOI] [PubMed] [Google Scholar]
- 18.O'Keefe J, Nadel L. The hippocampus as a cognitive map. Oxford UP; Oxford: 1978. [Google Scholar]
- 19.Ono T, Nakamura K, Nishijo H, Eifuku S. Monkey hippocampal neurons related to spatial and nonspatial functions. J Neurophysiol. 1993;70:1516–1529. doi: 10.1152/jn.1993.70.4.1516. [DOI] [PubMed] [Google Scholar]
- 20.Perrig W, Kintsch W. Propositional and situational representations of text. J Mem Lang. 1985;24:503–518. [Google Scholar]
- 21.Rolls ET. Spatial view cells and the representation of place in the primate hippocampus. Hippocampus. 1999;9:467–480. doi: 10.1002/(SICI)1098-1063(1999)9:4<467::AID-HIPO13>3.0.CO;2-F. [DOI] [PubMed] [Google Scholar]
- 22.Scoville WB, Milner B. Loss of recent memory after bilateral hippocampal lesions. J Neurol Neurosurg Psychiatry. 1957;20:11–21. doi: 10.1136/jnnp.20.1.11. [DOI] [PMC free article] [PubMed] [Google Scholar]
- 23.Shelton AL, McNamara TP. Systems of spatial reference in human memory. Cognit Psychol. 2001;43:274–310. doi: 10.1006/cogp.2001.0758. [DOI] [PubMed] [Google Scholar]
- 24.Siegel AW, White SH. The development of spatial representations of large-scale environments. In: Reese HW, editor. Advances in child development and behavior. Academic; New York: 1975. pp. 9–55. [DOI] [PubMed] [Google Scholar]
- 25.Squire LR. Memory and the hippocampus: a synthesis from findings with rats, monkeys, and humans. Psychol Rev. 1992;99:195–231. doi: 10.1037/0033-295x.99.2.195. [DOI] [PubMed] [Google Scholar]
- 26.Stark CEL, Squire LR. When zero is not zero: the problem of ambiguous baseline conditions in fMRI. Proc Natl Acad Sci USA. 2001;98:12760–12766. doi: 10.1073/pnas.221462998. [DOI] [PMC free article] [PubMed] [Google Scholar]
- 27.Streeter LA, Vitello D, Wonsiewicz SA. How to tell people where to go: comparing navigational aids. Int J Man Mach Stud. 1985;22:549–562. [Google Scholar]
- 28.Tanaka K, Saito H, Fukada Y, Moriya M. Coding visual images of objects in the inferotemporal cortex of the macaque monkey. J Neurophysiol. 1991;66:170–189. doi: 10.1152/jn.1991.66.1.170. [DOI] [PubMed] [Google Scholar]
- 29.Thorndyke PW, Hayes-Roth B. Differences in spatial knowledge acquired from maps and navigation. Cognit Psychol. 1982;14:560–589. doi: 10.1016/0010-0285(82)90019-6. [DOI] [PubMed] [Google Scholar]
- 30.Tversky B. Spatial mental models. In: Bower GH, editor. The psychology of learning and motivation. Academic; San Diego: 1991. pp. 109–145. [Google Scholar]
- 31.Waterman S, Gordon D. A quantitative-comparative approach to analysis of distortion in mental maps. Prof Geogr. 1984;36:326–337. [Google Scholar]
- 32.Weiss PH, Marshall JC, Wunderlich G, Tellmann L, Halligan PW, Freund H-J, Zilles K, Fink GR. Neural consequences of acting in near versus far space: a physiological basis for clinical dissociations. Brain. 2000;123:2531–2541. doi: 10.1093/brain/123.12.2531. [DOI] [PubMed] [Google Scholar]
- 33.Wood ER, Dudchenko PA, Eichenbaum H. The global record of memory in hippocampal neuronal activity. Nature. 1999;397:613–616. doi: 10.1038/17605. [DOI] [PubMed] [Google Scholar]