

Abstract
Based on recent experimental data, we have developed a conductance-based computational network model of the subthalamic nucleus and the external segment of the globus pallidus in the indirect pathway of the basal ganglia. Computer simulations and analysis of this model illuminate the roles of the coupling architecture of the network, and associated synaptic conductances, in modulating the activity patterns displayed by this network. Depending on the relationships of these coupling parameters, the network can support three general classes of sustained firing patterns: clustering, propagating waves, and repetitive spiking that may show little regularity or correlation. Each activity pattern can occur continuously or in discrete episodes. We characterize the mechanisms underlying these rhythms, as well as the influence of parameters on details such as spiking frequency and wave speed. These results suggest that the subthalamopallidal circuit is capable both of correlated rhythmic activity and of irregular autonomous patterns of activity that block rhythmicity. Increased striatal input to, and weakened intrapallidal inhibition within, the indirect pathway can switch the behavior of the circuit from irregular to rhythmic. This may be sufficient to explain the emergence of correlated oscillatory activity in the subthalamopallidal circuit after destruction of dopaminergic neurons in Parkinson's disease and in animal models of parkinsonism.
Keywords: basal ganglia, subthalamic nucleus, globus pallidus, computational models, oscillations, synchrony, Parkinson's disease
Most current models of the basal ganglia are static models, in that they represent the inputs and outputs of the component nuclei as firing rates. For example, theAlbin et al. (1989) model, commonly used to explain the symptoms of Parkinsonism, views the interactions of the direct and indirect pathway as constant in time and explains the symptoms of Parkinson's disease in terms of changes in mean rate of the basal ganglia output (Wichmann and DeLong, 1996). In contrast, recent experimental studies have not strongly confirmed the predicted changes in mean rate in these structures under dopamine depletion, but have instead revealed prominent low-frequency periodicity (4–30 Hz) of firing and dramatically increased correlations among neurons in the external segment of the globus pallidus (GPe) and the subthalamic nucleus (STN) (Bergman et al., 1994; Nini et al., 1995; Magnin et al., 2000; Raz et al., 2000; Brown et al., 2001). It is remarkable that the changes in firing pattern seen in those structures do not appear to be attributable to comparable changes in the firing patterns of striatal output cells, although cholinergic striatal interneurons show changes comparable with those seen in the globus pallidus (Raz et al., 1996). The authors of those studies have proposed that a rate model of the basal ganglia is inadequate to capture the dynamic interaction of the STN and GPe that may generate these pathological changes.
In particular, such dynamic interactions may lead to oscillatory activity patterns. Indeed, the connections between GPe and STN neurons show a number of features common to central pattern generators, which suggests that these nuclei might together be capable of self-sustained oscillatory activity. The GPe cells project to the subthalamus and to other basal ganglia structures and inhibit the cells in those regions via GABAA-receptor mediated inhibition. In addition, the GPe cells inhibit each other via recurrent axon collaterals (Stanford and Cooper, 1999; Ogura and Kita, 2000). Subthalamic cells excite neurons in several basal ganglia structures, including the GPe (Kitai and Kita, 1987). Furthermore, these cells show powerful and long-lasting rebound excitation after episodes of hyperpolarization generated by synaptic inhibition from the GPe (Bevan et al., 2000). These properties suggest the possibility for oscillatory rhythms in which GPe neurons are excited by activity in the STN neurons, in turn inhibit the STN cells, and are again excited by the resulting rebound excitation of STN cells that follows the inhibition. A mechanism of this kind has been proposed by Plenz and Kitai (1999) on the basis of their studies of basal ganglia organotypic tissue cultures.
To explore such dynamic interactions, we have performed computer simulations of conductance-based models of the subthalamopallidal circuit, within the limits of our knowledge of the topography of the synaptic connections and the cellular properties involved. These simulations reveal a wide variety of oscillatory patterns, depending on the arrangements and strengths of synaptic connections within and between the cellular populations. We classify these patterns as clustering, propagating waves, and repetitive spiking (which may show little regularity or correlation); each activity pattern can occur continuously or in discrete episodes. The mechanisms underlying these patterns can be understood in terms of the intrinsic properties and synaptic interactions of the cells in our simulations. The network can be switched from irregular uncorrelated spiking to correlated rhythmic patterns through an increase of incoming striatal input together with a weakening of intrapallidal inhibition, suggesting that these changes may underlie the emergence of correlated rhythmic activity in the subthalamopallidal circuit in pathological states.
MATERIALS AND METHODS
Single-compartment conductance-based biophysical models of cells from the STN and the GPe were developed, based on recent voltage-clamp and current-clamp data (Figs. 1, 2). Simulations of these models and of model networks composed of synaptically coupled STN and GPe cells were performed using XPPAUT, developed by G. B. Ermentrout and available atftp://ftp.math.pitt.edu/pub/bardware. A copy of the XPPAUT file containing the models constructed is available from D.T. on request.
Fig. 1.

Properties of STN model neuron. a, Current as a function of voltage. For fixed voltages, steady-state currents were computed with slow gating variables set to their limiting values [X → X∞(v); see Materials and Methods]. In this and all subsequent figures, omitted units are as in Tables 1 and 2. b, Membrane potential of a model STN cell under various current injections. The parameter gNa has been set to 0 to mimic the behavior of an STN cell in the presence of sufficient concentration of TTX to block spiking. c, Spike frequency as a function of injected current (solid line, full model; dotted line, gAHP = 0; dashed line, gCa = gT = 0). d, Duration of afterhyperpolarization after high-frequency spiking. A constant current pulse was applied to a model STN cell for 500 msec. After this, a prolonged afterhyperpolarization occurred before the cell returned to regular spiking. Its duration is plotted against the strength of applied current. e, f, STN rebound bursts after hyperpolarizing injections. e, Model responses of STN cell to currents of varying duration: 25 pA/μm2 of current applied for 300 (top), 450 (middle), and 600 (bottom) msec. Longer current application augments deinactivation of IT, enhancing rebound. f, Responses to currents of varying magnitude: 20 (top), 30 (middle), and 40 (bottom) pA/μm2 of current applied for 300 msec. Stronger current application augments deinactivation of IT, enhancing rebound.
Fig. 2.

Properties of GPe model neuron. a, Top three time traces show firing profiles of a model GPe cell under depolarizing, zero, and small hyperpolarizing input currents (Iapp in pA/μm2), respectively. Bottom trace shows afterhyperpolarization of a model GPe cell after injection of a depolarizing current pulse. b, Membrane potential of a model GPe cell as a function of injected current, with gNa = 0. c, Frequency of GPe spiking as a function of injected current.
STN cells. The STN model includes a set of currents and corresponding kinetics that are based on recent experimental data (Bevan and Wilson, 1999; Bevan et al., 2000). In particular, the model features spike-producing currents (IK and INa), a low-threshold T-type Ca2+ current (IT) and a high-threshold Ca2+ current (ICa) (Song et al., 2000), a Ca2+-activated, voltage-independent “afterhyperpolarization” K+ current (IAHP), and a leak current (IL). The membrane potential of each STN neuron obeys the current balance equation:
The leak current is given by IL = gL(v − vL), and the other voltage-dependent currents are described by the Hodgkin–Huxley formalism as follows: IK = gKn4(v − vK), INa = gNam (v)h(v − vNa), IT = gTa (v)b (r)(v − vCa), and ICa = gCas (v)(v − vCa). The slowly operating gating variables n, h, and r are treated as functions of both time and voltage and have first-order kinetics governed by differential equations of the form dX/dt = φX[(X∞(v) − X)/τX(v)] (where X can be n, h, or r), with τX(v) = τ + τ /[1 + exp [−(v − θ )/ς ]]. Using this formulation, activation (and inactivation) time constants have a sigmoidal dependence on voltage, τ0/φ is the minimum, and (τ0 + τ1)/φ is the maximum time constant. The voltage at which the time constant is midway between its maximum and minimum values is θτ, and ςτ is the slope factor for the voltage dependence of the time constant. Activation gating for the rapidly activating channels (m, a, and s) was treated as instantaneous. For all gating variables X = n, m, h, a, r, or s, the steady-state voltage dependence was determined using X∞(v) = 1/[1 + exp [−(v − θX)/ςX]], where θX is the half activation (or inactivation) voltage for gating variable X, and ςX is the slope factor for that variable. For the T current inactivation variable b, we used b∞(r) = 1/[1 + exp [(r − θb)/ςb]] − 1/[1 + exp[−θb/ςb]]. The unusual way of modeling T current inactivation here [with b∞(r) instead of simply r] was designed to combine the effects of a hyperpolarization-activated inward (sag, or H) current with those of a T current, making the rebound bursts of an STN cell more prominent. These rebound bursts (see Fig. 1e,f) agree with experimental data (Bevan and Wilson, 1999; Bevan et al., 2001).
As the final intrinsic current, we take IAHP = gAHP(v − vK)([Ca]/ ([Ca] + k1)) where [Ca], the intracellular concentration of Ca2+ ions, is governed by [Ca]′ = ε (−ICa − IT− kCa[Ca]). The constant ε combines the effects of buffers, cell volume, the molar charge of calcium, and is in units of (mole-sec)/(coulombs-liter). The constant k1 is the dissociation constant of the calcium-dependent AHP current. The constant kCais the calcium pump rate constant and is in units of (coulombs-liter)/(moles-sec). The current IG→Sthat represents synaptic input from the GPe to STN is modeled as IG→S = gG→S(v − vG→S) Σsj. The summation is taken over the presynaptic GPe neurons, and each synaptic variable sj solves a first-order differential equation s′j = αH∞(vgj − θg) (1 − sj) − βsj. Here vgj is the membrane potential of the GPe neuron j, and H∞(v) = 1/(1 + exp [−(v − θ )/ς ]).
Parameter values for STN cells used in the simulations are given in Table 1. The capacitance Cm was normalized to 1 pF/μm2. Also note that we scaled our model such that the currents have units of picoamperes per square micrometer, to be consistent with the data of Bevan and Wilson (1999) and Bevan et al. (2000).
Table 1.
Basic set of parameter values for the conductance-based model STN cell
| Parameter | Value |
|---|---|
| gL | 2.25 nS/μm2 |
| gK | 45.0 nS/μm2 |
| gNa | 37.5 nS/μm2 |
| gT | 0.5 nS/μm2 |
| gCa | 0.5 nS/μm2 |
| gAHP | 9.0 nS/μm2 |
| vL | −60.0 mV |
| vK | −80.0 mV |
| vNa | 55.0 mV |
| vCa | 140.0 mV |
| τ | 500.0 msec |
| τ | 100.0 msec |
| τ | 17.5 msec |
| τ | 1.0 msec |
| τ | 1.0 msec |
| τ | 40.0 msec |
| φh | 0.75 |
| φn | 0.75 |
| φr | 0.2 |
| k1 | 15.0 |
| kCa | 22.5 |
| ε | 3.75 × 10⁻⁵msec−1 |
| θm | −30.0 |
| θh | −39.0 |
| θn | −32.0 |
| θr | −67.0 |
| θa | −63.0 |
| θb | 0.4 |
| θs | −39.0 |
| θ | −57.0 |
| θ | −80.0 |
| θ | 68.0 |
| θ | −39.0 |
| θg | 30.0 |
| α | 5.0 msec−1 |
| vG→S | −85.0 mV |
| ςm | 15.0 |
| ςh | −3.1 |
| ςn | 8.0 |
| ςr | −2.0 |
| ςa | 7.8 |
| ςb | −0.1 |
| ςs | 8.0 |
| ς | −3.0 |
| ς | −26.0 |
| ς | −2.2 |
| ς | 8.0 |
| β | 1.0 msec−1 |
Parameters in nanosiemans per square micrometer denote maximal conductances of corresponding currents in the STN current balance equation. Parameters in millivolts represent reversal potentials for these currents. Parameters in milliseconds are time constants relating to the time evolution of the gating variables in the Hodgkin–Huxley representations of these currents, whereas other parameters are associated constants.
GPe cells. Our model for single GPe cells is similar in form to that of the STN neurons. The equation for the GPe neurons is:
where Iapp represents a constant external applied current. IL, IK(Baranauskas et al., 1999; Hernandez-Pineda et al., 1999), INa, ICa (Surmeier et al., 1994;Stefani et al., 1998), and IAHPare modeled with the same formulas and equations given above for the STN cells, whereas the low-threshold calcium current takes a simpler form: IT = gTa (v)r(v − vCa), where r satisfies a first-order differential equation. Here we assume τr(v) ≡ τr, a constant. This has the effect of reducing the size of the posthyperpolarization rebound in GPe cells compared with STN cells.
The experimental literature suggests that the GPe neurons have similar ionic currents to STN cells, but in different proportions. Parameter values for GPe cells used in the simulations are given in Table2. In particular, parameters associated with the GPe potassium channels allow for fast spiking of GPe cells (Hernandez-Pineda et al., 1999); we have not included a second slowly deactivating component of the potassium current (Baranauskas et al., 1999). These parameters were selected to match the data for spontaneous firing patterns, rebound response to offset of hyperpolarization, spike frequency adaptation, and frequency–intensity curves obtained from the study of GPe cells in slices (Kita and Kitai, 1991; Nambu and Llinãs, 1994; Cooper and Stanford, 2000).
Table 2.
Basic set of GPe parameter values
| Parameter | Value |
|---|---|
| gL | 0.1 nS/μm2 |
| gK | 30.0 nS/μm2 |
| gNa | 120.0 nS/μm2 |
| gT | 0.5 nS/μm2 |
| gCa | 0.15 nS/μm2 |
| gAHP | 30.0 nS/μm2 |
| vL | −55.0 mV |
| vK | −80.0 mV |
| vNa | 55.0 mV |
| vCa | 120.0 mV |
| τ | 0.27 msec |
| τ | 0.27 msec |
| τ | 0.05 msec |
| τ | 0.05 msec |
| τr | 30.0 msec |
| φh | 0.05 |
| φn | 0.05 |
| φr | 1.0 |
| k1 | 30.0 |
| kCa | 20.0 |
| ε | 1 × 10⁻⁴msec−1 |
| θm | −37.0 |
| θh | −58.0 |
| θn | −50.0 |
| θr | −70.0 |
| θa | −57.0 |
| θs | −35.0 |
| θ | −40.0 |
| θ | −40.0 |
| θ | −57.0 |
| θg | 20.0 |
| α | 2.0 msec−1 |
| vG→G | −100.0 mV |
| ςm | 10.0 |
| ςh | −12.0 |
| ςn | 14.0 |
| ςr | −2.0 |
| ςa | 2.0 |
| ςs | 2.0 |
| ς | −12.0 |
| ς | −12.0 |
| ς | 2.0 |
| β | 0.08 msec−1 |
| vS→G | 0.0 mV |
Parameters in nanosiemans per square micrometer denote maximal conductances of corresponding currents in the GPe current balance equation. Parameters in millivolts represent reversal potentials for these currents. Parameters in milliseconds are time constants relating to the time evolution of the gating variables in the Hodgkin–Huxley representations of these currents, whereas other parameters are associated constants.
Two different synaptic currents are included in the GPe model. IS→G represents excitatory input from the STN, and IG→G represents the inhibitory influence coming from other GPe cells. These are modeled by the same type of expression as used for IG→S, with appropriately renamed synaptic parameters.
The input to the GPe cells from the striatum is represented by a constant hyperpolarizing current Iapp common to all the GPe cells. This current is not specified in Table 2 because in our network simulations it will be one of the main parameters that we vary. The use of this unpatterned inhibitory influence as a parameter was not intended as a realistic representation of the pattern of activity in the striatopallidal pathway, but rather as an approximation to the overall effect of greater or lesser striatal inhibition to the GPe.
Synaptic connectivity. Currently, the details of connections between STN and GPe cells are poorly understood. It is known that STN neurons provide one of the largest sources of excitatory input to the globus pallidus and that the GPe is a major source of inhibitory afferents to the STN (Kitai and Kita, 1987). However, the spatial distribution of axons in each pathway, as well as the number of cells innervated by single neurons in each direction, are not known to the precision required for a computer model. Some early reports suggested that the STN cells project to the GPe in a diffuse manner (Hazrati and Parent, 1992), whereas more recent studies indicate that the two are more tightly interconnected, with a connectivity that may be precisely topographical (Shink et al., 1996) or more heterogeneous (Sato et al., 2000). It is certain from the existing studies that the connection is sparse; that is, each GPe neuron makes synaptic contacts with few STN neurons and vice versa. But the number of synapses made by single neurons or the proportion of neurons contacted by an axon within the arborization cannot currently be estimated. Therefore, we consider multiple architectures based on low numbers of contacts from STN to GPe cells, from GPe to STN cells, and within the GPe. In the model networks, each GPe neuron sends inhibition to the entire GPe population or some part of it, as well as to one or more STN neurons. Each STN neuron sends excitation to one or more GPe neurons. The intrinsic parameters associated with the STN and GPe cells are the same for each simulation; these are the parameter values of the individual model STN and GPe neurons given in Tables 1 and 2. We used networks of between 8 and 20 cells of each type for the simulations described in this paper.
RESULTS
Firing properties of model STN and GPe neurons
The model STN neurons were adjusted to exhibit properties that are characteristic of the firing of STN neurons in experimental studies on slices (Bevan and Wilson, 1999; Bevan et al., 2000; Beurrier et al., 2000). The model neurons are spontaneously active with a firing rate of ∼3 Hz. When current is injected, the cells achieve firing rates on the order of 200 Hz with little change in the voltage range of the membrane potential traversed by the action potentials. Figure1a presents currents generated by voltage-clamp simulations. Figure 1b displays the membrane potential of a model STN cell as a function of constant current injection, after setting gNa = 0. The frequency–current (f–I) relation for a model STN cell is shown in Figure 1c. Figure 1d shows the duration of the afterhyperpolarization after a 500 msec period of high-frequency spikes evoked by different levels of current pulses. Note that the afterhyperpolarization increases smoothly over a wide range of firing rates during the pulses. Figure 1, e and f, demonstrates that STN neurons generate rebound bursts after the removal of negative current. The duration of the rebound depends on the degree of hyperpolarization. The rebound bursts typically last up to 200 msec and are then followed by spontaneous firing.
Sample responses of model GPe neurons to current injections are shown in Figure 2. High-frequency repetitive firing does not show strong accommodation and is followed by a pronounced hyperpolarization (Fig. 2). After a hyperpolarizing current pulse, the neuron can exhibit rebound firing. We note, however, that the ability of GPe neurons to rebound is not essential for the generation of rhythmic population activity. For weak hyperpolarizing applied currents, the neuron exhibits oscillations in which an active spiking phase alternates with a silent phase of near resting behavior. This activity pattern, which is common to fast-spiking neurons in the GPe (Cooper and Stanford, 2000) and elsewhere, has important implications for the model. In our implementation, it arises because of the slow time course of calcium buildup and decay in the neurons. At higher levels of current, the model cells show continuous firing in response to current pulses. Similar dynamics can arise from other mechanisms (Rush and Rinzel, 1995), and the mechanism of this kind of firing in GPe neurons is not known with certainty. The network dynamics that arise from this fire-and-pause mode of activity in our model do not depend critically on the cellular mechanism. We also note that several papers have reported various types of neurons within the GPe. Our model GPe neurons, as shown in Figure 2, were adjusted to display properties similar to the type 2 neurons described by Nambu and Llinãs (1994), the type A neuron described by Cooper and Stanford (2000), and the repetitive firing neurons described by Kita and Kitai (1991). Recent experiments have suggested that this is the most dominant type of neuron within GPe. The episodic firing behavior seen at weakly negative applied currents resembles the high-frequency discharge with pause described by DeLong (1971). In our simulations of the STN–GPe network, Iapp is taken to be a small hyperpolarizing (negative) current and, as described in Materials and Methods, will approximate input from the striatum.
The prototype networks
In the following sections we shall describe the network activity generated by three prototype network architectures, as well as how this activity depends on the synaptic conductances gS→G, gG→G, and the applied current Iapp to GPe. Each of the three prototype architectures includes a distinct type of connectivity between STN and GPe cells. In all of these, each cell only contacts a small number of other cells. However, within the simulated networks, the density of connections relative to the size of the network varies across architectures, and they are named accordingly: in sparsely connected architectures, each cell sends out connections to a small subset of the STN and GPe populations; in tightly connected architectures, the connectivity patterns yield localized circuits of reciprocally connected GPe and STN cells, in which each cell sends inputs to, and receives inputs from, a relatively large subset of the other cells in the circuit.
Random, sparsely connected architecture
The simplest class of networks consistent with low connectivity is one in which each GPe cell sends inhibitory input to a small proportion of the STN neurons selected randomly, and the STN cells also make sparse and random connections. The chances of reciprocal connections between any STN–GPe cell pair is low. This class of networks was represented using the network shown in Figure3a. The subthalamic neurons could fire spontaneously by their usual pacemaker mechanism (Bevan and Wilson, 1999; Beurrier et al., 2000) but the GPe neurons were inhibited by the application of Iapp (representing striatal inhibition) to a level just adequate to prevent their spontaneous firing.
Fig. 3.
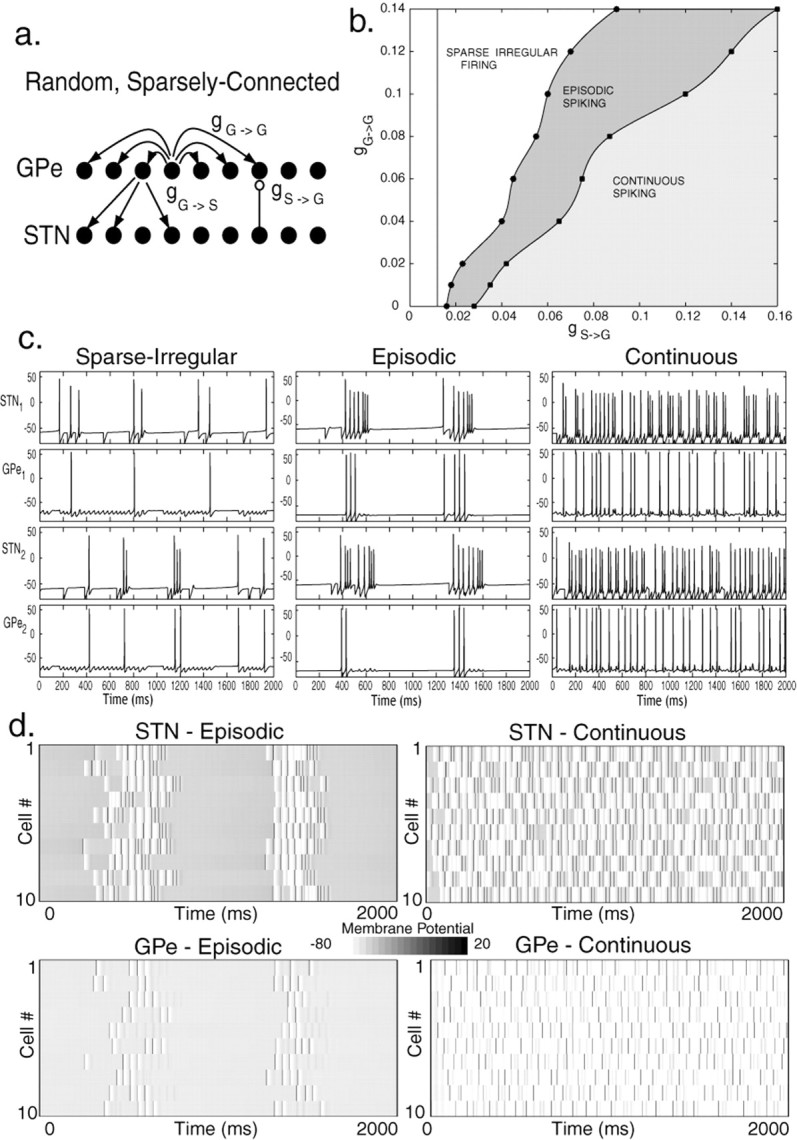
Activity patterns in a random, sparsely connected architecture. a, Arrangement of the model network. Each STN neuron excites a single GPe neuron selected at random, and each GPe neuron inhibits three randomly chosen STN cells. GPe cells also inhibit each other through all-to-all connections. b, Dependence of activity patterns on coupling strengths gG→Gand gS→G. Weak STN→GPe excitation or strong GPe→GPe inhibition leads to sparse irregular firing patterns. Intermediate values yield episodic patterns, whereas high levels of excitation and low levels of GPe mutual inhibition give rise to continuous uncorrelated activity. c, Membrane potential (in millivolts) as a function of time (milliseconds) for individual cells in each of the activity patterns: sparse activity (gG→G = 0.06 nS/μm2; gS→G = 0.03 nS/μm2; gG→S = 2.5 nS/μm2; Iapp = −1.2 pA/μm2), episodic, almost-synchronized spiking (gG→G = 0 nS/μm2; gS→G = 0.016 nS/μm2; gG→S = 2.5 nS/μm2; Iapp = −1.2 pA/μm2), and continuous, irregular spiking (gG→G = 0.02 nS/μm2; gS→G = 0.1 nS/μm2; gG→S = 2.5 nS/μm2; Iapp = −1.2 pA/μm2). d, Network activity in various patterns. In each plot, 10 rows show the voltage traces of 10 cells, with time evolving over 2000 msec to the right along each row. Voltage is coded in grayscale as shown. Because they are so brief, individual action potentials (dark gray line segments) are not prominent, but are more clearly indicated by their afterhyperpolarization (white bars).
The activity patterns that this network displays are summarized in Figure 3b–d. In these patterns, the firing of each cell is typically irregular and weakly correlated with the activity of other cells. Dependence of activity on gS→G and gG→G is illustrated in Figure 3b. As with all the architectures, if gS→G is too small, then the GPe cells cannot respond to STN firing, and there is no network activity, only the pacemaking of the STN cells. For larger values of gS→G, the occasional firing of GPe cells produces an irregular background of inhibition that deregularizes the STN neurons, resulting in sparse irregular firing in both structures (Fig. 3c, first panel). GPe neurons fire in a correlated (but not perfectly one-to-one) way with the single STN neuron to which each is connected, but correlations are weak among randomly selected cell pairs. The correlations that do occur have a very narrow time scale, with connected GPe and STN cells firing almost simultaneously as the GPe neuron fires on the EPSP generated by the STN neuron or not at all. With still larger values of gS→G, the network displays episodic activity, as shown in Figure 3, c and d. During each episode, the cells fire irregularly, and there is an increased synchronization both within and among nuclei. The episodes of firing involve all neurons in the network. The episodes last for ∼300 msec, and their durations increase with increasing gS→G; the silent periods between the episodes remain approximately constant at 500 msec. When gS→G becomes sufficiently large, the network activity switches to continuous, irregular spiking as depicted in Figure 3, c and d. There are weak or no within-nuclei correlations of firing in this continuous regime, and across-nuclei correlations are rare because they are restricted to cells receiving direct interconnections (which are sparse). This is shown in Figure 3d, but was also tested by calculating the cross-correlations among and between the two groups of cells.
Episodic rhythms
To understand the neuronal mechanism underlying episodic rhythms, suppose that one or more STN cells fire action potentials. The resulting excitation may induce the corresponding GPe cells to respond with their own spikes. This leads to hyperpolarization of STN cells, which resets the pacemakers of these. This is the same mechanism illustrated experimentally by Bevan et al. (2001) after stimulation of inhibitory inputs to the STN. The postinhibitory firing of the STN neurons induces another round of firing in the GPe neurons. So long as there is some divergence in one or both directions (as in the GPe→STN connection of Fig. 3a), activity in some neurons will tend to recruit others, and the entire network will ultimately be recruited. This causes T currents within the STN cells to deinactivate so that activity during the episode can be sustained through postinhibitory rebound. The termination of an episode of activity is caused by activation of the outward K+ current, IAHP, in the GPe cells as calcium builds up with each additional spike. This is illustrated in Figure 4. Once IAHP is sufficiently activated, a GPe neuron is no longer able to respond to excitation from STN. When GPe activity terminates, STN cells may fire one last burst of spikes caused by postinhibitory rebound. Activity then recurs when STN cells recover enough to fire again, by which time the GPe cells can again respond to the STN.
Fig. 4.

Mechanisms underlying episodic activity patterns. The gray trace in the top box shows the evolution of voltage over time for a single GPe cell in an episodic pattern, whereas the black trace shows the voltage for a single STN cell. The boxes below show the intracellular calcium concentration of each cell as a function of time. Initially, GPe spikes closely follow STN spikes. Here Iapp is sufficiently strong such that the build-up of calcium terminates the GPe activity of the cell eventually, after which the STN cell fires one last volley of rebound spikes until about 2600 msec. Subsequent decay of calcium allows STN activity to resume after time 3200 msec; this recruits the GPe cell again.
As described earlier, if the overall current input to a GPe cell is weakly inhibitory, then the calcium of the cell can reach a level that inhibits firing (Fig. 2a); thus, the neuron fires in the episodic mode. In our simulations, we assume that the hyperpolarizing applied current from striatum to GPe (Iapp) is strong enough such that GPe cells are not spontaneously active. When the excitatory input from STN to GPe is relatively weak, the total input to GPe is appropriate to trigger calcium-regulated episodic firing. On the other hand, if the excitation from STN to GPe is sufficiently strong, the calcium-dependent AHP current in GPe cells will achieve an equilibrium level that will slow but no longer terminate GPe firing. GPe cells will always be able to respond to the firing of STN cells in this case, and a continuous rhythm results. Increasing gS→G transforms an episodic rhythm into a continuous one; such a transition may also be achieved by decreasing the magnitude of Iapp from a large hyperpolarizing level.
The duration between active episodes is determined primarily by the IAHP current in STN neurons. During an episode, STN neurons fire rapid action potentials resulting in an increase of their intracellular calcium. Once the event terminates, there is a prolonged afterhyperpolarization before the cells can resume their pacemaking spiking activity (Bevan and Wilson, 1999) (Fig. 1d) and initiate a new episode. The time between episodes does not depend significantly on Iappor the synaptic parameters gS→G, gG→G.
The duration of each episode is determined by two factors. The first is how long it takes for calcium to build up and hyperpolarize GPe neurons so that they no longer respond to excitation from STN. This depends on the strength of STN→GPe synaptic excitation, as well as on Iapp. The second factor is the duration of any rebound bursting generated by STN neurons at the end of the episode. Both of these depend on the rate of firing within the episode. Firing rate within the episode is determined by the strength of synaptic connections and the time between onset of GPe inhibition in an STN neuron and the postinhibitory response.
All of the above description holds regardless of the action of the intra-GPe inhibition. Because it is all-to all, the intra-GPe inhibition in this network acts in proportion to the total activity in the GPe, and so opposes the STN→GPe excitation. For larger values of gG→G, the network requires increased STN activity to support organized firing. The value of gS→G at which the activity switches from episodic to continuous firing increases, in an approximately linear manner with gG→G. When gG→G becomes too large, the network exhibits asynchronous, irregular activity, as occurs when gS→G is small.
Structured, sparsely connected architecture
We next consider the off-center architecture depicted in Figure5a. Although the GPe→STN connection is more structured in this model network, it is so in a way that avoids direct reciprocal connections between GPe and STN. The nearest-neighbor intra-GPe inhibition is structured to create a lateral inhibition among GPe neurons that have overlapping projections in the STN.
Fig. 5.

Activity patterns in a structured, sparsely connected architecture. For all simulations in this Figure, vG→G = −85 mV and β = 0.04 msec−1 for the GPe cells. a, Arrangement of the model network. Each GPe neuron inhibits its two immediate GPe neighbors; it also inhibits two STN neurons, skipping the three located nearest to it. Each STN cell sends excitation only to the nearest, in register GPe cell. Spatially periodic boundary conditions were imposed. b, Dependence of activity patterns on coupling strengths gG→G and gS→G when gG→S = 4.5 nS/μm2and Iapp = −1.0 pA/μm2. The parameter regime and initial conditions used favor formation of clusters rather than waves. Increases in gS→G lead to continuous activity; increases in gG→G weaken activity. c, Voltage (in millivolts) as a function of time (in milliseconds) for individual cells in the three clustered activity patterns: weak and irregular clustered activity (gG→G = 0.06 nS/μm2; gS→G = 0.2 nS/μm2; gG→S = 4.5 nS/μm2; Iapp = −1.0 pA/μm2), episodic clustered oscillations (gG→G = 0.06 nS/μm2; gS→G = 0.56 nS/μm2; gG→S = 4.5 nS/μm2; Iapp = −1.0 pA/μm2), and continuous clustering (gG→G = 0.06 nS/μm2; gS→G = 0.72 nS/μm2; gG→S = 4.5 nS/μm2; Iapp = −1.0 pA/μm2). d, Network activity in various patterns, as in Figure3d but with eight rows shown.
This network can give rise to more varied network dynamics than the unstructured network described above. Most patterns feature clustering, in which each structure is divided into subsets of neurons that become highly correlated with each other (Fig. 5b–d). The most commonly observed clustered pattern consists of two clusters, with alternating pairs of cells belonging to opposite clusters (Fig.5c,d). Different clusters alternate firing, and in this pattern, cluster membership is persistent over time. The switch of activity from one cluster to another can involve either an overlap of firing or a brief interval of network quiescence, depending on parameters. There is a tight synchrony of firing among cells of the same cluster.
Clustered rhythms
To understand the neuronal mechanism underlying clustered rhythms, consider an example of an activity pattern consisting of two clusters. Suppose that one subpopulation of STN neurons, which we denote as S1, excites its corresponding subpopulation of GPe neurons, call them G1, to initiate an episode of firing. If the inhibition from G1 is powerful enough, then it prevents the remaining STN neurons, in a different subpopulation S2, from firing. Eventually, cells in S2 escape from their suppressed state and fire. This induces the remaining GPe cells, group G2, to fire, and the resulting inhibition terminates the activity of S1. The roles of the S1/G1 and S2/G2 clusters are now reversed.
The primary reason why cells in S2 are able to escape is that although S2 cells are hyperpolarized, their inward IT currents deinactivate. A second reason is that there is some slight adaptation of firing rates of cells in S1 as their IT currents inactivate and their AHP currents accumulate. Unlike the episodic firing described earlier, cluster alternation is not primarily driven by accumulation of AHP currents, but by persistent inhibition and the resulting removal of inactivation of rebound currents. These factors appear in Figure6. As long as S1cells maintain a high firing frequency, then so will cells in G1. This results in a tonic level of inhibition to cells in S2, preventing them from firing. A decrease in the firing rate of S1caused by adaptation helps allow S2 to become active, and its excitability is enhanced by rebound currents accumulated during the persistent inhibition. The length of time for which one cluster can fire before another one takes over, and hence the population bursting frequency, is mostly set by the rate of deinactivation of IT in inactive STN cells relative to the level of inhibition they receive. For the parameters used here (based on studies from brain slices) the cluster alternation rate ranges from 4 to 6 Hz.
Fig. 6.

Mechanisms underlying clustered activity patterns. The top box shows the superimposed voltage time courses for an STN cell (dotted trace) and a GPe cell (solid trace) from a single, tightly synchronized pair belonging to the same cluster in a clustered rhythm; the middle box shows the same for a single pair from a different cluster. The bottom box shows the availability level of the ITcurrents for the STN cells in the two different pairs (solid curve corresponds to middle box; dashed curve to top box). When availability of IT becomes sufficiently large, the suppressed cluster is able to escape and fire; this then suppresses the previously active cluster.
We note that other mechanisms besides deinactivation of the IT current may also promote escape, thus contributing to the generation of clustered rhythms. For instance, it is possible that short-term synaptic plasticity plays a role in escape mechanisms; in fact, Hanson and Jaeger (2002) have recently demonstrated that the STN to GPe pathway exhibits short-term depression.
A key point is that network activity segregates cells in such a way that at any given time, neurons within silent STN clusters are receiving more inhibition from active GPe cells than are the active STN neurons. Hence, inhibition may play the dual role of maintaining the active STN bursts (by deinactivating IT), while suppressing the silent STN neurons.
Additional clustered patterns also arise from this architecture, as do propagating waves. Many of these patterns are dynamic, with cluster membership changing over time. Examples of alternative cluster patterns include a two-cluster pattern in which every cell is in a different cluster from its two immediate neighbors and a four-cluster pattern in which cells in the same cluster are separated by three other cells.
Clustered activity leads to discrete phase differences among neurons. The range and distribution of those differences is determined by the number of clusters, with the simplest outcome, consisting of two phases, described here. In a larger network of this kind, it is feasible that a large number of clusters could arise, giving a wide range of phase relationships. A continuous distribution of phases among STN and GPe neurons, however, would require traveling waves of activity within the STN and GPe.
As in the less structured architectures, intermediate values of gS→G give rise to episodic activity in the network as a whole (Fig. 5c,d). This occurs for the same reason (accumulation of Ca-dependent K current), and because this is slower than the process responsible for cluster alternation, it affects all clusters equally. At higher values of excitation and/or lower levels of intra-GPe inhibition, clustered activity becomes continuous, because the effect of the AHP current is overcome (Fig.5b–d). Episodic clustering is less robust than continuous clustering, because in a sparsely connected network, it is difficult for calcium to build up sufficiently throughout the GPe population to turn off activity across a large segment of the network. In fact, for sparsely connected networks in general, episodic rhythms are more robust when the architecture is random as opposed to structured (random connections allow activity to spread across the network more quickly).
Structured, tightly connected architecture
The third network to be considered is the structured, tightly connected architecture represented by the model system in Figure7a. Figure 7b illustrates regions in the (gS→G, gG→G) parameter plane that support each activity pattern, whereas Figure 7, c and d, shows how cellular activity varies over time in a variety of these patterns. Again, Iapp is set at a level so that isolated GPe neurons are silent.
Fig. 7.

Activity patterns in the structured, tightly connected architecture. a, Network used for these simulations. Each GPe neuron contacts the five closest STN neurons, as well as all of the GPe cells. Each STN cell sends excitation to the three closest GPe cells. Spatially periodic boundary conditions were imposed. b, Dependence of activity patterns on coupling strengths gG→G and gS→G when gG→S = 1.0 nS/μm2 and Iapp = −1.2 pA/μm2. Increases in gS→G lead to continuous activity; increases in gG→G yield a transition to waves followed by sparse, irregular firing. The value of gG→G at which each of these transitions occurs rises with gS→G. c, Voltage (in millivolts) as a function of time (in milliseconds) for individual cells in various activity patterns: episodic, almost-synchronized spiking (gG→G = 0.0 nS/μm2; gS→G = 0.013 nS/μm2; gG→S = 1.0 nS/μm2; Iapp = −1.2 pA/μm2for GPe), episodic wave (gG→G = 0.02 nS/μm2; gS→G = 0.013 nS/μm2; gG→S = 1.0 nS/μm2; Iapp = −1.2 pA/μm2), and continuous wave (gG→G = 0.1 nS/μm2; gS→G = 0.03 nS/μm2; gG→S = 1.0 nS/μm2; Iapp = −1.2 pA/μm2). d, Network activity in various patterns, featuring STN cells during episodic spiking, episodic wave, continuous wave, and sparse irregular spiking (gG→G = 0.23 nS/μm2; gS→G = 0.03 nS/μm2; gG→S = 1.0 nS/μm2; Iapp = −1.2 pA/μm2). The GPe cells exhibit voltage patterns very similar to the STN cells.
Let us consider the network behavior at various different levels of intra-GPe inhibition. First suppose that there is virtually no intra-GPe inhibition (gG→G ≈ 0). In this case, if gS→G is very small, the STN neurons spike slowly via their pacemaker mechanism, the GPe neurons are mostly silent, and interaction between the GPe and STN populations is too weak to generate any discernible network rhythm. Increasing gS→G gives rise to an episodic pattern, with every cell participating in events of repetitive spiking activity, separated by periods of quiescence, that repeat periodically at 1–2 Hz. When gS→G gets above a certain level, the population activity switches to a continuous mode; all the STN and GPe cells exhibit tonic spiking, with the spiking frequency growing to ∼25 Hz as gS→G is increased. The transformation from episodic to continuous activity achieved by increasing gS→G can also be observed after decreasing the magnitude of the hyperpolarizing Iapp. Recall that weakening Iapp (making it less negative) transforms a GPe neuron from firing in the episodic mode to spiking continuously. The mechanism underlying the transformation from episodic to continuous activity in the network is similar to that in an isolated GPe neuron, and in both of the architectures described earlier.
Higher levels of the intra-GPe inhibition have the effect of producing traveling waves, within both the episodic and continuous firing modes (Fig. 7c,d). These waves correspond to solitary pulses with no activity in the wake of the wave (note that the appearance of multiple “bands” of activity in Figure 7d is caused by the periodic boundary conditions imposed; at any one time, only one localized group of cells is active). The propagation structure of a wave was clearly discernible in cross-correllograms calculated from the simulations (data not shown).
If gG→G is increased to even higher values, the waves lose their shape and firing activity eventually becomes sparse, irregular, and uncorrelated. For higher levels of excitatory drive from STN to GPe, the intra-GPe synaptic conductance gG→G needs to be stronger before waves are able to form, but these waves exist for a larger interval of gG→G values (Fig. 7b).
This network does not exhibit clustered patterns. Moreover, the existence of waves here depends on a rather large GPe→GPe synaptic footprint. If each GPe neuron sends inhibition only to its immediate neighbors, then activity becomes distributed throughout the populations rather than localized in the form of waves.
Propagating waves
To understand the neuronal mechanism underlying propagating wave activity, we first consider a simple network with each neuronal population represented by a one-dimensional array, indexed from left to right by i = … , −2, −1, 0, 1, 2, 3, … Each GPe cell Gi sends inhibition to one STN cell Si, as well as every GPe cell, and each STN cell Si sends off-centered excitation to the two GPe cells Gi−1 and Gi+1. We assume that a wave has been generated and is propagating to the right, and we suppose that at some time, say t = 0, the GPe cell G0 starts to burst. We shall describe how the activity continues to propagate to the right in a lurching manner.
As G0 fires, it inhibits the STN cell S0 and deinactivates the T current in S0. When S0 escapes or becomes released from inhibition, it fires a volley of spikes, in turn exciting the GPe cells G−1 and G1. At this point G1 is more excitable than G−1, because G−1 had recently fired and is still in a partially refractory state. Hence, G1 will tend to fire in response to S0 before G−1 does. Once G1 fires, it sends inhibition to all the other GPe cells. In particular, this inhibition will prevent G−1 from firing. Furthermore, when G1 fires, it inhibits the STN cell S1; thus the entire process repeats, except it is now shifted over by one STN and one GPe cell.
We have explored numerous related architectures and have found that the existence of propagating waves is a very robust activity pattern. Waves can exist if the STN→GPe connectivity footprint is broader than the GPe→STN footprint, and also in the reverse situation; in addition, both on-centered and off-centered footprints can support propagating waves. The mechanism underlying wave activity in various different network architectures is essentially the same as described above. Typically, a group of STN cells fires synchronously because of postinhibitory rebound, and this causes excitation to be sent to a corresponding group of GPe cells. The GPe cells just ahead of the leading edge of the wave will be the first cells to fire in response, because other nearby GPe cells have just fired and hence are in a refractory mode. This firing will inhibit the other GPe cells that had received excitatory input, suppressing their activity; at the same time, it will inhibit a group of STN cells. This group of STN neurons will eventually fire when they are able to escape, or become released from, the inhibitory influence from GPe. The process then continues as before.
We note that to generate a wave, it is important that the GPe cells at the leading edge of the wave are able to inhibit those GPe cells behind them. It is therefore necessary to have gG→Gsufficiently large. Decreasing gG→G often transforms wave activity to clustering or rapid spiking (either episodic or continuous). For solitary waves to arise, the GPe→GPe footprint should also be larger than the STN→GPe footprint; otherwise, activity spreads quite rapidly throughout the network and full-population spiking behavior or spatially periodic waves (data not shown) typically result.
The speed with which the waves propagate is dependent on the size of the STN→GPe and GPe→STN connectivity footprints. Other synaptic parameters, such as gS→G, also play a role in determining wave speed. Moreover, the average active (and silent) phase duration of STN neurons is directly correlated with the length of time it takes the wave to travel from one end of the array to the other, and hence inversely correlated with the speed. We observed that at fixed levels of gS→G, stronger intra-GPe inhibition produces slower waves; whereas at fixed levels of gG→G, varying gS→Ghas two competing influences on wave speed, caused by different mechanisms coming into play for the release or escape from inhibition of inactive STN cells.
Irregular and uncorrelated activity
These computational studies suggest that there are several sources leading to irregular and uncorrelated activity patterns in the STN–GPe network. An unstructured and sparsely connected topography is one possible source; however, certain choices of the synaptic parameters and applied currents also promote irregular behavior regardless of network architecture. For example, we observed that if gG→G is sufficiently large and Iapp is above (i.e., less negative than) some fixed hyperpolarizing level, then the network activity is irregular. The implications will be discussed in the next section. Here we describe both the topographic and the input-related neuronal mechanisms underlying irregular uncorrelated behavior.
We saw earlier (Figs. 5, 7) that a structured architecture is required for the generation of both clustered and propagating wave solutions. In a clustered solution, the network organizes itself so that each STN cell in an inactive cluster receives approximately the same degree of inhibitory input. For a wave to be propagated, the active STN and GPe cells must have structured footprints to spread activity to cells ahead of the leading edge. These patterns are not possible in a randomly connected network. In such a topography, the firing of a small number of cells tends to spread activity (which may be either episodic or continuous) efficiently throughout the network. Once one STN cell fires, it spreads inhibition to other STN cells via connections with the GPe cells, thus delaying or possibly preventing activity of other STN cells. Hence, one expects at most a loose synchronization between the firing of STN cells.
We next discuss why weakening striatal inhibition of the GPe (represented here as the magnitude of Iapp) promotes irregular behavior, especially if gG→G is sufficiently large. Recall that making Iapp less negative allows the GPe cells to fire tonically (Fig. 2a). This leads to tonic inhibitory input to the STN. If this input is sufficiently strong, then it will completely suppress STN activity. For moderate levels of tonic inhibition, the STN cells may still be able to fire action potentials caused by deinactivation of IT; however, in the tonic firing regime, the GPe neurons are less sensitive to excitation from STN. This means that, for both moderate and strong levels of striatal inhibition, excitation from the STN is too weak to organize the GPe population into distinct clusters or propagating waves. In this case, strong intra-GPe inhibition may further desynchronize oscillations by delaying, weakening, or suppressing the firing of some GPe cells immediately after other GPe cells fire. This type of network behavior is consistent with that reported in related excitatory–inhibitory networks (Hansel and Mato, 2001).
DISCUSSION
The subthalamic nucleus and the globus pallidus are heavily interconnected and should have a strong tendency to entrain each other. Given that neurons in both areas have membrane properties that predispose them to rhythmic firing, it is somewhat surprising that they are not engaged in rhythmic firing all the time. All available evidence, however, indicates that these structures do not generate correlated spontaneous rhythmic activity (or even show internally correlated firing) under physiological conditions encountered in extracellular recording experiments (Nini et al., 1995;Magill et al., 2000; Raz et al., 2000;Urbain et al., 2000).
After experimental dopamine depletion, and in patients with Parkinson's disease, strongly correlated rhythmic activity can be observed in both the subthalamic nucleus and in the globus pallidus external segment (Bergman et al., 1994; Nini et al., 1995; Magnin et al., 2000; Raz et al., 2000; Brown et al., 2001). The subthalamic nucleus is required for the oscillations in the globus pallidus, as STN lesions abolish pallidal burst firing (Ni et al., 2000); similarly, compromise of GPe interferes with parkinsonian activity of STN (Chesselet and Delfs, 1996; Hassani et al., 1996). Plenz and Kitai (1999) have shown that in organotypic cultures, correlated activity can arise in both structures and is caused by the interaction between the STN and GPe rather than being driven by an external source. In that reduced preparation, powerful excitation from the rebound burst firing of STN neurons produced increased activity in the GPe population, which then inhibited the subthalamic cells and set them up for another rebound.
We have shown in a biophysical, conductance-based model that the cellular properties of STN and GPe cells can give rise to a variety of rhythmic or irregular self-sustained firing patterns, depending on both the arrangement of connections among and within the nuclei and the effective strengths of the connections. The model was based on a simplified representation of the properties of STN and GPe neurons in slices and does not include all the influences that may act in vivo. The dependence on network architecture points out the importance of certain missing pieces of anatomical information. It is critical to know the spatial extent of the recurrent collateral connections among GPe neurons and whether they are spatially organized or diffuse. Likewise, it is important to determine the precision of the spatial organization of GPe→STN and STN→GPe projections and whether the two nuclei project on each other in a reciprocal or out of register manner. In one anatomical study, dense, precisely reciprocal connections between the subthalamic nucleus and the globus pallidus was reported (Shink et al., 1996), but when individual axons are stained, the connectivity pattern has appeared much more diffuse (Sato et al., 2000). In the absence of definitive anatomical information, our model can be of some benefit by comparing the expected activity patterns emerging from various likely connectivity architectures and by characterizing conditions under which the network may exhibit either synchronous or asynchronous oscillations.
An emerging body of evidence suggests that even in the pathological states caused by dopamine denervation, global synchronous oscillatory activity is not common. A key finding of the studies of synchronous oscillations in 1-methyl-4-phenyl-1,2,3,6-tetrahydropyridine (MPTP)-treated monkeys was the wide range of phase relationships among neurons in the globus pallidus, indicating that not all the cells oscillate synchronously (Raz et al., 2000). This is in contrast with the synchronous episodes seen in our random, sparsely connected network. We note that this architecture lacks the structure required to support spatially organized activity, which could produce stable phase shifts among neurons. The rest tremor in Parkinson's disease also shows a variety of phases in different parts of the body, suggesting that it is not driven by a single oscillator (Hurtado et al., 2000; Ben-Paz et al., 2001). In the reduced preparation described by Plenz and Kitai (1999), some STN–GPe pairs of cells showed in-phase slow oscillations, whereas others bursted out of phase. These results suggest that different parts of the STN–GPe system may oscillate separately from others. In this case, one possibility is that the rhythm-generating mechanisms that we have elucidated in our model network could be played out among multiple oscillatory subnetworks. In the model network, the structured architectures could produce spatial clustering and waves, which are consistent with the range of phase relations of cellular activity seen in experimental dopamine depletion studies. The network also produced the slow oscillations observed by Plenz and Kitai (1999)in culture. Our results suggest that the absence of rhythmic activity at tremor frequency in their preparation may occur because the STN–GPe network in their experiment lacks the structured architecture (Fig.5a) needed for the generation of a clustered rhythm. The dynamic clustering rhythms seen in our network are also reminiscent of behavior reported in several experimental studies. Hurtado et al. (1999) recorded neuronal activity from awake Parkinson's disease patients undergoing stereotaxic pallidotomy. They found that some paired recording sites within GPi showed periods of transient synchronization. Dynamic synchronization of pallidal activity in MPTP-treated monkeys was also reported by Bergman et al. (1998).
Roles of inhibition and the function of the indirect pathway
According to recent studies, correlated oscillatory activity in the GPe and STN neurons is closely related to the generation of the symptoms of Parkinsonism. The origin of the oscillatory activity or the correlations among the neurons is not obvious, because the same neurons do not show strong correlations in untreated animals (Raz et al., 2000). The firing rate model holds that during Parkinsonian states, an increased level of inhibition from the striatum to GPe causes a decrease in the activity of GPe. This in turn would send less inhibition to STN, thus increasing STN activity and ultimately leading to increased inhibitory output from the basal ganglia to the thalamus (DeLong, 1990; Wichmann and DeLong, 1996; Obeso et al., 1997). In our model network, a more complex picture emerges, in which the STN and GPe are spontaneously oscillatory and synchronous, whereas intra-GPe inhibition and an appropriate level of input from the striatum can act to suppress rhythmic behavior. Note that inhibition plays multiple roles in the generation of each of the activity patterns we observed. In the clustered rhythm, for example, active STN neurons need moderate levels of feedback inhibition from the GPe to synchronize among themselves. Silent STN neurons, on the other hand, are prevented from firing because they receive more powerful tonic inhibition. For the generation of propagating waves, intra-GPe inhibition is needed to prevent activity from persisting in the wake of the wave. Hence, this inhibition helps to organize the network into a structured activity pattern. If one increases the intra-GPe inhibition, this can desynchronize the GPe oscillations, and irregular firing may result. The role of striatal inhibition is the most pivotal in generating or suppressing the organized oscillatory activity, because it simultaneously controls the inhibitory feedback to the STN through the GPe cells and influences the intra-GPe inhibition, which controls spatial patterning of activity in the network.
Some papers have questioned the role of the so-called indirect pathway (Parent and Hazrati, 1995; Levy et al., 1997; Parent and Cicchetti, 1998). These arguments point to experiments demonstrating that GPe activity does not decrease substantially in a Parkinsonian state, as well as results indicating that the overall level of GABAA received by GPe cells (from both striatal and intrinsic sources) may hold steady or even decrease. The analysis and simulations given in this paper suggest that to account for the new experiments, one does not need to diminish the role of the indirect pathway. Instead, our analysis demonstrates that the diverse contributions of inhibition to indirect pathway firing patterns can shift the network between rhythmic and irregular modes of firing. In Figure 8, we suggest an alternative interpretation of the roles of inhibition and excitation in allowing the indirect pathway to generate tremor-like activity. In the normal state, there is strong GABAAsynaptic inhibition among GPe neurons, making their output to the STN asynchronous, and effectively weakening the synaptic interactions between GPe and STN. After dopaminergic denervation, an increased level of inhibition from the striatum to GPe is combined with the release of enkephalin and dynorphin, which acts presynaptically to weaken the collateral connections among GPe cells (Stanford and Cooper, 1999; Ogura and Kita, 2000). From our results, this could strengthen and synchronize the interactions between STN and GPe and shift the network into an oscillatory mode.
Fig. 8.

Schematic diagram of the indirect pathway connections in the basal ganglia in normal (left column) and parkinsonian (right column) states. Minus symbolsdenote inhibitory connections; plus symbols denote excitatory ones. In the parkinsonian regime, the combination of weakened intra-GPe connections and strengthened striatal input set the stage for synchronous GPe-STN oscillations and correlated rhythmic STN output.
Footnotes
This work was supported by the National Science Foundation Grants DMS-0103822 (D.T., A.C.Y.) and DMS-9804447 (J.E.R.) and National Institutes of Health, National Institute of Neurological Disorders and Stroke Grant NS26473 (C.J.W.). We thank Mark Bevan for providing direct access to his data on STN and GP cell activity.
Correspondence should be addressed to David Terman, Department of Mathematics, The Ohio State University, 231 West 18th Avenue, Columbus, OH 43210. E-mail: terman@math.ohio-state.edu.
REFERENCES
- 1.Albin RL, Young AB, Penney JB. The functional anatomy of basal ganglia disorders. Trends Neurosci. 1989;12:366–375. doi: 10.1016/0166-2236(89)90074-x. [DOI] [PubMed] [Google Scholar]
- 2.Baranauskas G, Thatch T, Surmeier DJ. Delayed rectifier currents in rat globus pallidus neurons are attributable to Kv2.1 and Kv3.1/3.2 K(+) channels. J Neurosci. 1999;19:6394–6404. doi: 10.1523/JNEUROSCI.19-15-06394.1999. [DOI] [PMC free article] [PubMed] [Google Scholar]
- 3.Ben-Paz H, Bergman H, Goldberg JA, Giladi N, Hansel D, Reches A, Simon ES. Synchrony of rest tremor in multiple limbs in parkinson's disease: evidence for multiple oscillators. J Neural Transm. 2001;108:287–296. doi: 10.1007/s007020170074. [DOI] [PubMed] [Google Scholar]
- 4.Bergman H, Wichmann T, Karmon B, DeLong MR. The primate subthalamic nucleus. II. Neuronal activity in the MPTP model of parkinsonism. J Neurophysiol. 1994;72:507–520. doi: 10.1152/jn.1994.72.2.507. [DOI] [PubMed] [Google Scholar]
- 5.Bergman H, Raz A, Feingold A, Nini A, Nelken I, Hansel D, Ben-Paz H, Reches A. Physiology of MPTP tremor. Mov Disord. 1998;13:29–34. doi: 10.1002/mds.870131305. [DOI] [PubMed] [Google Scholar]
- 6.Beurrier C, Bioulac B, Hammond C. Slowly inactivating sodium current (I(NaP)) underlies single-spike activity in rat subthalamic neurons. J Neurophysiol. 2000;83:1951–1957. doi: 10.1152/jn.2000.83.4.1951. [DOI] [PubMed] [Google Scholar]
- 7.Bevan MD, Wilson CJ. Mechanisms underlying spontaneous oscillation and rhythmic firing in rat subthalamic neurons. J Neurosci. 1999;19:7617–7628. doi: 10.1523/JNEUROSCI.19-17-07617.1999. [DOI] [PMC free article] [PubMed] [Google Scholar]
- 8.Bevan MD, Wilson CJ, Bolam JP, Magill PJ. Equilibrium potential of GABAA current and implications for rebound burst firing in rat subthalamic neurons in vitro. J Neurophysiol. 2000;83:3169–3172. doi: 10.1152/jn.2000.83.5.3169. [DOI] [PubMed] [Google Scholar]
- 9.Bevan MD, Magill PJ, Hallorth NE, Bolam JP, Wilson CJ (2001) Regulation of the timing and pattern of action potential generation in rat subthalamic neurons in vitro by GABAA IPSPs. J Neurophysiol, in press. [DOI] [PubMed]
- 10.Brown P, Oliviero A, Mazzone P, Insola A, Tonali P, Di Lazzaro V. Dopamine dependency of oscillations between subthalamic nucleus and pallidum in Parkinson's disease. J Neurosci. 2001;21:1033–1038. doi: 10.1523/JNEUROSCI.21-03-01033.2001. [DOI] [PMC free article] [PubMed] [Google Scholar]
- 11.Chesselet MF, Delfs JM. Basal ganglia and movement disorders: an update. Trends Neurosci. 1996;18:417–422. doi: 10.1016/0166-2236(96)10052-7. [DOI] [PubMed] [Google Scholar]
- 12.Cooper AJ, Stanford IM. Physiological and morphological characteristics of three types of rat globus pallidus neurone in vitro. J Physiol (Lond) 2000;527:291–3004. doi: 10.1111/j.1469-7793.2000.t01-1-00291.x. [DOI] [PMC free article] [PubMed] [Google Scholar]
- 13.DeLong MR. Activity of pallidal neurons during movement. J Neurophysiol. 1971;34:414–427. doi: 10.1152/jn.1971.34.3.414. [DOI] [PubMed] [Google Scholar]
- 14.DeLong MR. Primate models of movement disorders of basal ganglia origin. Trends Neurosci. 1990;13:281–285. doi: 10.1016/0166-2236(90)90110-v. [DOI] [PubMed] [Google Scholar]
- 15.Hansel D, Mato G. Existence and stability of persistent states in large neuronal networks. Phys Rev Lett. 2001;86:4175–4178. doi: 10.1103/PhysRevLett.86.4175. [DOI] [PubMed] [Google Scholar]
- 16.Hanson JE, Jaeger D (2002) Short-term plasticity shapes the response to simulated normal and Parkinsonian input patterns in the globus pallidus. J Neurosci, in press. [DOI] [PMC free article] [PubMed]
- 17.Hassani OK, Mouroux M, Féger J. Increased subthalamic neuronal activity after nigral dopamine lesion independent of disinhibition via the globus pallidus. Neuroscience. 1996;72:105–115. doi: 10.1016/0306-4522(95)00535-8. [DOI] [PubMed] [Google Scholar]
- 18.Hazrati LN, Parent A. Convergence of subthalamic and striatal efferents at pallidal level in primates: an anterograde double-labeling study with biocytin and PHA-L. Brain Res. 1992;569:336–340. doi: 10.1016/0006-8993(92)90648-s. [DOI] [PubMed] [Google Scholar]
- 19.Hernandez-Pineda R, Chow A, Amarillo Y, Moreno H, Saganich M, de Miera EV, Hernandez-Cruz A, Rudy B. Kv3.1-Kv3.2 channels underlie a high-voltage-activating component of the delayed rectifier K+ current in projecting neurons from the globus pallidus. J Neurophysiol. 1999;82:1512–1528. doi: 10.1152/jn.1999.82.3.1512. [DOI] [PubMed] [Google Scholar]
- 20.Hurtado JM, Gray CM, Tamas LB, Sigvardt KA. Dynamics of tremor-related oscillations in the human globus pallidus: a single case study. Proc Natl Acad Sci USA. 1999;96:1674–1679. doi: 10.1073/pnas.96.4.1674. [DOI] [PMC free article] [PubMed] [Google Scholar]
- 21.Hurtado JM, Lachaux JP, Beckley DJ, Gray CM, Sigvardt KA. Inter- and intralimb oscillator coupling in parkinsonian tremor. Mov Disord. 2000;15:683–691. doi: 10.1002/1531-8257(200007)15:4<683::aid-mds1013>3.0.co;2-#. [DOI] [PubMed] [Google Scholar]
- 22.Kita H, Kitai ST. Intracellular study of rat globus pallidus neurons: membrane properties and responses to neostriatal, subthalamic and nigral stimulation. Brain Res. 1991;564:296–305. doi: 10.1016/0006-8993(91)91466-e. [DOI] [PubMed] [Google Scholar]
- 23.Kitai ST, Kita H. Anatomy and physiology of the subthalamic nucleus: a driving force of the basal ganglia. In: Carpenter MB, Jayaraman A, editors. The basal ganglia II: structure and function; current concepts. Plenum; New York: 1987. pp. 357–373. [Google Scholar]
- 24.Levy R, Hazrati L-N, Herrero M-T, Vila M, Hassani O-K, Mouroux M, Ruberg M, Asensi H, Agid Y, Feger J, Obeso JA, Parent A, Hirsch EC. Re-evaluation of the functional anatomy of the basal ganglia in normal and parkinsonian states. Neuroscience. 1997;76:335–343. doi: 10.1016/s0306-4522(96)00409-5. [DOI] [PubMed] [Google Scholar]
- 25.Magill PJ, Bolam JP, Bevan MD. Relationship of activity in the subthalamic nucleus-globus pallidus network to cortical electroencephalogram. J Neurosci. 2000;20:820–833. doi: 10.1523/JNEUROSCI.20-02-00820.2000. [DOI] [PMC free article] [PubMed] [Google Scholar]
- 26.Magnin M, Morel A, Jeanmonod D. Single-unit analysis of the pallidum, thalamus, and subthalamic nucleus in parkinsonian patients. Neuroscience. 2000;96:549–564. doi: 10.1016/s0306-4522(99)00583-7. [DOI] [PubMed] [Google Scholar]
- 27.Nambu A, Llinãs R. Electrophysiology of globus pallidus neurons in vitro. J Neurophysiol. 1994;72:1127–1139. doi: 10.1152/jn.1994.72.3.1127. [DOI] [PubMed] [Google Scholar]
- 28.Ni Z, Bouali-Benazzouz R, Gao D, Benabid A, Benazzouz A. Changes in the firing pattern of globus pallidus neurons after the degeneration of nigrostriatal pathway are mediated by the subthalamic nucleus in rat. Eur J Neurosci. 2000;12:4338–4344. [PubMed] [Google Scholar]
- 29.Nini A, Feingold A, Slovin H, Bergman H. Neurons in the globus pallidus do not show correlated activity in the normal monkey, but phase-locked oscillations appear in the MPTP model of parkinsonism. J Neurophysiol. 1995;74:1800–1805. doi: 10.1152/jn.1995.74.4.1800. [DOI] [PubMed] [Google Scholar]
- 30.Obeso J, Rodriguez M, DeLong MR. Basal ganglia pathophysiology: a critical review. Adv Neurol. 1997;74:3–18. [PubMed] [Google Scholar]
- 31.Ogura M, Kita H. Dynorphin exerts both postsynaptic and presynaptic effects in the globus pallidus of the rat. J Neurophysiol. 2000;83:3366–3376. doi: 10.1152/jn.2000.83.6.3366. [DOI] [PubMed] [Google Scholar]
- 32.Parent A, Cicchetti F. The current model of basal ganglia organization under scrutiny. Mov Disord. 1998;13:199–202. doi: 10.1002/mds.870130202. [DOI] [PubMed] [Google Scholar]
- 33.Parent A, Hazrati L-N. Functional anatomy of the basal ganglia. II. The place of subthalamic nucleus and external pallidum in basal ganglia circuitry. Brain Res Rev. 1995;20:128–154. doi: 10.1016/0165-0173(94)00008-d. [DOI] [PubMed] [Google Scholar]
- 34.Plenz D, Kitai S. A basal ganglia pacemaker formed by the subthalamic nucleus and external globus pallidus. Nature. 1999;400:677–682. doi: 10.1038/23281. [DOI] [PubMed] [Google Scholar]
- 35.Raz A, Feingold A, Zelanskaya V, Vaadia E, Bergman H. Neuronal synchronization of tonically active neurons in the striatum of normal and parkinsonian primates. J Neurophysiol. 1996;76:2083–288. doi: 10.1152/jn.1996.76.3.2083. [DOI] [PubMed] [Google Scholar]
- 36.Raz A, Vaadia E, Bergman H. Firing patterns and correlations of spontaneous discharge of pallidal neurons in the normal and tremulous 1-methyl-4-phenyl-1,2,3,6 tetrahydropyridine vervet model of parkinsonism. J Neurosci. 2000;20:8559–8571. doi: 10.1523/JNEUROSCI.20-22-08559.2000. [DOI] [PMC free article] [PubMed] [Google Scholar]
- 37.Rush ME, Rinzel J. The potassium A-current, low firing rates and rebound excitation in Hodgkin–Huxley models. Bull Math Biol. 1995;57:899–929. doi: 10.1007/BF02458299. [DOI] [PubMed] [Google Scholar]
- 38.Sato F, Parent M, Levesque M, Parent A. Axonal branching pattern of neurons of the subthalamic nucleus in primates. J Comp Neurol. 2000;424:142–152. doi: 10.1002/1096-9861(20000814)424:1<142::aid-cne10>3.0.co;2-8. [DOI] [PubMed] [Google Scholar]
- 39.Shink E, Bevan MD, Bolam JP, Smith Y. The subthalamic nucleus and the external pallidum: two tightly interconnected structures that control the output of the basal ganglia in the monkey. Neuroscience. 1996;73:335–357. doi: 10.1016/0306-4522(96)00022-x. [DOI] [PubMed] [Google Scholar]
- 40.Song WJ, Baba Y, Otsuka T, Murakami F. Characterization of Ca2+ channels in rat subthalamic neurons. J Neurophysiol. 2000;84:2630–2637. doi: 10.1152/jn.2000.84.5.2630. [DOI] [PubMed] [Google Scholar]
- 41.Stanford IM, Cooper AJ. Presynaptic μ and opioid receptor modulation of GABAA IPSCs in the rat globus pallidus in vitro. J Neurosci. 1999;19:4796–4803. doi: 10.1523/JNEUROSCI.19-12-04796.1999. [DOI] [PMC free article] [PubMed] [Google Scholar]
- 42.Stefani A, Spadoni F, Bernardi G. Group I mGluRs modulate calcium currents in rat GP: functional implications. Synapse. 1998;30:424–432. doi: 10.1002/(SICI)1098-2396(199812)30:4<424::AID-SYN9>3.0.CO;2-9. [DOI] [PubMed] [Google Scholar]
- 43.Surmeier DJ, Seno N, Kitai ST. Acutely isolated neurons of the rat globus pallidus exhibit four types of high-voltage activated Ca2+ current. J Neurophysiol. 1994;71:1272–1280. doi: 10.1152/jn.1994.71.3.1272. [DOI] [PubMed] [Google Scholar]
- 44.Urbain N, Gervasoni D, Souliere F, Lobo L, Rentero N, Windels F, Astier B, Savasta M, Fort P, Renaud B, Luppi P, Chouvet G. Unrelated course of subthalamic nucleus and globus pallidus neuronal activities across vigilance states in the rat. Eur J Neurosci. 2000;12:3361–3374. doi: 10.1046/j.1460-9568.2000.00199.x. [DOI] [PubMed] [Google Scholar]
- 45.Wichmann T, DeLong MR. Functional and pathophysiological models of the basal ganglia. Curr Opin Neurobiol. 1996;6:751–758. doi: 10.1016/s0959-4388(96)80024-9. [DOI] [PubMed] [Google Scholar]