

Abstract
Single-unit recordings were made in the dorsal lateral geniculate nucleus (LGN) and visual cortex of kittens that were 4–13 weeks of age. Responses to visual stimuli were analyzed to determine the relationship between two related facets of the behaviors of the cells: direction selectivity (DS) and timing. DS depends on timing differences within the receptive field. Cortical DS was present at all ages, but its temporal frequency tuning changed. In kittens, DS was more common at high (∼4 Hz) than low (∼1 Hz) temporal frequencies. This is in contrast to adults, in which DS is tuned to low frequencies, more common at 1 Hz than at 4 Hz (Saul and Humphrey, 1992a). In adult cats, the LGN provides the cortex with a wide range of timings that are also observable in cortical receptive fields (Saul and Humphrey, 1990,1992b; Alonso et al., 2001). In kittens, LGN and cortical timing were immature. Most cells showed long-latency sustained responses. At low temporal frequencies, the variance in timing was small, but at higher frequencies, all timings were well represented. The timing data thus matched the temporal frequency tuning of DS. Kittens show DS at high temporal frequencies because of the abundance of inputs with different timing at high frequencies. As cells in the LGN mature, more low-frequency timing differences become available to the cortex, allowing DS at low frequencies to become possible for more cortical cells.
Keywords: direction selectivity, visual cortex, lateral geniculate nucleus, response timing, temporal frequency, postnatal development, lagged cells, spatiotemporal receptive fields
One of the striking findings ofHubel and Wiesel (1959, 1962) was that many visual cortical neurons are direction selective. Approximately 70% of simple and complex cells respond at least twice as well to one direction of motion than to the opposite direction (Pasternak et al., 1985). The mechanisms underlying direction selectivity (DS) remained unclear for many years.Hubel and Wiesel's (1959) proposal that directionality could be attributed to synergism or, by extension, antagonism between neighboring regions in simple cells was discounted because it was couched in terms of ON and OFF zones (Heggelund, 1984; Yamane et al., 1985). Once appreciation for the full range of timing found in visual receptive fields grew beyond the ON/OFF dichotomy, Hubel and Wiesel's proposal was proved correct. Movshon et al. (1978) showed that DS is linked to the arrangement of response timing across the receptive field. The preferred direction of motion can be predicted on the basis of how timing changes gradually across space (Reid et al., 1987; McLean and Palmer, 1989; Albrecht and Geisler, 1991; Tolhurst and Dean, 1991;DeAngelis et al., 1993b; McLean et al., 1994; Murthy et al., 1998).
Where do these different response timings arise? We showed that the lateral geniculate nucleus (LGN) provides a broad range of timing to the cortex (Saul and Humphrey, 1990). This input timing is evident in cortical receptive fields (Saul and Humphrey, 1992b). Cat cortical DS is tuned to low temporal frequencies, suggesting that it depends on interactions between lagged and nonlagged geniculate inputs, which differ in timing at low but not high frequencies (Saul and Humphrey, 1992a). The present study extends this finding: the temporal frequency tuning of DS in cortical cells is correlated with the timing of LGN cells as each changes during development.
Mastronarde (1987a) first recognized the division of LGN cells into lagged and nonlagged classes. Cai et al. (1997) recorded from lagged and nonlagged cells in kittens, and we show additional examples here. We also confirm that kitten LGN cells differ from those in adult cats. In kittens, lagged and nonlagged cells often had similar responses, and LGN timing was relatively homogeneous.
If DS depends on LGN timing, how do the developmental changes in the afferents affect the cortical responses? Hubel and Wiesel (1963) found that DS was present in young kittens without visual experience (Pettigrew, 1974; Blakemore and Van Sluyters, 1975; Bonds, 1979; Albus and Wolf, 1984). How do these cells obtain the inputs that provide the timing differences needed for DS? The present study reconciles the fact that DS is prevalent in young kittens with the thesis that it depends on LGN timing differences that seem to develop late.
We found that DS is present at all ages but varies with age in a way that sheds light on the role of LGN response timing in establishing DS: the temporal frequency tuning of DS matches the distribution of response timing in the LGN and cortex at all ages.
Preliminary results have been presented previously in abstract form (Saul, 1997; Saul and Feidler, 2000).
MATERIALS AND METHODS
Data were collected from 41 kittens obtained from 12 litters. Their ages ranged from 33 to 94 d, and weights ranged from 350 to 2000 gm. Additional data are shown from adult cats recorded in previous studies (Saul and Humphrey, 1990, 1992a,b; Saul, 1995, 1999; Humphrey and Saul, 1998; Humphrey et al., 1998).
Kittens were anesthetized with 2.5% halothane in nitrous oxide and oxygen (60:40). A radial vein was cannulated for delivery of drugs and fluids, and an endotracheal tube was inserted for artificial respiration. The animal was placed in a stereotaxic apparatus, paralysis was induced with 20–40 mg of gallamine triethiodide, and a pressure-controlled ventilator (SAR830/P; CWE, Ardmore, PA) was adjusted to maintain end-tidal CO2 at 4%. In older kittens, a volume-controlled pump (Harvard 665; Harvard Apparatus, Cambridge, MA) was used instead. Phenylephrine and atropine were applied to the eyes to retract the nictitating membranes and dilate the pupils, and gas-permeable contact lenses with a +2D correction were placed on the eyes.
Expired CO2 concentration, rectal temperature, heart rate, and EEG were monitored continuously throughout the experiment. Halothane levels were adjusted to maintain strong EEG synchronization during surgery and mild synchronization during recording; the power in the EEG was kept at <5 Hz. No differences in EEG patterns were apparent in kittens of different ages, nor did the limited range in the level of synchronization show any obvious correlation with visual response properties.
A craniotomy was made above either the left LGN or visual cortical area 17. The skull was suspended nontraumatically from a post cemented to skull screws, and the ear bars were removed. All wounds and pressure points were treated with 2% lidocaine. At the end of the experiment, the animal was killed with an overdose of barbiturate (Nembutal). In experiments in which recordings had been made from the cortex, kittens were perfused through the heart with aldehydes, and the brain was blocked in the plane of the penetration. Frozen sections (100 μm) were processed to permit reconstruction of electrode tracks and counterstained with cresyl violet to identify laminar borders (Saul and Humphrey, 1992b).
Throughout the experiment, an intravenous infusion of 5 mg · kg−1 · hr−1gallamine triethiodide and 0.7 mg · kg−1 · hr−1d-tubocurarine chloride (Sigma, St. Louis, MO) in 5% dextrose and lactated Ringer's solution was delivered at a rate of 3–10 ml/hr to prevent eye movements and maintain hydration. The optic disks were projected onto a tangent screen when possible, or two observers estimated the disk positions by viewing from the tangent screen through an ophthalmoscope. The representation of the optical axis was estimated as lying 17° central and 8° inferior to the projection of the optic disks (Milleret et al., 1988). Refraction generally determined that an approximately +4D correction was necessary to focus at 57 cm; this correction was provided by a trial lens mounted in front of the eye. The eyes were periodically flushed with 1.5% saline.
Insulated tungsten electrodes were used to locate the LGN (which varied around A5 L8) in an initial penetration. Extracellular recordings in the A layers were made using glass micropipettes filled with 0.2m KCl in Tris buffer that had impedances of 50–100 MΩ. Single units were easily isolated with these electrodes, which have been shown previously to sample small as well as large cells in the adult cat LGN (Humphrey and Weller, 1988a,b). LGN penetrations progressed through the A layers and into the C layers, at which point the electrode was withdrawn. We usually sampled 3–10 cells per penetration. For cortical recording, 10% HRP (Sigma) was added to the electrolyte to mark the electrode track (Mullikin et al., 1984; Simons and Land, 1987; Saul and Humphrey, 1992b). Cortical penetrations traversed 4–10 mm down the medial bank of the postlateral gyrus. Most of these penetrations ran approximately parallel to the cortical surface, facilitating determination of laminar locations of the 10–30 cells recorded per penetration.
Receptive fields were hand-plotted on the tangent screen. For LGN cells, we determined the center sign (ON or OFF), receptive field center borders, surround strength (stronger in X than Y cells), responsiveness to large stimuli moving rapidly (more prominent in Y cells), and response timing to moving bars (to distinguish lagged and nonlagged cells) (Mastronarde, 1987a) in an initial subjective assessment. For cortical cells, receptive fields were plotted for both eyes when possible, and we assessed ocular dominance, orientation preference and selectivity, DS, and end-stopping (to help optimize subsequently presented stimuli). Cortical cells were also classified as simple or complex on the basis of segregation of ON and OFF responses. A Tektronix (Beaverton, OR) 608 monitor set to a luminance of 15 cd/m2 was then positioned 57 cm in front of the dominant eye, with the other eye occluded, and the cell was tested quantitatively. Stimuli were controlled by an LSI-11 computer, slaved to a Macintosh running Igor Pro (WaveMetrics, Lake Oswego, OR), that drove a Picasso image synthesizer (Innisfree, Cambridge, MA). Data collection was synchronized to the stimulus, with spikes timed to the nearest millisecond, although stimuli were presented at a 200 Hz frame rate, effectively limiting our temporal resolution to 5 msec.
Two primary types of data will be presented: timing and DS. Response timing was determined primarily as described previously (Saul and Humphrey, 1990, 1992b; Humphrey and Saul, 1998; Humphrey et al., 1998). Sinusoidally luminance-modulated stimuli (spots for LGN cells, bars for simple cells) were presented at a range of temporal frequencies (typically 0.25–16 Hz) at a high contrast (0.4). Simple cells were tested at each of a series of positions across their receptive fields. Responses were averaged over all of the cycles in 4 sec trials to produce histograms that were Fourier-analyzed, yielding first harmonic amplitude and phase values (phase was undefined if amplitude was 0). Phase was measured in cycles (c) relative to the stimulus luminance peak, with increasing phase corresponding to increasing phase lags. These values were then averaged over the 5–10 trials.
The phase versus temporal frequency data were fit with lines, yielding two parameters: the slope, which will be referred to as latency, and the intercept, referred to as absolute phase. These fits were computed via linear regression after weighting the phase values by the square root of the amplitude (normalized by the mean of those square roots) and the reciprocal of the SE of phase. Points at which the amplitude was 0 and phase was undefined were excluded. When testing cortical receptive fields, some positions did not give reliable responses. These positions were defined by a series of criteria (Saul and Humphrey, 1992b): latency values were outside the range of 40–300 msec, the SD of latency was >20 msec or greater than one-quarter of the latency value, or the SD of absolute phase was >0.03 c. These restrictions ensured both that the underlying data were reliable and that the linear fits were good. Cells from kittens and adults had similar degrees of reliability. For LGN cells and for reliable positions from simple cells, timing was characterized primarily by these two parameters.
Absolute phase indicates which point in the stimulus cycle evokes excitatory responses (e.g., peak or increasing brightness or darkness). Absolute phase values could range over a full cycle, with ON responses occupying the interval from −0.25 to +0.25 c and OFF responses occupying the interval from 0.25 to 0.75 c. We often equate ON- and OFF-center LGN cells, and similarly ON and OFF zones in cortical receptive fields, by subtracting a half-cycle from the OFF values, so that absolute phase ranges between −0.25 and +0.25 c. Negative absolute phase values indicate that responses led the bright (in the case of ON) or dark (in the case of OFF) phase of the stimulus at low temporal frequencies, and positive absolute phase values indicate that responses lagged the stimulus at low frequencies. Absolute phase corresponds to qualitative response timing characterizations as follows: transient nonlagged responses tend to have strong absolute phase leads (near −0.25 c); sustained nonlagged responses have small absolute phase leads (just <0 c); sustained lagged responses have small absolute phase lags (just >0 c); and transient lagged responses have strong absolute phase lags (near 0.25 c).
Latency reflects processes that delay responses, including phototransduction, synaptic processing, conduction delays, and other integrative actions. The important aspect of this quantity for the present study is that latency is sensitive to response phase at high temporal frequencies. In general, latency variations across cells confer temporal frequency-dependent changes in relative timing. Cells that have similar absolute phase values but different latencies respond at approximately the same time at low frequencies, but their phase values differ by approximately one-quarter cycle at higher frequencies. However, cells with both different absolute phase values and different latencies, such as lagged and nonlagged cells, respond at different times at low frequencies but not at higher frequencies. By different timing, we mean differences of approximately one-quarter cycle; similar timing means differences of approximately zero or half cycles.
The other measurements described below are used to characterize DS in cortical cells. Sinusoidal gratings of optimal spatial frequency (determined quantitatively through tuning curves compiled for both directions over a three octave range) drifted in each direction at a series of temporal frequencies (typically from 0.25 to 16 Hz). Histograms of the response in one cycle, averaged over all of the cycles in a trial, yielded an amplitude value. For complex cells, this amplitude was the DC, or average firing rate, and for simple cells, it was the first harmonic response amplitude. Means and SEs over the 5–10 trials were computed, and DS was defined by the standard ratio of the difference to the sum of the amplitudes in the two directions. Cells were considered to be direction selective when this measure of DS was >0.33 (so that the response amplitude in the preferred direction was at least twice as strong as the response amplitude in the nonpreferred direction), along with a criterion that the t score comparing these amplitudes was >2 (Humphrey and Saul, 1998). We also measured orientation tuning with gratings of near-optimal spatial and temporal frequencies and fit the amplitude data over 360° with a double Gaussian function that matched the peaks separated by 180°. A measure of DS (used only in Fig. 1) was derived from the amplitudes of the two peaks.
Fig. 1.
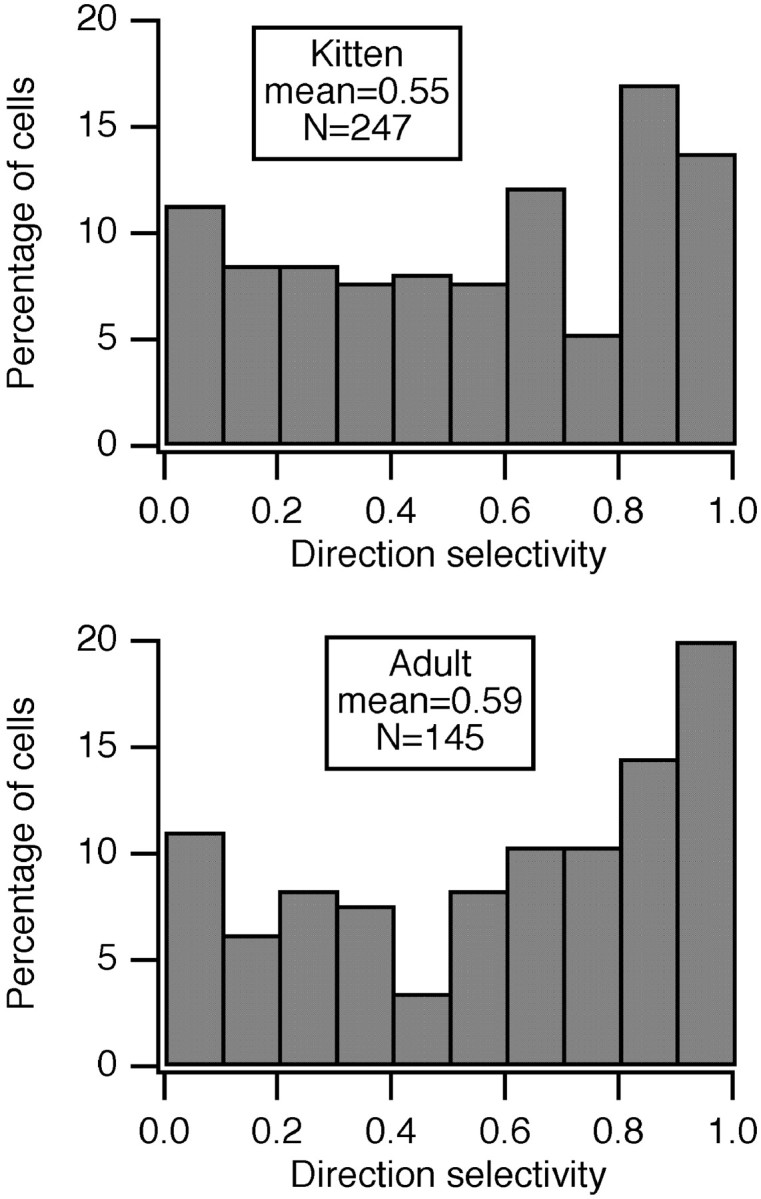
Distribution of DS in area 17 neurons did not change with age. Orientation tuning was determined across 360° at the optimal spatial and temporal frequency, and Gaussian functions were fit to the tuning in each direction. From the peaks of these Gaussian functions, the ratio of the difference to the sum was taken as the DS index shown here.
Mean values in Results are given with their SEs and sample sizes.
RESULTS
Extracellular recordings were obtained from 194 LGN cells and 271 area 17 cortical cells in kittens aged 33–94 d. Additional data from 235 LGN cells and 349 cortical cells in normally reared adult cats recorded in previous studies (Saul and Humphrey, 1990, 1992a,b; Saul, 1995, 1999; Humphrey and Saul, 1998; Humphrey et al., 1998) are included for comparison. For simplicity, we pool the kitten data in this report. Temporal response properties matured slowly throughout the age range studied here, but the differences between kittens of various ages were in most cases less than those between kittens and adults. We therefore emphasize that dichotomy and include in this report only limited examples of progressive development in kittens, rather than describing these developmental changes in detail. By concentrating on the dichotomy between kittens and adult cats, the net changes are clearer, although these changes are a result of smaller steps that probably accumulate over several months.
We first show how the temporal frequency tuning of DS changes with age. We then show that response timing in the LGN and cortex changes in parallel with the tuning of DS, thereby providing additional evidence that LGN timing is key to establishing cortical DS.
Direction selectivity
Cortical DS was common at all ages. Figure 1 presents histograms showing the percentage of cells with different degrees of DS for kittens and adult cats. Approximately 70% of the cells were direction selective (DS > 0.33) at all ages (67, 64, 64, and 72% at 33–40 d, 41–50 d, 51–94 d, and in adults, respectively).
More subtle changes did occur, however. Figure2 illustrates temporal frequency tuning curves for each direction of motion from several cells. The cell in Figure 2A was not direction selective, but the others were. The cell in Figure 2B demonstrates one of the typical behaviors seen in kittens. In the preferred direction, the cell was tuned to ∼3 Hz. The nonpreferred direction elicited weaker but significant responses and was tuned to ∼1 Hz. This cell was direction selective at >1 Hz, and its DS was strongest at 4 Hz. Other cells showing this sort of behavior are illustrated in Figure2C,D. Such a pattern is rarely seen in the adult cortex. In Figure 2E, a cell from an older kitten shows the pattern previously noted as typical for adult cats (Saul and Humphrey, 1992a): the preferred direction peaked at 2 Hz, whereas the nonpreferred direction peaked at 4 Hz, and DS was strongest at <4 Hz. Figure 2F shows a cell that was completely direction selective. Such cells could be found at all ages. The population was heterogeneous, and these examples are typical only in the sense that they characterize the key aspects of the population behavior illustrated below.
Fig. 2.
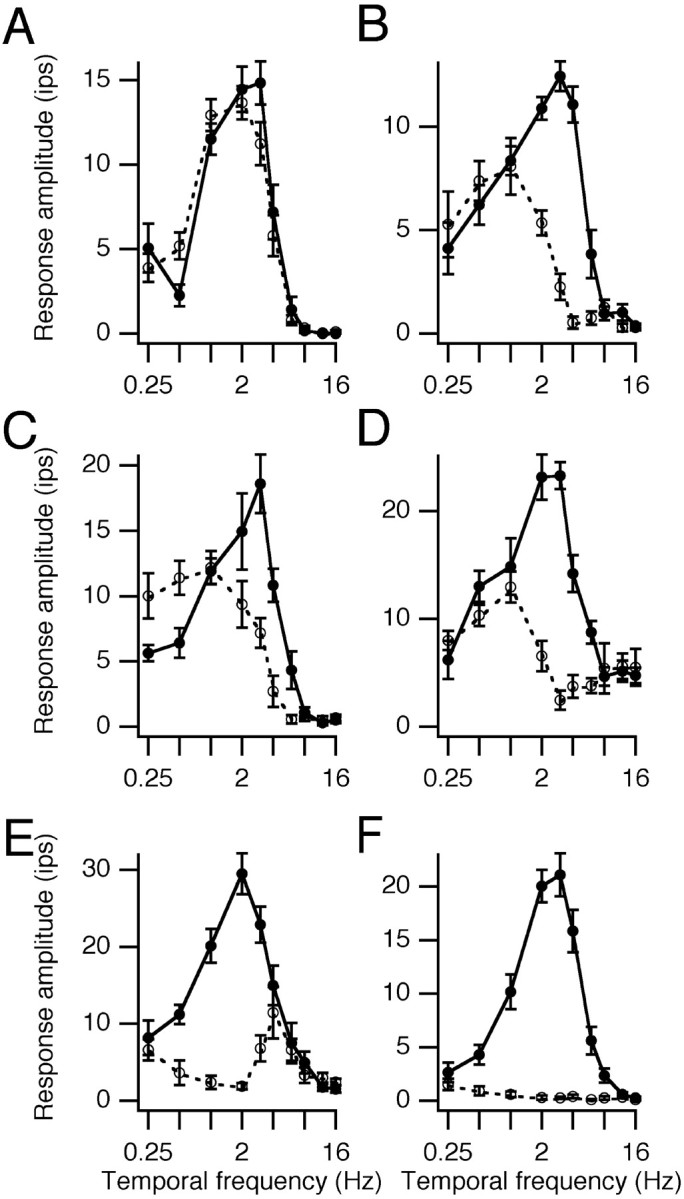
Temporal frequency tuning in each direction of motion is shown for six cortical cells. Amplitude is the first harmonic response for simple cells and the DC response for the complex cell.Solid lines are preferred directions and dashed lines are nonpreferred directions. Error barsare SEMs. A, Layer 5A simple cell from a 46-d-old kitten. B, Layer 2/3 simple cell from a 63-d-old kitten.C, Layer 5 simple cell from a 36-d-old kitten.D, Layer 4/5 complex cell from a 42-d-old kitten.E, Layer 4/5 simple cell from an 83-d-old kitten.F, Layer 4 simple cell from a 67-d-old kitten.
We quantified the population differences in the temporal frequency tuning of DS in several ways. First, the DS at each temporal frequency point was averaged across cells. Figure3A shows this measure for kittens and for adults. Compared with the adults, kitten cells were more direction selective at high temporal frequencies and less direction selective at low frequencies, with a peak at 2–3 Hz rather than at 0.5–1 Hz. Figure 3B shows these same data but with the kittens broken into three groups. The only significant differences among these data were seen between the 33- to 40-d-old and 41- to 50-d-old groups at 0.25 and 12 Hz, between the 33- to 40-d-old and 51- to 94-d-old groups at 1 and 2 Hz, and between the 41- to 50-d-old and 51- to 94-d-old groups at 1 Hz (t test; p < 0.01). The oldest kittens may have shown increased DS at lower frequencies relative to the youngest kittens, but these data are inconclusive.
Fig. 3.

Temporal frequency tuning of DS across the population. A, Values of DS at each temporal frequency were averaged across cells in each age group. Error bars represent SEMs. DS values could be negative, because a preferred direction was designated on the basis of the average responses, and the DS at very high temporal frequencies was in fact slightly negative in some cases. The number of cells was 216 and 54 for kittens and adults, respectively. B, The kitten data in A are broken down into three groups. The number of cells was 48, 43, and 125 for 33- to 40-d-old, 41- to 50-d-old, and 51- to 94-d-old kittens, respectively. C, Cells were classified as direction selective or not at each temporal frequency based on a DS index of >0.33 and a t score of >2. Numbers of cells are the same as in A. Points marked with asterisks were significantly different at the 0.001 level based on the proportions test. D, The breakdown of the kitten data in C into the three separate age groups.
A convenient comparison can be made between DS at 1 Hz and at 4 Hz. Compared with adults, neurons in kittens tended to be more direction selective at 4 Hz and less direction selective at 1 Hz. The differences between the average DS at 1 Hz and at 4 Hz shown in Figure3A were −0.08 and 0.12 for kittens and adults, respectively. We also examined this difference on a cell-by-cell basis. For those cells that showed DS at either 1 or 4 Hz, based on at score of >2 at either frequency, we subtracted the value of DS at 4 Hz from the value at 1 Hz. The difference between the DS at 1 Hz and at 4 Hz was −0.08 ± 0.03 (n = 166) and 0.14 ± 0.05 (n = 36) for kittens and for adults, respectively (p < 0.001; t test). Similar comparisons across kittens of differing ages did not reach significance.
A second way to look at the temporal frequency tuning of DS is to plot the proportion of cells that are direction selective at each temporal frequency. For this purpose, direction selectivity is defined as DS > 0.33 and t score > 2. Figure 3C shows this measure of the temporal frequency tuning of DS for kittens and for adults. The values differ significantly at 1, 3, and 4 Hz (test of proportions, p < 0.001). Kitten DS is clearly tuned to higher temporal frequencies. The only significant differences seen across kittens, shown in Figure 3D, were at 0.25 Hz for 33- to 40-d-old versus 41- to 50-d-old kittens and at 1 Hz for 41- to 50-d-old versus 51- to 94-d-old kittens. The ratio of 1–4 Hz proportions was 0.89 for kittens (1.00, 0.64, and 0.94 for kittens aged 33–40 d, 41–50 d, and 51–94 d, respectively) and 2.04 for adults.
As was noted for the individual examples in Figure 2, the optimal temporal frequencies in the preferred and nonpreferred directions provide another way to characterize the tuning of DS. Figure4 plots the preferred versus the nonpreferred optimal temporal frequency for cells in kittens and adults. The preferred direction was chosen on the basis of the larger response averaged across all temporal frequencies. As shown previously (Saul and Humphrey, 1992a), adults tend to have lower optimal temporal frequencies in the preferred direction. Kittens at all ages tested here have the opposite tendency. Cells with optimal temporal frequency in the preferred direction that was more than an octave higher than in the nonpreferred direction made up 44, 34, 42, and 9% of the population in the 33–40 d, 41–50 d, 51–94 d, and adult groups, respectively. Preferred direction optimal frequencies are similar, centered around 2 Hz. The distribution of nonpreferred optimal frequencies changes with development. As illustrated by the individual examples in Figure2B–D, in kittens, responses in the nonpreferred direction are more often suppressed at higher frequencies than at lower frequencies. In adults, the reverse is true (Fig.2E).
Fig. 4.

Optimal temporal frequency in each direction. A difference of Gaussians fit was made to tuning curves. Cells for which the fit was inadequate for the nonpreferred direction, because insufficient spikes were evoked from strongly and broadly direction-selective cells, were excluded. Simple cells are shown withcircles; complex cells are shown withsquares. Histograms above and to theright of each plot show the distribution of optimal frequencies for each direction. Histograms across the diagonals (dotted lines) show the distribution of distance between preferred and nonpreferred optimal frequencies. These distributions differed between kittens and adults (p < 0.001; t test) and between each of the groups of kittens and the adults, but not between any of the kitten groups. Sample sizes were 154 and 116 for kittens and adults, respectively. Geometric means, in Hertz, for optimal temporal frequencies in the preferred and nonpreferred directions for each age group are (1.9, 1.0) and (2.0, 2.9), respectively. For 33- to 40-d-old (n = 32), 41- to 50-d-old (n = 33), and 51- to 94-d-old (n = 89) kittens, respectively, the values were (1.9, 0.9), (1.9, 1.0), and (1.9, 1.0), respectively. TF, Temporal frequency.
DS in kittens tends to be stronger at 4 Hz than at 1 Hz, whereas in adults, DS is stronger at 1 Hz than at 4 Hz. We now turn to an explanation of the likely basis of this change.
Timing
We will show that the relative lack of DS at low temporal frequencies in kittens correlates with a decreased variance in LGN and cortical timing at those frequencies. Furthermore, the presence of strong DS at higher frequencies correlates with a large variance of timing at those frequencies. In kittens, timing differences are more common at 4 Hz than at 1 Hz. In adults, timing differences are more common at 1 Hz than at 4 Hz. This provides evidence for the hypothesis that DS in cortical cells depends on the range of timing provided by the LGN inputs.
To clarify how the results below relate to the temporal frequency tuning of DS, Figure 5 illustrates examples of how input timing would produce different DS tunings. If a cortical cell received two inputs with spatially separated receptive fields, the relative timing of those inputs would determine the DS of the cortical cell as shown. Maximal DS is achieved for a phase difference of 0.25 c (Reichardt, 1961; Watson and Ahumada, 1985). Phase differences close to 0 or 0.5 c would not produce DS.
Fig. 5.

Linking timing to DS. The timing of hypothetical inputs to a cortical cell are schematized for kittens and adult cats. Two typical inputs are chosen in each case, characterized by the slope and intercept of their phase versus temporal frequency plots. The phase difference between the two inputs would determine the DS of the cortical cell as shown. A, In kittens, inputs typically differ in latency but not absolute phase. Here, the inputs are only 0.05 c apart at 0 Hz, but their latency difference is 60 msec. This would create DS at 4 Hz but not at 1 Hz. B, In adults, one readily finds lagged and nonlagged cells that differ in both latency and absolute phase. Here, the inputs are separated by 0.3 c at 0 Hz, but because of their 60 msec latency difference, this phase difference disappears by 5 Hz. The hypothetical cortical cell would be direction selective at 1 Hz but not at 4 Hz.L, Latency; TF, temporal frequency; ϕ, phase; ϕ0, absolute phase.
Figure 5A schematizes that what will be shown below is typical for kittens. The two inputs have response phases that differ by ∼0.25 c primarily at high temporal frequencies (∼3–4 Hz). Both inputs have OFF-center sustained responses, with absolute phase (intercept) values just less than 0.5 c. One input (Fig.5A, dashed line) has a latency (slope) of 80 msec and the other (Fig. 5A, solid line) has a latency of 140 msec. The phase difference as a function of temporal frequency therefore has a small intercept of 0.05 c and a slope of 60 msec. This theoretical cortical cell would be direction selective between 2 Hz and just less than 5 Hz, similar to the actual cells illustrated in Figure2B–D.
Figure 5B illustrates the situation in adults, in which inputs can be readily found that differ in phase at low frequencies. Here, one input (Fig. 5B, dashed line) has an absolute phase value of 0.1 c and a latency of 130 msec, typical of lagged LGN cells. The other input (Fig.5B, solid line) has an absolute phase of 0.4 c and a latency of 70 msec, typical of nonlagged LGN cells. At low frequencies, the resultant phase difference is close to 0.25 c and would produce direction-selective responses. DS would disappear at higher frequencies, however, as the timing of the two inputs becomes similar.
Examples of responses from four OFF-center kitten LGN cells are given in Figure 6. Responses to three types of stimuli are shown: a four-part flashing spot, sparse noise, and sinusoidally modulated spots. The cells in Figure6A–D, were from young kittens. The gray trace in Figure 6A shows the response of a cell from a 33-d-old kitten. It had a long half-rise latency of 183 msec, a somewhat sustained response that fell off slowly while the spot remained dark and then decayed rapidly at offset, with a half-fall latency of 44 msec. The cell from a 35-d-old kitten shown with theblack trace had an even slower response, with a half-rise latency of 300 msec. This cell gave an anomalous offset discharge (the peak after 3 sec) and had a long half-fall latency of 101 msec. The space-time maps for these two cells, in Figure 6B,C, resemble each other. The receptive field centers (dotted contours representing dark-excitatory responses for these off-center cells) were extended in both space and time. Weak secondary inhibition (solid contours near 0° and later than 400 msec) was present in both cases. The cell in Figure 6Cshowed weak early inhibition (solid contour preceding the dark-excitatory response). The timing measurements obtained with sinusoidally modulated spots shown in Figure 6D were nearly identical for these two cells. The cells had long latencies (234 msec for the cell in Fig. 6B; 202 msec for the cell in Fig. 6C) and small absolute phase leads (−0.08 c and −0.03 c for the cells in Fig. 6B,C, respectively). These cells had almost identical amplitude tuning (data not shown), peaking at 1 Hz and responding poorly beyond 4 Hz.
Fig. 6.

Responses from four OFF-center LGN X cells.A–D, Two relatively immature cells from a 33-d-old kitten (gray traces in A andD, map in B) and from a 35-d-old kitten (black traces and map inC). A, Poststimulus time histograms built up from 100 cycles of flashing spots, smoothed with a Gaussian function of 10 msec half-width. The luminance waveform is shown at thebottom and stepped between 25, 15, and 5 cd/m2. Histogram heights were normalized. Thegray histogram peaked at 20 impulses/sec (ips) and theblack histogram peaked at 50 ips. Latencies were measured from spot onset (at 2 sec) to 50% maximal firing (half-rise) and from spot offset (at 3 sec) to the point 50% below the average firing rate during the 100 msec before offset (half-fall).B, Space–time map derived from sparse noise stimulation with a 0.3 × 5° bar at 32 positions across 4°. Each dark or bright bar was repeatedly presented for 40 msec exposures over a total run length of 480 sec. The pseudorandom stimulus was reverse correlated with the spike train, the dark map was subtracted from the bright map, and negative values are shown in this contour map with dotted lines. For these off-center cells, dotted contours are interpreted as representing dark excitation, andsolid contours represent dark inhibition. Data were slightly smoothed in the frequency domain by low-pass filtering with a Gaussian function of half-widths 32 Hz and 6 cycles/°.C, Space–time map from the cell shown with black traces in A and D. Bars were 0.5 × 6°, presented for 1120 sec. D, Phase values from responses to sinusoidally modulated stationary spots. At each temporal frequency, 16 trials of 4 sec each were presented randomly interleaved, and the first harmonic response was computed for each trial. These responses were averaged over the 16 trials, and these means and SEs are shown. Both cells had high-frequency cutoffs of ∼6 Hz. Dashed lines show weighted linear regressions to the phase data. E–H, Responses from two relatively mature cells. The format is parallel to that of A–D. Thegray traces and map in Fshow a cell from a 62-d-old kitten; the black traces andmap in G are from a cell in a 90-d-old kitten. E, The gray trace peaked at 200 ips, and the black trace peaked at 40 ips.F, Bars were 0.3 × 3°, presented for 1632 sec over 3°. G, Bars were 0.3 × 3°, presented for 320 sec over 4°. H, These cells both responded out to ∼16 Hz.
These two immature cells had much longer latencies than are seen for any adult nonlagged cells (Saul and Humphrey, 1990) (Fig.7B). However, neither showed the strong early inhibition or absolute phase lag that mark adult lagged cells. Many adult nonlagged cells have transient responses, in which firing is cut off after an initial excitatory phase by inhibitory processes; as noted, these immature cells showed only weak secondary inhibition. Many cells in kittens behaved like these two cells, with responses extended in time that were not subject to strong suppressive modulation. We caution that suppression could exist but would be invisible to extracellular recording in the absence of background activity (i.e., at spot onset in Fig. 6A at 2 sec, compare the black trace in E), which might have made it difficult to see early inhibition in lagged cells. That caution does not apply to strong secondary inhibition that causes transient responses, which was conspicuously missing in most kitten receptive fields (Cai et al., 1997).
Fig. 7.

Development of response timing in the LGN and cortex. Latency and absolute phase plots are shown for each age group and area. A, B, LGN results, withcircles for X cells and squares for Y cells. Cells that were not classified as X or Y are shown withplus signs. Dotted lines were drawn at 100 msec latency and at an absolute phase of 0 c as landmarks, indicating where lagged and nonlagged cells are distinguished in adults, but these lines do not serve to divide cells in kittens. Sample sizes are 170 and 208 for kittens and adults, respectively. C, D, Area 17 timing illustrated by latency and absolute phase values from individual positions in simple-cell receptive fields. Each cell could contribute several points to these figures. Sample sizes were 441 in C and 316 in D.
Some cells in kittens were more mature than these. Figure6E–H shows data from a relatively adult-like nonlagged cell from a 62-d-old kitten (gray traces inE and H and map in F) and a lagged cell from a 90-d-old kitten (black traces and map inG). The nonlagged cell gave a strong phasic response with a half-rise latency of 52 msec and a half-fall latency of 27 msec. The lagged cell had a clear inhibitory dip at the same latency as the transient response of the nonlagged cell, a half-rise latency of 193 msec, and a half-fall latency of 74 msec, with a small anomalous offset discharge. The space-time maps shown in F and Gwere more compact along both axes (Cai et al., 1997). The cell inF had strong secondary inhibition. The cell in Ghad strong early inhibition. The phase data shown in Hdistinguish these two cells well: the nonlagged cell had a latency of 69 msec and an absolute phase value of 0.35 c, whereas the lagged cell had a latency of 122 msec and absolute phase value of 0.65 c.
Cells such as these became increasingly common with age. Although a few obviously lagged cells (both X and Y) were found in young kittens, they rarely showed the full range of features described for mature lagged cells (Mastronarde, 1987a; Humphrey and Weller, 1988a; Saul and Humphrey, 1990; Wolfe and Palmer, 1998). In particular, strong inhibitory dips and absolute phase lags appeared only in kittens older than 8 weeks.
Figure 7A shows LGN responses from kittens in the form of a latency and absolute phase plot. Figure 7B shows previously published results from adult cats for comparison, with lagged cells occupying primarily the quadrant with long latencies (>100 msec) and absolute phase lags and nonlagged cells having primarily short latencies (<100 msec) and absolute phase leads. In kittens, most cells had long latencies and small absolute phase leads. The percentage of cells in the second quadrant (long latencies and absolute phase leads) decreased markedly with age (Table 1). These neurons presumably would have developed into cells such as those found in the first quadrant (long latencies and absolute phase lags, mostly lagged) and third quadrant (short latencies and absolute phase leads, mostly nonlagged) at later ages. Because of the large variance in latencies in kittens, the variance across age in kittens was only slightly greater than within age groups: F = 4.5,p = 0.01 comparing 33- to 40-d-old, 41- to 50-d-old, and 51- to 94-d-old groups. In contrast, comparing kittens and adults,F = 126.5, p = 10−26.
Table 1.
Percentages of LGN cells in latency/absolute phase quadrants
| Age | Second quadrant L > 100 msec, φ0 < 0 | First quadrant L > 100 msec, φ0 > 0 | Third quadrant L < 100 msec, φ0 < 0 |
|---|---|---|---|
| 33–40 d | 57 | 10 | 29 |
| 41–50 d | 27 | 10 | 63 |
| 51–94 d | 14 | 19 | 58 |
| Adult | 6 | 22 | 66 |
Summary of changes with age in the distribution of LGN cell timing. Latency (L) and absolute phase (ϕ0) values in adults are largely restricted to the first and third quadrants. Most cells in young kittens lie in the second quadrant.
These results are amplified in Figure 8, in which the kitten data are broken into the three age groups mentioned above. In Figure 8A, mean latency is plotted against age, with the variance in these latencies described with 95% confidence intervals. Latencies decreased during development. The variances in latency in kittens are much larger than in adults, noting that latency is plotted on a logarithmic scale. The effect of latency on phase behavior is greater at higher than at lower frequencies. The large latency variation in young kittens implies that many cells that fired together at low frequencies had different timing at higher frequencies.
Fig. 8.

Progressive changes in timing. Results from the LGN and from cortical simple cells in or near layer 4 are compared. Sample sizes for the four groups were 51, 62, 57, and 208 LGN cells and 48, 62, 112, and 153 positions in layer 4 simple cells. A, Arithmetic mean latencies are shown with their 95% confidence intervals. B, The absolute deviations of absolute phase values from their means were averaged for each group of cells. Small absolute phase deviations arise when timing at low frequencies is relatively uniform, and large values arise when timing varies widely at low frequencies.
Mean absolute phase did not vary significantly during development, remaining approximately −0.1 c at all ages, but its variance increased. We thus plot a measure of that variance in Figure8B, the average absolute deviation of absolute phase from its mean. This measure increased late in development. Absolute phase reflects the phase behavior at low temporal frequencies. The small variance in younger kittens means that most cells fire at approximately the same time for stimuli modulated at ≤1 Hz. In older kittens and adult cats, cells have a wider range of absolute phase leads and lags, or in other words, widely differing timings at low temporal frequencies. This apparent difference between younger and older kittens stood out as one of the few instances in which large changes occurred within the sample of kittens.
Timing in cortical simple cells followed that of their LGN afferents, as shown in Figures 7 and 8. In kittens, cortical responses were often sustained, with long latencies. With increasing age, latencies decreased on average, and absolute phase lags and leads strengthened. Again, variances in kittens were smaller for absolute phase and larger for latency compared with adults. The percentage of positions from simple cells that had latency and absolute phase values in the second quadrant decreased with age (from 75 to 76%, 44%, and 10% at 33–40 d, 41–50 d, 51–94 d, and adults, respectively).
DISCUSSION
We have shown previously in adult cats that for all temporal frequencies, the LGN provides a full range of timing to cortical cells. Evidence that geniculate timing is important for adult cortical DS comes from three sources: (1) the match between the temporal frequency tuning of DS and the relative timing of lagged and nonlagged cells as a function of temporal frequency (Saul and Humphrey, 1992a); (2) the finding by Alonso et al. (2001) that timing in simple cells matches that of their geniculate afferents; and (3) the fact that simple cells in layer 4 appear to maintain their DS in the absence of intracortical processing (Ferster et al., 1996).
This study addressed the question of how DS develops. One might assume that an initial state of low DS progresses toward a mature state of high DS, perhaps relying on Hebbian mechanisms to associate inputs with appropriate spatial and temporal differences (Feidler et al., 1997;Wimbauer et al., 1997). The assumption that DS is uncommon in kittens is incorrect, however (Hubel and Wiesel, 1963; Pettigrew, 1974;Blakemore and Van Sluyters, 1975; Bonds, 1979; Albus and Wolf, 1984).Feidler et al. (1997) and Wimbauer et al. (1997) showed that inputs with different timing could be associated in an experience-dependent manner, consistent with experimental manipulations that affect DS, such as strobe-rearing (Cynader and Chernenko, 1976; Pasternak et al., 1985;Humphrey and Saul, 1998). However, the modeling studies of Feidler et al. (1997) and Wimbauer et al. (1997) were relevant only to the case in which visual experience could drive development. Because DS is present early in postnatal development, how do the appropriate inputs get hooked up to generate this DS?
The answer presented here confirms the importance of LGN timing for generating cortical DS. In kittens, DS is present to the same degree as in adults but differs in its temporal frequency tuning. This difference reflects the immature timing behavior of the LGN cells. At low frequencies, those cells fire at approximately the same time and cortical DS is correspondingly weak. At higher frequencies, because the LGN cells have widely varying latencies, there is plenty of variance in phase to support DS.
These data provide a starting point for modeling. Given the initial state with long-latency sustained inputs producing DS primarily at high temporal frequencies, how does the cortex reach the mature state as the input timing changes? Do the initial connections tend to persist, and as the timing of those inputs shifts, does the cortical DS persist but shift in its frequency tuning? Or do the connections turn over on the basis of both the changing response properties of the inputs and experience-dependent processes? Our data suggest that timing changes in the population may precede changes in the temporal frequency tuning of DS in single cells, but these questions will be difficult to answer.
Development of timing in the LGN
The lagged/nonlagged distinction arises at the level of the LGN. Retinal ganglion cells of both X and Y types project to neighboring lagged and nonlagged geniculate neurons (Mastronarde, 1987a,b; Humphrey and Weller, 1988a,b; Mastronarde et al., 1991; Hartveit, 1992). Nonlagged cells relay their retinal input to the cortex, often with strengthened surrounds and more transient firing (Hubel and Wiesel, 1961; So and Shapley, 1981; Mastronarde, 1992; Mukherjee and Kaplan, 1995; Usrey et al., 1999; Rowe and Fischer, 2001). Lagged cells, in contrast, transform their input via intrageniculate triadic circuits that invert part of the retinal signal to produce feedforward inhibition (Mastronarde, 1987b; Humphrey and Weller, 1988b). In kittens, although lagged and nonlagged cells could usually be distinguished, the classification criteria used in adults were not applicable. This is because those criteria were based on latency measurements, and nonlagged cells in kittens often had latencies that would have identified them as lagged by adult standards. In addition, the strong inhibition that marks adult lagged cells tended to be weak or absent in kittens.
Timing in the LGN is strongly influenced by inhibitory interactions, and the development of strong inhibition seems to be important in obtaining mature timing. LGN cells in kittens generally showed only weak signs of inhibition. Spatially, surrounds are weaker than in adults (Tootle and Friedlander, 1989; Cai et al., 1997). Temporally, the inhibition that cuts off responses in transient cells is weak or absent, so cells tend to be more sustained (Cai et al., 1997). Berardi and Morrone (1984) showed that inhibitory inputs to nonlagged cells strengthen between 5 and 8 weeks of age. Anatomic studies indicate that triadic inhibition, which underlies responses in lagged cells, matures between 4 and 8 weeks of age in the kitten LGN (Winfield and Powell, 1980). The functional changes described in this study occurred primarily during this time period, although they seemed to continue beyond 8 weeks, which is consistent with both the physiological results of Berardi and Morrone (1984) and the ultrastructural findings ofWinfield and Powell (1980).
Other mechanisms in addition to development of inhibitory interactions could affect timing, such as changes in receptor distributions. Visually evoked responses in lagged cells are abolished by application of NMDA antagonists (Heggelund and Hartveit, 1990; Kwon et al., 1991). Nonlagged cells are variably affected by NMDA and non-NMDA antagonists (Hartveit and Heggelund, 1990; Sillito et al., 1990; Kwon et al., 1991). Changes in the structure and function of LGN NMDA receptors occur in early development (Ramoa and Prusky, 1997), and the expression of NMDA receptors follows a developmental time course that typically peaks at the height of the critical period, at ∼5 weeks of age in kittens (Nowicka and Kaczmarek, 1996). NMDA receptor function is also strongly regulated by inhibitory inputs (Ramoa and McCormick, 1994), which, as indicated above, change during development. Responses in young kittens were almost uniformly sustained, perhaps reflecting a dominance of NMDA receptors.
Development of timing in visual cortex and modeling cortical DS
Cortical timing largely echoed the changes occurring in the afferents (DeAngelis et al., 1993a). Simple cells in kittens typically gave long-latency sustained responses. In adults, we found lagged-like and nonlagged-like responses and the full range of timing provided by the LGN. As noted previously (Saul and Humphrey, 1992b), responses at some positions in cortical simple-cell receptive fields had long latencies and absolute phase leads not seen in the LGN, and more responses with strong absolute phase lags are observed in the cortex than in the LGN. We reiterate that cortical processing, especially intracortical inhibition, affects timing (Murthy and Humphrey, 1999;Saul, 1999). Although cortical response timing originates in the LGN and broadly resembles that input timing, it is altered by intracortical mechanisms. For instance, presynaptic transmitter release declines during sustained activity (Markram and Tsodyks, 1996). This synaptic depression increases latencies and advances absolute phase. Inputs with small absolute phase leads and short latencies would be transformed by depressing synapses into responses with larger absolute phase leads and longer latencies, possibly explaining some of the differences seen between cortical and geniculate timing. The maturation of these cortical processes might contribute substantially to adult cortical timing but does not account for the changes in the temporal frequency tuning of DS.
Many models have been proposed to explain visual cortical DS. These models practically all posit intracortical mechanisms to generate temporal differences. Examples include NMDA receptor-mediated excitation (Maex and Orban, 1996), timing differences between excitatory and inhibitory synapses (Sabatini and Soleri, 1999), GABAB receptor-mediated inhibition (Suarez et al., 1995), temporal filtering induced by feedback (Suarez et al., 1995; Sabatini and Soleri, 1999), and depressing synapses (Chance et al., 1998). All of these mechanisms exist in the visual cortex and change timing, but none of these hypotheses for the origin of DS have been tested experimentally. Our data argue against models in which the afferent timing is homogeneous and temporal differences are generated intracortically. In light of those data, models must not only generate long delays, on the order of seconds, to create DS at low temporal frequencies (Saul and Humphrey, 1992a) but must also account for the shift in temporal frequency tuning of DS with development.
Cai et al. (1997) addressed the origin of cortical DS. They concluded, as we have, that convergence of LGN inputs with differing timing of their center responses seems to generate cortical inseparability and DS. Cortical DS at low temporal frequencies appears to involve the association of lagged and nonlagged LGN cells (Saul and Humphrey, 1992a,b). Cai et al. (1997) used electrodes that were biased against sampling small cells (Beidenbach and Stevens, 1969; Towe and Harding, 1970; Mullikin et al., 1984; Mastronarde, 1987a; Humphrey and Weller, 1988b; Saul and Humphrey, 1990) and recorded from only eight XL cells, four of which were in adult cats. Their data showed that XL cells exist in kittens but did not provide information on the development of these cells or on the relationship between developing LGN timing and cortical DS. The LGN results presented here offer a specific prediction about how the temporal frequency tuning of cortical DS should develop if it depends on LGN response timing. This prediction was confirmed when we examined cortical development.
Footnotes
This study was supported by National Eye Institute Grants EY10826 and EY08098. We thank Allen Humphrey, Paul Baker, and Aditya Murthy for their assistance.
Correspondence should be addressed to Alan Saul, Department of Neurobiology, University of Pittsburgh School of Medicine, Pittsburgh PA 15261. E-mail: saul@pitt.edu.
REFERENCES
- 1.Albrecht DG, Geisler WS. Motion selectivity and the contrast-response function of simple cells in the visual cortex. Vis Neurosci. 1991;7:531–546. doi: 10.1017/s0952523800010336. [DOI] [PubMed] [Google Scholar]
- 2.Albus K, Wolf W. Early postnatal development of neuronal function in the kitten's visual cortex: a laminar analysis. J Physiol (Lond) 1984;348:153–185. doi: 10.1113/jphysiol.1984.sp015104. [DOI] [PMC free article] [PubMed] [Google Scholar]
- 3.Alonso J-M, Usrey WM, Reid RC. Rules of connectivity between geniculate cells and simple cells in cat primary visual cortex. J Neurosci. 2001;21:4002–4015. doi: 10.1523/JNEUROSCI.21-11-04002.2001. [DOI] [PMC free article] [PubMed] [Google Scholar]
- 4.Beidenbach MA, Stevens CF. Electrical activity in cat olfactory cortex produced by synchronous orthodromic volleys. J Neurophysiol. 1969;32:193–203. doi: 10.1152/jn.1969.32.2.193. [DOI] [PubMed] [Google Scholar]
- 5.Berardi N, Morrone MC. Development of γ-aminobutyric acid mediated inhibition of X cells of the cat lateral geniculate nucleus. J Physiol (Lond) 1984;357:525–537. doi: 10.1113/jphysiol.1984.sp015515. [DOI] [PMC free article] [PubMed] [Google Scholar]
- 6.Blakemore C, Van Sluyters RC. Innate and environmental factors in the development of kitten visual cortex. J Physiol (Lond) 1975;248:663–716. doi: 10.1113/jphysiol.1975.sp010995. [DOI] [PMC free article] [PubMed] [Google Scholar]
- 7.Bonds AB. Development of orientation tuning in the visual cortex of kittens. In: Freeman RD, editor. Developmental neurobiology of vision. Plenum; New York: 1979. pp. 31–41. [Google Scholar]
- 8.Cai D, DeAngelis GC, Freeman RD. Spatiotemporal receptive field organization in the lateral geniculate nucleus of cats and kittens. J Neurophysiol. 1997;78:1045–1061. doi: 10.1152/jn.1997.78.2.1045. [DOI] [PubMed] [Google Scholar]
- 9.Chance FS, Nelson SB, Abbott LF. Synaptic depression and the temporal response characteristics of V1 cells. J Neurosci. 1998;18:4785–4799. doi: 10.1523/JNEUROSCI.18-12-04785.1998. [DOI] [PMC free article] [PubMed] [Google Scholar]
- 10.Cynader MS, Chernenko G. Abolition of direction selectivity in the visual cortex of the cat. Science. 1976;193:504–505. doi: 10.1126/science.941025. [DOI] [PubMed] [Google Scholar]
- 11.DeAngelis GC, Ohzawa I, Freeman RD. Spatiotemporal organization of simple-cell receptive fields in the cat's striate cortex. I. General characteristics and postnatal development. J Neurophysiol. 1993a;69:1091–1117. doi: 10.1152/jn.1993.69.4.1091. [DOI] [PubMed] [Google Scholar]
- 12.DeAngelis GC, Ohzawa I, Freeman RD. Spatiotemporal organization of simple-cell receptive fields in the cat's striate cortex. II. Linearity of temporal and spatial summation. J Neurophysiol. 1993b;69:1118–1135. doi: 10.1152/jn.1993.69.4.1118. [DOI] [PubMed] [Google Scholar]
- 13.Feidler JC, Saul AB, Murthy A, Humphrey AL. Hebbian learning and the development of direction selectivity: the role of geniculate response timings. Network. 1997;8:195–214. [Google Scholar]
- 14.Ferster D, Chung S, Wheat H. Orientation selectivity of thalamic input to simple cells of cat visual cortex. Nature. 1996;380:249–252. doi: 10.1038/380249a0. [DOI] [PubMed] [Google Scholar]
- 15.Hartveit E. Simultaneous recording of lagged and nonlagged cells in the cat dorsal lateral geniculate nucleus. Exp Brain Res. 1992;88:229–232. doi: 10.1007/BF02259147. [DOI] [PubMed] [Google Scholar]
- 16.Hartveit E, Heggelund P. Neurotransmitter receptors mediating excitatory input to cells in the cat lateral geniculate nucleus. II. Non-lagged cells. J Neurophysiol. 1990;63:1361–1372. doi: 10.1152/jn.1990.63.6.1361. [DOI] [PubMed] [Google Scholar]
- 17.Heggelund P. Direction asymmetry by moving stimuli and static receptive field plots for simple cells in cat striate cortex. Vision Res. 1984;24:13–16. doi: 10.1016/0042-6989(84)90138-x. [DOI] [PubMed] [Google Scholar]
- 18.Heggelund P, Hartveit E. Neurotransmitter receptors mediating excitatory input to cells in the cat lateral geniculate nucleus. I. Lagged cells. J Neurophysiol. 1990;63:1347–1360. doi: 10.1152/jn.1990.63.6.1347. [DOI] [PubMed] [Google Scholar]
- 19.Hubel DH, Wiesel TN. Receptive fields of single neurones in cat's visual cortex. J Physiol (Lond) 1959;160:106–154. doi: 10.1113/jphysiol.1959.sp006308. [DOI] [PMC free article] [PubMed] [Google Scholar]
- 20.Hubel DH, Wiesel TN. Integrative action in the cat's lateral geniculate body. J Physiol (Lond) 1961;155:385–398. doi: 10.1113/jphysiol.1961.sp006635. [DOI] [PMC free article] [PubMed] [Google Scholar]
- 21.Hubel DH, Wiesel TN. Receptive fields, binocular interaction, and functional architecture in the cat's visual cortex. J Physiol (Lond) 1962;160:106–154. doi: 10.1113/jphysiol.1962.sp006837. [DOI] [PMC free article] [PubMed] [Google Scholar]
- 22.Hubel DH, Wiesel TN. Receptive fields of cells in striate cortex of very young, visually inexperienced kittens. J Neurophysiol. 1963;26:994–1002. doi: 10.1152/jn.1963.26.6.994. [DOI] [PubMed] [Google Scholar]
- 23.Humphrey AL, Saul AB. Strobe rearing reduces direction selectivity in area 17 by altering spatiotemporal receptive-field structure. J Neurophysiol. 1998;80:2991–3004. doi: 10.1152/jn.1998.80.6.2991. [DOI] [PubMed] [Google Scholar]
- 24.Humphrey AL, Weller RE. Functionally distinct groups of X-cells in the lateral geniculate nucleus of the cat. J Comp Neurol. 1988a;268:429–447. doi: 10.1002/cne.902680311. [DOI] [PubMed] [Google Scholar]
- 25.Humphrey AL, Weller RE. Structural correlates of functionally distinct X-cells in the lateral geniculate nucleus of the cat. J Comp Neurol. 1988b;268:448–468. doi: 10.1002/cne.902680312. [DOI] [PubMed] [Google Scholar]
- 26.Humphrey AL, Saul AB, Feidler JC. Strobe rearing prevents the convergence of inputs with different response timings onto area 17 simple cells. J Neurophysiol. 1998;80:3005–3020. doi: 10.1152/jn.1998.80.6.3005. [DOI] [PubMed] [Google Scholar]
- 27.Kwon YH, Esguerra M, Sur M. NMDA and non-NMDA receptors mediate visual responses of neurons in the cat's lateral geniculate nucleus. J Neurophysiol. 1991;66:414–428. doi: 10.1152/jn.1991.66.2.414. [DOI] [PubMed] [Google Scholar]
- 28.Maex R, Orban GA. Model circuit of spiking neurons generating directional selectivity in simple cells. J Neurophysiol. 1996;75:1515–1545. doi: 10.1152/jn.1996.75.4.1515. [DOI] [PubMed] [Google Scholar]
- 29.Markram H, Tsodyks M. Redistribution of synaptic efficacy between neocortical pyramidal neurons. Nature. 1996;382:807–810. doi: 10.1038/382807a0. [DOI] [PubMed] [Google Scholar]
- 30.Mastronarde DN. Two classes of single-input X-cells in cat lateral geniculate nucleus. I. Receptive-field properties and classification of cells. J Neurophysiol. 1987a;57:357–380. doi: 10.1152/jn.1987.57.2.357. [DOI] [PubMed] [Google Scholar]
- 31.Mastronarde DN. Two classes of single-input X-cells in cat lateral geniculate nucleus. II. Retinal inputs and the generation of receptive field properties. J Neurophysiol. 1987b;57:381–413. doi: 10.1152/jn.1987.57.2.381. [DOI] [PubMed] [Google Scholar]
- 32.Mastronarde DN. Nonlagged relay cells and interneurons in the cat lateral geniculate nucleus: receptive-field properties and retinal inputs. Vis Neurosci. 1992;8:407–441. doi: 10.1017/s0952523800004934. [DOI] [PubMed] [Google Scholar]
- 33.Mastronarde DN, Humphrey AL, Saul AB. Lagged Y cells in the cat lateral geniculate nucleus. Vis Neurosci. 1991;7:191–200. doi: 10.1017/s0952523800004028. [DOI] [PubMed] [Google Scholar]
- 34.McLean J, Palmer LA. Contribution of linear spatiotemporal receptive field structure to velocity selectivity of simple cells in area 17 of cat. Vision Res. 1989;29:675–679. doi: 10.1016/0042-6989(89)90029-1. [DOI] [PubMed] [Google Scholar]
- 35.McLean J, Raab S, Palmer LA. Contribution of linear mechanisms to the specification of local motion by simple cells in areas 17 and 18 of the cat. Vis Neurosci. 1994;11:271–294. doi: 10.1017/s0952523800001632. [DOI] [PubMed] [Google Scholar]
- 36.Milleret C, Buisseret P, Gary-Bobo E. Area centralis position relative to the optic disc projection in kittens as a function of age. Invest Ophthalmol Vis Sci. 1988;29:1299–1305. [PubMed] [Google Scholar]
- 37.Movshon JA, Thompson ID, Tolhurst DJ. Spatial summation in the receptive fields of simple cells in the cat's striate cortex. J Physiol (Lond) 1978;283:53–77. doi: 10.1113/jphysiol.1978.sp012488. [DOI] [PMC free article] [PubMed] [Google Scholar]
- 38.Mukherjee P, Kaplan E. Dynamics of neurons in the cat lateral geniculate nucleus: in vivo electrophysiology and computational modeling. J Neurophysiol. 1995;74:1222–1243. doi: 10.1152/jn.1995.74.3.1222. [DOI] [PubMed] [Google Scholar]
- 39.Mullikin WH, Jones JP, Palmer LA. Receptive-field properties and laminar distribution of X-like and Y-like simple cells in cat area 17. J Neurophysiol. 1984;52:350–371. doi: 10.1152/jn.1984.52.2.350. [DOI] [PubMed] [Google Scholar]
- 40.Murthy A, Humphrey AL. Inhibitory contributions to spatiotemporal receptive field structure and direction selectivity in simple cells of cat area 17. J Neurophysiol. 1999;81:1212–1224. doi: 10.1152/jn.1999.81.3.1212. [DOI] [PubMed] [Google Scholar]
- 41.Murthy A, Humphrey AL, Saul AB, Feidler JC. Laminar differences in the spatiotemporal structure of simple cell receptive fields in cat area 17. Vis Neurosci. 1998;15:239–256. doi: 10.1017/s0952523898152045. [DOI] [PubMed] [Google Scholar]
- 42.Nowicka D, Kaczmarek L. Spatio-temporal pattern of N-methyl-d-aspartate receptor NR1 mRNA expression during postnatal development of visual structures of the rat brain. J Neurosci Res. 1996;44:471–477. doi: 10.1002/(SICI)1097-4547(19960601)44:5<471::AID-JNR7>3.0.CO;2-C. [DOI] [PubMed] [Google Scholar]
- 43.Pasternak T, Schumer RA, Gizzi MS, Movshon JA. Abolition of visual cortical direction selectivity affects visual behavior in cats. Exp Brain Res. 1985;61:214–217. doi: 10.1007/BF00235638. [DOI] [PubMed] [Google Scholar]
- 44.Pettigrew JD. The effect of visual experience on the development of stimulus specificity by kitten cortical neurones. J Physiol (Lond) 1974;237:49–74. doi: 10.1113/jphysiol.1974.sp010469. [DOI] [PMC free article] [PubMed] [Google Scholar]
- 45.Ramoa AS, McCormick DA. Developmental changes in electrophysiological properties of LGNd neurons during reorganization of retinogeniculate connections. J Neurosci. 1994;14:2089–2097. doi: 10.1523/JNEUROSCI.14-04-02089.1994. [DOI] [PMC free article] [PubMed] [Google Scholar]
- 46.Ramoa AS, Prusky G. Retinal activity regulates developmental switches in functional properties and ifenprodil sensitivity of NMDA receptors in the lateral geniculate nucleus. Brain Res Dev Brain Res. 1997;101:165–175. doi: 10.1016/s0165-3806(97)00061-8. [DOI] [PubMed] [Google Scholar]
- 47.Reichardt W. Autocorrelation, a principle for the evaluation of sensory information by the central nervous system. In: Rosenblith WA, editor. Sensory communication. Wiley; New York: 1961. pp. 303–317. [Google Scholar]
- 48.Reid RC, Soodak RE, Shapley RM. Linear mechanisms of directional selectivity in simple cells of cat striate cortex. Proc Natl Acad Sci USA. 1987;84:8740–8744. doi: 10.1073/pnas.84.23.8740. [DOI] [PMC free article] [PubMed] [Google Scholar]
- 49.Rowe MH, Fischer Q. Dynamic properties of retino-geniculate synapses in the cat. Vis Neurosci. 2001;18:219–231. doi: 10.1017/s0952523801182076. [DOI] [PubMed] [Google Scholar]
- 50.Sabatini SP, Soleri F. An architectural hypothesis for direction selectivity in the visual cortex: the role of spatially asymmetric intracortical inhibition. Biol Cybern. 1999;80:171–183. doi: 10.1007/s004220050515. [DOI] [PubMed] [Google Scholar]
- 51.Saul AB. Adaptation aftereffects in single neurons of cat visual cortex: response timing is retarded by adapting. Vis Neurosci. 1995;12:91–205. doi: 10.1017/s0952523800007872. [DOI] [PubMed] [Google Scholar]
- 52.Saul AB. Development of response timing in cat lateral geniculate nucleus. Soc Neurosci Abstr. 1997;23:451. [Google Scholar]
- 53.Saul AB. Visual cortical simple cells: who inhibits whom. Vis Neurosci. 1999;16:667–673. doi: 10.1017/s095252389916406x. [DOI] [PubMed] [Google Scholar]
- 54.Saul AB, Feidler JC. Development of response timing and direction selectivity in cat visual cortex. Soc Neurosci Abstr. 2000;26:162.4. doi: 10.1523/JNEUROSCI.22-07-02945.2002. [DOI] [PMC free article] [PubMed] [Google Scholar]
- 55.Saul AB, Humphrey AL. Spatial and temporal response properties of lagged and nonlagged cells in cat lateral geniculate nucleus. J Neurophysiol. 1990;64:206–224. doi: 10.1152/jn.1990.64.1.206. [DOI] [PubMed] [Google Scholar]
- 56.Saul AB, Humphrey AL. Temporal-frequency tuning of direction selectivity in cat visual cortex. Vis Neurosci. 1992a;8:365–372. doi: 10.1017/s0952523800005101. [DOI] [PubMed] [Google Scholar]
- 57.Saul AB, Humphrey AL. Evidence of input from lagged cells in the lateral geniculate nucleus to simple cells in cortical area 17 of the cat. J Neurophysiol. 1992b;68:1190–1208. doi: 10.1152/jn.1992.68.4.1190. [DOI] [PubMed] [Google Scholar]
- 58.Sillito AM, Murphy PC, Salt TE, Moody CI. Dependence of retinogeniculate transmission in cat on NMDA receptors. J Neurophysiol. 1990;63:347–355. doi: 10.1152/jn.1990.63.2.347. [DOI] [PubMed] [Google Scholar]
- 59.Simons DJ, Land PW. A reliable technique for marking the location of extracellular recording sites using glass micropipettes. Neurosci Lett. 1987;81:100–104. doi: 10.1016/0304-3940(87)90347-8. [DOI] [PubMed] [Google Scholar]
- 60.So YT, Shapley RM. Spatial tuning of cells in and around lateral geniculate nucleus of the cat: X and Y relay cells and perigeniculate interneurons. J Neurophysiol. 1981;45:107–120. doi: 10.1152/jn.1981.45.1.107. [DOI] [PubMed] [Google Scholar]
- 61.Suarez H, Koch C, Douglas R. Modeling direction selectivity of simple cells in striate visual cortex within the framework of the canonical microcircuit. J Neurosci. 1995;15:6700–6719. doi: 10.1523/JNEUROSCI.15-10-06700.1995. [DOI] [PMC free article] [PubMed] [Google Scholar]
- 62.Tolhurst DJ, Dean AF. Evaluation of a linear model of directional selectivity in simple cells of the cat's striate cortex. Vis Neurosci. 1991;6:421–428. doi: 10.1017/s0952523800001280. [DOI] [PubMed] [Google Scholar]
- 63.Tootle JS, Friedlander MJ. Postnatal development of the spatial contrast sensitivity of X- and Y-cells in the kitten retinogeniculate pathway. J Neurosci. 1989;9:1325–1340. doi: 10.1523/JNEUROSCI.09-04-01325.1989. [DOI] [PMC free article] [PubMed] [Google Scholar]
- 64.Towe AL, Harding GW. Extracellular microelectrode sampling bias. Exp Neurol. 1970;29:366–381. doi: 10.1016/0014-4886(70)90065-8. [DOI] [PubMed] [Google Scholar]
- 65.Usrey WM, Reppas JB, Reid JC. Specificity and strength of retinogeniculate connections. J Neurophysiol. 1999;82:3527–3540. doi: 10.1152/jn.1999.82.6.3527. [DOI] [PubMed] [Google Scholar]
- 66.Watson AB, Ahumada AJ., Jr Model of human visual-motion sensing. J Opt Soc Am A. 1985;2:322–341. doi: 10.1364/josaa.2.000322. [DOI] [PubMed] [Google Scholar]
- 67.Wimbauer S, Wenisch OG, Miller KD, van Hemmen JL. Development of spatiotemporal receptive fields of simple cells. I. Model formulation. Biol Cybern. 1997;77:453–461. doi: 10.1007/s004220050405. [DOI] [PubMed] [Google Scholar]
- 68.Winfield DA, Powell TPS. An electron-microscopical study of the postnatal development of the lateral geniculate nucleus in the normal kitten and after eyelid suture. Proc R Soc Lond B Biol Sci. 1980;210:197–210. doi: 10.1098/rspb.1980.0129. [DOI] [PubMed] [Google Scholar]
- 69.Wolfe JR, Palmer LA. Temporal diversity in the lateral geniculate nucleus of cat. Vis Neurosci. 1998;15:653–675. doi: 10.1017/s0952523898154068. [DOI] [PubMed] [Google Scholar]
- 70.Yamane S, Maske R, Bishop PO. Direction selectivity of simple cells in cat striate cortex to moving light bars. II. Relation to moving dark bar responses. Exp Brain Res. 1985;57:523–536. doi: 10.1007/BF00237839. [DOI] [PubMed] [Google Scholar]