

Abstract
Cholinergic neurons innervating cortical structures are among the most affected neuronal populations in Alzheimer's disease. In rodents, they express high levels of the neurotrophin receptor p75NTR. We have analyzed cholinergic septohippocampal neurons of the medial septal nucleus inp75exonIII (partial p75NTR knock-out) andp75exonIV (complete p75NTR knock-out) mice, in their original genetic background and in congenic strains. At postnatal day 15, thep75exonIII mutation leads to a moderate increase (+13%) in these neurons among littermates only after back-crossing in a C57BL/6 background. In contrast, the nullp75exonIV mutation, which prevents expression of both the full-length and the shorter p75NTR isoforms, results in a 28% neuronal increase, independent of genetic background. The incomplete nature of the p75NTR mutation used previously, coupled with difficulties in delineating the mouse medial septum and the impact of the genetic background on cell numbers, all contribute to explain previous difficulties in establishing the role of p75NTR in regulating cholinergic neuron numbers in the mouse forebrain.
Keywords: p75NTR, cholinergic neurons, medial septum, cell death, genetic background, optical fractionator, NGF
Large neurons of the basal forebrain give rise to the widespread cholinergic innervation of cortical structures. The most widely investigated population of these neurons, located in the septum and projecting to the hippocampal formation (Sofroniew et al., 1987), is used frequently as a model for CNS cholinergic neurons. In Alzheimer's disease, the loss of explicit memory is accompanied by a loss of cholinergic function (Bartus et al., 1982; Coyle et al., 1983; Perry et al., 1999). In addition, learning-deficient rats have smaller basal forebrain cholinergic neurons, and their performance, as well as the size of their cholinergic neurons, can be increased by the administration of nerve growth factor (Fischer et al., 1987). In view of the functional importance of cholinergic neurons, it is of considerable interest to understand the molecular mechanisms regulating their survival.
The neurotrophins are among the best studied signaling systems regulating neuronal numbers in the nervous system (Bibel and Barde, 2000). They are well known to affect the viability, differentiation, and size of CNS cholinergic neurons (Hefti, 1986; Vantini et al., 1989;Li et al., 1995; Lucidi-Phillipi et al., 1996). NGF and brain-derived neurotrophic factor are synthesized by hippocampal neurons, which are the target cells of forebrain cholinergic neurons. NGF is taken up by the cholinergic terminals of the septohippocampal neurons bearing both p75NTR and TrkA receptors and is retrogradely transported to the cell body region (for review, see Hagg et al., 1994). Although the septal neurons have long been known to express p75NTR at particularly high levels, the role of this receptor in their survival is unclear and controversial. Van der Zee et al. (1996) first reported an increased number of cholinergic neurons in the septum of mice carrying a targeted mutation in the third exon of the p75NTRgene. However, subsequent investigations using the same mouse mutant led to conflicting results, with some studies indicating an increase and others indicating a decrease or no significant changes (Hagg et al., 1997; Peterson et al., 1997; Yeo et al., 1997; Hagg, 1999;Peterson et al., 1999; Ward and Hagg, 1999; Greferath et al., 2000).
Recently, a new mutation in the p75NTRlocus was generated that also eliminates a splice variant encoded by this locus (von Schack et al., 2001). This previously unrecognized variant encodes a “short” form of p75NTR(s-p75NTR) that has the same transmembrane and cytoplasmic domain as the full-length, well characterized form of p75NTR. Mice bearing this novelp75exonIV mutation display a more drastic phenotype than the previous p75exonIIImutants (Lee et al., 1992), including a larger reduction in the number of dorsal root ganglia neurons and Schwann cells. This newp75NTR mutant was used in the present study, and because we wished to compare the results with those obtained using the previous, hypomorphic p75NTRmutation, we also generated congenic strains carrying each of the two mutations. For each mouse strain, we also defined the boundaries of the medial septum (MS) by retrograde Fluoro-Gold (FG) tracing in combination with immunolabeling for ChAT and p75NTR.
MATERIALS AND METHODS
Mouse strains and breeding colony. Thep75exonIII mutation was generated as described by Lee et al. (1992) using J1(129) embryonic stem (ES) cells and was obtained from The Jackson Laboratory (Bar Harbor, ME) (strain JR2124) in its original, mixed background, Sv129/BALB/cJ. It was maintained at the Max Planck Institute by alternating breeding to Sv129 (Sv129Pas substrain) to generate heterozygotes and breeding of heterozygous siblings, as shown schematically in Figure1C.
Fig. 1.
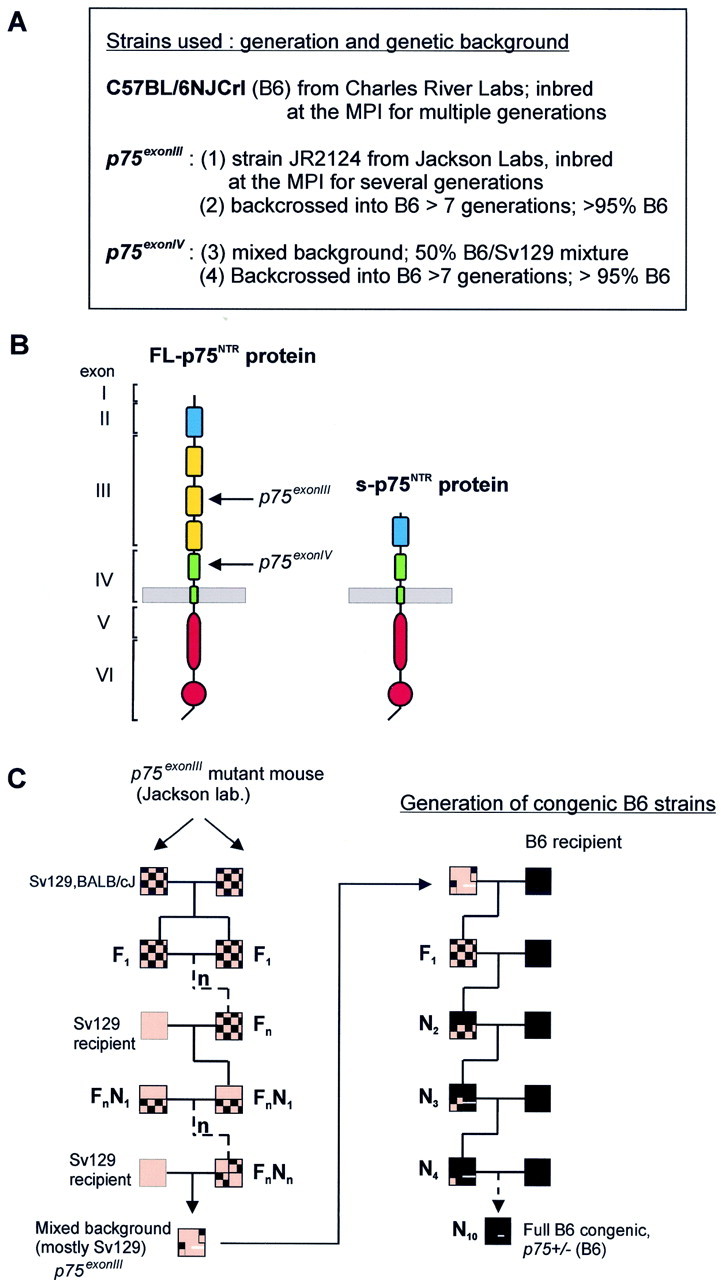
Mutations and mouse strains used in this study.A, List of the five strains analyzed and their origins.B, Schematic representation of the full-length p75NTR and the splice variant s-p75NTR proteins, depicting their different domains and their correlation to the intron–exon structure of the genomic locus. Arrows point to the approximate location of the targeting event: the p75exonIIImutation (Lee et al., 1992) replaced part of exon III with a selection cassette, whereas the p75exonIVmutation inserted the cassette in reverse orientation within exon IV, thus preventing expression of both the full-length and the s-p75NTR splice isoform (von Schack et al., 2001).C, Breeding scheme for thep75exonIII line (left) and generation of a congenic B6 strain bearing this mutation. The original line obtained from The Jackson Laboratory was maintained by heterozygous matings and crosses to Sv129, resulting in a line of mixed background in which Sv129 is most prominent. To generate the congenic B6 strain (right), originally mixed-background heterozygotes were consecutively mated to B6 males from Charles River Laboratories. The congenicp75exonIV(B6) strain was generated according to the same scheme.
The p75exonIV mutation was generated as described previously (von Schack et al., 2001) in R1(129) ES cells/C57BL/6 blastocysts and kept in a mixed genetic background by breeding of heterozygous siblings. This line was at F5 (fifth generation) at the time of submission of this manuscript.
Congenic C57BL/6 (B6) strains bearing each of the two mutations were generated by consecutive mating of a heterozygous mouse in the mixed background to a pure B6 mouse obtained from Charles River Laboratories (Wilmington, MA). All mice analyzed for this report were from at least the seventh backcross generation.
Genetic (microsatellite marker) analysis. Tail genomic DNA was extracted from the following three representative mice: a B6 mouse from Charles River Laboratories, ap75exonIII(B6) mouse, and ap75exonIV(B6) mouse of the same backcross generation. Fifty-nine PCRs spanning microsatellite regions in the entire mouse genome were performed on each genomic DNA. PCR primer sequences were taken from the Mouse Genome Database (www.informatics.jax.org); licensed oligonucleotides were fromResearch Genetics (Huntsville, AL). In each lane, ROX 500 (Applied Biosystems, Foster City, CA) was used as a size standard. The fragment length of each amplicon was analyzed using an Applied Biosystems Prism 377 DNA Sequencer; gel analysis and determination of the fragment length were done using the GeneScan and GenoTyper software packages (Applied Biosystems). Fragment lengths were then compared with data available for C57BL/6 and Sv129 mice from Jackson and Charles River Laboratories (Medigenomix, Martinsried, Germany).
FG retrograde tracing. Because neighboring septal nuclei (e.g., the lateral septal nucleus) also contain cholinergic neurons, which only exceptionally colocalize with p75NTR, tracing experiments were performed to delineate the boundaries of the region containing cholinergic septohippocampal projection neurons of each strain. Wild-type and mutant mice received intrahippocampal injections of the retrograde fluorescent tracer FG bilaterally (four injections each, 2.5% FG) (Naumann et al., 1992). One week later, mice were perfused and brains were cut as described below. Vibratome sections containing the septal region were first analyzed using fluorescence microscopy to define the “region of interest” (Fig. 2). Sections containing FG-backlabeled septohippocampal neurons were first photodocumented and then immunostained against ChAT (Fig. 2) or p75NTR.
Fig. 2.

Retrograde FG tracing for septohippocampal neurons to delineate the actual boundaries of the MS. Five coronal sections of the septal complex from a p75exonIV(Sv129/B6) mutant after intrahippocampal injections of the retrograde fluorescent tracer FG (middle columns) and subsequent immunocytochemical detection of ChAT-positive cholinergic neurons in the same sections (right columns) are shown. The actual position is indicated using section numbers according to our nomenclature described in Figure 3. Left, A schematic anatomic diagram (adapted from Franklin and Paxinos, 1997) of the estimated position. The shaded area represents the MS region in which FG-backlabeled cholinergic neurons projecting to the hippocampal formation were identified. The dotted lineconnecting the inferior edge of the anterior commissure marks the inferior boundary of the area in which neurons were counted. Note that the extent of the shaded area (and therefore the location of cholinergic MS neurons to be counted) changes substantially along the rostrocaudal axis of the MS. Oblique, dashed lines in the last panel (position 16) indicate the boundary between MS and neighboring ventrocaudal nuclei not analyzed in this study.
Tissue processing and immunocytochemistry. Mice were transcardially perfused first with 0.9% saline and then with 4% paraformaldehyde in 0.1 m phosphate buffer (PB, pH 7.35). Whole brains were post-fixed in the same fixative for 2 hr. Coronal 50 μm sections were cut on a vibratome across the entire septal region and collected to reconstruct the complete series as described in detail in Results (see also Fig.3).
Fig. 3.

Variability in the localization of the MS nucleus in p75exonIII andp75exonIV mutants. Representative examples of the morphological analysis performed for each mutation in the different backgrounds and at two different ages are shown. In eachpanel, the mutant mice are represented in the top half, and the corresponding wild-type littermates are represented in the bottom half. In each individualpanel, mice belonging to the same litter are represented by the same color. All frontal sections of the entire septal complex were collected as complete series and numbered according to their exact position from rostral (left) to caudal (right) positions (vertical lines in eachpanel). Independent of malformations of the fiber tracts, the coronal section through the septal complex was designated section c.c., where the tips of the corpus callosum were first found in close contact (Fig. 2). Because every second section of the complete series was used for quantitative stereological analysis, each position refers to the “0” position of the c.c., using even numbers in both directions. Each horizontal bar represents the complete series of the septal complex sections containing cholinergic MS neurons in an individual mouse. Numbers on eachbar (e.g., 4959/22) indicate the total number of ChAT-immunoreactive neurons counted in the MS (4959) and the number of sections collected through the MS (22). In some cases, virtually no cholinergic neuron was detectable in the most caudal section of the MS region (hatched region of thehorizontal bar). Note the higher degree of variability in the p75exonIII line than thep75exonIV line, both at P15 and in the adult.
ChAT immunocytochemistry was performed with a goat anti-ChAT polyclonal antibody (1:500 in 0.1 m PB containing 5% normal rabbit serum and 0.5% Triton X-100; Bioproducts, Boehringer Ingelheim, Ingelheim, Germany) for 48 hr at 4°C, followed by biotinylated rabbit anti-goat IgG. p75NTRimmunocytochemistry (data not shown) was performed using an anti-human antibody (catalog #G3231; Promega, Madison, WI) diluted 1:1000 in 0.1m PB containing 1% normal goat serum and 0.5% Triton X-100. Immunostaining was visualized as described previously (Naumann et al., 1997) using the avidin–biotin complex Elite Kit (Vector Laboratories, Burlingame, CA) followed by DAB reaction. Every second section of each complete series (Fig. 3) was used for statistical analysis. Sections were mounted on slides, dehydrated, and coverslipped using Histokit (Shandon, Pittsburgh, PA).
Cell counts: quantitative stereology and statistical analysis. The number of cholinergic MS neurons was first obtained by direct, “manual” counts on ChAT-immunostained sections (Naumann et al., 1994) and subsequently with the optical disector/fractionator method (OF; see also West et al., 1991), but relative differences among groups were directly comparable (within 3%) using both methods. Figures 4-6 show only stereological data obtained by one observer with the OF, because this method is unbiased and is currently the method of choice (Peterson et al., 1999).
Fig. 4.
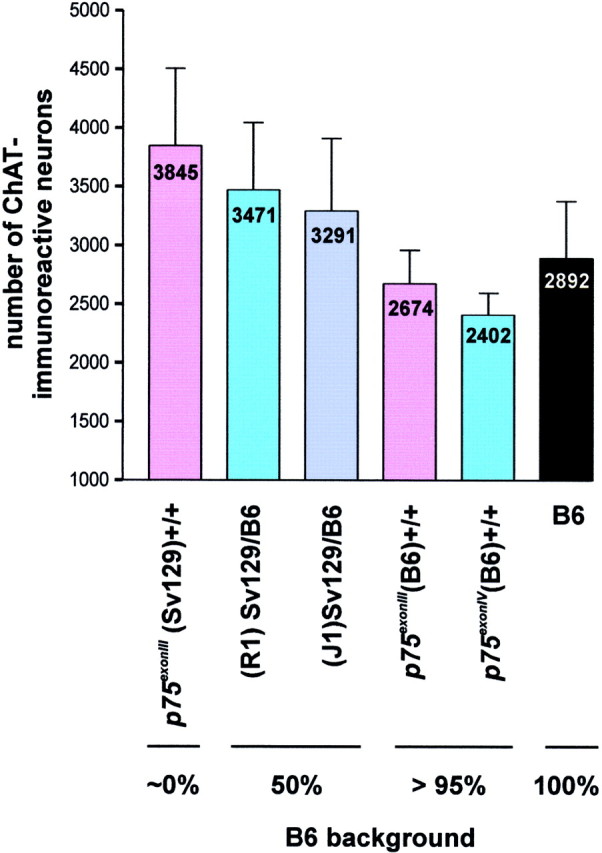
Variability in the number of ChAT-immunoreactive MS neurons in different wild-type strains. The number of MS cholinergic neurons in wild-type mice from six different lines was quantified using the criteria described in the legends to Figures 2 and 3.Numbers on each bar indicate mean values from 10 animals; error bars indicate SD. In general, a higher B6 content in the genome correlates with a lower number of ChAT-immunoreactive MS neurons.
Fig. 5.

Effect of the twop75NTR mutations at P15. The effect of each mutation in a mixed background (left) or in congenic B6 strains (right) was quantified as described in Figures 2 and 3. For each line, 10 wild-type and 10 homozygous mutant mice from heterozygous matings were analyzed at P15. The moderate effect of the p75exonIIImutation in the mixed background (6.5% increase) is enhanced in the B6 background (13% increase). In contrast, thep75exonIV mutation, which prevents expression of both the full-length receptor and the s-p75NTR isoform, leads to comparable effects in both genetic backgrounds (28% increase in B6 and 22% increase in a mixed background).
Fig. 6.

Effect of the two p75NTRmutations at 3 months of age. The persistence of the effect of each p75NTR mutation was evaluated at 3 months of age in the congenic B6 strains as described in Figure 5. Although the effects of both mutations are less pronounced with increasing age, the larger increase seen in the p75exonIVcompared with the p75exonIII mutation persists.
For quantitative stereology, sections of the septal region were visualized on a computer screen attached to an Olympus BX60 microscope F5 (Olympus Optical Co. Ltd., Düsseldorf, Germany). A computer-controlled stepper motor stage and focus assembly allowed movement in the x-, y-, and z-axes. Cell counts were performed using Stereo Investigator software (version 3.0; MicroBrightField, Inc., Colchester, VT). According to our criteria described in Figures 2 and 3, the region of interest was first marked for every single section using low-power magnification (4×/0.10 objective). For subsequent cell counts, the following parameters were added to the program: counting frame, 50 × 30 μm; guard zone, 2 μm; and counting depth, 8 μm. Thereafter, using high-power magnification (oil objective lens, 100×/1.35), ChAT-positive cells that fulfilled the criteria of the unbiased counting rules were marked and added to the probe run list. The total cell numbers estimated by the OF were subsequently analyzed by three-way ANOVA (6.12 PROC GLM; SAS Institute, Cary, NC). Statistical significance was analyzed for the corresponding three classes with two levels each [1, wild type/knock-out; 2,p75exonIII/p75exonIVmutation; 3, original background/B6 or postnatal day 15 (P15)/adult], all with repeated measurements.
Reverse transcription-PCR analysis. cDNA was synthesized from 1 μg of total RNA from whole brain and from the MS region of P15 mice (B6 and Sv129 strains) as described previously (von Schack et al., 2001). The following primers were used to detect FL-p75NTR: 5′-CCT GCC TGG ACA GTG TTA CG-3′ and 5′-GCC AAG ATG GAG CAA TAG ACA G-3′; 5′-TGC CTG GAC AAG ATC CCT GG-3′ and 5′-GGC CTG AGG CAG TCT GTG TG-3′ were used to detect s-p75NTR. Detection of the s-p75NTR transcript requires at least 2.5-fold higher levels of input cDNA than detection of FL-p75NTR.
RESULTS
Genetic manipulations: p75NTR mutations and generation of congenic strains
The p75exonIII mutation was first reported in 1992 (Lee et al., 1992) and was initially distributed by The Jackson Laboratory (strain JR2124) in a mixed Sv129/BALB/cJ background after consecutive matings of homozygous siblings. This mutation targeted exon III (Fig. 1) and does not affect the expression of a splice variant of p75NTR(s-p75NTR) that has only been discovered recently (von Schack et al., 2001). Thep75exonIV mutation, which eliminates expression of both the full-length p75NTRreceptor and the s-p75NTR isoform (Fig.1B), was generated in a mixed Sv129/C57BL/6 background (von Schack et al., 2001). Originally, then, both lines contained ∼50% of Sv129 background in their genomes. The Sv129 background has been shown to be highly heterogeneous, however, with multiple substrains identified (Simpson et al., 1997). In addition, it is well known that both BALB/c and Sv129 mice display some abnormalities, including malformations of the corpus callosum (c.c.) (Wahlsten, 1982), a crucial landmark for the anatomic definition of the boundaries of the septal nuclei. Finally, the viability, litter size, and reproductive efficacy of the Sv129 strain are known to be rather low (Green and Witham, 1991). We chose the B6 strain to generate congenic lines (Fig. 1C) and introduced each of the two p75NTR-targeted mutations in the inbred C57BL/6NJCrl background provided by Charles River Laboratories. Although the p75exonIII mutation has been inbred at our institute for multiple generations, with occasional crosses to the inbred strain Sv129Pas (Fig. 1C), the mixed B6/Sv129 background of the p75exonIVmutation has been better preserved because of the limited (F4, F5) number of generations.
Genomic DNA from a seventh-generation mouse in each line (with an estimated >98% B6 content) was subjected to an extensive microsatellite marker analysis and compared with the genomic DNA of a pure B6 mouse. This analysis revealed that the background of thep75exonIII(B6) mice is almost identical to that of p75exonIV(B6) mice. As seen in Table 1, both congenic B6 lines display the B6 genotype for the vast majority of the markers tested, with thep75exonIII line showing B6/Sv129 heterozygosis at only two positions (D10Mit 205 and D11Mit 270) and thep75exonIV line at one unique position (D13Mit 236).
Table 1.
Genetic background of three representative mice [B6,p75exonIII (B6), andp75exonIV (B6)], as assessed by microsatellite analysis
| Marker | C57Bl6 | p75exonIII(BL6) | p75exonIV (BL6) | ||||||
|---|---|---|---|---|---|---|---|---|---|
| Peak 1 | Peak 2 | Genotype | Peak 1 | Peak 2 | Genotype | Peak 1 | Peak 2 | Genotype | |
| D1Mit 15 | 160,08 | 160,08 | C57/C57 | 160,15 | 160,15 | C57/C57 | 160,15 | 160,15 | C57/C57 |
| D1Mit 17 | 167,15 | 167,15 | C57/C57 | 167,07 | 167,07 | C57/C57 | 167,13 | 167,13 | C57/C57 |
| D2Mit 200 | 136,84 | 136,84 | C57/C57 | 136,92 | 136,92 | C57/C57 | 136,93 | 136,93 | C57/C57 |
| D2Mit 5 | 139,91 | 139,91 | C57/C57 | 139,92 | 139,92 | C57/C57 | 139,91 | 139,91 | C57/C57 |
| D3Mit 193 | 149,92 | 149,92 | C57/C57 | 149,92 | 149,92 | C57/C57 | 149,92 | 149,92 | C57/C57 |
| D4Mit 238 | 109,52 | 139,91 | C57/C57 | 139,92 | 139,92 | C57/C57 | 109,79 | 139,91 | C57/C57 |
| D4Mit 42 | 101,71 | 101,71 | C57/C57 | 101,7 | 101,7 | C57/C57 | 101,62 | 101,62 | C57/C57 |
| D5Mit 25 | 233,96 | 233,96 | C57/C57 | 233,92 | 233,92 | C57/C57 | 234,05 | 234,05 | C57/C57 |
| D5Mit 113 | 100,34 | 100,34 | C57/C57 | 100,34 | 100,34 | C57/C57 | 100,34 | 100,34 | C57/C57 |
| D5Mit 152 | 134,35 | 145,08 | ?/C57 | 134,45 | 149,41 | ?/C57 | 128,43 | 134,43 | ?/C57 |
| D5Mit 374 | 116,01 | 116,01 | C57/C57 | 115,92 | 115,92 | C57/C57 | 116,72 | 116,72 | C57/C57 |
| D6Mit 33 | 139,72 | 139,72 | C57/C57 | 139,73 | 139,73 | C57/C57 | 139,64 | 139,64 | C57/C57 |
| D6Mit 138 | 108,87 | 108,87 | C57/C57 | 108,89 | 108,89 | C57/C57 | 108,89 | 108,89 | C57/C57 |
| D6Mit 199 | 141,53 | 150,39 | C57/C57 | 141,6 | 150,39 | C57/C57 | 141,53 | 150,39 | C57/C57 |
| D6Mit 55 | 110,04 | 110,04 | C57/C57 | 109,98 | 109,98 | C57/C57 | 109,99 | 109,99 | C57/C57 |
| D7Mit 129 | 141,53 | 150,39 | C57/C57 | 141,6 | 150,39 | C57/C57 | 141,53 | 150,39 | C57/C57 |
| D7Mit 152 | 126,8 | 126,8 | C57/C57 | 126,83 | 126,83 | C57/C57 | 126,77 | 126,77 | C57/C57 |
| D7Mit 189 | 132,61 | 132,61 | C57/C57 | 132,76 | 132,76 | C57/C57 | 132,62 | 132,62 | C57/C57 |
| D7Mit 284 | 134,61 | 134,61 | C57/C57 | 134,6 | 134,6 | C57/C57 | 134,65 | 134,65 | C57/C57 |
| D7Mit 52 | 166,3 | 166,3 | C57/C57 | 166,39 | 166,39 | C57/C57 | 166,31 | 166,31 | C57/C57 |
| D8Mit 155 | 149,4 | 149,4 | C57/C57 | 149,41 | 149,41 | C57/C57 | 149,4 | 149,4 | C57/C57 |
| D8Mit 166 | 118,84 | 118,84 | C57/C57 | 118,73 | 118,73 | C57/C57 | 118,73 | 118,73 | C57/C57 |
| D8Mit 93 | 168,55 | 168,55 | C57/C57 | 168,62 | 168,62 | C57/C57 | 168,57 | 168,57 | C57/C57 |
| D9Mit 286 | 109,77 | 109,77 | C57/C57 | 109,75 | 109,75 | C57/C57 | 109,77 | 109,77 | C57/C57 |
| D9Mit 90 | 132,53 | 132,53 | C57 2/C57 2 | 132,51 | 132,51 | C57 2/C57 2 | 132,54 | 132,54 | C57 2/C57 2 |
| D10Mit 86 | 156,1 | 156,1 | C57/C57 | 156,16 | 156,16 | C57/C57 | 156,12 | 156,12 | C57/C57 |
| D10Mit 152 | 141,53 | 150,39 | C57/C57 | 141,6 | 150,39 | C57/C57 | 141,53 | 150,39 | C57/C57 |
| D10Mit 180 | 132,61 | 132,61 | C57/C57 | 132,76 | 132,76 | C57/C57 | 132,62 | 132,62 | C57/C57 |
| D10Mit 205 | 118,93 | 118,93 | C57/C57 | 118,88 | 134,51 | C57/129 Sv* | 118,96 | 118,96 | C57/C57 |
| D10Mit 31 | 152,71 | 152,71 | C57/C57 | 152,79 | 152,79 | C57/C57 | 152,77 | 152,77 | C57/C57 |
| D11Mit 270 | 123,2 | 123,2 | C57/C57 | 111,5 | 123,25 | 129 Sv/C57* | 123,15 | 123,15 | C57/C57 |
| D11Mit 320 | 167,15 | 260,37 | C57/C57 | 167,07 | 260,27 | C57/C57 | 167,13 | 260,4 | C57/C57 |
| D11Mit 71 | 215,3 | 215,3 | C57/C57 | 215,39 | 215,39 | C57/C57 | 215,29 | 215,29 | C57/C57 |
| D12Mit 60 | 145,08 | 149,4 | C57/C57 | 149,41 | 149,41 | C57/C57 | 149,4 | 149,4 | C57/C57 |
| D12Mit 99 | 151,57 | 151,57 | C57/C57 | 151,49 | 151,49 | C57/C57 | |||
| D13Mit 151 | 130,87 | 130,87 | C57/C57 | 130,95 | 130,95 | C57/C57 | 130,95 | 196,86 | C57/C57 |
| D13Mit 236 | 95,95 | 95,95 | C57/C57 | 96,03 | 96,03 | C57/C57 | 85,92 | 95,95 | 129 Sv/C57* |
| D13Mit 97 | 152,27 | 152,27 | C57/C57 | 152,27 | 152,27 | C57/C57 | 152,2 | 152,2 | C57/C57 |
| D14Mit 192 | 263,07 | 263,07 | C57/C57 | 262,98 | 262,98 | C57/C57 | 262,96 | 262,96 | C57/C57 |
| D14Mit 99 | 123,73 | 123,73 | C57/C57 | 123,73 | 123,73 | C57/C57 | 123,76 | 123,76 | C57/C57 |
| D15Mit 12 | 151,57 | 151,57 | C57/C57 | 151,57 | 151,57 | C57/C57 | 151,5 | 151,5 | C57/C57 |
| D15Mit 8 | 132,61 | 160,08 | C57/C57 | 132,76 | 160,15 | C57/C57 | 132,62 | 160,15 | C57/C57 |
| D16Mit 152 | 107,38 | 107,38 | C57/C57 | 107,43 | 107,43 | C57/C57 | 107,37 | 107,37 | C57/C57 |
| D16Mit 106 | 152,71 | 152,71 | C57/C57 | 152,79 | 152,79 | C57/C57 | 152,77 | 152,77 | C57/C57 |
| D16Mit 4 | 130,87 | 130,87 | C57/C57 | 130,95 | 130,95 | C57/C57 | 130,95 | 130,95 | C57/C57 |
| D17Mit 129 | 149,4 | 149,4 | C57/C57 | 149,57 | 149,57 | C57/C57 | 149,57 | 149,57 | C57/C57 |
| D17Mit 164 | 132,18 | 132,18 | C57/C57 | 132,17 | 132,17 | C57/C57 | 132,17 | 132,17 | C57/C57 |
| D17Mit 176 | 170,2 | 170,2 | C57/C57 | 170,17 | 170,17 | C57/C57 | 170,28 | 170,28 | C57/C57 |
| D17Mit 93 | 156,23 | 156,23 | C57/C57 | 156,31 | 156,31 | C57/C57 | 156,27 | 156,27 | C57/C57 |
| D18Mit 19 | 153,72 | 153,72 | C57/C57 | 153,65 | 153,65 | C57/C57 | 153,71 | 153,71 | C57/C57 |
| D18Mit 25 | 123,86 | 127,29 | ?/C57 | 123,78 | 127,2 | ?/C57 | 123,78 | 127,22 | ?/C57 |
| D18Mit 23 | 145,08 | 145,08 | C57/C57 | 145,02 | 145,02 | C57/C57 | 145,08 | 145,08 | C57/C57 |
| D18Mit 33 | 140,45 | 140,45 | C57/C57 | 140,46 | 140,46 | C57/C57 | 140,45 | 140,45 | C57/C57 |
| D19Mit 119 | 260,37 | 260,37 | C57/C57 | 260,27 | 260,27 | C57/C57 | 260,4 | 260,4 | C57/C57 |
| D19Mit 78 | 136,01 | 136,01 | C57/C57 | 135,92 | 135,92 | C57/C57 | 135,93 | 135,93 | C57/C57 |
| D19Mit 91 | 108,61 | 108,61 | C57/C57 | 108,63 | 108,63 | C57/C57 | 108,64 | 108,64 | C57/C57 |
| DXMit 222 | 170,2 | 170,2 | C57/C57 | 170,17 | 170,17 | C57/C57 | 170,28 | 170,28 | C57/C57 |
| DXMit 62 | 124,58 | 124,58 | C57/C57 | 124,39 | 124,39 | C57/C57 | 124,46 | 124,46 | C57/C57 |
| DXMit 149 | 276 | 276 | C57/C57 | 276,37 | 276,37 | C57/C57 | 276,18 | 276,18 | C57/C57 |
Numbers listed under Peak 1 and Peak 2 indicate the fragment length (in base pairs) of the bands amplified by each primer pair. Blank spaces indicate no PCR product. Fragment lengths that could not be assigned to any characterized mouse strain are indicated as “?”. The vast majority of the 59 markers tested (all except the three positions marked *) showed homozygosity for the B6 genotype (C57/C57).
Anatomic analysis: distribution of septohippocampal neurons in the MS
We analyzed the distribution of septohippocampal projection neurons after intrahippocampal injections of the retrograde fluorescent tracer FG in the different mouse strains, including the mutants. As shown in Figure 2 (middle columns), the overall distribution of septohippocampal projection neurons resembles the pattern observed in rats (Naumann et al., 1992), regardless of malformations or partial lack of the corpus callosum. Especially in animals with an Sv129 genetic background, a reduction of fiber crossing between the two hemispheres was often observed. In several cases (primarily in the congenic B6 strains), we also found variable locations of the fimbria-fornix bundle in our serial sections through the caudal region of the medial septum/diagonal band (MSDB) complex. These observations were made both in mutant animals and in their wild-type littermates, suggesting that these malformations are a characteristic feature in a given background (Wahlsten, 1982; Bentivoglio et al., 1994; Wahlsten and Bulman-Fleming, 1994) rather than induced by the mutations in thep75NTR locus (Peterson et al., 1999). In all animals investigated, we first analyzed the distribution of FG-labeled neurons along the rostrocaudal extent of the septal complex (Fig. 2, middle columns). Subsequently, the same sections were processed with an antibody against p75NTR or ChAT (Fig. 2, right columns), specific markers for cholinergic MSDB neurons (Li et al., 1995). We found that in all mouse strains examined, the distribution of MSDB neurons (Fig. 2, middle columns) that were positive for both p75NTR and ChAT was similar to that of the FG-labeled neurons (Fig. 2, right columns). Hence, our region of interest (Fig. 2, gray areas in the left columns) for the quantitative analysis of the number of cholinergic neurons can be accurately defined by these three markers.
A striking feature of the different mouse strains, as well as of individuals of the same strain, was the variable location of the MSDB complex along the rostrocaudal axis. This is illustrated in Figure 3, which shows marked differences in the location of the MS region in the forebrain in four representative, different strains. These variations were most pronounced in the Sv129/BALB/c background of P15 animals and were maintained in part into adulthood. Therefore, traditional anatomic landmarks and stereological coordinates cannot be used to define the exact location of the MS. For example, criteria based on classic landmarks such as “complete crossing of the corpus callosum” (Fig.3, c.c.) for the first frontal section of a septal series would result in the loss of sections containing parts of the MS, thus yielding artificially reduced cell counts.
Variability of cholinergic MS neurons in the wild-type strains
During the course of our studies, we also realized that the wild-type littermate groups corresponding to different lines were not identical with regard to the number of neurons in the MS (Albanese et al., 1985; Bentivoglio et al., 1994). Figure 4 shows mean values of ChAT-immunoreactive MS neurons counted with the OF method in the entire septum of 10 mice of each wild-type class. The largest number (3845 ± 660) corresponds to the wild-type class of thep75exonIII line in a mixed background, which also corresponds to the strain with the highest Sv129 content. In contrast, the lowest number (2402 ± 188) corresponds to the wild-type mice of the p75exonIV(B6) line, with a practically 100% B6 content. Likewise, the congenicp75exonIII(B6) wild-type mice contain a number of ChAT-immunoreactive MS neurons (2674 ± 286) that are very similar to those seen for the inbred pure B6 mice (2892 ± 484). Two strains with intermediate, mixed Sv129/B6 genetic backgrounds that were generated with different clones of Sv129 ES cells yield intermediate numbers of cholinergic neurons (R1, 3471 ± 574; J1, 3291 ± 619). From this analysis, then, we conclude that the B6 genetic background contributes significantly to lowering the numbers of ChAT-immunoreactive MS neurons (also see next section). In view of these and previous results (Schwegler et al., 1996), it became apparent that a conclusive analysis of cholinergic neurons requires comparison of mutant animals with wild-type littermates of the same line.
Effects of the p75exonIII andp75exonIV mutations on the number of cholinergic MS neurons at P15
Ten wild-type and 10 homozygous mutant mice were analyzed at P15 for each p75NTR mutant line in its original background. This age was selected in light of the largest differences observed in p75exonIII mutants in a previous report (Van der Zee et al., 1996). We found that thep75exonIII mutation in its original SV129/BALB/c background leads to only a slight, 6.5% increase in the number of MS cholinergic neurons, whereas the same analysis performed in the mixed-background p75exonIV line reveals that mutant septal regions contain 22% more neurons than their wild-type littermates (Fig. 5).
To further investigate the effect of thep75exonIII mutation in the mixed background, we compared the numbers obtained in individual litters (Fig. 3, Sv129/BALB/c, different colors). This analysis revealed that the effect of targeting exon III of thep75NTR gene is so subtle that opposing conclusions can be drawn if the number of mice analyzed is too small. Although some differences could be observed within individual litters between p75exonIII mutants (Fig. 3,top left panel) and their wild-type littermates (Fig. 3,top left panel), no difference could be found when all data for n = 10 mice of each genotype were pooled. This was primarily attributable to high SD in this group (compare with Fig. 5).
To eliminate the possible effects of two different genetic backgrounds, the same analysis was performed in the two corresponding congenic B6 strains. Here, the p75exonIII mutant mice exhibited a 13% increase over their wild-type littermates, exactly two times the increase observed in the mixed genetic background. In contrast, p75exonIV mutant mice show an increase of 22% (mixed background) or 28% (B6) with respect to their wild-type littermate controls. In agreement with our observation comparing different wild-type strains, the variability among individuals of the same group was always lower in the congenic B6 strains than in mixed backgrounds (Fig. 5).
Statistical analysis (three-way ANOVA) of these data led to the following conclusions at P15: (1) the genetic background of the mouse (regardless of mutant or wild type) exerts a significant effect (p < 0.0001) on the number of cholinergic MS neurons, (2) both mutations in the p75NTRlocus (regardless of which exon was targeted) significantly (p < 0.0001) increase this number, and finally, (3) the type of mutation (p75exonIII/p75exonIV) significantly (p < 0.05) influences this increase.
Late effects of both p75NTRmutations on the number of MS cholinergic neurons
We were then interested to see whether the increase in the number of cholinergic neurons determined at P15 would persist with age. Because the largest differences at P15 had been observed in the B6 background, we quantified the effects at 3 months of age in B6 mice. Between P15 and 3 months, there is a slight increase in the number of ChAT-immunoreactive MS neurons in wild-type animals of both mutant lines: from 2674 ± 286 to 2808 ± 327 for thep75exonIII mutation and from 2402 ± 188 to 2520 ± 329 for the p75exonIVmutation (Fig. 6). This is in agreement with counts performed in the inbred C57BL/6 strain at P15 and 3 months of age, when no major changes were observed (data not shown). In contrast, the number of MS cholinergic neurons shows a tendency to decrease in bothp75NTR mutants: from 3026 ± 328 (P15) to 2963 ± 271 (3 months) for thep75exonIII mutation and from 3082 ± 258 (P15) to 2796 ± 418 (3 months) for thep75exonIV mutation. There are 5.5% more cholinergic neurons in the p75exonIIImutants than in their wild-type littermates, and 11% more forp75exonIV mutants.
Statistical analysis (three-way ANOVA) of these data revealed that (1) the age of the animal significantly (p < 0.0001) influences the number of cholinergic neurons and that (2) the difference between wild-type and mutants (regardless of which exon was targeted) is maintained (p < 0.0026). The differential effects of the two mutations, however, are now less pronounced (p < 0.0661).
The accumulation of the s-p75NTR transcript is strain dependent
Because the only difference betweenp75exonIII andp75exonIV mutants at the molecular level is the presence of a residual s-p75NTRtranscript in the former mice, we tested whether the strain-dependent phenotype observed in the MS could be correlated with strain-dependent levels of spliced transcript. Reverse transcription-PCR analysis performed with whole-brain RNA shows that at P15, the s-p75NTR variant is more abundant in Sv129 mice than in their B6 counterparts, whereas the levels of FL-p75NTR transcript in whole brain are comparable among mice of both strains. At P15, the MS is one of the brain regions with the highest accumulation levels of s-p75NTR and one of the regions where its higher expression levels in Sv129 background can be most clearly seen (Fig. 7).
Fig. 7.

Differential expression of the s-p75NTR isoform in different genetic backgrounds. The accumulation of the s-p75NTR mRNA was analyzed by reverse transcription-PCR in P15 whole brains and in MS from B6 and Sv129 mice. Unlike the FL-p75NTR mRNA, which accumulates at comparable levels in both strains, in whole brain the s-p75NTR transcript accumulates at much higher levels in Sv129 than in B6 animals. Shown here are the results from the MS (pooled from 5 mice of each strain), in which s-p75NTR accumulates at >10-fold higher levels in the Sv129 background.
DISCUSSION
The main result of our study is that mice lacking p75NTR have significantly more cholinergic neurons in the MS. This result is in line with previous reports demonstrating that one of the functions of p75NTR is to cause cell death during development, as reported previously in the developing retina and the spinal cord as well as in peripheral sympathetic ganglia (Frade et al., 1996; Bamji et al., 1998; Frade and Barde, 1999). Because the role of p75NTR in the development of basal forebrain cholinergic neurons has been analyzed in previous studies that led to contradictory results (see the introductory remarks), the most likely reasons for these discrepancies are discussed below.
Distribution of cholinergic septal neurons in the MS and influence of genetic background
A major difficulty encountered when comparing previous results is that the region of interest, the MS nucleus, has often been determined on the basis of somewhat subjective criteria. The septal region is composed of several different nuclei, and it is heterogeneous with regard to its neuronal composition and connectivity. Moreover, the cholinergic neurons represent only a small fraction of the neurons in the MSDB complex. Because it was unclear whether in the mouse, as established previously in the rat (Sofroniew et al., 1987, 1990), most cholinergic MS neurons would project to the hippocampal formation, we analyzed their projections in mice of all genotypes using FG back-tracing. A strong overlap between the distribution of back-labeled, large magnocellular neurons and neurons immunoreactive for both p75NTR and ChAT could be observed in all mouse strains. Although these experiments also revealed that the anatomy of the MSDB is very similar regardless of the strain investigated, the dimension of the region containing FG back-labeled neurons varied substantially along the rostrocaudal axis. Therefore, traditional anatomic landmarks and stereological coordinates cannot be used to define the exact location of the MS. To define the total area of the region of interest and its reference volume, we avoided the use of “classic” anatomic boundaries of the septal complex, such as the corpus callosum, the ventral surface of the brain, and “straight lines” drawn from the ventral tips of the lateral ventricles to the ventral surface of the brain (Peterson et al., 1999). Whereas the boundaries of the MSDB region to lateral and dorsal nuclei of the septal complex can be easily marked using version 3 of the Stereo Investigator Software, any delineation of the MS against the DB tends to be arbitrary (Jakab and Leranth, 1995), because neurons of the MSDB form a continuum and are the rostral part of the large basal forebrain region. Therefore, we delineated the MS against the DB by a horizontal line connecting the edges of the anterior commissure, as shown in Figure 2.
Cholinergic neurons were also regularly found in the neighboring lateral septal nucleus. Although rather small, they sometimes form dense clusters, and nearly all of them are negative when stained with p75NTR antibodies. In contrast, adjacent telencephalic nuclei located more ventrocaudally (Fig. 2, position 16) contain ChAT-immunoreactive neurons that are also p75NTR-immunopositive; however, they do not belong to the MS nucleus. All of these neurons may have been included, at least partially, in some of the previous studies. Using our criteria, and despite the rostrocaudal variability seen between different animals, we found that the MS region of P15 mice consistently yielded a total of 22–24 consecutive frontal vibratome sections. A slightly higher number of frontal sections was obtained from 3-month-old animals, which was in line with a slight increase of the reference volume observed with increasing age.
A major outcome of our investigations in wild-type animals is that the number of cholinergic neurons in the MS strongly depends on the genetic background. We found that at P15, pure B6 animals have ∼33% fewer cholinergic neurons than Sv129 animals (Fig. 4). This background-dependent effect is in fact larger than the largest difference we observed with the p75NTRmutant animals (see below).
The p75exonIV mutation leads to larger increases of cholinergic neurons than thep75exonIII mutation
As we observed previously in the peripheral nervous system (von Schack et al., 2001), the p75exonIVmutation has a significantly higher impact on the number of MS cholinergic neurons than the p75exonIIImutation. The higher degree of variability among individual animals carrying the p75exonIII mutation, especially in their original genetic background, also parallels the variability found in counts of sensory neurons (von Schack et al., 2001). Both the variability and the relatively small effects may have obscured the interpretation of previous studies, all performed with the p75exonIII mutation. In contrast, the p75exonIV mutation displays a robust phenotype that is largely independent of the genetic background. Because the major difference is that thep75exonIII mutation allows residual expression of the s-p75NTR isoform, it is possible that s-p75NTR partially compensates for the lack of FL-p75NTR. Indeed, the cytoplasmic domain of p75NTR, although expressed at much reduced levels compared with wild-type animals, is still intact and most likely still binds the various cytoplasmic interactors of p75NTR and interacts with Trk receptors (Bibel et al., 1999; von Schack et al., 2001; for review, see Bibel and Barde, 2000). It is therefore of interest that s-p75NTR is present at substantially higher levels in the Sv129 background compared with the B6 brain. This may contribute to explaining why the increase in MS cholinergic neurons is smaller in the Sv129 background than in the congenic B6 strain. This reasoning would imply that the effects of thep75exonIV mutation, which completely abolishes expression of s-p75NTR, should not depend on genetic background. In line with this, the mixed B6/Sv129 strain does indeed show an effect of comparable magnitude to that seen in the congenic B6 strain.
Because previous experiments indicate that p75NTR can cause cell death (Casaccia-Bonnefil et al., 1996; Frade et al., 1996; Bamji et al., 1998; Yoon et al., 1998; Frade and Barde, 1999), it appears likely that the explanation for the increased number of cholinergic neurons is a reduction in cell death. Also, previous work has demonstrated that overexpression of the intracellular domain of p75NTR leads to massive cell death throughout the CNS (Majdan et al., 1997). This is strong evidence that the cytoplasmic domain of p75NTR has a substantial death potential for CNS neurons and would be consistent with our interpretation that the complete elimination of the receptor, including its cytoplasmic domain, decreases cell death. How p75NTR causes cell death is still not understood in detail, but at least one of the interactors of p75NTR, the neurotrophin receptor interacting factor protein, has been shown to be involved in cell death in the developing CNS (Casademunt et al., 1999). It is also possible that the complete lack of p75NTR increases the efficiency of signaling through TrkA. TrkA is coexpressed with p75NTR in most cholinergic neurons, and TrkA−/− mice have reduced numbers of MS cholinergic neurons (Fagan et al., 1997). In this context, it is worth noting that both full-length and s-p75NTR and Trk receptors interact (Bibel et al., 1999; von Schack et al., 2001), and there is evidence that p75NTR decreases Trk signaling (for review, see Kaplan and Miller, 1997; Bibel and Barde, 2000).
In conclusion, our results show that the complete absence of p75NTR leads to a persistent increase in the number of cholinergic neurons in the MS of the mouse. Given the significance of cholinergic forebrain neurons in learning and memory processes and their degeneration in Alzheimer's disease, our results indicate that a cell-surface receptor expressed at comparatively high levels by these neurons may be an interesting target with regard to the modulation of the survival of these neurons.
T.N. and E.C. contributed equally to this study.
This study was supported by the Deutsche Forschungsgemeinschaft (A1, SFB 505) and the European Union (projects PL960024 and QLRT-1999-00602 to Y.B.). We thank Dr. J. Schulte-Mönting (Institute for Medical Informatics, University of Freiburg) for statistical analysis and O. Segun for management of our mouse colony.
Correspondence should be addressed to Dr. Thomas Naumann, Institute of Anatomy I, Albertstraße 17, D-79104 Freiburg, Germany. E-mail:naumannt@uni-freiburg.de.
Y.-A. Barde's present address: Friedrich Miescher Institute for Biomedical Research, Maulbeerstraße 66, CH-4058 Basel, Switzerland.
REFERENCES
- 1.Albanese A, Gozzo S, Iacopino C, Altavista MC. Strain-dependent variations in the number of forebrain cholinergic neurons. Brain Res. 1985;334:380–384. doi: 10.1016/0006-8993(85)90237-9. [DOI] [PubMed] [Google Scholar]
- 2.Bamji SX, Majdan M, Pozniak CD, Belliveau DJ, Aloyz R, Kohn J, Causing CG, Miller FD. The p75 neurotrophin receptor mediates neuronal apoptosis and is essential for naturally occurring sympathetic neuron death. J Cell Biol. 1998;140:911–923. doi: 10.1083/jcb.140.4.911. [DOI] [PMC free article] [PubMed] [Google Scholar]
- 3.Bartus RT, Dean RL, Beer B, Lippa AS. The cholinergic hypothesis of geriatric memory dysfunction. Science. 1982;217:408–414. doi: 10.1126/science.7046051. [DOI] [PubMed] [Google Scholar]
- 4.Bentivoglio AR, Altavista MC, Granata R, Albanese A. Genetically determined cholinergic deficiency in the forebrain of C57BL/6 mice. Brain Res. 1994;637:181–189. doi: 10.1016/0006-8993(94)91231-9. [DOI] [PubMed] [Google Scholar]
- 5.Bibel M, Barde Y-A. Neurotrophins: key regulators of cell fate and cell shape in the vertebrate nervous system. Genes Dev. 2000;14:2919–2937. doi: 10.1101/gad.841400. [DOI] [PubMed] [Google Scholar]
- 6.Bibel M, Hoppe E, Barde Y-A. Biochemical and functional interactions between the neurotrophin receptors trk and p75NTR. EMBO J. 1999;18:616–622. doi: 10.1093/emboj/18.3.616. [DOI] [PMC free article] [PubMed] [Google Scholar]
- 7.Casaccia-Bonnefil P, Carter BD, Dobrowsky RT, Chao MV. Death of oligodendrocytes mediated by the interaction of nerve growth factor with its receptor p75. Nature. 1996;383:716–719. doi: 10.1038/383716a0. [DOI] [PubMed] [Google Scholar]
- 8.Casademunt E, Carter BD, Benzel I, Frade JM, Dechant G, Barde Y-A. The zinc finger protein NRIF interacts with the neurotrophin receptor p75(NTR) and participates in programmed cell death. EMBO J. 1999;18:6050–6061. doi: 10.1093/emboj/18.21.6050. [DOI] [PMC free article] [PubMed] [Google Scholar]
- 9.Coyle JT, Price DL, DeLong MR. Alzheimer's disease: a disorder of cortical cholinergic innervation. Science. 1983;219:1184–1190. doi: 10.1126/science.6338589. [DOI] [PubMed] [Google Scholar]
- 10.Fagan AM, Garber M, Barbacid M, Silos-Santiago I, Holtzman DM. A role for TrkA during maturation of striatal and basal forebrain cholinergic neurons in vivo. J Neurosci. 1997;17:7644–7654. doi: 10.1523/JNEUROSCI.17-20-07644.1997. [DOI] [PMC free article] [PubMed] [Google Scholar]
- 11.Fischer W, Wictorin K, Björklund A, Williams LR, Varon S, Gage FH. Amelioration of cholinergic neuron atrophy and spatial memory impairment in aged rats by nerve growth factor. Nature. 1987;329:65–68. doi: 10.1038/329065a0. [DOI] [PubMed] [Google Scholar]
- 12.Frade JM, Barde Y-A. Genetic evidence for cell death mediated by nerve growth factor and the neurotrophin receptor p75 in the developing mouse retina and spinal cord. Development. 1999;126:683–690. doi: 10.1242/dev.126.4.683. [DOI] [PubMed] [Google Scholar]
- 13.Frade JM, Rodriguez-Tébar A, Barde Y-A. Induction of cell death by endogenous nerve growth factor through its p75 receptor. Nature. 1996;383:166–168. doi: 10.1038/383166a0. [DOI] [PubMed] [Google Scholar]
- 14.Franklin KB, Paxinos G. The mouse brain. Academic; San Diego: 1997. [Google Scholar]
- 15.Green MC, Witham BA. Handbook of genetically standardized JAX mice. The Jackson Laboratory; Bar Harbor, ME: 1991. [Google Scholar]
- 16.Greferath U, Bennie A, Kourakis A, Bartlett PF, Murphy M, Barrett GL. Enlarged cholinergic forebrain neurons and improved spatial learning in p75 knockout mice. Eur J Neurosci. 2000;12:885–893. doi: 10.1046/j.1460-9568.2000.00976.x. [DOI] [PubMed] [Google Scholar]
- 17.Hagg T. Neuronal cell death: retraction. Science. 1999;285:340. doi: 10.1126/science.285.5426.337h. [DOI] [PubMed] [Google Scholar]
- 18.Hagg T, Louis J-C, Longo FM, Varon S. Neurotrophic factors, growth factors, and central nervous system trauma. In: Salzman SK, Faden IA, editors. The neurobiology of the central nervous system trauma. Oxford UP; Oxford: 1994. pp. 245–265. [Google Scholar]
- 19.Hagg T, Van der Zee CEEM, Ross GM, Riopelle RJ. Basal forebrain neuronal loss in mice lacking neurotrophin receptor p75. Science. 1997;277:838–839. doi: 10.1126/science.277.5327.837. [DOI] [PubMed] [Google Scholar]
- 20.Hefti F. Nerve growth factor promotes survival of septal cholinergic neurons after fimbrial transections. J Neurosci. 1986;6:2155–2162. doi: 10.1523/JNEUROSCI.06-08-02155.1986. [DOI] [PMC free article] [PubMed] [Google Scholar]
- 21.Jakab RL, Leranth C. Septum. In: Paxinos G, editor. The rat nervous system. Academic; Oxford: 1995. pp. 405–442. [Google Scholar]
- 22.Kaplan DR, Miller FD. Signal transduction by the neurotrophin receptors. Curr Opin Cell Biol. 1997;9:213–221. doi: 10.1016/s0955-0674(97)80065-8. [DOI] [PubMed] [Google Scholar]
- 23.Lee KF, Li E, Huber LJ, Landis SC, Sharpe AH, Chao MV, Jaenisch R. Targeted mutation of the gene encoding the low affinity NGF receptor p75 leads to deficits in the peripheral sensory nervous system. Cell. 1992;69:737–749. doi: 10.1016/0092-8674(92)90286-l. [DOI] [PubMed] [Google Scholar]
- 24.Li Y, Holtzman DM, Kromer LF, Kaplan DR, Chua-Couzens J, Clary DO, Knusel B, Mobley WC. Regulation of TrkA and ChAT expression in developing rat basal forebrain: evidence that both exogenous and endogenous NGF regulate differentiation of cholinergic neurons. J Neurosci. 1995;15:2888–2905. doi: 10.1523/JNEUROSCI.15-04-02888.1995. [DOI] [PMC free article] [PubMed] [Google Scholar]
- 25.Lucidi-Phillipi CA, Clary DO, Reichardt LF, Gage FH. TrkA activation is sufficient to rescue axotomized cholinergic neurons. Neuron. 1996;16:653–663. doi: 10.1016/s0896-6273(00)80084-7. [DOI] [PMC free article] [PubMed] [Google Scholar]
- 26.Majdan M, Lachance C, Gloster A, Aloyz R, Zeindler C, Bamji S, Bhakar A, Belliveau D, Fawcett J, Miller FD, Barker PA. Transgenic mice expressing the intracellular domain of the p75 neurotrophin receptor undergo neuronal apoptosis. J Neurosci. 1997;17:6988–6998. doi: 10.1523/JNEUROSCI.17-18-06988.1997. [DOI] [PMC free article] [PubMed] [Google Scholar]
- 27.Naumann T, Linke R, Frotscher M. Fine structure of rat septohippocampal neurons. I. Identification of septohippocampal projection neurons by retrograde tracing combined with electron microscopic immunocytochemistry and intracellular staining. J Comp Neurol. 1992;325:207–218. doi: 10.1002/cne.903250206. [DOI] [PubMed] [Google Scholar]
- 28.Naumann T, Kermer P, Frotscher M. Fine structure of rat septohippocampal neurons. III. Recovery of choline acetyltransferase immunoreactivity after fimbria-fornix transection. J Comp Neurol. 1994;350:161–170. doi: 10.1002/cne.903500202. [DOI] [PubMed] [Google Scholar]
- 29.Naumann T, Straube A, Frotscher M. Recovery of ChAT immunoreactivity in axotomized rat cholinergic septal neurons despite reduced NGF receptor expression. Eur J Neurosci. 1997;9:1340–1349. doi: 10.1111/j.1460-9568.1997.tb01488.x. [DOI] [PubMed] [Google Scholar]
- 30.Perry E, Walker M, Grace J, Perry R. Acetylcholine in mind: a neurotransmitter correlate of consciousness? Trends Neurosci. 1999;6:273–280. doi: 10.1016/s0166-2236(98)01361-7. [DOI] [PubMed] [Google Scholar]
- 31.Peterson DA, Leppert JT, Lee KF, Gage FH. Basal forebrain neuronal loss in mice lacking neurotrophin receptor p75. Science. 1997;277:837–839. doi: 10.1126/science.277.5327.837. [DOI] [PubMed] [Google Scholar]
- 32.Peterson DA, Dickinson-Anson HA, Leppert JT, Lee KF, Gage FH. Central neuronal loss and behavioral impairment in mice lacking neurotrophin receptor p75. J Comp Neurol. 1999;404:1–20. doi: 10.1002/(sici)1096-9861(19990201)404:1<1::aid-cne1>3.0.co;2-#. [DOI] [PubMed] [Google Scholar]
- 33.Schwegler H, Boldyreva M, Pyrlik-Gohlmann M, Linke R, Wu J, Zilles K. Genetic variation in the morphology of the septo-hippocampal cholinergic and GABAergic system in mice. I. Cholinergic and GABAergic markers. Hippocampus. 1996;6:136–148. doi: 10.1002/(SICI)1098-1063(1996)6:2<136::AID-HIPO5>3.0.CO;2-N. [DOI] [PubMed] [Google Scholar]
- 34.Simpson EM, Linder CC, Sargent EE, Davisson MT, Mobraaten LE, Sharp JJ. Genetic variation among 129 substrains and its importance for targeted mutagenesis in mice. Nat Genet. 1997;16:19–27. doi: 10.1038/ng0597-19. [DOI] [PubMed] [Google Scholar]
- 35.Sofroniew MV, Pearson RC, Powell TP. The cholinergic nuclei of the basal forebrain of the rat: normal structure, development and experimentally induced degeneration. Brain Res. 1987;411:310–331. doi: 10.1016/0006-8993(87)91084-5. [DOI] [PubMed] [Google Scholar]
- 36.Sofroniew MV, Galletly NP, Isacson O, Svendsen CN. Survival of adult basal forebrain cholinergic neurons after loss of target neurons. Science. 1990;247:338–342. doi: 10.1126/science.1688664. [DOI] [PubMed] [Google Scholar]
- 37.Van der Zee CEEM, Ross GM, Riopelle RJ, Hagg T. Survival of cholinergic forebrain neurons in developing p75NGFR-deficient mice. Science. 1996;274:1729–1732. doi: 10.1126/science.274.5293.1729. [DOI] [PubMed] [Google Scholar]
- 38.Vantini G, Schiavo N, Di Martino A, Polato P, Triban C, Callegaro L, Toffano G, Leon A. Evidence for a physiological role of nerve growth factor in the central nervous system of neonatal rats. Neuron. 1989;3:267–273. doi: 10.1016/0896-6273(89)90251-1. [DOI] [PubMed] [Google Scholar]
- 39.von Schack D, Casademunt E, Schweigreiter R, Meyer M, Bibel M, Dechant G. Complete ablation of the neurotrophin receptor p75NTR causes defects both in the nervous and the vascular systems. Nat Neurosci. 2001;4:1–2. doi: 10.1038/nn730. [DOI] [PubMed] [Google Scholar]
- 40.Wahlsten D. Deficiency of corpus callosum varies with strain and supplier of the mice. Brain Res. 1982;239:329–347. doi: 10.1016/0006-8993(82)90513-3. [DOI] [PubMed] [Google Scholar]
- 41.Wahlsten D, Bulman-Fleming B. Retarded growth of the medial septum: a major gene effect in acallosal mice. Dev Brain Res. 1994;77:203–214. doi: 10.1016/0165-3806(94)90197-x. [DOI] [PubMed] [Google Scholar]
- 42.Ward NL, Hagg T. p75(NGFR) and cholinergic neurons in the developing forebrain: a re-examination. Dev Brain Res. 1999;118:79–91. doi: 10.1016/s0165-3806(99)00133-9. [DOI] [PubMed] [Google Scholar]
- 43.West MJ, Slomianka L, Gundersen HJ. Unbiased stereological estimation of the total number of neurons in the subdivisions of the rat hippocampus using the optical fractionator. Anat Rec. 1991;231:482–497. doi: 10.1002/ar.1092310411. [DOI] [PubMed] [Google Scholar]
- 44.Yeo TT, Chua-Couzens J, Butcher LL, Bredesen DE, Cooper JD, Valletta JS, Mobley WC, Longo FM. Absence of p75NTR causes increased basal forebrain cholinergic neuron size, choline acetyltransferase activity, and target innervation. J Neurosci. 1997;17:7594–7605. doi: 10.1523/JNEUROSCI.17-20-07594.1997. [DOI] [PMC free article] [PubMed] [Google Scholar]
- 45.Yoon SO, Casaccia-Bonnefil P, Carter B, Chao MV. Competitive signaling between TrkA and p75 nerve growth factor receptors determines cell survival. J Neurosci. 1998;18:3273–3281. doi: 10.1523/JNEUROSCI.18-09-03273.1998. [DOI] [PMC free article] [PubMed] [Google Scholar]