

Abstract
We investigated the potential role of the α1-containing GABAA receptor in regulating the reinforcing properties of alcohol. To accomplish this, we developed 3-propoxy-β-carboline hydrochloride (3-PBC), a mixed agonist–antagonist benzodiazepine site ligand with binding selectivity at the α1 receptor. We then tested the capacity of 3-PBC to block alcohol-maintained responding in the ventral pallidum (VP), a novel alcohol reward substrate, which primarily expresses the α1-receptor isoform. Our results demonstrated that bilateral microinfusion of 3-PBC (0.5–40 μg) in the anterior and medial VP produced marked reductions in alcohol-maintained responding in a genetically selected rodent model of alcohol drinking. The VP infusions showed both neuroanatomical and reinforcer specificity because no effects were seen in sites dorsal to the VP (e.g., nucleus accumbens, caudate putamen). The saccharin-maintained responding was reduced only with the highest dose (40 μg). Parenteral injections of 3-PBC (1–20 mg/kg) also showed a similar selectivity on alcohol-maintained responding. Complementaryin vitro studies revealed that 3-PBC exhibited a low partial agonist efficacy profile at recombinant diazepam-sensitive receptors (e.g., α1β3γ2, α2β3γ, and α3β3γ2). The selective suppression of 3-PBC on alcohol-maintained responding after central and parenteral administrations, together with its low-efficacy agonist profile, suggest that the reduction in alcohol-maintained behaviors was not attributable to a general suppression on consummatory behaviors. These results demonstrate that the α1-containing GABAA receptors in both the anterior and medial VP are important in regulating the reinforcing properties of alcohol. These receptors represent novel targets in the design and development of pharmacotherapies for alcohol-dependent subjects.
Keywords: alcohol reinforcement, ventral pallidum, GABA, α1 subunit, alcohol-preferring (P) rat, benzodiazepine
An understanding of the neuromechanisms that regulate alcohol drinking is key in the development of drugs to treat alcohol addiction and dependence in humans. In recent years, much evidence has accumulated in favor of the GABA system (Hyytiä and Koob, 1995; June et al., 1998a,b,2001). However, despite the growing body of evidence in favor of the GABA system, much remains unknown about the role of specific GABAA receptor subtypes in regulating ethanol (EtOH) reinforcement. This reflects primarily (1) the paucity of high-affinity and selective ligands capable of discriminating among the GABAA receptor subunits and (2) the heterogeneity of various subunits within the known alcohol reward circuitry (Wisden et al., 1992; Fritschy and Mohler, 1995). Of the potential GABAA receptors involved in the reinforcing properties of alcohol, evidence suggests the α1subtype within the ventral pallidum (VP) may play an important role in regulating alcohol-seeking behaviors. First, the VP contains one of the highest distributions of α1 subunits in the mesolimbic system (Churchill et al., 1991a; Wisden et al., 1992; Turner et al., 1993; Duncan et al., 1995). Second, a dense reciprocal GABAergic projection exists from the VP to the nucleus accumbens (NACC) (Zahm et al., 1985; Groenewegen et al., 1987; Churchill and Kalivas, 1994), a well known substrate that mediates the reinforcing actions of abused drugs (Koob et al., 1998; Koob, 1999). Third, acute EtOH administration has been reported to selectively enhance the effects of iontophoretically applied GABA in the VP; these effects correlate highly with [3H]zolpidem binding (an α1-subtype selective agonist) (Criswell et al., 1993, 1995). Together, the above findings suggest a possible role for the VP α1 receptors in the reinforcing properties of alcohol.
To evaluate the role of the α1 receptor in regulating alcohol reinforcement, we developed 3-propoxy-β-carboline hydrochloride (3-PBC), a mixed benzodiazepine (BDZ) agonist–antagonist with binding selectivity at the α1 receptor. Compared with the prototype BDZ1 agonist zolpidem, 3-PBC exhibits a slightly higher binding selectivity for the α1 receptor (Cox et al., 1998; Huang et al., 2000) (Table1). Preliminary behavioral studies in several species (e.g., rats, mice, and primates) show that 3-PBC is a BDZ antagonist, exhibiting competitive binding-site interactions with BDZ agonists at low to moderate doses (2.5–15 mg/kg) (Cox et al., 1998; Carroll et al., 2001) (J. K. Rowlett, unpublished data). At higher doses (15–60 mg/kg), 3-PBC produces anxiolytic effects in the plus maze that are comparable with those of chlordiazepoxide (Carroll et al., 2001). Hence, 3-PBC displays an agonist or antagonist profile depending on both the dose and the task used. Thus, to determine the capacity of 3-PBC to modulate physiological GABAergic effects, we evaluated its actions at recombinant α1, α2, α3, α4, and α5 receptors. Second, we determined whether thein vitro binding affinity of 3-PBC in wild-type synaptosomal cortical membranes would mimic the actions of 3-PBC at recombinant α1 receptors. Third, we determined the in vivo capacity of 3-PBC to selectively reduce alcohol-maintained responding in a rodent model of the human condition of alcohol abuse after systemic and intra-VP infusions.
Table 1.
Binding affinities at recombinant receptors (αxβ3γ2) for prototypical competitive BDZ antagonists (top) and the currently known α1-subunit-selective ligands (bottom);Ki values in nm1-a
| Compound | α1 | α2 | α3 | α5 | α6 |
|---|---|---|---|---|---|
| ZK 934261-b | 11 | 31 | 24 | 3 | 1600 |
| Ro15-1788 | 0.8 | 0.9 | 1.05 | 0.6 | 148 |
| 3-PBC | 5.3 | 52.3 | 68.8 | 591 | >1000 |
| 3-EBC | 6.43 | 25.1 | ND | 868 | >1000 |
| βCCt | 0.72 | 15 | 18.9 | 111 | >1000 |
| Zolpidem | 26.7 | 156 | 383 | >1000 | >1000 |
| CL 218,872 | 57 | 1964 | 1161 | 561 | >1000 |
| L-838,4171-c | 0.79 | 0.67 | 0.67 | 267 | 2.25 |
ND, Not determined.
I. Pribilla, Schering Labs., unpublished data.
MATERIALS AND METHODS
Subjects. Selectively bred male alcohol-preferring (P) rats (n = 35) from the S48 generation (Lumeng et al., 1995) were obtained from the Alcohol Research Center at Indiana University School of Medicine. All animals were ∼3–4 months of age and weighed between 261 and 381 gm at the beginning of the experiment. Animals were individually housed in wire-mesh stainless steel cages or plastic tubs. The vivarium was maintained at an ambient temperature of 21°C and was on a normal 12 hr light/dark cycle. During the first 2 d of the training phase, the rats were deprived of fluids for 23 hr daily (see below). Thereafter, rats were maintained on food and water ad libitum. All training and experimental sessions took place between 9 A.M. and 4 P.M. The treatment of all subjects was approved by the institutional review board of the School of Science at Indiana University–Purdue University (Indianapolis, IN). All procedures were conducted in strict adherence with the National Institutes of Health Guide for the Care and Use of Laboratory Animals.
Drug and solutions. 3-PBC was synthesized via modification of the prototypical inverse agonist β-carboline-3-carboxylic acid ethyl ester (βCCE), as outlined previously (Cox et al., 1998). The structure of 3-PBC is shown in Figure1. For systemic drug administrations, 3-PBC was prepared as an emulsion in a Tween 20 (Sigma, St. Louis, MO) solution composed of 99.80 ml of a 0.90% sodium chloride solution and 0.20 ml of Tween 20. All drug solutions were mildly sonicated (Fisher Scientific, Springfield, NJ) to aid in dissolving the compound. The Tween 20 vehicle solution was administered as the control injection for the systemic experiment. Systemic injections were given intraperitoneally in an injection volume of 1 ml/kg. For the microinjection studies, 3-PBC was dissolved in artificial CSF (aCSF) (see below).
Fig. 1.

The synthesis and structure of 3-PBC, the α1-selective benzodiazepine antagonist.
Xenopus oocyte expressions assay. Xenopus laevisfrogs were purchased from Xenopus-1 (Dexter, MI). Collagenase B was obtained from Boehringer Mannheim (Indianapolis, IN). GABA was obtained from Research Biochemicals (Natick, MA). All compounds were prepared as a 10 mm stock solution in EtOH and stored at −20°C.
cDNA clones. The rat GABAA receptor α1, α5, and γ2 subunit clones were gifts from H. Luddens (Department of Psychiatry, University of Mainz, Mainz, Germany). The rat GABAA receptor β3subunit clone was a gift from L. Mahan (National Institute of Neurological Disorders and Stroke, Bethesda, MD). Capped cRNA was synthesized from linearized template cDNA encoding the subunits using mMESSAGE mMACHINE kits (Ambion, Austin, TX). Oocytes were injected with the α, β, and γ subunits in a 1:1:1 molar ratio as determined by UV absorbance. Mature X. laevisfrogs were anesthetized by submersion in 0.1% 3-aminobenzoic acid ethyl ester, and oocytes were surgically removed. Follicle cells were removed by treatment with collagenase B for 2 hr. Each oocyte was injected with 50–100 ng of cRNA in 50 nl of water and incubated at 19°C in modified Barth's saline: 88 mm NaCl, 1 mm KCl, 2.4 mmNaHCO3, 0.41 mmCaCl2, 0.82 mmMgSO4, 100 μg/ml gentamicin, and 15 mm HEPES, pH 7.6. Oocytes were recorded 3–10 d after injection. Oocytes were perfused at room temperature in a Warner Instruments (Hamden, CT) oocyte recording chamber model RC-5/18 with perfusion solution (in mm): 115 NaCl, 1.8 CaCl2, 2.5 KCl, 10 HEPES, pH 7.2. The perfusion solution was gravity fed continuously at a rate of 15 ml/min. Compounds were diluted in the perfusion solution and applied until after a peak current was reached. Current responses to GABA application were measured under two-electrode voltage clamp at a holding potential of −60 mV. Data were collected using a GeneClamp 500 amplifier and Axoscope software (Axon Instruments, Foster City, CA). The GABA concentration–response curves for the GABAAreceptor subunit combinations were constructed by normalizing responses to a low concentration of GABA to minimize variability, then renormalized to the maximal response for comparison. Concentration–response data were fitted to a four-parameter logistic using GraphPad Prizm (GraphPad Software Inc., San Diego, CA), and the EC50 for each receptor subtype was determined. Peak whole-cell current responses of a voltage-clamped oocyte to an EC50 concentration of GABA in the presence of saturating (1–10 μm) concentrations of modulators are reported as a percentage of the peak response to GABA alone (“percentage of GABA response” or “percentage of control”).
Radioligand binding.[3H]Diazepam binding to rat cerebral cortical membranes was accomplished using a modification of a method described previously (Cox et al., 1998). In brief, rats were killed by decapitation and the cerebral cortex of each rat was removed. Tissue was disrupted in 100 volumes of Tris-HCl buffer (50 mm, pH 7.4) with Polytron (15 sec at setting 6–7) (Brinkman Instruments, Westbury, NY) and centrifuged at 4°C for 20 min at 2000 × g. The tissue was resuspended in an equal volume of buffer and recentrifuged. This procedure was repeated three times; the tissue was resuspended in 50 volumes of buffer. Incubations (1 ml) consisted of tissue (0.3 ml), drug solution (0.1 ml), buffer (0.5 ml), and radioligand (0.1 ml). Incubations (4°C) were initiated by the addition of [3H]diazepam (final concentration, 2 mm; specific activity, 76 Ci/mmol) (DuPont NEN, Boston, MA) and terminated after 120 min by rapid filtration through GF/B filters and washing with two 5 ml aliquots of ice-cold buffer with a Brandel (Gaithersburg, MD) M-24R filtering manifold. Nonspecific binding was determined by substituting nonradioactive flunitrazepam (final concentration, 10 μm) for the drug solution; it represented <10% of the total binding. Specific binding was defined as the difference in binding obtained in the presence and absence of 10 μm flunitrazepam. The IC50 values were estimated using Hill plots.
Behavioral testing apparatus and training procedures.Behavioral testing was conducted in 15 standard operant chambers (Coulbourn Instruments, Allentown, PA) equipped with two removable levers and two dipper fluid-delivery systems enclosed in sound-attenuated cubicles as described previously (June et al., 1998a,b). A concurrent fixed-ratio (FR) schedule was used to investigate the capacity of systemic and direct microinjections of 3-PBC in the CNS to modify the EtOH- and saccharin-maintained responses. In brief, rats were initially trained to self-administer EtOH and water orally in daily 60 min sessions on a concurrent FR1 schedule. After a period of stabilization on the FR1 schedule, the response requirement was increased to a concurrent FR4 schedule. After stabilization on the FR4 schedule, a series of preliminary studies was conducted to determine the saccharin concentration that produced response rates and profiles similar to that of EtOH (10% v/v). Of the saccharin concentrations tested (0.015–0.10% w/v), the 0.05% w/v concentration produced response rates and profiles of response that were similar to those for EtOH. Stabilization on the concurrent FR4 schedule for EtOH and the 0.05% w/v saccharin concentration was then conducted for 3–4 additional weeks before beginning the drug-treatment phase. Responses were considered stable when they were within ±20% of the average responses for 5 consecutive days. The position of the levers and associated dippers for each reinforcer was alternated on each session to control for the establishment of lever preference under all concurrent schedules. Previously, several researchers have discussed the importance of alternative and concurrently presented reinforcers in examining the positive reinforcing properties of drugs of abuse (Heyman and Oldfather, 1992; Meisch and Lemaire, 1993; June et al., 1999).
Parenteral drug treatment procedures. 3-PBC was administered intraperitoneally 15 min before the operant session to allow for optimal absorption and distribution to the CNS. 3-PBC was tested at doses of 1–10 mg/kg. The duration of the operant sessions was 60 min; however, subjects were tested at 24 and 48 hr after drug administration to determine any residual drug effects. A minimum of 72 and a maximum of 96 hr were allocated between drug treatments to permit animals to return to baseline levels. This period prevented the confounding of drug treatments attributable to residual effects. All systemic drug treatments were administered in a randomized design; all rats received a total of five intraperitoneal injections.
Surgery and microinfusion procedures. Chronic guide cannulas were stereotaxically implanted bilaterally in the anterior [anteroposterior (AP), +0.48; mediolateral (ML), ±1.6; dorsoventral (DV), −7.2, with 6° lateral angle; n = 8] and medial (AP, −0.26; ML, ±2.5; DV, −7.0; n = 6) VP. The neuroanatomical control rats were bilaterally implanted in either the caudate putamen (CPu) or the NACC. The coordinates for the caudate putamen were AP, +1.5; ML, ±2.5; and DV, −4.2 (n = 3). In the NACC group, some rats were implanted in the shell (AP, +1.4; ML, ±0.8; DV, −6.0; n = 3) and others were implanted in the core (AP, +1.4; ML, ±1.7; DV, −5.7;n = 3). All coordinates are given in millimeters relative to the Bregma, based on the atlas of Paxinos and Watson (1998). In experimental and control animals, the cannulas were aimed 1 mm above the intended brain loci. Subjects were given 7 d to recover from surgery before returning to training in the operant chamber. The 3-PBC infusions were delivered immediately before the operant session with a Harvard infusion pump (Harvard Apparatus, Holliston, MA) in aCSF [composition (in mm): 120 NaCl, 4.8 KCl, 1.2 KH2PO4, 1.2 MgSO4, 25 NaHCO3, 2.5 CaCl2, 10 d-glucose] as described previously (June et al., 2001). A stylet that protruded 1 mm beyond the tip of the guide cannulas was inserted when the injector was not in place. The VP-treated rats received a maximum of seven bilateral infusions, whereas the NACC-CPu rats received a maximum of six. All control aCSF and drug treatment infusions were administered according to a randomized design. Similar to the systemic injections, a minimum of 72 and a maximum of 96 hr were allocated between drug treatments to permit animals to return to baseline levels.
Histology. After the completion of the behavioral testing, animals were killed by CO2 inhalation. Cresyl violet acetate (0.20 μl) was injected into the infusion site and the brains were removed and frozen. The brains were sliced on a microtome in 50 μm sections and stained with cresyl violet acetate. The infusion sites were examined under a light microscope and indicated on drawings adapted from the rat brain atlas of Paxinos and Watson (1998). Rats with improper placements were excluded from the final data analysis.
Blood ethanol content determination. To ensure that animals were consuming pharmacologically relevant amounts of EtOH during operant sessions, blood alcohol contents (BACs) were collected on all animals on days on which they did not receive drug treatments. After the first 30 min of an operant session, 100 μl of whole blood was collected from the tail tip of the rat and stored in a heparin-coated microsample tube. After collection, the whole blood was immediately centrifuged for 5 min at 1100 rpm. Plasma samples of 5 μl were collected with a Gilson (Middleton, WI) Microman M-25 Pipette and injected directly into a GL-5 Analyzer (Analox Instruments, Luxenburg, MA). Microanalysis consisted of measuring the oxygen consumption in the reaction between the sample of alcohol and alcohol oxidase using a Clark-type amperometric oxygen electrode (Clark Electromedical Instruments, Pangbourne, UK). Alcohol reagent buffer solutions, pH 7.4, and alcohol oxidase enzymes were used in all of the samples tested. The results were calculated in milligrams per deciliter and printed within 20 sec of each trial. The mean of the two samples was used as an index of the level of BAC for a given rat. Single-point calibrations were performed using 5 μl of aqueous 100 mg/dl (21.7 mol/l) standard.
Statistical analysis. The operant-maintained response data were analyzed by a single-factor repeated-measures ANOVA with drug treatment (i.e., dose) as the independent factor. The dependent variables were EtOH- and saccharin-maintained response. Each dependent variable was analyzed separately. Post hoc comparisons between individual drug treatments were made using the Newman–Keuls test in all experiments. In systemic studies, comparisons of drug treatment were made against the no-injection (baseline) and Tween 20 vehicle control conditions. In the microinjection studies, drug treatment comparisons were made against the no-injection control condition (baseline) and the aCSF control condition. All microinjection data were obtained and analyzed after correct histological verification under a light microscope. To determine the time course of antagonism across the 60 min session, a single-factor ANOVA was conducted at each of the six 10 min intervals on the cumulative response data for the respective drug treatment conditions relative to the pooled control conditions. EtOH- and saccharin-maintained response data were analyzed separately. Post hoc analyses were performed on the cumulative interval data using the Newman–Keuls test. Finally, correlated t tests were conducted in each experimental group to compare basal response rates between EtOH- and saccharin-maintained response before any drug administration.
RESULTS
Chemistry and molecular biology studies
Synthesis of 3-PBC
3-PBC was produced in excellent yield using the more efficient and improved synthesis based on the recently established pharmacophore/receptor model of GABAA–BDZ α1 subtypes (Cox et al., 1998; Huang et al., 2000) (Fig. 1).
Binding affinity for 3-PBC at recombinant α1-, α2-, α3-, α5-, and α6-containing GABAA receptors
After synthesis, the in vitro binding affinities of 3-PBC, the β-carboline competitive antagonist ZK 93426 (Haefely, 1983; Jensen et al., 1984), the imidazobenzodiazepine competitive antagonist flumazenil (Ro15-1788) (Haefely, 1983), and several reference α1 ligands were evaluated at recombinant GABAA receptors, as depicted in Table1. For comparison, data from McKernan et al. (2000) are also shown. The binding affinities were generated using Ltk cells stably transfected with human receptor cDNAs. Portions of these data have been reported previously (Cox et al., 1995). As predicted, the well known BDZ1 agonists zolpidem and CL 218,872 displayed a moderate level of selectivity for the α1subtype. 3-PBC also displayed a moderate level of selectivity for the α1 subtype, exhibiting a 9.8-, 13-, and 111-fold selectivity relative to the α2, α3, and α5 receptors, respectively. 3-Ethoxy (3-EBC), an inverse agonist (i.e., negative GABA modulator) that was developed in our laboratory along with 3-PBC, displayed a similar, albeit lower selectivity, at the α1 receptor. However, β-carboline-3-carboxylate t-butyl ester (βCCt), another mixed agonist–antagonist, exhibited the greatest binding selectivity over BZII receptors (α2, α3, and α5) reported to date. βCCt was 3.5-fold more selective than zolpidem and >20-fold more selective than the antagonist flumazenil at α1 sites. The actions of βCCt on alcohol-seeking behavior have been reported recently (Carroll et al., 2000).
Efficacy of 3-PBC hydrochloride in modulating GABA at recombinant α1, α2, α3, and α5 receptors in theXenopus oocytes assay: comparison with other competitive benzodiazepine antagonists
The selectivity of 3-PBC in relation to physiological efficacy was also determined. For comparison, the activities of the prototypical antagonists ZK 93426 and flumazenil were also evaluated. Receptors composed of different GABAA α subunits (α1 through α5) were coexpressed with both the β3 and γ2 subunits. To compare modulator activity accurately between receptor subtypes, we used an equally effective (EC50) concentration of GABA for each GABAA receptor subtype: 50 μm for α1β3γ2,50 μm for α2β3γ2, 30 μm for α3β3γ2, 10 μm for α4β3γ2, and 30 μm for α5β3γ2. All agents were examined at saturating concentrations, either 1 or 10 μm. Figure 2 shows that 3-PBC acted as a modest positive modulator at α1-, α2-, α3-, and α4-containing receptors (113 ± 4%, 116 ± 7%, 119 ± 6%, and 129 ± 3% of GABA response, respectively). At the α1 through α5receptors, flumazenil exhibited an efficacy profile that was statistically similar to 3-PBC (p > 0.05). At the α1 through α4receptors, ZK 93426 exhibited a partial to full agonist profile (146 ± 11%, 140 ± 13%, 147 ± 10%, and 137 ± 8%, respectively). These effects were statistically greater than 3-PBC and flumazenil at the α1 through α3 receptors (p < 0.05). As reported previously (Wafford et al., 1993a,b), flunitrazepam, the full agonist, markedly enhanced GABAergic activity (152 ± 8% to 164 ± 3%) across the α receptors (data not shown). At the α5 receptor, each of the three antagonists exhibited a very weak negative profile that was indistinguishable from each other (p > 0.05). The relative magnitude of GABA potentiation for the three antagonists across the α1, α2, and α3 receptors is depicted in the traces of Figure 3. The traces confirm the very weak partial agonist profile of 3-PBC and the moderate level of GABA potentiation of ZK 93426 across the α1-, α2-, and α3-receptor subtypes.
Fig. 2.

Modulation of GABAAα1β3γ2-, α2β3γ2-,α3β3γ2-, α4β3γ2-, and α5β3γ2-receptor subunit combinations expressed in Xenopus oocytes by 3-PBC (open bars), Ro15-1788 (flumazenil) (gray bars), and ZK 93426 (black bars). A saturating concentration of modulator (1–10 μm) was coapplied over voltage-clamped oocytes along with an EC50of GABA. The whole-cell current response in the presence of the modulator is reported as a percentage of the current response to GABA alone (% GABA Response). Each value is the mean ± SD of at least three separate oocytes.
Fig. 3.

A–I, The actions of 3-PBC, flumazenil, and ZK 93426 on recombinant GABAA receptor subtypes are shown. Top, Current responses of voltage-clamped oocytes expressing GABAAα1β3γ2 receptors:A, During application of 50 μm(EC50) GABA alone for the duration indicated by theblack bar (left trace). The current response is from the same oocyte subsequently coapplied with 50 μm GABA along with 10 μm 3-PBC for the duration indicated by the open bar (right trace). B, Current response of a voltage-clamped oocyte during application of 50 μm GABA for the duration indicated by the black bar (left trace). The current response is from the same oocyte subsequently coapplied with 50 μm GABA and 1 μm flumazenil for the duration indicated by the open bar (right trace). C, Current response of a voltage-clamped oocyte during application of 50 μm GABA for the duration indicated by the black bar (left trace). The current response is from the same oocyte subsequently coapplied with 50 μm GABA and 10 μm ZK 93426 for the duration indicated by the open bar (right trace). Center, Current responses of voltage-clamped oocytes expressing GABAAα2β3γ2 receptors.D, During application of 50 μm(EC50) GABA for the duration indicated by theblack bar (left trace). The current response is from the same oocyte subsequently coapplied with 50 μm GABA and 10 μm 3-PBC for the duration indicated by the open bar (right trace).E, Current response of a voltage-clamped oocyte during application of 50 μm GABA for the duration indicated by the black bar (left trace). The current response is from the same oocyte subsequently coapplied with 50 μm GABA and 10 μm flumazenil for the duration indicated by the open bar (right trace). F, Current response of a voltage-clamped oocyte during application of 50 μm GABA for the duration indicated by the black bar (left trace). The current response is from the same oocyte subsequently coapplied with 50 μm GABA and 10 μm ZK 93426 for the duration indicated by the open bar (right trace). Bottom, Current responses of voltage-clamped oocytes expressing GABAAα3β3γ2 receptors:G, During application of 30 μm(EC50) GABA for the duration indicated by theblack bar (left trace). The current response is from the same oocyte subsequently coapplied with 30 μm GABA and 10 μm 3-PBC for the duration indicated by the open bar (right trace).H, Current response of a voltage-clamped oocyte during application of 30 μm GABA for the duration indicated by the black bar (left trace). The current response is from the same oocyte subsequently coapplied with 30 μm GABA and 1 μm flumazenil for the duration indicated by theopen bar (right trace). I, Current response of a voltage-clamped oocyte during application of 30 μm GABA for the duration indicated by the black bar (left trace). The current response is from the same oocyte subsequently coapplied with 30 μm GABA and 10 μm ZK 93426 for the duration indicated by theopen bar (right trace). Calibration, 5 nA, 10 sec.
In vitro binding affinity of 3-PBC to rat synaptosomal membranes
Because the α1 subtype is most abundant in the rodent cortex (Wisden et al., 1992; Fritschy and Mohler, 1995), thein vitro binding affinities of 3-PBC, 3-EBC, diazepam, and its parent molecule, βCCE were determined in rat cortical membranes (Table 2). As we have demonstrated previously, with the 3-alkoxy series of BDZs (Cox et al., 1998), there was a steady increase in the in vitro potency as chain length was increased from a 3-methoxy moiety (IC50 = 124 nm) (data not shown) to 3-EBC (IC50 = 24 nm) to a 3-n-propyloxy group (3-PBC) (IC50 = 11 nm). Thus, the in vitro binding affinity of 3-PBC at the synaptosomal cortical membrane was similar to the binding affinity at the recombinant α1-receptor subtype.
Table 2.
Displacement of [3H]flunitrazepam in vitro2-a
| Compound | IC50 nm |
|---|---|
| 3-PBC | 11 ± 0.80 |
| 3-EBC | 24 ± 2.1 |
| Diazepam | 6 ± 0.62 |
| βCCE | 5 ± 0.20 |
Displacement potencies of several three-substituted β-carbolines and diazepam at wild-type BDZ receptors using cerebral cortical membranes. Values are the means ± SEM of three or more experiments. See Cox et al. (1998) for methodological details.
Neurobehavioral studies
BAC determination
The response for EtOH yielded intakes of 0.67–2.85 gm/kg of absolute EtOH. EtOH consumption was 1.45–6.37 ml. BACs ranged from 16 to 92 mg/dl. BACs correlated significantly with the EtOH responding (r = 0.77; p < 0.01) and intake (r = 0.84; p < 0.01). Once the BACs were determined, group assignments were balanced to include rats from both the low- and high-intake ranges. Thus, rats were semirandomly assigned to their respective groups, with a prerequisite being that a given group contained 40–50% of both low and high alcohol responders.
Systemic injection studies
Total session data. The no-injection control (EtOH, 201 ± 51; saccharin, 153 ± 23) and the Tween 20 vehicle (EtOH, 191 ± 42; saccharin, 161 ± 41) conditions were similar (p > 0.05); hence, these data were pooled (Fig. 4A) and used to compare against the drug treatment conditions. Figure4A also shows that before any drug administration, basal EtOH- and saccharin-maintained responding under the control conditions were similar (p > 0.05). Figure 4A also shows that 3-PBC produced a significant dose-related reduction on the EtOH-maintained responding (F(5,60) = 9.827; p < 0.01). Compared with the control condition, all doses (p ≤ 0.05) except the lowest (p > 0.05) significantly reduce the responding maintained by EtOH. Figure 4A shows that in contrast to the effects observed on alcohol responding, the lower 3-PBC doses (1–10 mg/kg) markedly elevated responding maintained by saccharin (F(5,60) = 3.45; p < 0.05). Post hoc analyses confirmed that the 1–10 mg/kg doses significantly elevated saccharin responding (p ≤ 0.05); however, the 20 mg/kg dose markedly suppressed responding (p < 0.01).
Fig. 4.

Dose–response of systemic (A; 0.0–20 mg/kg; n = 13), and bilateral infusions of 3-PBC (0.5–40 μg) in the VP (B; n= 12) and NACC/CPu (neuroanatomical control loci) (C;n = 7) on a concurrent fixed-ratio (FR4) schedule for EtOH (10% v/v) and saccharin (0.05% w/v) responding during the 1 hr operant session. *p ≤ 0.05 versus the control conditions values by ANOVA and post hoc Newman–Keuls test. Error bars indicate means ± SEM in this and subsequent figures. The two control conditions were pooled in the systemic group and compared against the drug treatment conditions (see Results). BL, Baseline; Veh, vehicle control.
Cumulative within-session data. Figure5A shows the cumulative within-session time course across the 60 min session for alcohol-maintained responding; Figure 5B shows the cumulative profile for saccharin responding. All 3-PBC doses suppressed the initiation of EtOH responding during the first 10 (F(5,55) = 5.29; p < 0.001), 20 (F(5,55) = 4.87;p < 0.001), and 30 (F(5,55) = 3.97; p < 0.001) min intervals. However, during the latter 40–60 min intervals, only the 2.5–20 mg doses continued to suppress responding (F(5,55) = 5.72, p < 0.001; F(5,55) = 4.74,p < 0.001; andF(5,55) = 5.99, p < 0.001, respectively). Post hoc analyses using the Newman–Keuls test confirmed the effects of the individual drug treatment doses at the respective intervals (p≤ 0.05). In contrast to EtOH responding, except for the 20 mg/kg dose, beginning at the 30 min interval, and throughout the remainder of the 60 min session, all 3-PBC doses significantly elevated saccharin-maintained responding (F(5,55) = 4.45, p < 0.001; F(5,55) = 3.84,p < 0.005; F(5,55) = 3.72, p < 0.006; andF(5,55) = 4.78, p < 0.001, respectively). The 20 mg dose significantly suppressed saccharin-maintained responding beginning at the 20 min interval and continued throughout the remainder of the 60 min session. These findings were confirmed by post hoc analyses (p ≤ 0.05).
Fig. 5.

Cumulative time course profiles across the 60 min interval for an EtOH-maintained (A) and saccharin-maintained (B) response relative to the pooled control condition after systemic injections of 3-PBC. The data are redrawn from Figure 4A. All 3-PBC doses suppressed the initiation of the EtOH response during the first 10 and 20 min intervals (p ≤ 0.05) (see Results). In contrast to the EtOH response, except for the 20 mg/kg dose, beginning at the 30 min interval, and throughout the remainder of the 60 min session, all PBC doses significantly elevated the saccharin-maintained response (p ≤ 0.05) (see Results).
Microinfusion studies
Figure6A shows a reconstruction of serial coronal sections of the rat brain illustrating the bilateral guide cannula tips for the correctly implanted subjects (n = 12). The histological placements show that the guide cannulas were implanted in the anterior (Bregma, 0.70–0.20 mm) to medial (Bregma, −0.26 to −0.30 mm) VP fields. Figure7A–D depicts the actual bilateral placements for 4 of the 12 VP rats, in separate photomicrographs illustrating the extent of the lesion sustained as a result of the introduction of the bilateral guide cannula. Two rats each from the VP and NACC-CPu groups were excluded from the final data analyses because of improper placements. A single rat from the NACC-CPu group was also excluded because the cannula came loose from the surface of the skull.
Fig. 6.

Reconstruction of serial coronal sections of the rat brain illustrating the bilateral guide cannula tips for the VP anterior to the medial division (A;n = 12), NACC, and CPu (n = 7) rats (i.e., neuroanatomical controls) (B) included in the data depicted in Figure 4A,B, respectively. Each rat is represented by two solid black circles: one in the left and one in the right hemisphere.MnPO, Median preoptic nuclei; MPA, median preoptic area; AcbC, nucleus accumbens core;AcbSh, nucleus accumbens shell. Coronal sections are adapted from the rat brain atlas of Paxinos and Watson (1998), reproduced with permission from Academic Press.
Fig. 7.
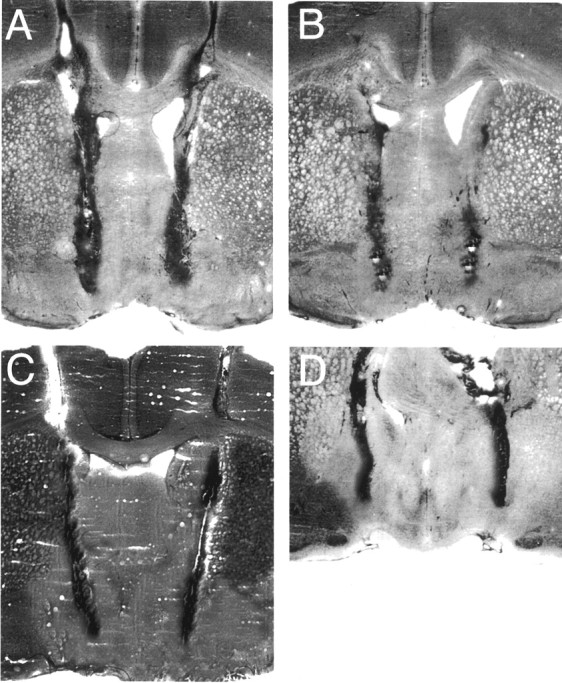
A–D, Representative histological photomicrographs for four rats illustrating coronal sections of the VP (anterior to the medial division). The photomicrographs depict the tracks of the guide cannulas and the magnitude of the cellular damage caused by the implantation of the bilateral cannula.
Total session data. Figure 4B shows responding maintained by alcohol and saccharin under the baseline and aCSF conditions were similar (p > 0.05). Thus, these data were pooled and compared against the 3-PBC dose conditions. 3-PBC dose-dependently reduced alcohol-maintained responding relative to the control condition, resulting in a significant effect of drug dose (F(6,66) = 4.43; p < 0.02). Only the 0.5 μg dose failed to reduce the alcohol response significantly (p > 0.05). Figure4B reveals that in contrast to the effects observed on alcohol-maintained responding, only the 40 μg dose significantly reduced saccharin responding (p < 0.05); however, the overall ANOVA produced a nonsignificant effect of drug dose (F(6,66) = 1.71;p > 0.05).
Cumulative within-session data. Figure8A illustrates the cumulative within-session response profile for alcohol under the control and 3-PBC treatments. Similar to the systemic injections, all of the six VP infusions produced a significant reduction in alcohol responding at the initial 10 min (F(6,78) = 2.35; p < 0.039) and 20 min (F(6,78) = 3.45; p < 0.028) intervals. Except for the 0.5 μg dose condition, all 3-PBC infusions continued to suppress the EtOH responding at the 30–60 min intervals (F(6,78) = 3.145, p < 0.008; F(6,78) = 4.32,p < 0.001; F(6,78) = 4.26, p < 0.001; andF(6,78) = 4.04, p < 0.001, respectively). In contrast to the EtOH-maintained responding, with the exception of the 40 μg dose condition, none of the 3-PBC infusions altered responding maintained by saccharin at the 10 min interval (Fig. 8B). The 40 μg dose significantly reduced responding throughout the 10–60 min intervals (F(6,78) = 2.31, p < 0.04; F(6,78) = 3.29,p < 0.005; F(6,78) = 2.15, p < 0.047;F(6,78) = 4.14, p < 0.001; F(6,78) = 3.36,p < 0.006; andF(6,78) = 4.36, p < 0.001, respectively). The 10 μg dose also significantly reduced responding throughout the 40–60 min intervals (F(6,78) = 2.41, p < 0.04; F(6,78) = 3.01,p < 0.005; andF(6,78) = 2.86, p < 0.05). In contrast, the 5 μg dose significantly elevated responding throughout the 30–50 min intervals (F(6,78) = 4.41, p < 0.001; F(6,78) = 3.11,p < 0.005; andF(6,78) = 3.86, p < 0.007). Similarly, the 3 μg dose also significantly elevated responding throughout the 40–60 min intervals (F(6,78) = 3.42, p < 0.006; F(6,78) = 4.01,p < 0.001; andF(6,78) = 4.56, p < 0.001).
Fig. 8.

Cumulative time course profiles across the 60 min interval for an EtOH-maintained (A) and saccharin-maintained (B) response relative to the pooled control condition after infusions of 3-PBC in the VP. The data are redrawn from Figure 4B. All 3-PBC infusions suppressed the initiation of the EtOH response during the first 10 and 20 min intervals (p ≤ 0.05). Except for the 0.5 μg dose condition, all 3-PBC infusions continued to significantly suppress the response throughout the 30–60 min intervals (p ≤ 0.05). In contrast to the EtOH-maintained response, except for the 40 μg dose condition (p < 0.05), none of the 3-PBC infusions altered the response maintained by saccharin at the 10 min interval (p > 0.05) (see Results). Similar to its effect on the EtOH-maintained response, the suppression with the 40 μg dose was sustained throughout the remainder of the 60 min session (p ≤ 0.05) (see Results).BL, Baseline.
Neuroanatomical controls. To determine the neuroanatomical specificity of the VP–α1-receptor modulation of the alcohol-maintained responding, we evaluated the capacity of 3-PBC to reduce alcohol-motivated behaviors in the NACC/CPu, a loci reported to be devoid of the α1-receptor subtype (Wisden et al., 1992; Turner et al., 1993; Duncan et al., 1995;Fritschy and Mohler, 1995). Figure 6B shows a reconstruction of the serial coronal sections for the neuroanatomical control rats. The bilateral guide cannula tips for the seven control subjects were at Bregma 2.20 to Bregma 1.20. Figure9A–C depicts the actual bilateral placements for three of the seven rats in separate photomicrographs, illustrating the extent of the lesion sustained as a result of the introduction of the bilateral guide cannula. Figure4C shows the rates of responding maintained by EtOH and saccharin after bilateral microinjection of the 5–40 μg doses of 3-PBC. Compared with the pooled aCSF and baseline control conditions, the treatments with 3-PBC had no effect on the alcohol- or saccharin-maintained responding. These findings were supported by a nonsignificant effect of drug treatment for the alcohol- and saccharin-maintained responding (F(4,24) = 0.365, p > 0.05 and F(4,24) = 0.696,p > 0.6021, respectively). These data indirectly confirm the topography of the α1-receptor subtype (Churchill et al., 1991a; Duncan et al., 1995) in the striatopallidal area of the P rats.
Fig. 9.

Representative histological photomicrographs for three rats, illustrating coronal sections for two NACC (A, B) and one CPu (C) rat. The photomicrographs depict the tracks of the guide cannulas and the magnitude of cellular damage caused by the implantation of the bilateral cannula.
DISCUSSION
To model the human condition of alcohol abuse, we selected as subjects the P rat line. The P rat line has been shown to fulfill all criteria for an animal model of human alcohol abuse (Cicero, 1979;Cloninger, 1987) to the satisfaction of the alcohol research community (McBride and Li, 1998). Specifically, the P rat will: (1) voluntarily consume 5–8 gm/kg of alcohol to attain blood alcohol concentrations of 50–200 mg/dl; (2) press a lever for alcohol orally in concentrations of 10–40%, despite the fact that water and food are also available; (3) drink alcohol for its pharmacological effect and not solely because of its taste, smell, or caloric properties, as evidenced by the fact that P rats will self-administer alcohol intragastrically as well as intracranially; (4) develop both metabolic and functional tolerance with free-choice alcohol drinking; and (5) develop physical dependence and signs of withdrawal after removal of alcohol after long periods of consumption.
The overall findings of the present study were that activation of VP α1 receptors by 3-PBC produced marked reductions on the alcohol-maintained responding. These effects were observed in the absence of altering responding for a nondrug reinforcer. The α1-mediated suppression of 3-PBC at the VP level showed a high degree of neuroanatomical specificity. Specifically, the α1-mediated suppression was not observed with the more dorsal placements in the NACC or CPu. The failure of 3-PBC to alter alcohol self-administration in the NACC/CPu is in agreement with previous research, which has consistently reported that the expression of the α1 transcript was nil in the NACC and CPu (Churchill et al., 1991a; Duncan et al., 1995; Fritschy and Mohler, 1995), as was the magnitude of the binding of [3H]zolpidem, the α1-selective agonist (Duncan et al., 1995). Criswell and colleagues (Criswell et al., 1993, 1995; Duncan et al., 1995) have suggested that zolpidem-binding sites may be predictive of the loci in which EtOH activates GABAergic receptors in the CNS.
The reduction in EtOH-motivated responding after systemic and central administrations may be attributable to the capacity of 3-PBC to function as a partial BDZ agonist, thereby interacting with alcohol in an additive manner to reduce alcohol-drinking behavior. Both BDZ agonists and EtOH have been shown to facilitate GABAergic transmissionin vivo and in vitro (Suzdak et al., 1986). Thus, it is plausible that 3-PBC may have potentiated the pharmacological actions of the self-administered alcohol on the one hand or substituted for the pharmacological effects of the ingested EtOH. In either case, less alcohol would be needed to obtain the usual pharmacological effect produced by the ingested alcohol. In further support of this hypothesis, a number of researchers have demonstrated that positive GABAergic modulators are readily substituted for EtOH in drug-discrimination studies (Bowen and Grant, 1998; Hodge and Cox, 1998).
In contrast to the effects on EtOH-maintained responding, systemic 3-PBC injections produced marked elevations on responding maintained by saccharin. Such increases are typical of partial and full BDZ agonists (Higgs and Cooper, 1995). It should be recalled that partial agonist effects were observed with 3-PBC at the α1–α4 subtypes in the present study (Fig. 2). However, VP infusions did not alter saccharin responding. Hence, it is possible that systemic administration of 3-PBC activates multiple α-receptor subtypes, inducing an agonist profile to initiate the intake of palatable solutions and general ingesta, whereas VP infusions result in the occupancy primarily of receptors of the α1 subtype, which is more selective for EtOH. 3-PBC nonselectively suppressed responding with the highest tested VP (40 μg) and systemic (20 mg/kg) doses. These nonselective profiles on ingestive response are likely because of the saturation of all α-receptor subtypes. An apparent conundrum is that the 40 μg dose failed to alter the EtOH or saccharin responding in the NACC/CPu. However, the prevalence of the α1- and non-α1-receptor subtypes in these control areas is either not detectable (Churchill et al., 1991a) or very low (Wisden et al., 1992; Fritschy and Mohler, 1995). Hence, this factor, combined with the low binding affinity (i.e., 10- to 13-fold lower compared with the α1 subtype) of 3-PBC at non-α1-receptors (e.g., α2, α3, and α4 subtypes) in these sites (Table 1) could explain a lack of behavioral effects on ingestive behaviors.
Previous reports have suggested that the VP plays a role in regulating the rewarding properties of psychostimulants, opioids (Austin and Kalivas, 1990; Hubner and Koob, 1990; Napier and Chrobak, 1992; Hiroi and White, 1993; Gong et al., 1996), and alcohol (Samson and Hodge, 1996; McBride and Li, 1998; Koob, 1999). However, the present study and our recent work with βCCt, another α1-subtype ligand (Carroll et al., 2000) (H. L. June, unpublished data), are the first to link this substrate directly to the rewarding properties of alcohol. It is possible that the VP GABAergic neurons regulate the reinforcing properties of alcohol via the involvement of GABA within the mesolimbic dopamine (DA) or opioid systems (Austin and Kalivas, 1990; McBride and Li, 1998). Biochemical, electrophysiological, pharmacological, and behavioral studies support the anatomical evidence that GABA and enkephalins are colocalized in terminals that innervate VP neurons (Zahm et al., 1985;Kalivas et al., 1993b; Churchill et al., 1991b, 1998). In addition, several studies have shown that locomotor activation induced by the microinjection of DA or opioids in the NACC can be attenuated by GABA agonists in the VP (for review, see Churchill et al., 1998). It is also well known that the VP receives additional GABAergic afferents from the ventral tegmental area (VTA) (Kalivas et al., 1993b), another brain area known to regulate alcohol reinforcement (Koob et al., 1998; McBride and Li., 1998). Thus, the topography of the VP (Kalivas et al., 1993a) places it in a unique position to serve as a pivotal regulator of dopaminergic, opioid, and GABAergic inputs that could control EtOH-motivated behaviors.
Self-administered or parenterally administered EtOH elevates DA in a variety of subcortical areas [e.g., shell of NACC, VTA, bed nucleus of the stria terminalis (BST), etc.] (Weiss et al., 1993; McBride and Li, 1998; Carboni et al., 2000). Thus, one hypothesis is that 3-PBC infusions increase GABA at α1 receptors in the VP. This increase in GABA may disinhibit DA neurons in the VP, further elevating the already enhanced DA levels from ingested alcohol in one or more subcortical areas. Such elevations in DA could result in reductions in alcohol-maintained responding or in the early termination of responding. VP GABAergic neurons have been reported to regulate the major DA output neurons of the VP (Gong et al., 1997), and GABA can directly inhibit or indirectly stimulate the DA cell via disinhibition of GABAergic interneurons (Kalivas et al., 1993b).
In the present study, the efficacy profile of 3-PBC was qualitatively similar to flumazenil at all receptors except the α1 subtype (Fig. 2). In contrast, ZK 93426 displayed an efficacy profile similar to that of a full agonist. Similar to 3-PBC, previous reports from our laboratory have suggested that parenteral injections of ZK 93426 effectively reduce alcohol-motivated behaviors under a number of experimental conditions (June et al., 1998b). In contrast, flumazenil failed to reliably reduce alcohol-motivated responding after parenteral (June et al., 1998b) or direct VP injections (data not shown). Hence, the lack of partial agonist activity by flumazenil at the α1receptor (Fig. 2) may explain in part the failure of flumazenil to effectively reduce alcohol-maintained responding. However, this hypothesis is not consistent with the overwhelming data showing that a positive efficacy at the α1 receptor is not a prerequisite to selectively reduce alcohol responding (Carroll et al., 2000).
In summary, the data of the present study provide support for the hypothesis that GABAA receptors containing α1 subunits in the VP play an important role in regulating the reinforcing properties of EtOH. Recently, we demonstrated that the α5 subunits in the hippocampus also played a critical role in regulating EtOH reinforcement (June et al., 2001). Thus, the GABAergic systems within the VP and hippocampal pathways represent new extensions of the mesolimbic EtOH reward circuitry. However, a major task for alcohol researchers will be to determine the degree to which these neuronal systems singly and collectively regulate alcohol-seeking behaviors. In both studies, we have focused primarily on the potential interaction of GABA with the DA systems because of its close proximity and coexistence with GABA in several neuronal populations purported to regulate alcohol reinforcement (Koob et al., 1998; McBride and Li, 1998). However, recent evidence suggests that a DA link between the ventral hippocampus (i.e., subiculum), NACC, and VTA may be dependent on the integrity of the NMDA receptor (Legault et al., 2000). In the present study, 3-PBC selectively reduced alcohol-motivated behaviors under a variety of experimental conditions. However, unlike RY 023, the α5-selective negative modulator (June et al., 2001), 3-PBC displayed a mixed agonist–antagonist profile in vivo and in vitro. Thus, in addition to delineating the molecular basis of alcohol reinforcement, BDZ α1-site ligands may serve as a prototype in the design of novel pharmacotherapies for alcohol-dependent subjects. Hence, from a clinical perspective, mixed agonist–antagonist α1-site ligands capable of reducing alcohol intake and concurrently eliminating or attenuating the anxiety associated with habitual alcohol consumption, abstinence, or detoxification would be optimal pharmacotherapeutic agents in treating alcohol-dependent individuals.
Footnotes
This research was supported in part by National Institute of Alcohol Abuse and Alcoholism Grants AA10406 and AA11555 (H.L.J.) and National Institute of Mental Health Grant MH 46851 (J.M.C.). K.F. and C.J. were supported in part by National Heart, Lung, and Blood Institute Grant T35M from the Short-Term Training Program for Minority Students in Biomedical Research. K.F. was also supported in part by a Minority Neuroscience Fellowship from the American Psychological Association. We thank Dr. Phil Skolnick (Eli Lilly, Indianapolis, IN) for his outstanding consulting work throughout the project and for obtaining the cDNA clones from Drs. Luddens (University of Mainz, Mainz, Germany) and Mahan (National Institutes of Health, Bethesda, MD). We also thank Dr. T.-K. Li and the Alcohol Research Center (Indiana University School of Medicine) for supplying the P rats.
Correspondence should be addressed to Dr. Harry L. June, Department of Psychology, LD 124, IUPUI, 402 North Blackford Street, Indianapolis, IN 46202-3275. E-mail: hjune@iupui.edu.
REFERENCES
- 1.Austin MC, Kalivas PW. Enkephallinergic and GABAergic modulation of motor activity in the ventral pallidum. J Pharmacol Exp Ther. 1990;252:1370–1377. [PubMed] [Google Scholar]
- 2.Bowen CA, Grant KA. Pharmacological analysis of the heterogeneous discriminative stimulus effects in rats using a three-choice ethanol-dizocilpine-water discrimination. Psychopharmacology. 1998;139:86–94. doi: 10.1007/s002130050693. [DOI] [PubMed] [Google Scholar]
- 3. Carboni E, Silvagni A, Rolando MT, Di Chiara G. Stimulation on in vivo dopamine transmission in the bed nucleus of stria terminalis by reinforcing drugs. J Neurosci 20 2000. RC102:1–5. [DOI] [PMC free article] [PubMed] [Google Scholar]
- 4.Carroll M, Foster K, Harvey S, Mc Kay PF, Cook JM, June HL. Selective GABAA-α1 subunit ligands (βCCt, 3-PBC) attenuate responding maintained by ethanol following microinjection into the ventral pallidum. Alcohol Clin Exp Res. 2000;24:47A. [Google Scholar]
- 5.Carroll M, Woods JE, II, Seyoum RA, June HL. The role of the GABAA α1 subunit in mediating the sedative and anxiolytic properties of benzodiazepines. Alcohol Clin Exp Res. 2001;25:12A. [Google Scholar]
- 6.Churchill L, Kalivas PW. A topographical organized GABA projection from the ventral pallidum to the nucleus accumbens in the rat. J Comp Neurol. 1994;345:579–595. doi: 10.1002/cne.903450408. [DOI] [PubMed] [Google Scholar]
- 7.Churchill L, Bourdelais A, Austin S, Lolait SJ, Mahan LC, O'Carroll AM, Kalivas PW. GABAA receptors containing α1 and β2 subunits are primarily localized on neurons in the ventral pallidum. Synapses. 1991a;8:75–85. doi: 10.1002/syn.890080202. [DOI] [PubMed] [Google Scholar]
- 8.Churchill L, Bourdelais A, Austin M, Zahm DS, Kalivas PW. γ-aminobutyric acid and μ-opioid receptor localization and adaptation in the basal forebrain. Adv Exp Med Biol. 1991b;295:101–117. doi: 10.1007/978-1-4757-0145-6_3. [DOI] [PubMed] [Google Scholar]
- 9.Churchill L, Klitenick MA, Kalivas PW. Dopamine depletion reorganizes projections from the nucleus accumbens and ventral pallidum that mediate opioid-induced motor activity. J Neurosci. 1998;18:8074–8085. doi: 10.1523/JNEUROSCI.18-19-08074.1998. [DOI] [PMC free article] [PubMed] [Google Scholar]
- 10.Cicero TJ. A critique of animal analogues of alcoholism. In Biochemistry and pharmacology of ethanol, Vol 2 (Majchrowicz E, Noble EP, eds), pp 533–560. Plenum; New York: 1979. [Google Scholar]
- 11.Cloninger CR. Neurogenetic adaptive mechanisms in alcoholism. Science. 1987;236:410–416. doi: 10.1126/science.2882604. [DOI] [PubMed] [Google Scholar]
- 12.Cox ED, Hagen TJ, McKernan RM, Cook JM. BZ1 receptor specific ligands: synthesis and biological properties of BCCt, a BZ1 receptor subtype specific antagonist. Med Chem Res. 1995;5:710–718. [Google Scholar]
- 13.Cox ED, Diaz-Arauzo H, Huang Q, Reddy MS, Ma C, Harris B, McKernan RM, Skolnick P, Cook JM. Synthesis and evaluation of analogues of the partial agonist 6-(propyloxy)-4-(methoxymethyl)-β-carboline-3-carboxylic acid ethyl ester (6-PBC) and the full agonist 6-(benzyloxy)-4-(methoxymethyl)-β-carboline-3-carboxylic acid ethyl ester (Zk 93423) at wild type and recombinant GABAA receptors. J Med Chem. 1998;41:2537–2552. doi: 10.1021/jm970460b. [DOI] [PubMed] [Google Scholar]
- 14.Criswell HE, Simson PE, Duncan GE, Mc Cown TJ, Herbert JS, Morrow L, Breese GR. Molecular basis for regionally specific action of ethanol on γ-aminobutyric acidA receptors: generalization to other ligand-gated ion channels. J Pharmacol Exp Ther. 1993;267:522–527. [PubMed] [Google Scholar]
- 15.Criswell HE, Simson PE, Knapp DJ, Devaud LL, Mc Cown TJ, Duncan GE, Morrow AL, Breese GR. Effect of zolpidem on γ-aminobutyric acid (GABA)-induced inhibition predicts the interaction of ethanol with GABA on individual neurons in several rat brain regions. J Pharmacol Exp Ther. 1995;273:525–536. [PubMed] [Google Scholar]
- 16.Duncan GE, Breese GR, Criswell HE, McCown TJ, Herbert JS, Devaud LL, Morrow AL. Distribution of [3H]zolpidem binding sites in relation to messenger RNA encoding the α1, β2 and γ2 subunits of GABAA receptors in rat brain. Neuroscience. 1995;64:1113–1128. doi: 10.1016/0306-4522(94)00433-6. [DOI] [PubMed] [Google Scholar]
- 17.Fritschy JM, Mohler H. GABAA-receptor heterogeneity in the adult rat brain: differential regional and cellular distribution of seven major subunits. J Comp Neurol. 1995;359:154–194. doi: 10.1002/cne.903590111. [DOI] [PubMed] [Google Scholar]
- 18.Gong W, Neill D, Justice JB. Place preference conditioning and locomotor activation induced by local injection of psychostimulants into ventral pallidum. Brain Res. 1996;707:64–74. doi: 10.1016/0006-8993(95)01222-2. [DOI] [PubMed] [Google Scholar]
- 19.Gong W, Neill DB, Justice JB. GABAergic modulation of ventral pallidal dopamine release studied by in vivo microdialysis in the freely moving rat. Synapse. 1997;29:406–412. doi: 10.1002/(SICI)1098-2396(199808)29:4<406::AID-SYN12>3.0.CO;2-O. [DOI] [PubMed] [Google Scholar]
- 20.Groenewegen HJ, Vermeulen-Van Der Zee E, Te Kortschot A, Witter MP. Organization of the projections to the ventral striatum in the rat: a study using anterograde transport of Phaseolus vulgaris leucoagglutinin. Neuroscience. 1987;23:103–120. doi: 10.1016/0306-4522(87)90275-2. [DOI] [PubMed] [Google Scholar]
- 21.Haefely W. Antagonists of benzodiazepine: functional aspects. In: Biggio G, Costa E, editors. Benzodiazepine recognition. Site ligands: biochemistry and pharmacology. Raven; New York: 1983. p. 73. [Google Scholar]
- 22.Heyman GM, Oldfather CM. Inelastic preference for ethanol in rats: an analysis of ethanol's reinforcing effects. Psychol Sci. 1992;3:122–130. [Google Scholar]
- 23.Higgs S, Cooper SJ. Benzodiazepine receptor inverse agonists and ingestive behaviors: the palatability hypothesis. In: Sarter M, Nutt DJ, Lister RG, editors. Benzodiazepine receptor inverse agonists. Wiley-Liss; New York: 1995. pp. 163–184. [Google Scholar]
- 24.Hiroi N, White NM. Place preference conditioning and locomotor activation induced by local injection of psychostimulants into the ventral pallidum. Brain Res. 1993;707:64–74. doi: 10.1016/0006-8993(95)01222-2. [DOI] [PubMed] [Google Scholar]
- 25.Hodge CW, Cox AA. The discriminative stimulus effects of ethanol are mediated by NMDA and GABAA receptors in specific limbic brain regions. Psychopharmacology. 1998;139:95–107. doi: 10.1007/s002130050694. [DOI] [PubMed] [Google Scholar]
- 26.Huang Q, He X, Ma C, Liu R, Yu S, Dayer CA, Wenger GR, McKernan R, Cook JM. Pharmacophore/receptor models for GABAA/Bzr subtypes (α1β3γ2, α5β3γ2, and α6β3γ2) via a comprehensive ligand-mapping approach. J Med Chem. 2000;43:71–95. doi: 10.1021/jm990341r. [DOI] [PubMed] [Google Scholar]
- 27.Hubner CB, Koob GF. The ventral pallidum plays a role in mediating cocaine and heroin self-administration in the rat. Brain Res. 1990;508:20–29. doi: 10.1016/0006-8993(90)91112-t. [DOI] [PubMed] [Google Scholar]
- 28.Hyytiä P, Koob GF. GABAA receptor antagonism in the extended amygdala decreases ethanol self-administration in rats. Eur J Pharmacol. 1995;283:151–159. doi: 10.1016/0014-2999(95)00314-b. [DOI] [PubMed] [Google Scholar]
- 29.Jensen LH, Petersen EN, Braestrup C, Honore T, Kehr W, Stephens DN, Schneider H, Seidelmann D, Schmiechen R. Evaluation of the beta-carboline ZK93426 as a benzodiazepine receptor antagonist. Psychopharmacology. 1984;83:249–256. doi: 10.1007/BF00464789. [DOI] [PubMed] [Google Scholar]
- 30.June HL. Preclinical models to evaluate potential pharmacotherapeutic agents in treating alcoholism and studying the neuropharmacological bases of alcohol-seeking behaviors in rats. In: Crawley J, Gerfen C, McKay R, Rogawski M, Sibley D, Skolnick P, editors. Current protocols in neuroscience. Wiley; New York: 2002. pp. 1–23. [DOI] [PubMed] [Google Scholar]
- 31.June HL, Torres L, Cason CR, Hwang BH, Braun MR, Murphy JM. The novel benzodiazepine inverse agonist RO19–4603 antagonizes ethanol motivated behaviors: neuropharmacological studies. Brain Res. 1998a;784:256–275. doi: 10.1016/s0006-8993(97)01380-2. [DOI] [PubMed] [Google Scholar]
- 32.June HL, Zucarelli D, Craig KS, DeLong J, Cason CR, Torres L, Murphy JM. High affinity benzodiazepine antagonists reduce responding maintained by EtOH presentation in ethanol-preferring (P) rats. J Pharmacol Exp Ther. 1998b;284:1006–1014. [PubMed] [Google Scholar]
- 33.June HL, McCane S, Zink RW, Portoghese P, Li T-K, Froehlich JC. The δ2 opioid receptor antagonist naltriben reduces alcohol-motivated behaviors. Psychopharmacology. 1999;147:81–89. doi: 10.1007/s002130051145. [DOI] [PubMed] [Google Scholar]
- 34.June HL, Harvey SC, Foster KL, McKay PF, Cummings R, Garcia M, Mason D, Grey C, McCane SL, Williams L, Johnson TB, Xiaohui H, Rock S, Cook JM. GABAA-receptors containing α5 subunits in the CA1 and CA3 hippocampal fields regulate ethanol-motivated behaviors: an extended ethanol reward circuitry. J Neurosci. 2001;21:2166–2177. doi: 10.1523/JNEUROSCI.21-06-02166.2001. [DOI] [PMC free article] [PubMed] [Google Scholar]
- 35.Kalivas PW, Churchill L, Klitenick MA. The circuitry mediating the translation of motivational stimuli into adaptive motor responses. In: Kalivas PW, Barnes CD, editors. Limbic motor circuits and neuropsychiatry. CRC; Boca Raton, FL: 1993a. pp. 237–287. [Google Scholar]
- 36.Kalivas PW, Churchill L, Klitenick MA. GABA and enkephalin projection from the nucleus accumbens and ventral pallidum to the ventral tegmental area. Neuroscience. 1993b;57:1047–1060. doi: 10.1016/0306-4522(93)90048-k. [DOI] [PubMed] [Google Scholar]
- 37.Koob GF. The role of the striatopallidal and extended amygdala systems in drug addiction. Ann NY Acad Sci. 1999;877:445–460. doi: 10.1111/j.1749-6632.1999.tb09282.x. [DOI] [PubMed] [Google Scholar]
- 38.Koob GF, Roberts AJ, Schulteis G, Parsons LH, Heyser CJ, Hyytia P, Merlo-Pinch E, Weiss F. Neurocircuitry targets in ethanol reward and dependence. Alcohol Clin Exp Res. 1998;22:3–9. [PubMed] [Google Scholar]
- 39.Legault M, Rompre PP, Wise RA. Chemical stimulation of the ventral hippocampus elevates nucleus accumbens dopamine by activating dopaminergic neurons of the ventral tegmental area. J Neurosci. 2000;20:1635–1642. doi: 10.1523/JNEUROSCI.20-04-01635.2000. [DOI] [PMC free article] [PubMed] [Google Scholar]
- 40.Lumeng L, Murphy JM, McBride WJ, Li T-K. Genetic influences on alcohol preference in animals. In: Begleiter H, Kissin B, editors. The genetics of alcoholism. Oxford UP; New York: 1995. pp. 165–201. [Google Scholar]
- 41.McBride WJ, Li T-K. Animal models of alcoholism: neurobiology of high alcohol-drinking behavior in rodents. Crit Rev Neurobiol. 1998;12:339–369. doi: 10.1615/critrevneurobiol.v12.i4.40. [DOI] [PubMed] [Google Scholar]
- 42.McKernan RM, Rosahl TW, Reynolds DS, Sur C, Wafford KA, Atack JR, Farrar S, Myers J, Cook G, Ferris P, Garrett L, Bristow L, Marshall G, Macaulay A, Brown N, Howell O, Moore KW, Carling RW, Street LJ, Castro JL. Sedative but not anxiolytic properties of benzodiazepines are mediated by the GABAA receptor α1 subtype. Nat Neurosci. 2000;3:587–592. doi: 10.1038/75761. [DOI] [PubMed] [Google Scholar]
- 43.Meisch RA, Lemaire GA. Drug self-administration. In: Van Haren F, editor. Methods in behavioral pharmacology. Elsevier; New York: 1993. pp. 257–300. [Google Scholar]
- 44.Napier TC, Chrobak JJ. Evaluation of ventral pallidal dopamine receptor activation in behaving rats. NeuroReport. 1992;3:609–611. doi: 10.1097/00001756-199207000-00016. [DOI] [PubMed] [Google Scholar]
- 45.Paxinos G, Watson C. The rat brain in stereotaxic coordinates. Academic; Sydney: 1998. [DOI] [PubMed] [Google Scholar]
- 46.Samson HH, Hodge CW. Neurobehavioral regulation of ethanol intake. In: Deitrich RA, Erwin VG, editors. Pharmacological effects of ethanol on the nervous system. CRC; New York: 1996. pp. 203–226. [Google Scholar]
- 47.Suzdak P, Glowa JR, Crawley JN, Schwartz RD, Skolnick P, Paul SM. A selective imidazodiazepine antagonist of ethanol in the rat. Science. 1986;234:1243–1247. doi: 10.1126/science.3022383. [DOI] [PubMed] [Google Scholar]
- 48.Turner JD, Bodewitz G, Thompson CL, Stephenson FA. Immunohistochemical mapping of gamma-aminobutyric acid type-A receptor alpha subunits in rat central nervous system. In: Stephens DN, editor. Anxiolytic β-carbolines: from molecular biology to the clinic. Springer; New York: 1993. pp. 29–49. [DOI] [PubMed] [Google Scholar]
- 49.Wafford KA, Whiting PJ, Kemp JA. Differences in affinity of benzodiazepine receptor ligands at recombinant γ-aminobutyric acidA receptors subtypes. Mol Pharmacol. 1993a;43:240–244. [PubMed] [Google Scholar]
- 50.Wafford KA, Bain CJ, Whiting PJ, Kemp JA. Functional comparison of the role of γ subunits in recombinant human γ-aminobutyric acidA/benzodiazepine receptors. Mol Pharmacol. 1993b;44:437–442. [PubMed] [Google Scholar]
- 51.Weiss F, Lorang MT, Bloom FE, Koob GF. Oral alcohol self-administration stimulates dopamine release in the rat nucleus accumbens: genetic and motivational determinants. J Pharmacol Exp Ther. 1993;267:250–258. [PubMed] [Google Scholar]
- 52.Wisden H, Laurie DJ, Monyer H, Seeburg PH. The distribution of 13 GABAA receptor subunit mRNAs in the rat brain: telencephalon, diencephalon, mesencephalon. J Neurosci. 1992;12:1040–1062. doi: 10.1523/JNEUROSCI.12-03-01040.1992. [DOI] [PMC free article] [PubMed] [Google Scholar]
- 53.Zahm DS, Zaborszky L, Alones VE, Heimer L. Evidence for the coexistence of glutamate decarboxylase and met-enkephalin immunoreactivities in axon terminals of rat ventral pallidum. Brain Res. 1985;325:317–321. doi: 10.1016/0006-8993(85)90331-2. [DOI] [PubMed] [Google Scholar]