

Abstract
We report a survey of the population of ganglion cells in the rabbit retina. A random sample of 301 neurons in the ganglion cell layer was targeted for photofilling, a method in which the arbors of the chosen neurons are revealed by diffusion of a photochemically induced fluorescent product from their somas. An additional 129 cells were labeled by microinjection of Lucifer yellow. One hundred and thirty-eight cells were visualized by expression of the gene encoding a green fluorescent protein, introduced by particle-mediated gene transfer. One hundred and sixty-six cells were labeled by particle-mediated introduction of DiI. In the total population of 734 neurons, we could identify 11 types of retinal ganglion cell. An analysis based on retinal coverage shows that this number of ganglion cell types would not exceed the available total number of ganglion cells. Although some uncertainties remain, this sample appears to account for the majority of the ganglion cells present in the rabbit retina. Some known physiological types could easily be mapped onto structural types, but half of them could not; a large set of poorly known codings of the visual input is transmitted to the brain.
Keywords: anatomy, green fluorescent protein, photofill, gene gun, neuron, photochemistry
The central issue of this study was the question: how many different representations of the visual input are transmitted by the mammalian retina to the brain? This simple but fundamental issue has not yet been resolved. For most mammalian retinas, two codings are well known: one is represented by a small receptive field with relatively sustained responses to light and linear spatial summation (X-cell), another by a cell with a larger receptive field, phasic responses, and nonlinear spatial summation (Y-cell). However, these are not the only types of ganglion cell known to exist. In the retina of the cat, ∼50% of all ganglion cells are seen anatomically to be non-β, non-α cells (the anatomical correlates of X and Y cells). A series of meticulous papers by Berson and his colleagues (Pu et al., 1994; Berson et al., 1998, 1999; Isayama et al., 2000) has now used microinjection to describe 8 types of non-α, non-β ganglion cells. Away from the fovea of the monkey, a similar proportion of non-midget, non-parasol cells exists. With only a few exceptions, the physiology of these different cell types is unknown (for review, see Dacey, 1994; Rodieck, 1998). This represents a gap in our understanding of the biological basis of vision.
The physiological classification of ganglion cells has been the most detailed in rabbit of any mammalian species. The rabbit eye is large but contains only a moderate number (380,000) of ganglion cells (Vaney, 1980). Because the ganglion cells are widely spaced over much of the retina, direct recording from this retina minimizes the sampling error introduced by metal microelectrodes. The rabbit retina has been the subject of many studies, most systematically the classic work by Levick and his colleagues, more formal studies by Daw and colleagues, and a modern analysis using multielectrodes and reverse correlation by DeVries and Baylor (Barlow et al., 1964; Barlow and Levick, 1965;Levick, 1967; Cleland and Levick, 1974b; Caldwell and Daw, 1978; Vaney et al., 1981; Levick and Thibos, 1983; DeVries and Baylor, 1997). Levick and his colleagues described 11 physiological types of ganglion cells. The most famous are the directionally selective cells, but other types responded to narrowly defined stimuli, such as local contrast within the receptive field or very rapid movements within it. Although there are areas of disagreement (see Discussion) all workers confirm this diversity.
A goal in the present work was to see how well the types of cell classified physiologically match those defined by modern anatomical methods. The underlying belief is that cells with distinct morphologies have distinct physiological functions. The evidence for this is now overwhelming, in monkey, cat, and rabbit (Perry et al., 1984; Amthor et al., 1989b; Watanabe and Rodieck, 1989; Bloomfield, 1994; Dacey and Lee, 1994; Yang and Masland, 1994; He and Masland, 1998; Rodieck, 1998; ). Thus far, the functions of 22 of the ∼55 morphological types of neuron in the rabbit retina are known; in every case a cell with a distinct structure has a distinct function (for review, seeMasland, 2001).
The best of the previous anatomical studies were detailed examinations of a single type of ganglion cell. Our approach here was somewhat different. We sought to achieve a global view of the entire cell population in the rabbit, with less detail about any particular type of cell but a more systematic effort to understand at least the rough boundaries of the total population. For this we needed survey tools. Most ways of filling retinal ganglion cells show preferences for one or more types of neurons. Our strategy was to use a panel of methods with entirely different mechanistic bases, hoping thus to achieve a representative sample.
One was microinjection, which reveals the cells brightly but creates a diffusion gradient from cell body to periphery and has unpredictable selectivity (some types of cells are harder to microinject than others). The second was particle-mediated insertion of the gene coding for the green fluorescent protein (Lo et al., 1994; Wong et al., 1998). The fluorescent protein fills cells very evenly, so that the distal dendrites are unusually well seen, but has unknown selectivity. The third was a particle-mediated introduction of DiI, which then diffuses throughout the lipid bilayer of the cell (Gan et al., 2000). The fourth was photofilling (MacNeil and Masland, 1998; MacNeil et al., 1999), which fills ganglion cells less brightly but rapidly yields a large number of filled cells.
The four methods were found to confirm each other. Although the frequency and clarity of a particular type of cell varied, most of them were independently revealed by each of the four methods. As expected, we encountered a large number of different morphological types of ganglion cell. Here we describe 11 of them. For reasons that will be discussed later, one group of cells remains incompletely characterized, but the 11 types clearly represent the large majority of all ganglion cells in this retina.
MATERIALS AND METHODS
Each method used here has been described previously (Yang and Masland, 1992; Lo et al., 1994; MacNeil and Masland, 1998; Gan et al., 2000). All protocols were approved by the Subcommittee on Research Animal Care of the Massachusetts General Hospital.
Photofilling. One day before the experiment, adult New Zealand white rabbits were intramuscularly anesthetized with a mixture of ketamine (50 mg/kg) and xylazine (10 mg/kg). A local anesthetic (proparacaine hydrochloride; 2–3 drops) was applied to the eyes before intraocular injection of 4′,6-diamidino-2-phenylindole (DAPI, 10 μg; Sigma, St. Louis, MO). Rabbits recovered overnight and were reanesthetized the next day for isolation of the retina. Each eye was removed and hemisected in oxygenated Ames medium (Sigma). The retina was dissected free from the sclera, and choroid and pieces were cut from the mid-periphery of the ventral retina, 6–10 mm inferior to the optic disk. Retinal pieces were mounted onto black, nonfluorescent filter membrane (HABP; Millipore, Bedford, MA) ganglion cell side up. The membrane and attached retina were bathed in an open dish of Ames medium that was continually gassed with 75% N2, 20% O2, and 5% CO2. The animal was killed with an overdose of anesthetic in accordance with institutional guidelines.
Dihydrorhodamine-123 (H2R123; Molecular Probes, Eugene, OR) was added to the bath to achieve a final concentration of 15–20 μm, and the dish was placed on a microscope stage (Axioplan; Zeiss, Thornwood, NY). The retina was viewed using a 40× water-immersion objective [Plan-Neofluar; numerical aperture (NA) 0.90; Zeiss] with filters appropriate for DAPI (excitation 340–380 nm; dichroic 395 nm; emission 420 nm long-pass). Single cells in the retinal ganglion cell layer were selected by using an indexed grid reticle referred to randomly generated grid coordinates. The stage was repositioned so that the randomly selected cell was in the center of the field of view. A 100 μm pinhole was placed into the back focal plane of the epifluorescent light path to produce a spot of light, nominally 2.5 μm in diameter, directly over the selected soma. When the selected cell was irradiated for 5–10 min, the nonpolar, nonfluorescent H2R123 was oxidized to the polar, fluorescent rhodamine123 (R123). Fluorescent R123 diffused throughout the cytoplasm of the irradiated cell. Several cells per piece of retina were filled, after which the tissue was rinsed and coverslipped in fresh Ames medium.
The cells were imaged using a Zeiss Axioplan microscope equipped with high numerical aperture objectives (20×, NA 0.75, Plan-Apochromat; 40×, NA 1.0 oil, Plan-Apochromat; 40× and 63×, NA 1.2 water, C-Apochromat; Zeiss), a sensitive digital camera (MicroMax cooled CCD camera; Princeton Instruments, Trenton, NJ) and image acquisition and processing software (MetaMorph; Universal Imaging Corporation, West Chester, PA). The imaging software drove an external shutter (Vincent Associates, Rochester, NY) and a z-axis focus motor (Ludl Electronic Products, Hawthorn, NY).
Two sets of images were collected for each cell. Photofilled cells were imaged using a narrow band width filter set specific for rhodamine (excitation 488–512 nm, dichroic 545 nm, emission 526–562 nm). Subsequently, a through-focus of the DAPI-stained nuclei was collected, to measure the thickness of the inner plexiform layer and determine the level of stratification of the photofilled cells.
Cell injection. Pieces of isolated retina were mounted ganglion cell side up on a glass coverslip previously coated with 3–15 μl of Cell-Tak (40240, Collaborative Biomedical Products, Bedford, MA). In some cases, pieces of retina were mounted ganglion cell side up on filter paper and held in place with mesh and a platinum ring (Yang and Masland, 1992). Retinal ganglion cells labeled with DAPI, Fast blue, or acridine orange were visualized for injection in fixed (Tauchi and Masland, 1985) or living (Yang and Masland, 1992) tissue, as previously described. Cells were filled with 4% Lucifer yellow using a 40× water-immersion objective (Zeiss Achroplan, NA 0.75). The tissue was then fixed for 1 hr in 4% paraformaldehyde (Ted Pella, Redding, CA) or overnight in 2% paraformaldehyde.
The tissue was mounted in Vectashield (Vector Laboratories, Burlingame, CA) and photographed. Alternatively, to convert the Lucifer Yellow into a permanent reaction product, the tissue was processed with immunohistochemistry by first incubating the tissue overnight in 0.5% Triton X-100 and 4% normal goat serum overnight. The tissue was then incubated for 3 d in the same solution with biotinylated anti-Lucifer yellow (1:200, A-5750; Molecular Probes, Eugene, OR) followed by 1 d in ABC solution (Vectastain Elite ABC kit; Vector). Diaminobenzidine (Kirkegaard and Perry Laboratories, Gaithersburg, MD) was used to visualize the cells.
Gene transfer. Transformation of the plasmid pEGFP (GenBank accession number 6084; Clontech, Palo Alto, CA) intoEscherichia coli (DH5α) and bacterial cell culture was performed according to standard procedures (Sambrook et al., 1989). For large-scale preparations of purified plasmid, the Qiagen (Valencia, CA) Maxi Prep kit was used.
Gold particles were coated with the green fluorescent protein (GFP) plasmid using the protocol of Lo et al. (1994) and Wong et al. (1998). For each preparation, 12.5 μg of plasmid, 100 μl of 1m CaCl, and 100 μl of 0.05 m spermidine stock solution were added to 12.5 mg of gold particles (0.6 μm; Bio-Rad, Hercules, CA) under continuous, slow vortex. Plasmid was allowed to attach to the gold particles for 10 min before recentrifugation and resuspension in absolute ethanol. The gold-plasmid suspension was then applied to the inner surface diameter of plastic tubing using a tube prep station (Bio-Rad) and dried in place with nitrogen.
Young New Zealand White rabbits (P15-P17) were studied, because some components of the procedure (either gene transfer or the subsequent time in vitro) are more successful in young animals than in adults (Wong et al., 1998). At this age the retina is still expanding in diameter, but the ganglion cells show their adult physiological types (Masland, 1977). The gene gun (Bio-Rad) was loaded with the gold plasmid-coated tubing. A nylon mesh (R-CMN-90; Small Parts Inc., Miami Lakes, FL) was placed at the nozzle of the gun to obtain better gold particle dispersion. The gun was primed to 100 psi, and the retina was flattened out on an agar plate. The nozzle was placed over the entire retina and fired. The retina was immediately rinsed in fresh Ames medium and then superfused in oxygenated Ames for 6 hr on a rocker inside an incubated chamber (30°C). After this initial incubation, the GFP-transfected retina was further incubated in fresh Ames medium for an additional 12 hr at room temperature. GFP-expressing cells were imaged the next day.
Particle-mediated introduction of DiI. This was performed as described by Gan et al. (2000). In brief, ∼50 μl of methylene chloride was added to 50 mg of 1.6 μm or 0.6 μm gold particles (Bio-Rad), and the mixture quickly spread evenly onto a glass slide. One hundred microliters of a 20 mm solution of DiI (Molecular Probes) in methylene chloride was spread evenly over the dried gold beads. The gold beads were scraped off the glass slide, placed in 3 ml of distilled water, and sonicated for 10 min. Tubing in a Bio-Rad tubing prep station was pretreated with Polyvinyl-pyrrolidone (Sigma) in isopropyl alcohol (10 mg/ml), and the beads were dried onto the inside. The retinas were shot at 80–100 psi without the use of a mesh screen, then incubated in Ames medium for 30 min to 1 hr at room temperature while rocking. After incubation, the retinas were fixed in 4% PFA, washed three times for 10 min each in 0.1m phosphate buffer, mounted in Vectashield, and immediately viewed and/or imaged.
Measurement of dendritic field area. The total number of cells required to achieve a retinal coverage (Table1) was computed from the measured dendritic field area for each of the 11 cell types. This was done from printed images similar to those shown in Figures1 and 2. For each cell type, a series of 5–10 especially well filled cells was chosen. The dendritic field was defined by a convex polygon (Rodieck, 1998) connecting the distalmost tips of the dendrites. Because this is the way most of the previously published values have been obtained, the diameter was taken as the mean of the longest and shortest diameters, and the dendritic field area was computed from that value. All of the cells studied by photofilling and most by the other methods were from a defined eccentricity 6–10 mm ventral to the optic fiber bundles.
Table 1.
Cell numbers as predicted from dendritic field size and an assumed coverage factor of 1.8 (see Results)
| Cell type | Dendritic field diameter (μm) | Dendritic field area (μm2) | Predicted number (cells/mm2) | Receptive field type |
|---|---|---|---|---|
| G1 | 180 | 25434 | 55 | Local edge detector |
| G2 | 224 | 39388 | 36 | ? |
| G3 | 228 | 40807 | 34 | ?Color? |
| G4 | 230 | 41527 | 34 | ON brisk sustained |
| G4 | 248 | 48281 | 29 | OFF brisk sustained |
| G5 | 299 | 70180 | 20 | ? |
| G6 | 324 | 82406 | 17 | Uniformity detector |
| G7 | 379 | 112758 | 48 | ON-OFF DS |
| G8 | 413 | 133897 | 10 | ? |
| G9 | 482 | 182374 | 8 | ? |
| G10 | 708 | 393492 | 12 | ON DS |
| G11 | 874 | 599643 | 2 | ON brisk transient |
| G11 | 874 | 599643 | 2 | OFF brisk transient |
| Total | 307 |
Because they have long, thin distal dendrites, G11 (alpha) cells were hard to measure in our material; we therefore used the dendritic field diameter measured by Peichl et al. (1987b) from neurofibrillar staining. The ON–OFF DS cells (G7) have four independent coverages, one for each of four cardinal directions. The ON–DS cells (G10) independently cover three cardinal directions. The predicted number of cells for G7 was accordingly multiplied by 4 and G10 by 3.
Fig. 1.

ON-OFF directionally selective ganglion cells (G7 in this nomenclature) as shown by each of our cell-filling methods. The cells are distinguished by their bistratified, medium-field, arbor and recurving dendrites (Amthor et al., 1989b; Vaney, 1994; Yang and Masland, 1994). The cells are bistratified, and an out-of-focus arbors can be glimpsed for the Lucifer-filled cell, which was photographed using an objective with low numerical aperture.
Fig. 2.
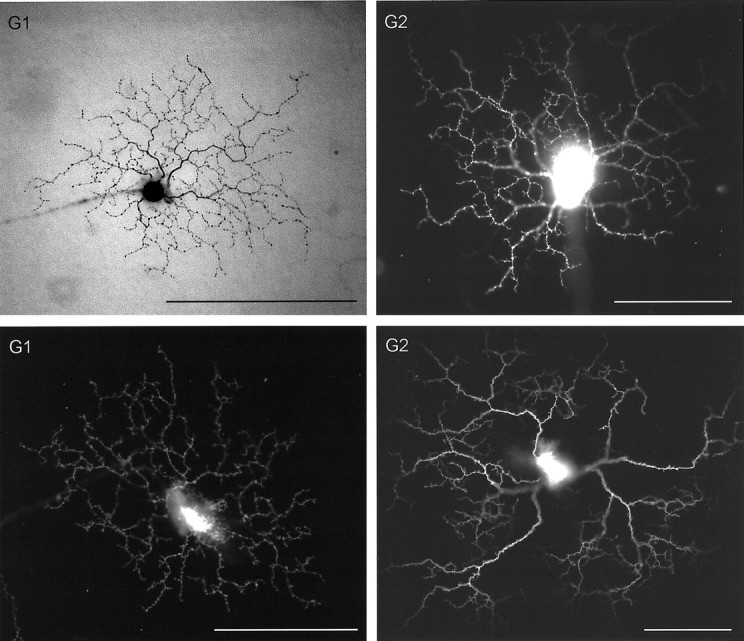


The major types of ganglion cells identified in our series. Methods of filling were as follows: G1, Top, Lucifer, immunolabeled to diaminobenzidine; bottom, DiI;G2, top and bottom, DiI;G3, ON and OFF Arbor, DiI;G4 ON, Lucifer immunolabeled to diaminobenzidine;G4 OFF, DiI; G5, top, GFP;bottom, DiI; G6, top, DiI;bottom, photofill; G8, top andbottom, photofill; G9,topand bottom, GFP; G10, top andbottom, GFP; G11 ON, Lucifer yellow;G11 OFF, DiI. Scale bars, 100 μm. (Figure 2continues.)
RESULTS
The appearance of cells filled by each of our methods is illustrated, for the well known ON–OFF directionally selective cell, in Figure 1. Photofilling and injection of Lucifer yellow yield a bright soma and a gradient of brightness from proximal dendrites to distal. Their greatest limitations are for the largest and smallest cells, the largest because it is hard to fill the distal dendrites of large (>400 μm dendritic field diameter) neurons, and the smallest because the dendrites are obscured by flare from the bright cell body. Labeling by GFP expression was more uniform. The cell body was only slightly brighter than the dendrites, and the proximal dendrites were only slightly brighter than the distal ones. GFP often filled the dendrites brightly to their tips; at least for small and medium-sized cells, it was often possible to cleanly visualize the distalmost end of the dendrites, something less consistent with photofilling or Lucifer injection. Particle-mediated introduction of DiI gave, in many cases, striking filling of the cells with excellent visualization of dendritic detail. Its drawbacks were obscuring of detail in the vicinity of the DiI-coated particle and a tendency for several cells to be labeled at once by a single particle.
Brief descriptions of the cells follow, in order of their dendritic field diameters. The descriptions use a neutral nomenclature. The previous literature is large and sometimes contradictory, and it consists primarily of drawings of cells, which embody an inherent step of interpretation by the artist. More important, names that intrinsically suggest homology between ganglion cell types in different species are risky (for instance, controversy about the homology of cat β and monkey midget cells). We will separately point out cross-species correspondences in specific individual instances where they seem especially clear.
Eleven types of ganglion cell
G1 cells were flatly arborizing neurons with a dense, narrow, dendritic field (Fig. 2). The dendritic arbors were 150–200 μm in diameter and branched narrowly in stratum S3 of the inner plexiform layer. The primary dendrites were thick and tapered from soma to periphery. They branched frequently along their course and exhibited abrupt bends and turns. The dendritic field contained many short (8–10 μm) dendritic branches. The distalmost branches almost uniformly ended in one or more short dendrites that exited the primary dendrite at a flat angle. Commonly there was a pair of such terminal dendrites. Cardinal features of the arbor of the G1 cell were thus a tapering primary dendrite and distal dendrites terminating in a pair of short dendrites, like a flattened “y”.
These cells have been identified as local edge detectors (Levick, 1967) on the basis of cells with that physiology injected after recording (Amthor et al., 1989b; Roska and Werblin, 2001). Their size, level of stratification, and branching pattern leave little doubt as to the morphological match.
G2 cells shared some morphological features with the G1 cells and also stratify narrowly in S3 but had larger, sparser, dendritic arbors and fewer short processes. In addition, they exhibited a distinctive branching pattern. G2 cells had three to five major dendrites. These emitted many much smaller branches. The secondary branches could exit the primary dendrites at various angles, not uncommonly exiting at almost a 90° angle. The primary dendrites often traversed the field with a smooth curve, but sometimes exhibited a single sharp bend 30–40 μm from the soma, so that a primary dendrite began with a straight course then made an abrupt bend. The dendritic arbor of the G2 cells, like that of the G1 cells, was flat; most of the arbor could usually be captured within a single optical plane. The dendritic arbor was often asymmetric. For many of these neurons, many dendrites were present to one side of the soma of the cell, whereas the other side contained fewer. Often there was a substantial dendrite-free zone. Sometimes this zone constituted only a narrow (45–90°) sector, but in other instances the dendritic field covered an arc of only 180°.
The G2 cells have features in common with the zeta cells of Berson et al. (1998) in the cat. Both have narrow dendritic arbors (zeta cells were ∼350 μm, at 5 mm retinal eccentricity from the visual streak of the cat). The branching pattern is similar. A gap in dendritic arbor is observed in both species (Berson et al., 1998, their Fig. 1). These cells appear not to have been identified physiologically in either the rabbit or cat.
G3 cells had small, bistratified dendritic arbors. They have three or four primary dendrites that arborize near the border between S4 and S5. These dendrites show few specializations. Processes descend from the primary dendrites to a second arbor, located in S2 and consisting of frequently branching dendrites. Many short (5–10 μm), thin dendrites give the outer (OFF) arbor a delicate appearance. The dendritic field diameter of the cell ranges from 200 to 300 μm.
No cells of this morphological type have been injected after recording. They would be predicted to have ON and OFF responses. Conceivably they could be chromatically coded cells analogous to the blue–yellow cell extensively studied in the monkey (Calkins et al., 1998; Dacey, 2000). Blue-sensitive, chromatically opponent ganglion cells have been described in recordings from ganglion cells of the rabbit (Caldwell and Daw, 1978; Vaney et al., 1981).
G4 cells had dendritic arbors only slightly larger than G2 cells and G3 cells; but they had a dramatically different pattern of branching and stratification. They had two to four thick primary dendrites, which emitted a profusion of thinner and shorter (1–5 μm) branches. Secondary dendrites exited the primary dendrites at no consistent angle; they could branch acutely away from the soma, nearly perpendicularly, or point back toward the soma. They often ended with a swelling or varicosity at the tip. Because of the great profusion of these fine dendrites, they dominated the visual appearance of the dendritic arbor and the large number of varicosities that they bore caused an easily recognizable phenotype. G4 cells came in ON and OFF varieties. Their stratification within the inner plexiform layer was thick, occupying the strata between S3 and S4 or S2 and S3, respectively, of the inner plexiform layer. This contributed to the dense appearance of their arbor when viewed in single optical planes.
These cells have features suggesting homology to the β cell of the cat (Boycott and Wässle, 1974). They are narrowly branching cells, although size alone is not definitive because G1, G2, and G3 have dendritic field diameters in the same approximate range. More important are the pattern of extremely thin dendrites, with their characteristic multitude of varicosities, and their branching within several sublaminas of the inner plexiform layer. This would suggest that they should be brisk-sustained cells, also indicated by injection after recording (Amthor et al., 1989b; Roska and Werblin, 2001).
G5 cells had dendritic field diameters ∼300 μm in diameter, substantially larger than those of G1–G4. They had four to six primary dendrites. The primary dendrites tapered little from soma to periphery. Secondary dendrites could exit the primary dendrite at any point along its course. Whereas there were usually branch points near the ends of the primary dendrites, secondary dendrites could also exit from intermediate points, closer to the soma of the cell, from which point they could extend to the perimeter of the dendritic field. The secondary dendrites were remarkably uniform in diameter. A common observation was a short (∼10 μm) terminal dendrite that fishhooked back toward the cell body, so that its tip pointed toward the interior of the dendritic field. A distinctive feature of these cells was that almost all of the dendrites–primary and secondary–exhibited frequent smooth curves, with radii of ∼5–15 μm. Secondary dendrites effectively filled the potentially empty spaces in the dendritic arbor so that the dendritic arbor covered the dendritic field very evenly. All of these cells appeared to be OFF cells; their dendritic arbors occupied depths at 20–40% of the thickness of the inner plexiform layer (S2).
A medium-field cell termed eta has been described by Berson et al. (1999) in the cat, but the eta cell lacks the smoothly curving appearance of the G5 cell and is more broadly stratified. None of the cells injected after recording (Amthor et al., 1989a,b; Yang and Masland, 1994; He and Masland, 1998) had this morphology.
G6 cells were medium-field neurons characterized by an irregular, disorganized-looking dendritic arbor. They had three to six primary dendrites and a dendritic arbor spanning 300–500 μm of the retina. Their dendritic branching lacked the orderly, radiating pattern evident for most wide-field neurons of the retina. Secondary dendrites could be emitted at almost any distance from the cell body and at any possible angle. Sometimes they ran at 90° to a primary dendrite. Because of this lack of regularity, the dendrites often crossed one another. There were few side branches. One result was that the dendritic field was a very uneven one, in which some patches of the retina were covered by many dendrites and other patches were not covered at all (our laboratory nickname for them was “drunk” cells.) Had only a few examples been encountered, one might be tempted to interpret these cells as developmental accidents, but they were repeatedly seen in the photofilled and GFP samples and have been observed by others, as discussed below. The dendrites had a uniform caliber. This again contrasts with many other ganglion cells, whose dendrites taper from cell body to periphery. The dendrites bore few specializations.
These cells were multistratified in layers S4 and S5. Their branching very much resembles that of epsilon cells stained in the monkey retina (Rodieck, 1998). An apparently similar cell was injected after recording in the rabbit retina (Amthor et al., 1989b, their Fig. 19) and identified with the “uniformity detector” described in physiological experiments by Levick (1967). Such cells have a high maintained rate of firing. It is suppressed by changes in the pattern or amount of light falling anywhere within the receptive field, be the change a brightening, dimming, or movement of the stimulus.
G7 cells are the ON–OFF directionally selective cells (Fig. 1) that have been extensively described in the rabbit retina (Amthor et al., 1989b; Famiglietti, 1992; Vaney, 1994; Yang and Masland, 1994). They are medium-field neurons with bistratified dendritic arbors. The pattern of dendrites contains many recurving loops, giving the whole arbor a distinctive honeycombed appearance.
G8 cells had large, sparsely branched dendritic arbors. Because the arbors had an irregular shape, and because we were unlikely to have filled the dendrites to their tips, an average total dendritic field diameter could only be approximately measured. From what could be seen, although, the extent of their dendrites was surely not <400 μm. These neurons commonly had a fusiform soma, emitting one major dendrite at each pole. Sometimes a third dendrite was emitted at 90° to the long axis of the cell. In another variant, two large dendrites exited the soma at 180° from each other. However, after 50–100 μm, a third major branch was emitted from one of the original two, often at a 90° angle. The arbor of primary dendrites in such cases thus consisted of three major dendrites, two directly exiting the soma and a third exiting one of the primary dendrites at 90°. The cells were sparsely branched and each branch was relatively straight; it was common for a primary or secondary dendrite to traverse >300 μm without significant curvature. The dendrites were smooth and had few of the fine-scale specializations observed for many other types of retinal ganglion cells.
Amacrine cells with this general appearance were observed, but axons of the G8 cells were sometimes visualized. Most of the G8 cells stratified in S4, but wide-field cells stratifying in other layers were also seen (see below). In the monkey a similar ganglion cell was termed a gamma cell (Rodieck, 1998). These cells appear not to have been identified physiologically.
G9 cells look similar to G10 cells but stratify at the border of S1 and S2 of the inner plexiform layer (IPL) in the OFF sublamina. The G9 cells were morphologically similar to the OFF delta ganglion cells studied in cats, which can be visualized as a population by their accumulation of dihydroxytryptamine (Wässle et al., 1987; Dacey, 1989). In neither species has an OFF delta cell been injected after recording; their physiological function therefore remains unknown.
G10 cells somewhat resembled α (G11) cells but were smaller in size, arborized at different levels of the IPL, and had a different branching pattern. Their proximal dendrites were thinner than those of α cells. Their primary dendrites often gave rise to long secondary dendrites, which sometimes ran to the perimeter of the dendritic field. This contrasts with α cells, whose dendrites usually divide into daughters of more or less equal length.
G10 cells are clearly the ON delta cells previously studied in detail (Buhl and Peichl, 1986; Pu and Amthor, 1990; Famiglietti, 1992). The ON delta cells project selectively to the medial terminal nucleus of the accessory optic system. Recording from these cells showed them to be the ON-type directionally selective cell (Oyster et al., 1980; Amthor et al., 1989b; He and Masland, 1998).
G11 cells are the α cells, a constant feature of most mammalian retinas (Peichl et al., 1987a). They were the largest cells in our sample and came in ON and OFF varieties. Physiologically, these are the brisk transient cells of Cleland and Levick (1974a), otherwise known as Y cells (Enroth-Cugell and Robson, 1966; Hochstein and Shapley, 1976a,b; Caldwell and Daw, 1978).
Unclassified cells
A trivial kind of unclassifiable cell is represented by scarce cells that appear to be developmental accidents. An example is shown in Figure 3A. Sometimes we had only a single clear example. Our primary reason for believing that this apparent type of cell is a developmental accident is its scarcity. To cover the retina, a cell with this narrow a dendritic field would need to be present in high numbers. Even if one of our methods had a selectivity against this particular type of cell, it is not likely that all four methods would select against it and a sample as large as ours should have revealed multiple examples. Reproducible developmental “accidents” have been shown to occur; such cells can have reproducible morphologies, but the numbers of cells varies widely from animal to animal and they have absolute densities that leave large gaps in the retinal coverages (Wässle and Boycott, 1991; Masland et al., 1993).
Fig. 3.

Unclassified cells. A shows a small cell, clearly filled but rarely encountered by any of our methods; these appear to be developmental accidents. B–D show medium-field cells that we were unable confidently to assign to one of the other types. All are labeled with DiI. Scale bars, 100 μm.
More problematic are cells that could be transition cases among clearer types or that lacked sufficiently distinctive differences in morphology and stratification to allow them to be reproducibly identified by morphological criteria alone. Delta-like cells (Fig.3B–D) resembled the G9 and G10 cells in dendritic field size and overall density of dendrites but had distinctive features that made us hesitate to force them into a single type. As described above, our canonical G10 cell was the ON-DS cell, recognized in all four of our samples and independently shown as a functional type by injection after recording (Amthor et al., 1989b; He and Masland, 1998) and by retrograde tracing from its terminal axonal projection (Buhl and Peichl, 1986). However, we also encountered medium-sized cells that varied in morphology from the previously described G10 cells. In their overall appearance, and their heterogeneity, these resemble a group of cells previously injected in the cat (Stanford, 1987, their Fig. 4). One group had radiating branches somewhat like those of an α cell (G11), but were smaller than α cells and had oval rather than multipolar somata. However, variants on this plan existed and we could not find features clear enough to decide whether these represent one additional cell type, several types, or a variant of the standard G9 or G10 cells.
The second group of unclassifiable cells were sparsely branched wide-field cells. Whereas the G10 and G11 cells described above are unambiguously clear wide-field entities, there were other wide-field cells that were not readily classifiable. As for amacrine cells, (MacNeil and Masland, 1998; MacNeil et al., 1999) wide-field cells vary more in their level of stratification than they do in their dendritic morphology. However, distinguishing among types of cells on the basis of stratification alone is perilous for wide-field cells; it often requires an absolute judgment of the depth of a few thin dendrites, with no reference point in depth except the margins of the inner plexiform layer. For amacrine cells, there appears to be at least one wide-field cell for each of the five strata of the inner plexiform layer. Conceivably a similar situation exists for ganglion cells, but we cannot be certain because these cells, which can span 1–2 mm in dendritic diameter, can achieve coverage of the retina using a very low absolute frequency of neurons of each type, and few examples were sampled.
DISCUSSION
We have divided the observed ganglion cells into 11 types (Fig.4), and this seems to be a minimum. Conventional practice would make this 13 types, because ON and OFF versions of G4 and G11 would be counted as separate entities. Marc and Jones (2002) made a multivariate analysis of the amino acid content of rabbit ganglion cell somas. They distinguished 14 types, a number close to ours. There may well be one or more other medium-field cell type, among the cells we have called “delta-like.” There may also be further functional divisions among the wide-field cells, although these cells are relatively few and poorly understood–they could serve similar functions despite differing stratification. With these exceptions, our four different methods seem to have revealed most of the types that exist, at least with any frequency; by the end of the experiments we were no longer encountering “new” types.
Fig. 4.

The branching and level of stratification for the 11 types of neuron identified. Scale bar, 100 μm.
Eleven types of ganglion cell could cover the retina within the known ganglion cell density
Retinal ganglion cells cover the retina evenly; they tile its surface (Wässle and Riemann, 1978; Wässle et al., 1981,1983; Rockhill et al., 2000). This principle, which has been confirmed for at least 20 retinal neurons of various types, allows us to answer, at least to a first approximation, the following question: are there enough ganglion cells in the rabbit retina to accommodate 11 functional types of ganglion cells? If we have artificially created too many types, the requirement that each cover the retina would dictate that the total number of ganglion cells exceed the number of ganglion cells known to exist.
The coverage factor of a retinal neuron is given by the product of its dendritic field area and spatial density (Wässle and Riemann, 1978). For simplicity, we assumed a uniform coverage factor of 1.8 for all cells (DeVries and Baylor, 1997). From the dendritic field area and coverage, we computed the spatial density at which each cell should be present. The analysis is summarized in Table 1, which shows each of the cell types described here together with its dendritic field area. The individual densities are summed to reach a predicted total of 307 cells/mm2. This may be compared with the independently known density of retinal ganglion cells at this eccentricity, 540 cells/mm2 (Vaney, 1980;Masland et al., 1984).
The largest uncertainty in this analysis is the assumed value of the coverage factor, which was taken as 1.8 on the basis of work byDeVries and Baylor (1997). They measured the physiological coverage, which should closely match the dendritic field area (Peichl and Wässle, 1983; Yang and Masland, 1994): the advantage of their study is that many different types of ganglion cell were surveyed by a single set of criteria. Anatomical estimates of dendritic field coverage range from 1.4 for DS cells (Vaney, 1994) to 3.2 for α cells (Peichl et al., 1987b), and the predicted total number of ganglion cells would scale linearly with the assumed coverage factor. Because of this uncertainty, the absolute coverages shown in Table 1are not definitive. Even if one assumes a universal coverage of as high as 3, however, the predicted number of cells (564 cells/mm2) is close to the number of ganglion cells available.
The match between morphological types and physiological types is only partial
Three generations of physiological results are summarized in Table2, beginning with the classic studies byLevick (1967). The comparison brings good news and bad news. The good news is that a substantial group of ganglion cells of the rabbit retina are now fairly securely understood. There is agreement among physiologists and the structural counterpart can be identified with reasonable confidence. These include the brisk transient and brisk sustained cells, two types of directionally selective cells, the local edge detector, and the uniformity detector. The bad news is that there exists a substantial group of neurons whose properties are far less clear. Caldwell and Daw (1978) found sluggish transient and sluggish sustained groups of neurons, whereas DeVries and Baylor (1997) did not find a distinction between the two, nor did they detect a uniformity detector or orientation sensitive neurons. On the other hand, DeVries and Baylor (1997) identified neurons that they termed OFF delayed and OFF eta, which were not observed by the earlier workers. Not included in Table 2 is an important recent study by Roska and Werblin (2001)that uses an entirely different physiological taxonomy. Because this has not yet been described in detail, matching their results to the present ones remains a future task. Presumably G2 and G8, for which we cannot find a ready counterpart, will be identified with some types of cells included in these groups; another possible source of cells is the delta-like neurons, which we ourselves had difficulty resolving. In the end, however, this matching cannot take place without a definitive physiological classification. The match of physiological with morphological types is thus incomplete. There are morphological types for which a physiological counterpart cannot yet be identified and physiological types that (even if there were complete agreement among electrophysiologists) cannot be morphologically identified. As noted at the outset (in introductory remarks), it appears that a similar situation pertains for the retinas of the cat and monkey.
Table 2.
Taxonomies of receptive field types in the rabbit retina
| Levick (1967) | Caldwell and Daw (1978),Vaney et al. (1981) | DeVries and Baylor (1997) | Structural type |
|---|---|---|---|
| ON concentric | ON brisk transient (Y) | ON brisk transient | G11 |
| NT | OFF brisk transient (Y) | OFF brisk transient | G11 |
| NT | ON brisk sustained (X) | ON brisk sustained | G4 |
| NT | OFF brisk sustained (X) | OFF brisk sustained | G4 |
| ON–OFF DS | ON–OFF DS | ON–OFF DS | G7 |
| ON–DS | ON–DS | ON–DS | G10 |
| Local edge detector | Local edge detector | Local edge detector | G1 |
| Uniformity detector | Uniformity detector | ? | G6 |
| NT | Color | NT | ?G3? |
| NT | ON-sluggish transient | ON sluggish | ? |
| NT | OFF-sluggish transient | OFF sluggish | ? |
| NT | ON-sluggish sustained | ? | ? |
| NT | OFF-sluggish sustained | ? | ? |
| Orientation selective | Orientation sensitive | ? | ? |
| ? | ? | OFF delayed | ? |
| ? | ? | ON eta | ? |
| Large field | Fast movement | ? | ? |
The cell types are arranged as they appear to correspond between the different groups. In the early studies of Levick (1967), cells with a simple center-surround organization were lumped, with no attempt to further subdivide them. By the early 1980s, a near consensus had been achieved between the different groups; it is shown in the second column. [Three rare types, edge inhibitory, edge detector, and directional orientation were initially reported but have not reappeared in recent studies from that laboratory (He, 1994; He et al., 1998)]. In some cases, the type of stimulation would not have revealed certain cell types; these are indicated as not tested (NT).
Implications for function: non-X, non-Y codings of the visual input
These results show that the flow of information from retina to brain has been incompletely described even for the rabbit, one of the most intensively studied and experimentally tractable of mammalian retinas. Some of the gaps were described in the preceding section. But substantial questions are also raised among those ganglion cell types whose receptive field type is known.
For example, which type of ganglion cell is used for high-acuity (form) vision? The traditional view would be that a β-like cell, presumably G4, with brisk sustained (X-like) responses does this job. But two other monostratified neurons, G1 and G2, have narrower dendritic arbors than G4. Ganglion cell G1, the “local edge detector”, has been treated as rare because of low encounter frequencies in electrophysiological experiments, but this is almost certainly because of its small soma size. There is every reason to think that these are more numerous than the β-like cells: despite their small size they were encountered by all four of our cell-filling methods, and cells this small would, from first principles, need to be numerous to cover the retina. If so, what do they contribute to vision? The local edge detector responds to local contours, but responds best if they occupy only a fraction of the receptive field center. Why is this neuron–a narrower filter than a β cell–the most numerous ganglion cell in this retina? And what is the coding transmitted by G2, which should be nearly as populous?
By contrast, what is the role of the moderately wide-spreading “uniformity detectors,” G6 in our listing? These cells are reported to be suppressed by contrast; they have a relatively high maintained rate of firing that is silenced by any form of stationary or moving contour. Perhaps they are some sort of primitive “early warning system” that does not participate in higher visual function, but there is no a priori reason for this to be so: they appear to be more numerous than the α (Y) cells, which are believed critical for higher visual processing.
Where do we go from here?
As evident from Table 2, even skilled electrophysiologists have failed to achieve a consensus on the types of receptive field in the rabbit retina–the set of codings transmitted by the rabbit retina to the brain. An alternative approach is to base a typology on ganglion cell structure–the cells are immutable, physical objects that do not change with the variations of observational technique (type of electrode, choice of stimulus sets, method of data analysis). Newly developed methods for backfilling living neurons from defined central targets should speed the characterization of the morphological types whose physiology remains unknown; the cells can now be specifically targeted for recording in isolated retinas (Yang and Masland, 1992;Dacey and Lee, 1994; Pu et al., 1994; Dacey et al., 2001). The same method will also reveal the central targets of the cells and thus inform as to their function.
However, this will only build a platform for future work (quantitative modeling, knock-out experiments) in those cases where the type of neuron is very distinctive morphologically. Despite much experience with the identification and classification of retinal cell types (Tauchi and Masland, 1984, 1985; Sandell and Masland, 1986; Sandell et al., 1989; Tauchi et al., 1990; Masland et al., 1993; Jeon and Masland, 1995; He and Masland, 1998; MacNeil and Masland, 1998; He et al., 1999;Brown and Masland, 1999; MacNeil et al., 1999) a fraction of ganglion cells could not be confidently distinguished by us from morphology alone. Such distinctions could probably be made, by measuring the depth of stratification more precisely, using fiducial marks such as the depth of the ChAT bands. However, such methods are far too cumbersome for routine use. For systematic progress, cell-type-specific marker proteins will probably need to be found or created (Gustincich et al., 1997; Feng et al., 2000; Puopolo et al., 2001) (L. Huang, M. Max, R. F. Margolskee, H. Su, R. H. Masland, and T. Euler, unpublished observations).
Footnotes
R.H.M. is a Senior Investigator of Research to Prevent Blindness.
Correspondence should be addressed to Dr. Richard H. Masland, Wellman 429, Massachusetts General Hospital, 50 Blossom Street, Boston, MA 02114. E-mail: masland@helix.mgh.harvard.edu.
REFERENCES
- 1.Amthor FR, Takahashi ES, Oyster CW. Morphologies of rabbit retinal ganglion cells with concentric receptive fields. J Comp Neurol. 1989a;280:72–96. doi: 10.1002/cne.902800107. [DOI] [PubMed] [Google Scholar]
- 2.Amthor FR, Takahashi EH, Oyster CW. Morphologies of rabbit retinal ganglion cells with complex receptive fields. J Comp Neurol. 1989b;280:97–121. doi: 10.1002/cne.902800108. [DOI] [PubMed] [Google Scholar]
- 3.Barlow HB, Levick WR. The mechanism of directionally selective units in rabbit's retina. J Physiol (Lond) 1965;178:477–504. doi: 10.1113/jphysiol.1965.sp007638. [DOI] [PMC free article] [PubMed] [Google Scholar]
- 4.Barlow HB, Hill RM, Levick WR. Retinal ganglion cells responding selectively to direction and speed of image motion in the rabbit. J Physiol (Lond) 1964;173:377–407. doi: 10.1113/jphysiol.1964.sp007463. [DOI] [PMC free article] [PubMed] [Google Scholar]
- 5.Berson DM, Pu M, Famiglietti EV. The zeta cell: a new ganglion cell type in cat retina. J Comp Neurol. 1998;399:269–288. doi: 10.1002/(sici)1096-9861(19980921)399:2<269::aid-cne9>3.0.co;2-z. [DOI] [PubMed] [Google Scholar]
- 6.Berson DM, Isayama T, Pu M. The eta ganglion cell type of the cat retina. J Comp Neurol. 1999;408:204–219. [PubMed] [Google Scholar]
- 7.Bloomfield S. Orientation-sensitive amacrine and ganglion cells in the rabbit retina. J Neurophysiol. 1994;71:1672–1691. doi: 10.1152/jn.1994.71.5.1672. [DOI] [PubMed] [Google Scholar]
- 8.Boycott BB, Wässle H. The morphological types of ganglion cells of the domestic cat's retina. J Physiol (Lond) 1974;240:397–419. doi: 10.1113/jphysiol.1974.sp010616. [DOI] [PMC free article] [PubMed] [Google Scholar]
- 9.Brown SP, Masland RH. Costratification of a population of bipolar cells with the direction selective circuitry of the rabbit retina. J Comp Neurol. 1999;408:97–106. [PubMed] [Google Scholar]
- 10.Buhl EH, Peichl L. Morphology of rabbit retinal ganglion cells projecting to the medial terminal nucleus of the accessory optic system. J Comp Neurol. 1986;253:163–174. doi: 10.1002/cne.902530204. [DOI] [PubMed] [Google Scholar]
- 11.Caldwell JH, Daw NW. New properties of rabbit retinal ganglion cells. J Physiol (Lond) 1978;276:257–276. doi: 10.1113/jphysiol.1978.sp012232. [DOI] [PMC free article] [PubMed] [Google Scholar]
- 12.Calkins DJ, Tsukamoto Y, Sterling P. Microcircuitry and mosaic of a blue-yellow ganglion cell in the primate retina. J Neurosci. 1998;18:3373–3385. doi: 10.1523/JNEUROSCI.18-09-03373.1998. [DOI] [PMC free article] [PubMed] [Google Scholar]
- 13.Cleland BG, Levick WR. Brisk and sluggish concentrically organized ganglion cells in the cat's retina. J Physiol (Lond) 1974a;240:421–456. doi: 10.1113/jphysiol.1974.sp010617. [DOI] [PMC free article] [PubMed] [Google Scholar]
- 14.Cleland BG, Levick WR. Properties of rarely encountered types of ganglion cells in the cat's retina and an overall classification. J Physiol (Lond) 1974b;240:457–492. doi: 10.1113/jphysiol.1974.sp010618. [DOI] [PMC free article] [PubMed] [Google Scholar]
- 15.Dacey DM. Monoamine-accumulating ganglion cell type of the cat's retina. J Comp Neurol. 1989;288:59–80. doi: 10.1002/cne.902880106. [DOI] [PubMed] [Google Scholar]
- 16.Dacey DM. Physiology, morphology and spatial densities of identified ganglion cell types in the primate retina. Ciba Found Symp. 1994;184:12–34. doi: 10.1002/9780470514610.ch2. [DOI] [PubMed] [Google Scholar]
- 17.Dacey DM. Parallel pathways for spectral coding in primate retina. Annu Rev Neurosci. 2000;23:743–775. doi: 10.1146/annurev.neuro.23.1.743. [DOI] [PubMed] [Google Scholar]
- 18.Dacey DM, Lee BB. The “blue-on” opponent pathway in primate retina originates from a distinct bistratified ganglion cell type. Nature. 1994;367:731–735. doi: 10.1038/367731a0. [DOI] [PubMed] [Google Scholar]
- 19.Dacey DM, Peterson BB, Gamlin PD, Robinson FR. Retrograde photofilling reveals the complete dendritic morphology of diverse new ganglion cell types that project to the lateral geniculate nucleus in macaque monkey. Invest Ophthalmol Vis Sci. 2001;42:S114. [Google Scholar]
- 20.DeVries SH, Baylor DA. Mosaic arrangement of ganglion cell receptive fields in rabbit retina. J Neurophysiol. 1997;78:2048–2060. doi: 10.1152/jn.1997.78.4.2048. [DOI] [PubMed] [Google Scholar]
- 21.Enroth-Cugell C, Robson JG. The contrast sensitivity of retinal ganglion cells of the cat. J Physiol (Lond) 1966;187:517–552. doi: 10.1113/jphysiol.1966.sp008107. [DOI] [PMC free article] [PubMed] [Google Scholar]
- 22.Famiglietti EV. New metrics for analysis of dendritic branching patterns demonstrating similarities and differences in ON and ON-OFF directionally selective retinal ganglion cells. J Comp Neurol. 1992;324:295–321. doi: 10.1002/cne.903240302. [DOI] [PubMed] [Google Scholar]
- 23.Feng G, Mellor RH, Bernstein M, Keller-Peck C, Nguyen QT, Wallace M, Nerbonne JM, Lichtman JW, Sanes JR. Imaging neuronal subsets in transgenic mice expressing multiple spectral variants of GFP. Neuron. 2000;28:41–51. doi: 10.1016/s0896-6273(00)00084-2. [DOI] [PubMed] [Google Scholar]
- 24.Gan W-B, Grutzendler J, Wong WT, Wong ROL, Lichtman JW. Multicolor “DiOlistic” labeling of the nervous system using lipophilic dye combinations. Neuron. 2000;27:219–225. doi: 10.1016/s0896-6273(00)00031-3. [DOI] [PubMed] [Google Scholar]
- 25.Gustincich S, Feigenspan A, Wu DK, Koopman LJ, Raviola E. Control of dopamine release in the retina: a transgenic approach to neural networks. Neuron. 1997;18:723–736. doi: 10.1016/s0896-6273(00)80313-x. [DOI] [PubMed] [Google Scholar]
- 26.He S-G. PhD thesis. Australian National University, Canberra; 1994. Further investigations of direction selective ganglion cells of the rabbit retina. [Google Scholar]
- 27.He S-G, Masland RH. ON direction-selective ganglion cells in the rabbit retina: dendritic morphology and pattern of fasciculation. Vis Neurosci. 1998;15:369–375. doi: 10.1017/s095252389815215x. [DOI] [PubMed] [Google Scholar]
- 28.He S-G, Levick WR, Vaney DI. Distinguishing direction selectivity from orientation selectivity in the rabbit retina. Vis Neurosci. 1998;15:439–447. doi: 10.1017/s0952523898153038. [DOI] [PubMed] [Google Scholar]
- 29.He S-G, Jin ZF, Masland RH. The non-discriminating zone of directionally selective retinal ganglion cells: comparison with dendritic structure and implication for mechanism. J Neurosci. 1999;19:8049–8056. doi: 10.1523/JNEUROSCI.19-18-08049.1999. [DOI] [PMC free article] [PubMed] [Google Scholar]
- 30.Hochstein S, Shapley RM. Quantitative analysis of retinal ganglion cell classifications. J Physiol (Lond) 1976a;262:237–264. doi: 10.1113/jphysiol.1976.sp011594. [DOI] [PMC free article] [PubMed] [Google Scholar]
- 31.Hochstein S, Shapley RM. Linear and nonlinear spatial subunits in Y cat retinal ganglion cells. J Physiol (Lond) 1976b;262:265–284. doi: 10.1113/jphysiol.1976.sp011595. [DOI] [PMC free article] [PubMed] [Google Scholar]
- 32.Isayama T, Berson DM, Pu M. Theta ganglion cell type of the cat retina. J Comp Neurol. 2000;417:32–48. doi: 10.1002/(sici)1096-9861(20000131)417:1<32::aid-cne3>3.0.co;2-s. [DOI] [PubMed] [Google Scholar]
- 33.Jeon C-J, Masland RH. A population of wide-field bipolar cells in the rabbit's retina. J Comp Neurol. 1995;360:403–412. doi: 10.1002/cne.903600304. [DOI] [PubMed] [Google Scholar]
- 34.Levick WR. Receptive fields and trigger features of ganglion cells in the visual streak of the rabbit's retina. J Physiol (Lond) 1967;188:285–307. doi: 10.1113/jphysiol.1967.sp008140. [DOI] [PMC free article] [PubMed] [Google Scholar]
- 35.Levick WR, Thibos LN. Receptive fields of cat ganglion cells: classification and construction. Prog Retin Res. 1983;2:267–319. [Google Scholar]
- 36.Lo DC, McAllister AK, Katz LC. Neuronal transfection in brain slices using particle-mediated gene transfer. Neuron. 1994;13:1263–1268. doi: 10.1016/0896-6273(94)90412-x. [DOI] [PubMed] [Google Scholar]
- 37.MacNeil MA, Masland RH. Extreme diversity among amacrine cells: implications for function. Neuron. 1998;20:971–982. doi: 10.1016/s0896-6273(00)80478-x. [DOI] [PubMed] [Google Scholar]
- 38.MacNeil MA, Heussy JK, Dacheux R, Raviola E, Masland RH. The shapes and numbers of amacrine cells: matching of photofilled with Golgi-stained cells in the rabbit retina and comparison with other mammalian species. J Comp Neurol. 1999;413:305–326. [PubMed] [Google Scholar]
- 39.Marc RE, Jones BW. Molecular phenotyping of retinal ganglion cells. J Neurosci. 2002;22:413–427. doi: 10.1523/JNEUROSCI.22-02-00413.2002. [DOI] [PMC free article] [PubMed] [Google Scholar]
- 40.Masland RH. Maturation of function in the developing rabbit retina. J Comp Neurol. 1977;175:275–286. doi: 10.1002/cne.901750303. [DOI] [PubMed] [Google Scholar]
- 41.Masland RH. Neuronal diversity in the retina. Curr Opin Neurobiol. 2001;11:431–436. doi: 10.1016/s0959-4388(00)00230-0. [DOI] [PubMed] [Google Scholar]
- 42.Masland RH, Mills JW, Hayden SA. Acetylcholine-synthesizing amacrine cells: identification and selective staining by using autoradiography and fluorescent markers. Proc R Soc Lond B Biol Sci. 1984;223:79–100. doi: 10.1098/rspb.1984.0084. [DOI] [PubMed] [Google Scholar]
- 43.Masland RH, Rizzo JF, Sandell JH., III Developmental variation in the structure of the retina. J Neurosci. 1993;13:5194–5202. doi: 10.1523/JNEUROSCI.13-12-05194.1993. [DOI] [PMC free article] [PubMed] [Google Scholar]
- 44.Oyster CW, Simpson JI, Takahashi ES, Soodak RE. Retinal ganglion cells projecting to the rabbit accessory optic system. J Comp Neurol. 1980;190:49–61. doi: 10.1002/cne.901900105. [DOI] [PubMed] [Google Scholar]
- 45.Peichl L, Wässle H. The structural correlate of the receptive field centre of alpha ganglion cells in the cat retina. J Physiol (Lond) 1983;341:309–324. doi: 10.1113/jphysiol.1983.sp014807. [DOI] [PMC free article] [PubMed] [Google Scholar]
- 46.Peichl L, Ott H, Boycott BB. Alpha ganglion cells in mammalian retinae. Proc R Soc Lond B Biol Sci. 1987a;231:169–197. doi: 10.1098/rspb.1987.0040. [DOI] [PubMed] [Google Scholar]
- 47.Peichl L, Buhl EH, Boycott BB. Alpha ganglion cells in the rabbit retina. J Comp Neurol. 1987b;263:25–41. doi: 10.1002/cne.902630103. [DOI] [PubMed] [Google Scholar]
- 48.Perry VH, Oehler R, Cowey A. Retinal ganglion cells that project to the dorsal lateral geniculate nucleus in the macaque monkey. Neuroscience. 1984;12:1101–1123. doi: 10.1016/0306-4522(84)90006-x. [DOI] [PubMed] [Google Scholar]
- 49.Pu M, Amthor FR. Dendritic morphologies of retinal ganglion cells projecting to the nucleus of the optic tract in the rabbit. J Comp Neurol. 1990;302:657–674. doi: 10.1002/cne.903020319. [DOI] [PubMed] [Google Scholar]
- 50.Pu M, Berson DM, Pan T. Structure and function of retinal ganglion cells innervating the cat's geniculate wing: an in vitro study. J Neurosci. 1994;14:4338–4358. doi: 10.1523/JNEUROSCI.14-07-04338.1994. [DOI] [PMC free article] [PubMed] [Google Scholar]
- 51.Puopolo M, Hochstetler SE, Gustincich S, Wightman RM, Raviola E. Extrasynaptic release of dopamine in a retinal neuron: activity dependence and transmitter modulation. Neuron. 2001;30:211–225. doi: 10.1016/s0896-6273(01)00274-4. [DOI] [PubMed] [Google Scholar]
- 52.Rockhill RL, Euler T, Masland RH. Spatial order within but not between types of retinal neurons. Proc Natl Acad Sci USA. 2000;97:2303–2307. doi: 10.1073/pnas.030413497. [DOI] [PMC free article] [PubMed] [Google Scholar]
- 53.Rodieck RW. The first steps in seeing. Sinauer; Sunderland, MA: 1998. [Google Scholar]
- 54.Roska B, Werblin F. Vertical interactions across ten parallel, stacked representations in the mammalian retina. Nature. 2001;410:583–587. doi: 10.1038/35069068. [DOI] [PubMed] [Google Scholar]
- 55.Sambrook J, Fritch EF, Maniatis T. Molecular cloning: a laboratory manual. Cold Spring Harbor Laboratory; New York: 1989. [Google Scholar]
- 56.Sandell JH, Masland RH. A system of indoleamine-accumulating neurons in the rabbit retina. J Neurosci. 1986;6:3331–3347. doi: 10.1523/JNEUROSCI.06-11-03331.1986. [DOI] [PMC free article] [PubMed] [Google Scholar]
- 57.Sandell JH, Masland RH, Raviola E, Dacheux RF. Connections of indoleamine-accumulating cells in the rabbit retina. J Comp Neurol. 1989;283:303–313. doi: 10.1002/cne.902830210. [DOI] [PubMed] [Google Scholar]
- 58.Stanford LR. W-cells in the cat retina: correlated morphological and physiological evidence for two distinct classes. J Neurophysiol. 1987;57:218–244. doi: 10.1152/jn.1987.57.1.218. [DOI] [PubMed] [Google Scholar]
- 59.Tauchi M, Masland RH. The shape and arrangement of the cholinergic neurons in the rabbit retina. Proc R Soc Lond B Biol Sci. 1984;223:101–119. doi: 10.1098/rspb.1984.0085. [DOI] [PubMed] [Google Scholar]
- 60.Tauchi M, Masland RH. Local order among the dendrites of an amacrine cell population. J Neurosci. 1985;5:2494–2501. doi: 10.1523/JNEUROSCI.05-09-02494.1985. [DOI] [PMC free article] [PubMed] [Google Scholar]
- 61.Tauchi M, Madigan NM, Masland RH. Shapes and distributions of the catecholamine-accumulating neurons in the rabbit retina. J Comp Neurol. 1990;293:178–189. doi: 10.1002/cne.902930203. [DOI] [PubMed] [Google Scholar]
- 62.Vaney DI. A quantitative comparison between the ganglion cell populations and axonal outflows of the visual streak and periphery of the rabbit retina. J Comp Neurol. 1980;189:215–233. doi: 10.1002/cne.901890202. [DOI] [PubMed] [Google Scholar]
- 63.Vaney DI. Territorial organization of direction-selective ganglion cells in rabbit retina. J Neurosci. 1994;14:6301–6316. doi: 10.1523/JNEUROSCI.14-11-06301.1994. [DOI] [PMC free article] [PubMed] [Google Scholar]
- 64.Vaney DI, Levick WR, Thibos LN. Rabbit retinal ganglion cells. Exp Brain Res. 1981;44:27–33. doi: 10.1007/BF00238746. [DOI] [PubMed] [Google Scholar]
- 65.Wässle H, Boycott BB. Functional architecture of the mammalian retina. Physiol Rev. 1991;71:447–480. doi: 10.1152/physrev.1991.71.2.447. [DOI] [PubMed] [Google Scholar]
- 66.Wässle H, Riemann HJ. The mosaic of nerve cells in the mammalian retina. Proc R Soc Lond B Biol Sci. 1978;200:441–461. doi: 10.1098/rspb.1978.0026. [DOI] [PubMed] [Google Scholar]
- 67.Wässle H, Peichl L, Boycott BB. Dendritic territories of cat retinal ganglion cells. Nature. 1981;292:344–345. doi: 10.1038/292344a0. [DOI] [PubMed] [Google Scholar]
- 68.Wässle H, Peichl L, Boycott BB. Mosaics and territories of cat retinal ganglion cells. Prog Brain Res. 1983;58:183–190. doi: 10.1016/S0079-6123(08)60019-9. [DOI] [PubMed] [Google Scholar]
- 69.Wässle H, Voigt T, Patel B. Morphological and immunocytochemical identification of indoleamine-accumulating neurons in the cat retina. J Neurosci. 1987;7:1574–1585. doi: 10.1523/JNEUROSCI.07-05-01574.1987. [DOI] [PMC free article] [PubMed] [Google Scholar]
- 70.Watanabe M, Rodieck RW. Parasol and midget ganglion cells of the primate retina. J Comp Neurol. 1989;289:434–454. doi: 10.1002/cne.902890308. [DOI] [PubMed] [Google Scholar]
- 71.Wong WT, Sanes JR, Wong ROL. Developmentally regulated spontaneous activity in the embryonic chick retina. J Neurosci. 1998;18:8839–8852. doi: 10.1523/JNEUROSCI.18-21-08839.1998. [DOI] [PMC free article] [PubMed] [Google Scholar]
- 72.Yang G, Masland RH. Direct visualization of the dendritic and receptive fields of directionally selective retinal ganglion cells. Science. 1992;258:1949–1952. doi: 10.1126/science.1470920. [DOI] [PubMed] [Google Scholar]
- 73.Yang G, Masland RH. Receptive fields and dendritic structure of directionally selective retinal ganglion cells. J Neurosci. 1994;14:5267–5280. doi: 10.1523/JNEUROSCI.14-09-05267.1994. [DOI] [PMC free article] [PubMed] [Google Scholar]