

Abstract
Spike and local field potential activity were recorded simultaneously from multiple sites in primary visual cortex of strabismic cats, while monocular stimulation alternated with dichoptic stimulation, inducing interocular rivalry. During interocular rivalry, there is competition between the two nonfusible stimuli presented to the two eyes, and only one stimulus is selected at any time. We biased this competition in three different ways: (1) we exploited the condition that in strabismic cats there is often one dominant eye that is selected for most of the time. (2) We presented the two stimuli with a temporal offset, which biases competition in favor of the newly appearing stimulus. (3) We presented the two stimuli with highly different contrasts, which biases competition in favor of the stimulus with higher contrast. Whenever competition was biased in favor of the stimulus activating the recorded neurons, gamma-frequency synchronization of the respective responses was enhanced, and vice versa. Firing rates showed some differences between stimulation conditions. However, when present, these changes were inversely related to a competitive advantage of the respective stimulus. We hypothesize that enhanced gamma-frequency synchronization in primary visual cortex is a correlate of stimulus selection. Synchronization is likely to be translated into firing rate changes at later processing stages.
Keywords: synchronization, oscillation, gamma, strabismus, competition, rivalry, selection
When two or more stimuli are simultaneously presented in the visual field, they often compete for the control of visual awareness, and only one is selected at any time (Levelt, 1965; Wolfe, 1986; Blake, 1989; Desimone and Duncan, 1995). Interocular rivalry is a particularly clear case of stimulus competition and its resolution through stimulus selection. During interocular rivalry, two highly dissimilar stimuli are presented to the two eyes. In visual cortex, where signals from the eyes are combined, the representations of these stimuli cannot be integrated. Instead they compete with each other, and in subjects with normal visual function, selection alternates between them (Blake, 1989).
When searching for neuronal correlates of stimulus selection during rivalry one needs to analyze responses that are unambiguously associated with stimuli presented to one of the eyes (Logothetis and Schall, 1989; Leopold and Logothetis, 1996; Brown and Norcia, 1997;Fries et al., 1997; Sheinberg and Logothetis, 1997; Polonsky et al., 2000; Tong and Engel, 2001). One strategy is to record neurons selective for particular features (Logothetis and Schall, 1989; Leopold and Logothetis, 1996; Sheinberg and Logothetis, 1997). An alternative strategy is to record from strabismic animals. This offers several advantages: (1) Most cells in early visual cortex are monocular (Hubel and Wiesel, 1965), permitting unambiguous association with the stimulus of the respective eye. (2) Strabismic animals always experience interocular rivalry and not figural rivalry (Holopigian et al., 1988). (3) In strabismic subjects, one eye often develops perceptual dominance (Enoksson, 1968; von Noorden, 1990). The dominant eye stimulus benefits from a permanent competitive advantage and suppresses the nondominant eye stimulus. This can be exploited in the present context. Eye dominance can be determined once and then used to predict the outcome of stimulus competition when stimulus selection is not directly assessed (Fries et al., 1997, 2001c).
For these reasons, we examined neuronal correlates of stimulus selection in cats that had been made strabismic at 3 weeks of age. We presented the awake cats with monocular and dichoptic stimulation conditions, assessed stimulus selection by measuring eye movements, manipulated stimulus competition by varying stimulus contrast or timing (Levelt, 1965; Wolfe, 1984; Logothetis and Schall, 1990; Sheinberg and Logothetis, 1997), and recorded multiunit and field potential responses simultaneously from up to 34 cortical sites. In particular, we set out to test the hypothesis that neuronal synchronization correlates with stimulus selection (Eckhorn et al., 1988; Gray et al., 1989; Crick and Koch, 1990; Engel et al., 1997; Fries et al., 1997, 2001a,b; Lumer, 1998; Tononi et al., 1998; Srinivasan et al., 1999). Synchronization can increase the impact of neuronal firing on postsynaptic neurons (Alonso et al., 1996; Azouz and Gray, 2000) and thus could serve as a mechanism of stimulus selection. We had earlier demonstrated that synchronization in primary and secondary visual cortex correlates with stimulus selection (Fries et al., 1997). In the present study, we extend these findings by reporting data from experiments in which stimulus selection was biased by a variety of different procedures. In particular, we combined paradigms for stimulus selection that use strabismic eye dominance with new paradigms that are independent of strabismic eye dominance.
MATERIALS AND METHODS
Induction of strabismus. All experimental procedures were in accordance with the German Law for the Protection of Experimental Animals and conformed with National Institutes of Health and Society for Neuroscience regulations. In 14 cats, we induced convergent and in four cats divergent strabismus at the age of 3 weeks. Convergent (esotropic) strabismus was induced by transecting the tendon of the lateral rectus muscle of the right eye, whereas divergent (exotropic) strabismus was produced by transecting the tendon of the medial rectus muscle of the left eye. The surgery was performed under combined ketamine (10 mg/kg, i.m.) and xylazine (2 mg/kg, i.m.) anesthesia.
Measurement of visual acuity. Convergent strabismus frequently leads to amblyopia, an impairment of vision caused by abnormal development of cortical functions (Levi and Klein, 1985; von Noorden, 1990). Because amblyopia is associated with the suppression of signals conveyed by the amblyopic eye, we tested the esotropic cats for amblyopia by measuring monocular visual acuity at the age of 4–5 months, when visual acuity has reached stable adult levels (Freeman and Marg, 1975; Mitchell et al., 1976). The animals were mildly food deprived (<10% weight loss) and trained to discriminate between square wave gratings of varying spatial frequency and equiluminant gray (Teller acuity cards; contrast 82–84%; luminance, 25 cd/m2) on a modified jumping stand (Mitchell et al., 1976; Roelfsema et al., 1994; Fries et al., 1997). Jumps to the grating were rewarded. The cats were tested through the normal and the squinting eye on alternate days, the respective other eye being occluded by an opaque contact lens during testing. Each eye was tested on at least three different days, and a test session was continued until the cat stopped jumping spontaneously. The spatial frequencies of the cards were continuously adjusted to the performance of the animal, ranged from 0.21 to 14.2 cycles/° and were separated by 0.5 octave steps. After an incorrect response, the spatial frequency was reduced by one step. After a correct response it was increased by one step with a probability of 33%. For each eye, a minimum of 180 jumps were obtained. The resulting psychometric functions were fitted with a logistic functionP(x) = 0.5 + 0.5(1 + (x/a)b)−1, where P denotes performance (50% is chance level),x the spatial frequency, a the spatial frequency at which the animal performed at the 75% level (this was taken as the discrimination threshold), and b the slope. For the discrimination thresholds of the two eyes, 95% confidence intervals were calculated using a Monte Carlo simulation (Press et al., 1992). Animals were considered to be amblyopic if the discrimination thresholds of the two eyes differed by at least one octave and if the 95% confidence intervals for the respective discrimination thresholds were nonoverlapping. In 13 of the 14 esotropic cats, monocular visual acuity for the two eyes could be determined. Four of the 13 successfully tested cats (31%) had developed amblyopia, as determined by a significant reduction in the visual acuity of one eye. In the remaining nine animals, grating acuities did not differ significantly for the two eyes. For this study, we selected a total of eight cats: three of the esotropic cats that were identified by testing as nonamblyopic, as well as one esotropic cat that had refused to perform the jumping stand test and four exotropic cats. The latter were not tested for visual acuity because exotropic cats usually do not develop amblyopia (Ikeda and Tremain, 1979; Jacobson and Ikeda, 1979; Mower and Duffy, 1983; Mitchell et al., 1984; von Noorden, 1990).
Behavioral assessment of rivalry. At the age of 3–4 years, a head fixation bolt was attached to the skull with titanium screws and dental acrylic under ketamine–xylazine anesthesia. For the recording of eye movements, three of the cats had Ag–AgCl electrodes subcutaneously implanted lateral to each orbit and above and below the left eye. In the remaining five cats, eye movements were recorded through Ag–AgCl electrodes that were inserted subcutaneously before and removed after the recording session. To determine which eye was selected during rivalrous stimulation conditions, we measured the optokinetic nystagmus (OKN), exploiting the fact that OKN is elicited by the selected stimulus (Fox et al., 1975). For visual stimulation, two moving square wave gratings (0.1 cycles/°; movement, 8°/sec in temporonasal direction) covering 50 × 60° around the center of the visual field were presented separately to the two eyes on 21 inch computer screens at a frame rate of 100 Hz and a resolution of 1024 × 768 pixels. Monocular presentation of the two gratings was assured by placing appropriately shaped mirrors and occluders in front of each eye. Monocular and dichoptic stimuli with different contrast ratios (Fig. 1) were pseudorandomly interleaved and presented for 60 sec per trial. Between stimulus presentations, the animals were regularly aroused with noise. Eye dominance ratios were determined from the relative time OKN was controlled by the right or the left eye according to the formula for the relative selection time: RSTa =Ta/(Ta+ Tb +TU), withTa being the time for whichA was selected, Tb the time for which B was selected, andTU the time characterized either by unsystematic slow eye movements or an absence of eye movement. Thus, (Ta +Tb +TU) is the total time of stimulation minus the time during which saccades, saccade-like eye movements, or artifacts were observed.
Fig. 1.

Optokinetic nystagmus under dichoptic stimulation conditions. A, Cats were placed on a recording table, and their heads were fixed by means of an implanted bolt (see Materials and Methods). In front of the head, two mirrors were mounted such that each eye was viewing a separate monitor. B, Recordings of horizontal OKN evoked by dichoptic presentation of gratings moving in opposite directions for four different contrast conditions. Phases devoid of saccades (exceeding 500 msec duration) are underlain withgray. Those epochs classified as smooth phases of OKN are marked with black bars, the position of which indicates which eye controls the OKN (top, left eye;bottom, right eye). When only one grating was presented to either the left (top trace) or the right eye (bottom trace), OKN was unidirectional, smooth phases of OKN reflecting the movement direction of the grating. If both eyes were stimulated with gratings of equal contrast (l = 0.5; r = 0.5), OKN was entirely dominated by the left eye. OKN was controlled by the two eyes in alternation only when contrast ratios are very asymmetric (l = 0.1;r = 0.9), indicating a pronounced dominance of the left eye.
Cortical recordings. In three of the cats, 28–34 Teflon-coated platinum–iridium wires (25 μm diameter) were chronically implanted in areas 17 and 18, whereas in the remaining cats, 14–20 of these electrodes were implanted in area 17 and another 15–19 electrodes in area 21a. Here, only data from areas 17 and 18 are reported. All data from an earlier report (Fries et al., 1997) were integrated in the current study. For surgical interventions in the adult cat, anesthesia was induced with ketamine–xylazine (intramuscularly) and maintained with N2O–O2 (70:30) supplemented by 1% halothane. Daily recording sessions in the awake cat started 1 week after electrode implantation and continued for 1–2 months. For the analysis of multiunit activity (MUA), the signal from the intracortical wire electrodes was amplified, bandpass filtered in the range of 1–3 kHz (3 dB per octave), and fed into a Schmitt trigger with a threshold that exceeded the noise level by at least a factor of two. For the analysis of local field potentials (LFP), the signal from the recording electrodes was bandpass filtered between 1 and 100 Hz. Both the output pulses of the Schmitt triggers as well as the LFP signals were digitized at a temporal resolution of 1 msec.
Visual stimulation. Responses were elicited by moving gratings with the same parameters as those used for OKN measurements, except that now their orientation was changed in steps of 45° to obtain joint responses from as many pairs of recording sites as possible, and direction of motion was reversed every 1.5 sec to prevent eye movements (see below). Individual trials lasted for 9 sec (stimulus onset after 3 sec), and a particular stimulation condition was repeated at least 40 times and interleaved in a pseudorandom sequence with other conditions. The stimuli were presented for only 6 sec to prevent switches in perceptual selection during the correlation measurements. The previous OKN measurements had revealed that the dominant eye was consistently selected at the beginning of stimulation, the first switches in perceptual selection occurring only after tens of seconds. The same holds for human subjects in which, even with small asymmetries in eye dominance, it is also the dominant eye that initiates nystagmus after stimulus onset (Enoksson, 1968).
The stimuli were presented either monocularly or binocularly. Most of the neurons in primary visual cortex of strabismic cats are monocular (Hubel and Wiesel, 1965), and we call the stimulus presented to the eye that actually activates the cells the “activating” stimulus (and the respective eye the “activating” eye), whereas the stimulus presented to the other eye is referred to as the “nonactivating” stimulus (and the respective eye the “nonactivating” eye). During the correlation measurements, four different stimulus conditions were used, which are illustrated in Figure 2. (1) Monocular stimulation: after 3 sec of spontaneous neuronal activity, the activating stimulus was presented for a total of 6 sec (Fig. 2A). (2) Dichoptic stimulation: the activating and the nonactivating stimulus were presented simultaneously (Fig.2B). (3) Dichoptic stimulation with temporal offset: the activating stimulus being presented 3 sec after the onset of the nonactivating stimulus (Fig. 2C). (4) Dichoptic stimulation with temporal offset, but now the nonactivating stimulus being presented 3 sec after the onset of the activating stimulus (Fig.2D).
Fig. 2.

Visual stimulation conditions. Eachrow of rectangles illustrates stimulation of one eye as a function of time shown on the x-axis.Black rectangles stand for 1.5 sec periods of presentation of a blank screen, whereas the striped rectangles illustrate 1.5 sec periods of presentation of a moving grating with the movement direction indicated by thearrow. A, Monocular stimulation of the activating eye. B, Dichoptic concurrent stimulation.C, Dichoptic stimulation with a temporal offset between the presentation of the activating and the nonactivating stimulus.D, Dichoptic stimulation with a temporal offset but reverse order of the activating and the nonactivating stimulus.B-A, To demonstrate the effect of eye dominance-driven stimulus selection, neuronal activities from stimulation conditionsA and B are compared for the time periods indicated by the black outline. C-B, To reveal the effect of the selection of a newly appearing activating stimulus, conditions C and B are compared. D-B, Comparison performed to isolate the effect of the suppression by a newly appearing nonactivating stimulus. To this end, conditions D and B are compared.
The effects of stimulus selection during binocular rivalry were assessed by comparing the responses of cells obtained under these stimulation conditions in three different ways: (1) To demonstrate the effect of stimulus selection caused by eye dominance, neuronal activity from stimulation conditions A and B (Fig. 2) were compared for the entire duration of the stimulation period (Fig.2B-A, black outline). To demonstrate the effect of stimulus selection caused by the delayed or advanced presentation of the activating stimulus, stimulus conditions B, C, and D were compared, whereby only a 1.5 sec period was selected from each condition as shown by the black outlines in Figure 2, C-B and D-B. The rationale is that the stimulus presented with a delay, the novel stimulus, is always selected, whereas the previously presented stimulus is suppressed. (2) The effects corresponding to the selection of the activating stimulus were assessed by comparing condition B, in which both activating and nonactivating stimuli were presented simultaneously, with condition C where the activating stimulus was delayed. The respective epoch is highlighted by the black outline in Figure2C-B. (3) To determine the effect of suppression of the activating stimulus by the newly appearing nonactivating stimulus, condition B was compared with condition D, in which the nonactivating stimulus was delayed. The respective epoch is highlighted by the black outline in Figure 2D-B. The effects associated with selection and suppression of the activating stimulus, caused by temporal offset, were similar irrespective of whether the activating stimulus was presented to the dominant or the nondominant eye. We therefore pooled the results from sessions in which the activating stimulus was presented to the dominant and the nondominant eye, respectively.
Eye movement controls. Electro-oculogram (EOG) recordings were routinely performed during the electrophysiological measurements to control for the absence of eye movements. Because we had no reliable control over the cat's fixation behavior, we could not calibrate the EOG recordings in visual angle. However, EOG recording conditions were the same during behavioral testing and electrophysiological measurements. Because the EOG signals were strongly modulated during behavioral testing, but flat during recording sessions, we are confident that eye movements were absent during data acquisition (Fig.3). There are several reasons why the stimulus sequence applied during recording of neuronal activity did not evoke eye movements. First, in normal cats and under optimal conditions for the induction of OKN, eye movements are readily abolished by reversing the movement direction of the inducing stimulus at intervals similar to those used in this study (Godaux et al., 1983). Second, the gain of OKN is reduced in strabismic animals (Cynader and Harris, 1980). Third, the stimuli used during recordings of neuronal signals were most often suboptimal for OKN induction because their drift direction was only occasionally in the temporonasal direction (Distler and Hoffmann, 1992). To rule out any potentially confounding influence of small residual eye movements, we made two tests: first, we restricted the analysis to recording epochs that were completely devoid of any residual eye movements. This reduced the number of entries in the cross-correlograms and consequently the number of significant datasets but otherwise the results remained the same. For an example, see Fries et al. (1997), their Figure 2. Second, we compared the frequency of occurrence, the direction, and the amplitude of residual eye movements for monocular and dichoptic stimulation conditions and found no significant difference. Because our interpretations rest on a comparison between responses obtained under monocular and dichoptic stimulation conditions, this justifies inclusion of all data.
Fig. 3.

Absence of eye movements during recording of neuronal activity for correlation measurements. The topof the figure shows three pairs of horizontal (H) and vertical (V) eye movement recordings. Thetopmost pair was recorded under monocular stimulation of the dominant eye, the middle pair under dichoptic stimulation, and the bottom-most pair under monocular stimulation of the nondominant eye. Stimulus onset is at 3 sec after the start of the recording, and movement direction of the stimuli reverses every 1.5 sec, as indicated by the arrows andbroken lines. Evidently, the traces do not reveal OKN or any other pursuit movements. The short-latency deflections after stimulus onset are with all likelihood caused by light-induced potential changes in the retina. The bottom of the figure displays, at the same scale, recordings of OKN that were obtained from the same animal in the same recording session during prolonged stimulation without movement direction reversals (compare with Fig. 1). It should be noted that the two OKN recordings were not made simultaneously. For the induction of horizontal OKN (top trace), the dominant (left) eye was stimulated monocularly in temporonasal direction, and for the vertical OKN (bottom trace), the dominant eye was stimulated monocularly in the upward direction.
Quantification of ocular dominance. Visual responses were considered significant if they exceeded the ongoing activity by a factor of 1.5. Ocular dominance was determined for each recording site from the spike responses to monocular and binocular stimulation. Recording sites were classified into five categories according to the ratio of firing rates evoked by stimulation of the dominant or nondominant eye, respectively. Neurons without pronounced selectivity for one or the other eye were classified in category 3. If the firing rate induced by stimulation of the dominant eye was at least twice the firing rate induced by stimulation of the nondominant eye, the recording site was classified into category 4. If the dominant eye rate was >10 times the nondominant eye rate, the neuron was classified into category 5. Neurons responding more strongly to the nondominant eye were classified according to the same criteria in categories 1 and 2. Only recording sites with a clear bias to one of the two eyes were used for further analysis, excluding sites classified in OD category 3. To maximize coactivation of simultaneously recorded subsets of recording sites, we first compiled ocular dominance and orientation tuning curves for all recording sites of a given animal. Because we had less recording channels (n = 8) than electrodes (up to 34), we subsequently selected for a given recording a subset of recording sites which had identical ocular dominance and similar orientation preference. All correlation and firing rate analyses and statistics were performed on those recordings. In total, 79 of 179 recording sites registered neuronal activity that met our criteria for visual responsiveness and ocular dominance selectivity. We analyzed firing rates for all 79 sites, and spike–spike correlations and spike–field coherences for all possible combinations among these sites. The data were all included in the documented statistics, without any further selection.
Correlation analysis of unit signals. For each session in which data for correlation analyses were acquired, we selected a subset of recording sites that had shown similar ocular dominance and orientation preference in separate mapping sessions. The stimulus used to activate the respective recording sites (the “activating stimulus”) was optimized to evoke maximal responses from the selected subset of recording sites. For all responses, auto- and cross-correlograms were computed and quantified according to a standard procedure described previously (König, 1994), which involved the fitting of a damped cosine wave (Gabor function) to the correlogram. The function had to account for at least 15% of the variance in the data, and the z-scores of significant peaks had to be >2. The strength of synchronization and the regularity of oscillations were quantified by calculating the relative modulation amplitude (RMA) for the central and the first satellite peak, respectively. RMA (expressed as a percentage) was defined as the amplitude of the respective peak (measured from the offset of the modulation) divided by the offset (and multiplied by a factor of 100). Pairs of recording sites were included in the cross-correlation analysis of MUA responses, if both responded jointly to a grating of a particular orientation. Because the measured orientation preferences were distributed rather evenly in our sample of recording sites, the pooled correlation data comprise responses to all possible orientations and drift directions. To avoid contamination of the correlograms by transient responses to stimulus onset, we selected for data analysis either the response epoch between the first and second, or the epoch between the second and third reversal of stimulus motion, depending on where the product of the firing rates was larger (compare Fig. 2). Furthermore, we discarded the first 100 msec after stimulus movement reversals to avoid response transients. For the analysis of the effects of stimulus selection caused by temporal stimulus offset, we only used the first 1.5 sec period after the onset of the second stimulus to be sure to analyze data from an epoch during which the newly appearing stimulus was selected and the already present one suppressed.
Analysis of LFP signals. LFP signals were analyzed by calculation of spike-triggered averages (STAs). To this end, LFPs were averaged within a window of ±128 msec centered on each trigger spike (Fries et al., 1997, 2001b). Response epochs were selected for analysis as described above. To obtain a measure of synchronization between spikes and LFP that is independent of fluctuations in LFP amplitude, we calculated the spike–field coherence (SFC). For each of the LFP segments used for the computation of STAs, we calculated the respective power spectrum and, by averaging these spectra, obtained the spike-triggered power (STP). The SFC was then computed as the ratio of the power spectrum of the STA over the STP, multiplied by 100. The SFC is normalized for spike rate and spectral power of the LFP and is therefore immune to changes in these parameters. The SFC ranges from 0, complete lack of synchronization in the respective frequency bin or band, to 100, perfect phase synchronization. The computation of the SFC is illustrated in Figure 4. To further analyze the dynamics of oscillatory synchronization, we also used the sliding window technique. A window of 256 msec length was shifted over the data in steps of 16 msec. At each position of the window, we calculated STAs or STPs, respectively. STA or STP calculated for corresponding windows from different stimulus repetitions were averaged and used to determine the sliding-window SFC. The sliding window analysis was done for the entire trial, including a 3 sec period before stimulus onset and times around stimulus onset and movement reversals.
Fig. 4.

Computation of spike-field coherence.A shows two oscillatory processes (a,b) that are superimposed (c) to simulate LFP fluctuations. The high-amplitude componenta oscillates at 10 Hz, and the low-amplitude componentb oscillates at 50 Hz. Vertical lines in the three plots a–c indicate the occurrence of action potentials that are time-locked to the negativities of the 50 Hz oscillations, but not the 10 Hz component, and skip cycles at random.Ba and Bb show two examples of LFP segments extending ±100 msec times around two spikes. The power spectra of these LFP segments are shown in c andd, respectively. The 10 Hz component with the amplitude of 1 μV has a power of 0.5*(1 μV)2 = 0.5 μV2, and the 50 Hz component with the amplitude of 0.2 μV has a power of 0.02 μV2, respectively.Ca shows the STA of the LFP segments (at ±100 msec) for all 19 spikes. Because the spikes are perfectly phase-locked to the 50 Hz component, this component is not attenuated by averaging, whereas the 10 Hz component is strongly reduced. This differential reduction in power can be seen in the power spectrum of the STA (Cb). The power at 50 Hz is 0.02 μV2, just as it had been in the original signal, but the power at 10 Hz is only 0.008 μV2, which is only 1.6% of the original 0.5 μV2. Cc shows the average of the power spectra of all 19 LFP segments used to calculate the STA. Dividing Cb by Cc and multiplying by 100 yields the SFC that is shown in Cd. Note that the SFC is not a power measure but a measure without dimension that assumes the value 100 for perfect phase synchronization (as in the present case for 50 Hz) and the value zero for no phase synchronization. The small but remaining coherence value at 10 Hz is caused by the low number of spikes, resulting in insufficient averaging. Note that the SFC reflects the selective synchronization of the spikes to the 50 Hz component and compensates for the higher amplitude of the 10 Hz component (Cc) by normalization.
RESULTS
Neuronal correlates of eye dominance-dependent stimulus selection
OKN measurements with rivalrous stimuli revealed that all eight cats exhibited significant eye dominance asymmetries (Fries et al., 2001c). The psychometric functions showing relative selection time of the two eyes as a function of the stimulus contrast ratio is shown in Figure 5 for one cat with esotropic strabismus (same cat as in Fig. 1). When both eyes were presented with stimuli of equal contrast, this cat almost permanently selected the stimulus shown to the left eye.
Fig. 5.

The influence of luminance contrast on relative selection time. Plots of the relative selection times of the two eyes as a function of the contrast ratio between the two stimuli.Squares refer to data from the left eye, andcircles refer to data from the right eye, respectively. Error bars indicate SEM. The curves correspond to significantly fitted sigmoidal functions. In this cat, the left eye was operated and deviating but still, the left eye was the dominant eye.
To investigate the effect of this eye dominance-dependent stimulus selection on neuronal activity, we recorded activity of cells driven by the dominant eye and compared responses to monocular stimulation of the dominant eye with responses to dichoptic stimulation (see Materials and Methods) (Fig. 2A,B, B-A). In general, response amplitudes differed only little between monocular and binocular stimulation conditions. The responses of a typical dominant eye MUA to monocular and dichoptic stimulation are shown in Figure6, A and B, and their difference in Figure 6B-A. At this recording site, dichoptic stimulation induced slightly higher activity after stimulus onset, whereas the reverse was the case toward the end of the response.
Fig. 6.
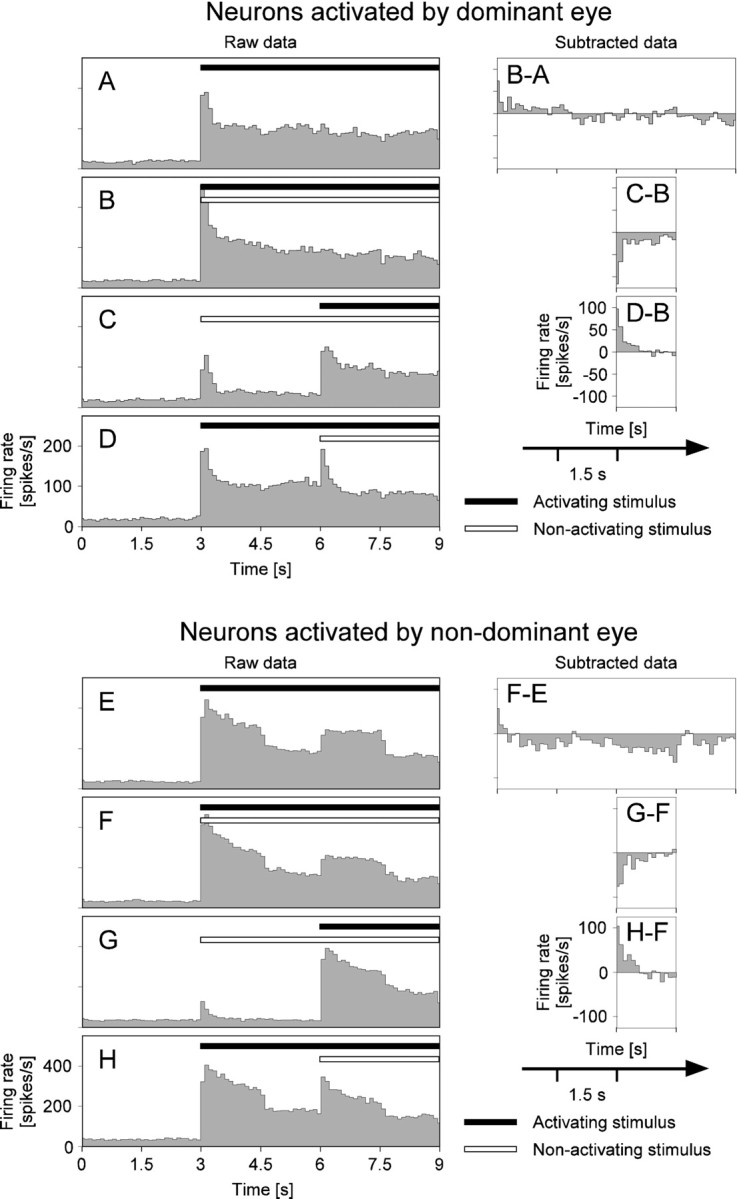
Examples of firing rates under monocular and binocular stimulation conditions. A–D show peristimulus time histograms (PSTHs) for neurons driven by the dominant eye, i.e., changes of the firing rate as a function of time after trial start at bin widths of 100 msec. These are the same data as those used in Figures 7A–D, 8, and 10. Stimulus onset is at 3 sec after trial start. The four PSTHs correspond to the four stimulus paradigms used throughout the study (compare with Fig. 2).A, PSTH for monocular stimulation of the left eye that drives the recorded MUA. B, PSTH for dichoptic stimulation. C, PSTH for delayed dichoptic stimulus presentation, stimulation of the nonactivating eye starting at 3 sec, and stimulation of the activating eye starting at 6 sec, respectively.D, PSTH for delayed dichoptic stimulation in reverse order as compared with C. The graphs on theright of the PSTHs show the firing rate changes that can be attributed to the effects of eye dominance (B-A), activating stimulus appearing anew (C-B), and the nonactivating stimulus appearing anew (D-B), respectively. To this end, the PSTHs have been pairwise-subtracted, as indicated in Figure 2. Note that the subtraction is performed only for parts of the respective PSTHs (compare with Fig.2B) and that a smaller scale is used to show the firing rate differences. E–H show the same analysis asA–D but for neurons driven by the nondominant eye. These are the same data as those used in Figure7E–H.
We typically observed oscillatory synchronization between the MUA and the simultaneously recorded LFP (Fig.7A-D). When the visual stimulation changed from monocular to dichoptic, SFC (see Materials and Methods) among recording sites activated by the dominant eye showed a significant increase. Typically, high SFC values were only obtained in the frequency band between 40 and 70 Hz, i.e., in the so-called gamma band. The increase in SFC cannot be a consequence of changes in firing rates because these changed only during the first, but not during the third stimulus period (Fig. 6B-A), whereas the SFC was enhanced for both periods. In other cases, enhanced synchronization was accompanied by small decreases in firing rate, which makes it even less likely that changes in synchronization could be caused by changes in firing rates.
Fig. 7.
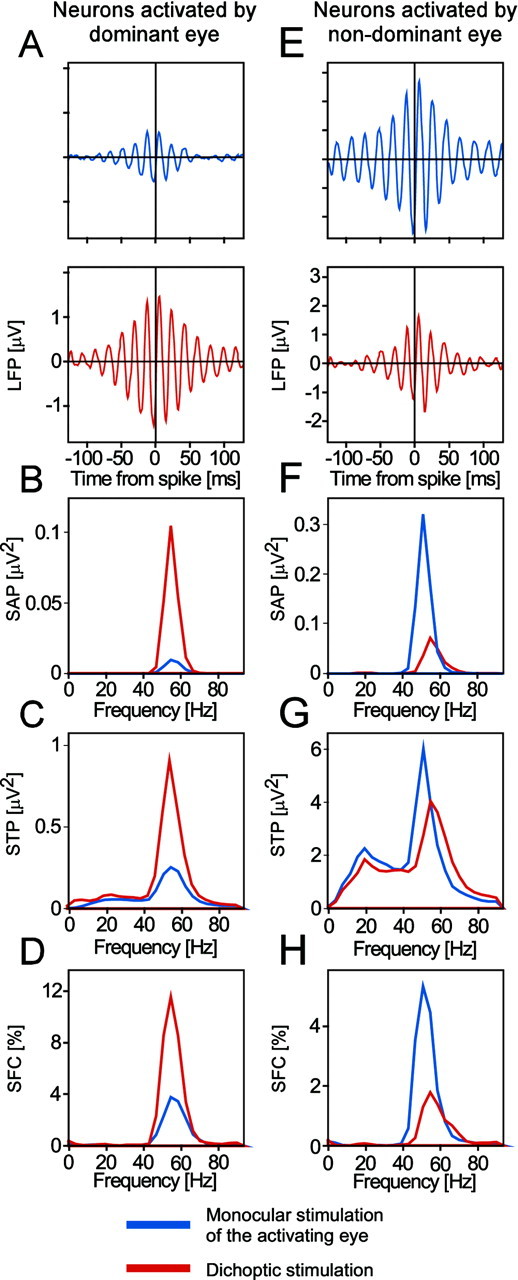
A–D show an example of enhanced oscillatory synchronization caused by eye dominance-dependent stimulus selection. The data in A–D are from neurons driven by the dominant eye. These are the same data as those used in Figures6A–D, 8, and 10. A shows STAs,B the power spectra of these STAs, C the STPs (i.e., the average power spectra of all the LFP segments included in the computation of the respective STA), and D the SFCs (i.e., the power spectra of the STAs normalized by the respective STPs and multiplied by 100). In A–D, the blue graphs show data obtained with monocular stimulation of the dominant eye, and the red graphs show data recorded with dichoptic stimulation. Data are from the third stimulus period, i.e., between 3 and 4.5 sec after stimulus onset (compare with Fig.2A). As shown by all measures, there is a clear increase in oscillatory synchronization with dichoptic stimulation. The fact that this increase is also observed in the normalized SFCs (D) indicates that the increase in power in the STAs (B) cannot fully be explained by changes in raw LFP power (C). Thus, there is a true increase in synchronization between spikes and LFP when stimulation changes from monocular to dichoptic conditions. As the data show, the time-locking of spikes with the field occurs preferentially at frequencies between 40 and 70 Hz. E–H show an example of reduced oscillatory synchronization caused by eye dominance-dependent stimulus suppression. The data in E–H are from neurons driven by the nondominant eye. These are the same data as those used in Figure6E–H.E–H show the same analysis as A–D, with the exception that, inE–H, the blue graphs show data obtained with monocular stimulation of the nondominant eye, and the red graphs show data recorded with dichoptic stimulation.
To study the dynamics of synchronization changes associated with stimulus selection, we performed the same analysis for short windows shifted along the entire epoch of recorded data (Fig.8A). This sliding window analysis showed that the SFC enhancement in the gamma-frequency range starts ∼130 msec after stimulus onset and lasts throughout the whole stimulation period with exception of the phases where the stimuli reverse their direction of movement (at 1.5, 3, and 4.5 sec, respectively).
Fig. 8.

The dynamics of synchronization during stimulus selection evaluated with the sliding window technique. The data are from neurons driven by the perceptually dominant eye. These are the same data as those used in Figures 6A–D,7A–D, and 10. All panels show the differences between stimulation conditions as illustrated in Figure 2. The left column shows differences in sliding window power spectra of STAs, the middle column differences in sliding window STPs, and the right column differences in sliding window SFCs. The three rowsA–C display the results of pairwise subtraction according to the procedure illustrated in Figure 2. A, Effect of eye dominance (difference of dichoptic minus monocular stimulation; compare with Fig.2B-A). B, Effect of the selection of a new activating stimulus (difference of the stimulation conditions shown in Fig. 2C-B, i.e., dichoptic stimulus presentation with delay of the activating eye minus dichoptic presentation with simultaneous onset). C, Effect of the suppression of the activating stimulus by a new nonactivating stimulus (difference of the stimulation conditions shown in Fig.2D-B, i.e., dichoptic stimulus presentation with delay of the nonactivating eye minus dichoptic presentation with simultaneous onset). Note that all differences occur in the gamma-frequency band.
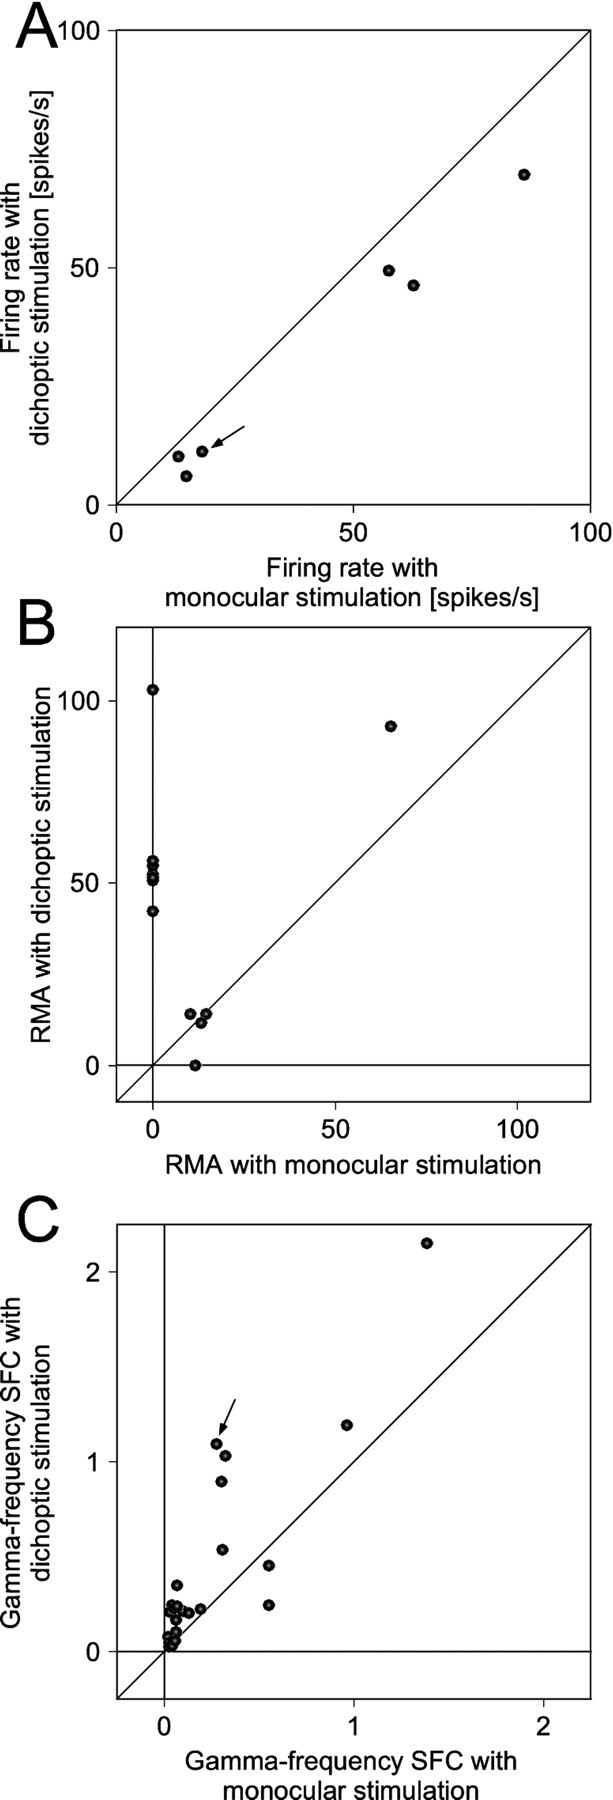
The firing rate and correlation data obtained from all recording sites connected to the dominant eye (n = 45; 19 in OD category 4 and 26 in OD category 5) are summarized in Figure9A–C. With dichoptic stimulation, firing rates decreased at 34 and increased at 11 sites, resulting in a median firing rate decrease of 8% (p < 0.01; Wilcoxon signed rank test).
Fig. 9.
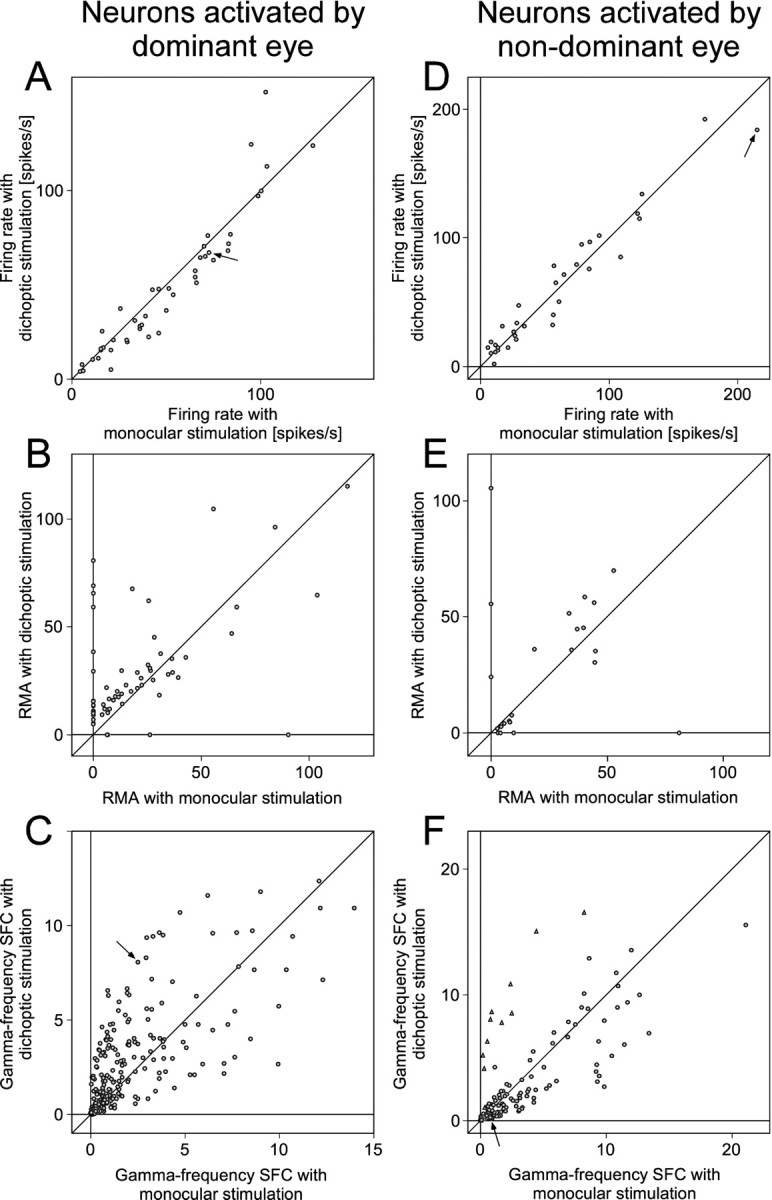
A–C show the statistics of MUA firing rates (A), MUA correlation (B), and gamma-frequency SFC (C) for neurons driven by the dominant eye. In all panels, one dot corresponds to one recording site or a pair of recording sites, and the x value of adot gives the respective parameter under monocular stimulation, whereas the y-axis displays the parameter under dichoptic stimulation. The arrows inA and C correspond to the recordings illustrated as an example in Figures 6, A andB, and 7A–D.D–F show the same analysis as A–C but for neurons driven by the nondominant eye. The triangles in Crepresent identified outliers as described in the main text. Thearrows in D and Fcorrespond to the recordings illustrated as an example in Figures 6,E and F, and 7E–H.
From sites driven by the dominant eye, we obtained a total of 63 pairs for which spike–spike correlations revealed significant synchronization under at least one of the stimulation conditions. With dichoptic stimulation, spike–spike synchronization increased for 48 and decreased for 15 of these pairs. Eighteen pairs showed significant synchronization only under dichoptic stimulation, leading to a median (mean ± SEM) RMA of 13% (26 ± 6%). Four pairs synchronized significantly only under monocular stimulation leading to a median (mean ± SEM) RMA of 16% (32 ± 20%). Forty-one pairs exhibited significant synchronization under both monocular and dichoptic stimulation conditions and for those pairs, dichoptic stimulation enhanced synchronization by 27% (median RMA increase). In the overall sample, synchronization increased significantly (p < 0.001; Wilcoxon signed rank test) during dichoptic stimulation.
All possible pairings of spike and field potential responses from the recording sites activated by the dominant eye resulted in a total of 273 STAs of LFPs. Dichoptic stimulation led to an enhancement of gamma-frequency SFC in 176 cases and a reduction in 92 (no change in 5). The median enhancement in gamma-frequency SFC was 38% (p < 0.0001; Wilcoxon signed rank test). The LFP power spectra showed qualitatively the same effects as the SFCs, indicating that changes in the LFP power were in the same direction as the changes in synchronization between MUA and LFP.
Neuronal correlates of eye dominance-dependent stimulus suppression
Next, we analyzed neuronal activity from neurons activated by the nondominant eye, again comparing monocular with dichoptic stimulation. Whereas the firing rate changed only little (Fig. 6E,F, F-E) between monocular and dichoptic stimulation, SFC in the gamma band was clearly reduced (Fig. 7E–H).
We recorded from 34 sites driven by the nondominant eye (Fig.9D) (15 in OD category 2, 19 in OD category 1). During dichoptic stimulation, firing rates increased at 19 sites and decreased at 15 sites resulting in a median increase in rate of 4% (p = 0.66; Wilcoxon signed rank test).
For 23 pairs of recording sites, spike–spike correlations showed significant synchronization under at least one of the stimulation conditions (Fig. 9E). Twelve pairs showed reduced synchronization during dichoptic stimulation, whereas 11 pairs increased synchronization. Four pairs showed significant synchronization only with monocular stimulation with a median (mean ± SEM) RMA of 7% (24 ± 19%). Three pairs synchronized significantly only during dichoptic stimulation, leading to a median (mean ± SEM) RMA of 56% (62 ± 24%). Overall, there was no significant change in spike–spike synchronization associated with the change from monocular to dichoptic stimulation (p = 0.32; Wilcoxon signed rank test).
From the 34 recordings driven by the nondominant eye, we obtained 151 STAs of LFPs. During dichoptic stimulation, gamma-frequency SFC was reduced in 80 and enhanced in 71 cases, amounting to a median reduction of the SFC in the gamma-frequency range of 4% (p < 0.05; Wilcoxon signed rank test). In the respective scatter plot (Fig. 9F), there was an obvious cluster of outliers (triangles). All these outliers came from STAs that were computed using spikes of two recording sites. When these STAs were excluded, the statistics showed a highly significant median reduction in gamma-frequency SFC of 15% (p < 0.0001; Wilcoxon signed rank test) for dichoptic stimulation.
Neuronal correlates of the selection of a new stimulus
When rivalrous stimuli are presented with temporal offset, the newly appearing stimulus benefits from a competitive advantage and is selected, irrespective of eye dominance (Wolfe, 1984; Sheinberg and Logothetis, 1997). To study the neuronal correlates of the selection of a new stimulus, we compared neuronal activity for two conditions: in the first condition, the activating stimulus of the recorded neurons appeared simultaneously with the competing nonactivating stimulus (Fig.2B). In the second condition, the nonactivating stimulus of the neurons had been on for 3 sec before the activating stimulus appeared (Fig. 2C). Thus, in the latter condition, the activating stimulus had a competitive advantage and should have been selected.
Comparison of these two conditions as illustrated in Figure2C-B revealed that, in most cases, the firing rate was slightly lower when the activating stimulus was the new stimulus. An example for this effect is illustrated in Figure 6C-B. In contrast to the firing rate, SFC in the gamma-band was clearly enhanced for responses evoked by the novel, temporally offset stimulus when compared with responses to simultaneously presented stimuli (Fig.10A–D). As demonstrated by sliding window analysis (Fig. 8B,right column), this enhancing effect starts ∼300 msec after the onset of the activating stimulus.
Fig. 10.
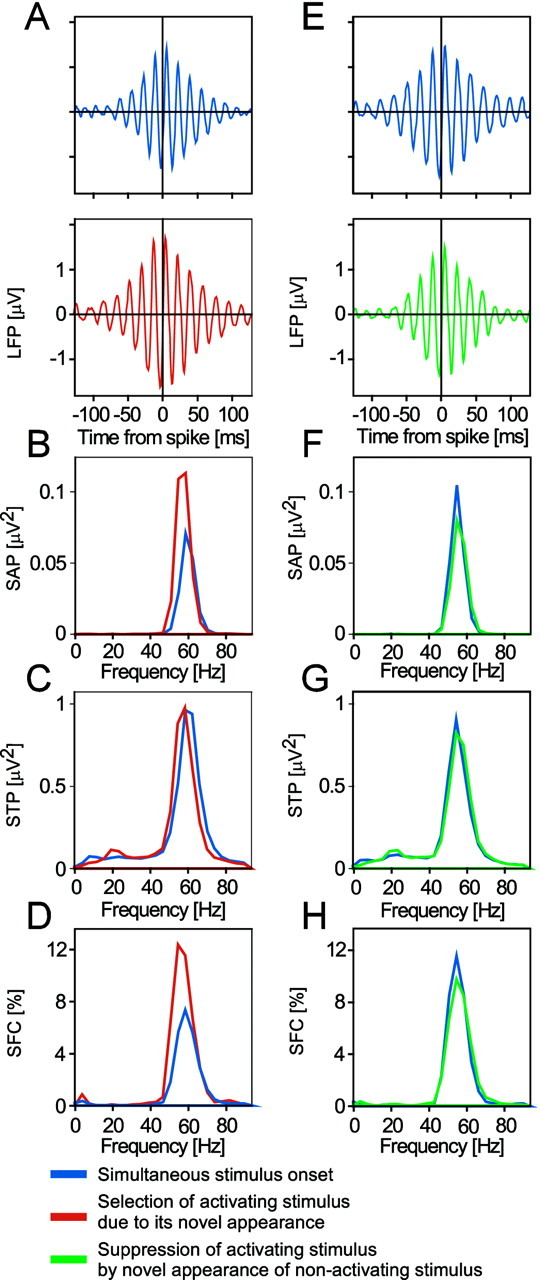
A–D show an example of enhanced oscillatory synchronization caused by the selection of a newly appearing activating stimulus. A shows STAs,B the power spectra of these STAs, C the STPs (i.e., the average power spectra of all the LFP segments included in the computation of the respective STA), and D the SFCs (i.e., the power spectra of the STAs normalized by the respective STPs and multiplied by 100). In A–D, the blue graph was computed from data recorded during the first 1.5 sec after the simultaneous onset of the stimulus activating the recorded neurons and the competing nonactivating stimulus. The respective red graph is from data recorded during the first 1.5 sec after onset of the activating stimulus, whereas the competing nonactivating stimulus in the other eye is already on for 3 sec, thus endowing the activating stimulus with a competitive advantage. As shown by both the power of STA and the SFC, the selection of a newly appearing activating stimulus leads to enhanced oscillatory synchronization. E–H show an example of reduced oscillatory synchronization caused by suppression of the activating stimulus by a newly appearing nonactivating stimulus. InE–H, the data are from between 3 and 4.5 sec after onset of the activating stimulus. Data shown as blue graphs are from the condition in which stimuli were presented simultaneously to both eyes, whereas green graphs refer to the condition in which the competing nonactivating stimulus had just been switched on and led to suppression of the activating stimulus. Data shown in this figure are the same as those used in Figures6A–D, 7A–D, and 8.
The effect of the selection of a newly appearing stimulus on firing rate was evaluated for a total of 57 recording sites (Fig.11A). Forty-four recording sites showed reduced firing rates when the activating stimulus had newly appeared, 12 increased their firing rate, and one did not change. The median firing rate reduction amounted to 7% (p < 0.0001; Wilcoxon signed rank test).
Fig. 11.

A–C show the statistics of MUA firing rates (A), MUA correlation (B), and gamma-frequency SFC (C) for neuronal responses driven by a stimulus selected because of its novel onset. In all panels, xvalues refer to the condition with simultaneous onset of both stimuli, whereas y values represent the condition in which the activating stimulus appears with delay and, thus, has the competitive advantage resulting from novelty. The arrows inA and C correspond to the recordings illustrated as an example in Figures 6, B andC, and 10A–D.D–Fshow the same statistics as A–C for neuronal responses driven by a stimulus suppressed because of the new appearance of the nonactivating stimulus. The y values represent the condition in which the nonactivating stimulus appears with delay and, thus, leads to perceptual suppression of the activating stimulus. Thearrows in D and Fcorrespond to the recordings illustrated as an example in Figures 6,B and D, and 10, E andF.
From these recording sites, 92 pairs gave significant spike–spike correlations under at least one of the compared conditions (Fig. 11B). The new stimulus induced increased synchronization in 41 and decreased synchronization in 51 pairs. In three cases, synchronization was only significant when the activating stimulus of the neurons was new, leading to a median (mean ± SEM) RMA of 36% (41 ± 21%). Eleven pairs showed significant synchronization only when the activating stimulus appeared simultaneously with the nonactivating stimulus, resulting in a median (mean ± SEM) RMA of 17% (36 ± 15%). The remaining 78 pairs that showed significant synchronization under both conditions showed a median RMA increase of 1% (p = 0.95; Wilcoxon signed rank test). Overall, there was no significant influence of stimulus novelty on spike–spike synchronization (p = 0.95; Wilcoxon signed rank test).
Pairing all simultaneously recorded spike and LFP recordings yielded 479 STAs (Fig. 11C). When the activating stimulus was new, gamma-frequency SFC was enhanced in 308, reduced in 163 and unchanged in eight pairs. The median enhancement in gamma-frequency SFC was 22% (p < 0.0001; Wilcoxon signed rank test).
Neuronal correlates of the suppression by a new stimulus
The novel onset of a rivalrous stimulus leads to the selection of this stimulus and at the same time to the suppression of the already present competing stimulus. To investigate this stimulus suppression, we compared two conditions: in both conditions, we analyzed the period between 3 and 4.5 sec after the onset of the activating stimulus. In the first condition, the nonactivating stimulus was presented together with the activating stimulus. In the second condition, the nonactivating stimulus appeared 3 sec after the onset of the activating stimulus. In this case, the nonactivating stimulus is new and therefore selected, and it suppresses the activating stimulus (Fig.2D-B). Suppression of the activating stimulus caused by presentation of a new nonactivating stimulus had similar effects on discharge rates and synchrony of responses as eye dominance-dependent suppression. At the recording site exemplified in Figure6A–D, firing rates increased shortly after the nonactivating rivalrous stimulus appeared (Fig.6D-B). This increase was of short duration and decayed within 200 msec. Gamma-frequency SFC was reduced after the onset of the nonactivating stimulus (Fig.10E–H), and sliding window analysis showed that this reduction in synchrony started at ∼190 msec and lasted until ∼670 msec after onset of the nonactivating stimulus (Fig.8C). This example is somewhat atypical because the reduction in synchrony was followed by increased synchronization that started at 750 msec and lasted until ∼1400 msec. However, the late enhancement was much weaker than the early reduction, such that the net change was still a reduction.
Altogether, the effect on firing rates of the suppression by a new nonactivating stimulus was studied for 57 recording sites (Fig.11D) and caused reduced firing rates at 11, enhanced rates at 45 sites, and left the rate unchanged at one site. The median firing rate increase amounted to 10% (p < 0.0001; Wilcoxon signed rank test).
Eighty-six pairs of recording sites exhibited significant spike–spike correlations under at least one of the two stimulation conditions so that effects of suppression on response synchronization could be studied (Fig. 11E). When a new nonactivating stimulus appeared, spike–spike correlation decreased in 46 and increased in 40 pairs. Seven pairs synchronized significantly only when both stimuli had appeared simultaneously, leading to a median (mean ± SEM) RMA of 24% (24 ± 6%). Five pairs showed significant synchronization only after the appearance of the new nonactivating stimulus, leading to a median (mean ± SEM) RMA of 16% (24 ± 10%). The remaining 74 pairs with significant synchronization under both stimulation conditions showed a median RMA decrease of 4% (p = 0.10; Wilcoxon signed rank test) after the appearance of the new nonactivating stimulus. Overall, the presentation of the new, nonactivating stimulus had no significant effect on spike–spike synchronization (p = 0.1; Wilcoxon Signed rank test).
Spike–field coherence could be computed in 479 cases (Fig.11F). This analysis showed that the appearance of a new nonactivating stimulus led to reduced gamma-frequency SFC in 322, enhanced gamma-frequency synchronization in 144, and no change in 13 pairs. In contrast to the spike–spike correlation, the decrease in synchrony as revealed by gamma-frequency SFC was highly significant (median 18%; p < 0.0001; Wilcoxon signed rank test).
Neuronal correlates of contrast-dependent stimulus selection
In addition to eye dominance and stimulus-onset timing we used stimulus contrast to bias stimulus competition because stimulus contrast is positively related to stimulus selection (see the example illustrated in Figs. 1 and 5) (Logothetis and Schall, 1990; Fries et al., 2001c). It is thus possible to override eye dominance by creating asymmetric contrast conditions and to thereby study stimulus selection effects independently of eye dominance. Unfortunately, we were not able to study the suppression of a low-contrast stimulus in the dominant eye through a high-contrast stimulus in the nondominant eye. The required reduction of contrast of the dominant eye stimulus attenuated cortical responses so strongly that correlation analysis became impossible because of insufficient numbers of correlogram entries. However, it was possible to investigate the selection of a high-contrast stimulus in the nondominant eye that was competing with a low-contrast stimulus in the dominant eye (Fig. 12).
Fig. 12.

An example of enhanced oscillatory synchronization caused by stimulus contrast-dependent selection. All panels show data from neurons activated by the nondominant eye.A shows STAs, B the power spectra of the STAs, C the STPs (i.e., the average power spectra of all the LFP segments included in the computation of the respective STA), and D the SFCs (i.e., the power spectra of the STAs normalized by the respective STPs and multiplied by 100). InA–D, the blue graph shows data obtained with monocular high-contrast stimulation of the nondominant eye, and the red graphs show data recorded with dichoptic stimulation, i.e., with additional low-contrast stimulation of the dominant eye. As shown by both the power of STA and the SFC, contrast-driven stimulus selection leads to enhanced gamma-frequency synchronization.
We recorded from six sites in two cats that were driven by the nondominant eye (Fig.13A). All sites showed reduced firing rates when in addition to their activating stimulus of high contrast (0.9), we presented a low-contrast (0.1) rivaling stimulus to the dominant eye. The median firing rate reduction was 24% (p < 0.05; Wilcoxon signed rank test).
Fig. 13.
Statistics of MUA firing rates (A), MUA correlation (B), and gamma-frequency SFC (C) for neuronal activity driven by a stimulus selected because of its high contrast. The same conventions as in Figure 9, except that responses are from neurons driven by the nondominant eye and, moreover, that the nondominant eye is presented with a high- and the dominant eye with a low-contrast stimulus, respectively. The arrows in Aand C correspond to the recording illustrated in Figure12.
For 12 pairs of these six recording sites, spike–spike correlations were significant for at least one of the two stimulation conditions (Fig. 13B). In all cases, the nondominant eye was presented with the high-contrast stimulus. Additional presentation of the low-contrast nonactivating stimulus to the dominant eye increased synchronization in nine and reduced it in three pairs. One pair showed significant synchronization only with monocular stimulation of the nondominant eye with an RMA of 12%. Seven pairs showed significant synchronization only with dichoptic stimulation (high contrast in the nondominant and low contrast in the dominant eye), leading to a median (mean ± SEM) RMA of 52% (59 ± 8%). The remaining four pairs showed significant synchronization under both monocular and dichoptic stimulation. For those pairs, presentation of the low-contrast, nonactivating stimulus to the dominant eye caused a median RMA increase of 16%. Overall, spike–spike synchronization increased significantly (p = 0.01; Wilcoxon signed rank test) when the low contrast nonactivating stimulus was presented.
Spike-triggered averages of LFPs could be compiled for 24 spike–LFP pairs (Fig. 13C). Presentation of the low contrast nonactivating stimulus enhanced oscillatory synchronization in the gamma frequency range in 20 pairs, reduced it in three, and had no effect in one pair. The median increase in gamma-frequency SFC that accompanied stimulus selection was 75% (p = 0.001; Wilcoxon signed rank test). The clear reduction in firing rate and the clear increase in synchronization are remarkable, because the stimulus shown to the dominant eye was of such low contrast that we were unable to detect responses to that stimulus.
The relation between changes in gamma-frequency SFC and firing rate during stimulus selection
To test for a relation between gamma-frequency SFC and firing rate, we calculated selection indices for both parameters. Selection indices were defined as SI(P) = (Psel −Psup)/(Psel+ Psup), with P being the parameter firing rate (R) or gamma-frequency SFC (G), and the subscript specifying whether the activating stimulus is selected or suppressed. Selection indices pooled across all recording sites and selection paradigms are shown in Figure14. There was a small but significant negative correlation between firing rate and SFC indices (Spearman rank correlation: ρ = −0.145; p < 0.0001). There were many cases with large changes in gamma-frequency SFC but no or very small changes in firing rate. On the basis of these observations, we can rule out firing rate changes as causes for the observed changes in gamma-frequency SFC.
Fig. 14.
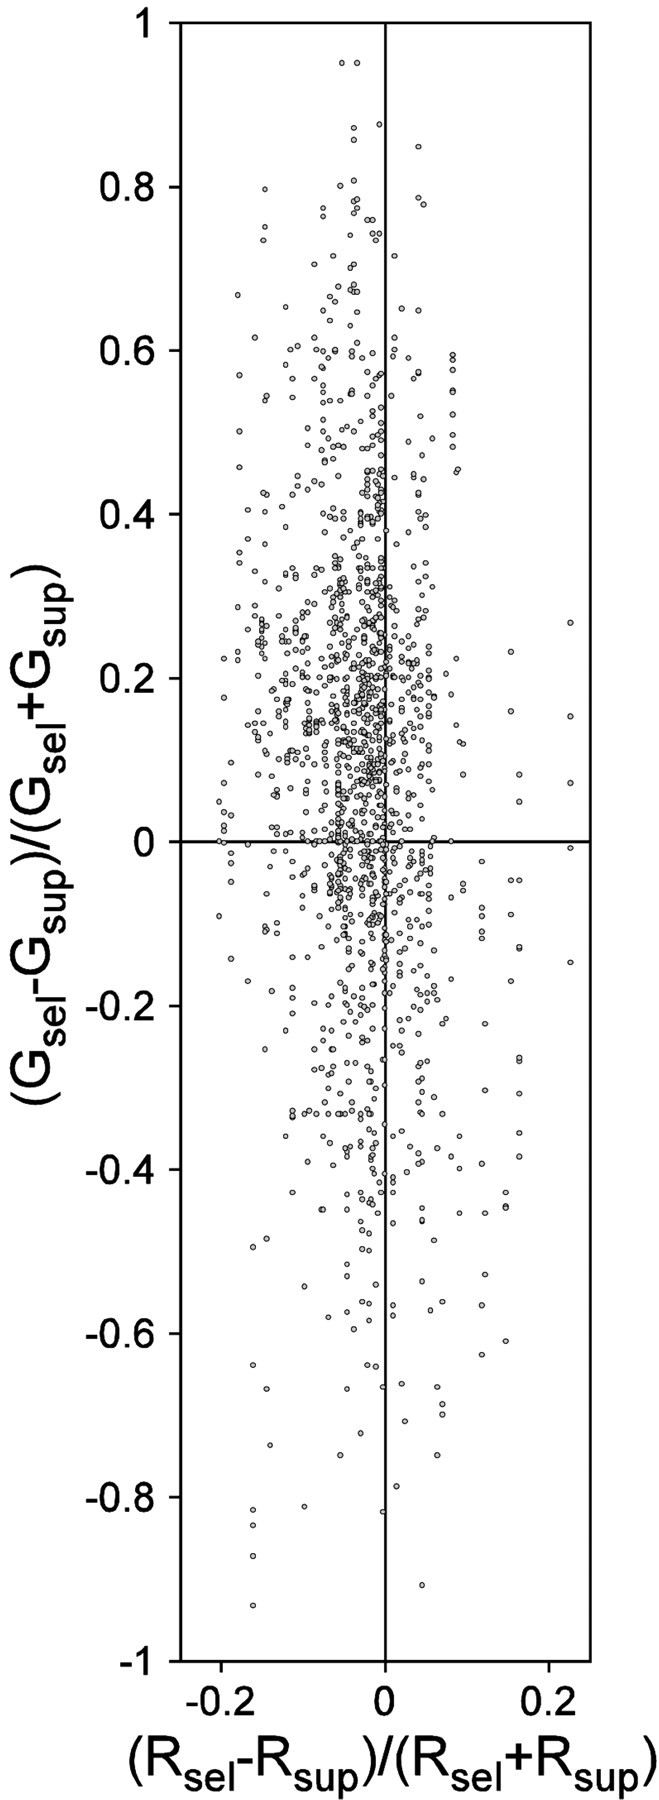
The relation between changes in gamma-frequency SFC and firing rate during stimulus selection. The scatter plot compares stimulus selection effects on firing rates (x-axis) and on gamma frequency SFC (y-axis). Each dot represents one pair of recording sites. x- and y-axis values are selection indices defined asSI(P) = (Psel −Psup)/(Psel+ Psup), with P being the parameter firing rate (R) or gamma-frequency SFC (G) and the subscript specifying whether the activated stimulus is selected or suppressed. There was a small and significant negative correlation between firing rate and SFC indices (Spearman rank correlation: ρ = −0.145; p< 0.0001).
DISCUSSION
In all paradigms used to bias competition during interocular rivalry, coherence was enhanced across the population of neurons activated by the selected stimulus, whereas firing rates showed a slight reduction. Conversely, coherence was reduced across the population of neurons activated by the suppressed stimulus, whereas firing rates were slightly enhanced. These findings go beyond our earlier report of synchronization as a correlate of strabismic eye dominance (Fries et al., 1997). We now demonstrate that gamma-frequency synchronization correlates with stimulus selection during interocular rivalry, irrespective of whether the stimulus is selected due to strabismic eye dominance or because of its novelty or contrast. Furthermore, we corroborate our earlier findings by providing data from five additional cats.
The stimulus selection related changes in neuronal synchrony were significant for all stimulation paradigms when assessed by means of the SFC. However, when assessed by cross-correlating spike responses, a significant synchronization change was found only when stimulus selection was caused by eye dominance (Fries et al., 1997) or by contrast differences. Previous studies have shown that measures of oscillatory synchronization are much more sensitive when based on LFP recordings than when assessed from spike responses alone (Murthy and Fetz, 1996; Fries et al., 2001b). This is probably attributable to the fact that gamma-frequency synchronization is a population phenomenon that is not adequately captured by single-cell recordings caused by undersampling. The LFP reflects the average transmembrane currents of neurons in a volume of several 100 μm radius around the electrode tip (Frost, 1967; Mitzdorf, 1985). In addition, the LFP reflects selectively only synchronized neuronal activity, because asynchronous discharges cancel out. SFC is, thus, an ideal measure to investigate how well the discharges of an individual neuron are synchronized to the oscillatory activity of large cell populations.
Our results suggest that the observed changes in gamma-frequency synchronization reflect the active process of stimulus selection and suppression, rather than its outcome. Several observations support this interpretation: (1) an activating stimulus in the dominant eye is selected both under monocular and dichoptic stimulation. However, during dichoptic stimulation it has to be actively selected and protected against the competing stimulus. Our data show that this process is associated with an increase in synchronization above the level observed with monocular stimulation. (2) Under dichoptic stimulation, an activating stimulus in the dominant eye is permanently selected. However, when the dominant eye stimulus is newly appearing against a pre-existing nondominant eye stimulus, competition is further biased toward selection of the dominant eye stimulus. Our data demonstrate that this additional competitive advantage results in a further enhancement of gamma-frequency synchronization among neurons activated by the new dominant eye stimulus. (3) The reverse holds for an activating stimulus shown to the nondominant eye under dichoptic conditions. With dichoptic stimulation, the stimulus in the nondominant eye is permanently suppressed because of eye dominance. However, when the suppressive dominant eye stimulus appears with a delay and thus as a new stimulus against the pre-existing nondominant eye stimulus, competition is further biased toward suppression of the nondominant eye stimulus. Our data show that this additional competitive disadvantage results in further reduction of gamma-frequency synchronization among neurons activated by the nondominant eye stimulus.
Furthermore, our results suggest that there might be a global increase of gamma-frequency synchronization whenever the stimulus constellation causes stimulus competition. Rivalry-related effects on synchronization differed between neurons activated by the dominant and nondominant eye not only in sign but also in magnitude. When the nonactivating stimulus was presented to the nondominant eye, the increase in coherence among neurons activated by the dominant eye was pronounced (SFC +38%), and spike–spike synchronization increased significantly. By contrast, when the nonactivating stimulus was presented to the dominant eye, there was only a moderate decrease in coherence among neurons activated by the nondominant eye (SFC −4%, −15% after outlier elimination), and changes in spike–spike synchronization were not significant. This asymmetry in net magnitude between selection and suppression effects could be accounted for if one assumes that the exposure to rivalrous stimuli per se enhances gamma-frequency synchronization. For neurons activated by the dominant eye, competition results in selection of the activating stimulus and the competition related increase in synchronization adds to the selection related increase. However, for neurons activated by the nondominant eye, competition results in suppression of the activating stimulus and the competition related increase in synchronization counteracts the suppression related decrease.
In the experiments in which we exploited eye dominance to bias stimulus selection, there could have been an interaction with the effects of the surgical induction of strabismus, if the operated eye had always been the nondominant eye. However, in two cats, the deviating eye was dominant. In these cats, one of which provided the data for Figures 1,5-8, and 10, the covariance between gamma-frequency synchronization and perceptual stimulus selection was the same as in the other cats, ruling out direct surgical effects as a cause for our observations.
Another confounding variable might be changes in firing rate. Modifications of synchronization might be side effects of changes in discharge rate. However, this is unlikely, because spike-field coherence is normalized not only for changes in LFP power but also for the firing rate (Fig. 4). Furthermore, we tested for a relation between selection related changes in firing rate and gamma-frequency SFC and found only a small negative correlation (Fig. 14). This analysis revealed many cases in which gamma-frequency SFC changed in the absence of firing rate changes, ruling out firing rate as a cause of SFC changes.
Changes in synchronization could also have resulted from changes in the composition of neurons contributing to the multiunit activity that we used for computation of the SFC. Although we cannot completely rule out changes in multiunit composition with changing stimulation conditions, we feel confident that this cannot account for the observed changes in synchronization, because there was only a very weak correlation between indices of firing rate change and SFC change (Fig. 14). Furthermore, dichoptic stimulation often led to enhanced firing rates in the first 1.5 sec but not during later response epochs. In contrast, synchronization of responses to the selected stimulus was elevated throughout the entire response (compare Figs. 6 and 8). Moreover, in the paradigm where selection was biased by delayed stimulus onset, firing rates were lower during the epoch after delayed presentation of the activating stimulus than in the epoch after simultaneous presentation of both stimuli. Synchrony, in contrast, was higher for responses to the temporally offset activating stimulus than for responses to simultaneously presented stimuli (Figs. 6, 8). Further evidence for the independence of firing rates and synchrony comes from the comparison of the precise dynamics of changes in firing rates and synchronization. For all paradigms of stimulus selection, differences in firing rate were maximal right after stimulus onset, whereas the effect of stimulus selection on synchronization occurred much later (compare Figs. 6, 8). Finally, when a high-contrast stimulus shown to the nondominant eye was selected because it was in competition with a low-contrast stimulus in the dominant eye, responses to the selected high-contrast stimulus showed strongly increased gamma-frequency synchronization despite the fact that there was no measurable cortical spike response to the competing low-contrast stimulus (when shown monocularly) that could potentially have changed the multiunit composition. Thus, changes in firing rate or multiunit composition are highly unlikely to account for the changes in synchronization.
An earlier study on interocular competition used stimulation paradigms similar to some of those examined here (Sengpiel and Blakemore, 1994) but arrived at different results and conclusions. The animals in Sengpiel's study were anesthetized and paralyzed and not examined behaviorally before the experiments. We repeated our measurements under general anesthesia in two of our animals with implanted electrodes and recorded from the same electrodes as in the awake condition. The effects were now very similar to those described by Sengpiel and Blakemore (1994), suggesting anesthesia as the main reason for the discrepancy.
We hypothesize that the enhanced gamma-frequency synchronization of the selected responses enhances the impact of the responses on target neurons at higher processing levels and thereby leads to perceptual dominance (Engel et al., 1997; Fries et al., 1997, 2001b). The gamma-frequency oscillations were ∼50 Hz, corresponding to a cycle length of 20 msec. Spikes are therefore synchronized within one half cycle of ∼10 msec duration. Spikes synchronized with such precision have been shown to be more effective in evoking postsynaptic action potentials than temporally dispersed spikes (Alonso et al., 1996; Azouz and Gray, 2000). Thus, stimulus selection-related changes in synchronization at one processing level are probably translated into corresponding firing rate changes at the next level. This possibility is supported by studies in the monkey which have demonstrated that rivalry related changes in firing rate increase as one proceeds along the cortical processing hierarchy (Logothetis and Schall, 1989; Leopold and Logothetis, 1996; Sheinberg and Logothetis, 1997).
P.F. and J.-H.S. contributed equally to this work
This research was supported by the Max-Planck-Gesellschaft, by the Heisenberg Program of the Deutsche Forschungsgemeinschaft Grants EN 203/4–1/4–2, and by the Minna-James-Heineman Foundation. We thank P. König for participation in the initial experiments, K.-P. Hoffmann for helpful advice, J. H. Reynolds for comments on this manuscript, M. Stephan for support in software development, and C. Selignow for technical assistance.
Correspondence should be addressed to Pascal Fries, F. C. Donders Centre for Cognitive Neuroimaging, Adelbertusplein 1, 6525 EK Nijmegen, The Netherlands. E-mail: pascal.fries@fcdonders.kun.nl.
REFERENCES
- 1.Alonso JM, Usrey WM, Reid RC. Precisely correlated firing in cells of the lateral geniculate nucleus. Nature. 1996;383:815–819. doi: 10.1038/383815a0. [DOI] [PubMed] [Google Scholar]
- 2.Azouz R, Gray CM. Dynamic spike threshold reveals a mechanism for synaptic coincidence detection in cortical neurons in vivo. Proc Natl Acad Sci USA. 2000;97:8110–8115. doi: 10.1073/pnas.130200797. [DOI] [PMC free article] [PubMed] [Google Scholar]
- 3.Blake R. A neural theory of binocular rivalry. Psychol Rev. 1989;96:145–167. doi: 10.1037/0033-295x.96.1.145. [DOI] [PubMed] [Google Scholar]
- 4.Brown RJ, Norcia AM. A method for investigating binocular rivalry in real-time with the steady-state VEP. Vision Res. 1997;37:2401–2408. doi: 10.1016/s0042-6989(97)00045-x. [DOI] [PubMed] [Google Scholar]
- 5.Crick F, Koch C. Towards a neurobiological theory of consciousness. Semin Neurosci. 1990;2:263–275. [Google Scholar]
- 6.Cynader M, Harris L. Eye movement in strabismic cats. Nature. 1980;286:64–65. doi: 10.1038/286064a0. [DOI] [PubMed] [Google Scholar]
- 7.Desimone R, Duncan J. Neural mechanisms of selective visual attention. Annu Rev Neurosci. 1995;18:193–222. doi: 10.1146/annurev.ne.18.030195.001205. [DOI] [PubMed] [Google Scholar]
- 8.Distler C, Hoffmann KP. Early development of the subcortical and cortical pathway involved in optokinetic nystagmus: the cat as a model for man? Behav Brain Res. 1992;49:69–75. doi: 10.1016/s0166-4328(05)80195-0. [DOI] [PubMed] [Google Scholar]
- 9.Eckhorn R, Bauer R, Jordan W, Brosch M, Kruse W, Munk M, Reitboeck HJ. Coherent oscillations: a mechanism of feature linking in the visual cortex? Multiple electrode and correlation analyses in the cat. Biol Cybern. 1988;60:121–130. doi: 10.1007/BF00202899. [DOI] [PubMed] [Google Scholar]
- 10.Engel AK, Roelfsema PR, Fries P, Brecht M, Singer W. Role of the temporal domain for response selection and perceptual binding. Cereb Cortex. 1997;7:571–582. doi: 10.1093/cercor/7.6.571. [DOI] [PubMed] [Google Scholar]
- 11.Enoksson P. Studies in optokinetic binocular rivalry with a new device. Acta Ophthalmol (Copenh) 1968;46:71–74. doi: 10.1111/j.1755-3768.1968.tb02496.x. [DOI] [PubMed] [Google Scholar]
- 12.Fox R, Todd S, Bettinger LA. Optokinetic nystagmus as an objective indicator of binocular rivalry. Vision Res. 1975;15:849–853. doi: 10.1016/0042-6989(75)90265-5. [DOI] [PubMed] [Google Scholar]
- 13.Freeman DN, Marg E. Visual acuity development coincides with the sensitive period in kittens. Nature. 1975;254:614–615. doi: 10.1038/254614a0. [DOI] [PubMed] [Google Scholar]
- 14.Fries P, Roelfsema PR, Engel AK, König P, Singer W. Synchronization of oscillatory responses in visual cortex correlates with perception in interocular rivalry. Proc Natl Acad Sci USA. 1997;94:12699–12704. doi: 10.1073/pnas.94.23.12699. [DOI] [PMC free article] [PubMed] [Google Scholar]
- 15.Fries P, Neuenschwander S, Engel AK, Goebel R, Singer W. Rapid feature selective neuronal synchronization through correlated latency shifting. Nat Neurosci. 2001a;4:194–200. doi: 10.1038/84032. [DOI] [PubMed] [Google Scholar]
- 16.Fries P, Reynolds JH, Rorie AE, Desimone R. Modulation of oscillatory neuronal synchronization by selective visual attention. Science. 2001b;291:1560–1563. doi: 10.1126/science.1055465. [DOI] [PubMed] [Google Scholar]
- 17.Fries P, Schröder J, Singer W, Engel AK. Conditions of perceptual selection and suppression during interocular rivalry in strabismic and normal cats. Vision Res. 2001c;41:771–783. doi: 10.1016/s0042-6989(00)00299-6. [DOI] [PubMed] [Google Scholar]
- 18.Frost JD., Jr Comparison of intracellular potentials and ECoG activity in isolated cerebral cortex. Electroencephalogr Clin Neurophysiol. 1967;23:89–90. [PubMed] [Google Scholar]
- 19.Godaux E, Gobert C, Halleux J. Vestibuloocular reflex, optokinetic response, and their interactions in the alert cat. Exp Neurol. 1983;80:42–54. doi: 10.1016/0014-4886(83)90005-5. [DOI] [PubMed] [Google Scholar]
- 20.Gray CM, König P, Engel AK, Singer W. Oscillatory responses in cat visual cortex exhibit inter-columnar synchronization which reflects global stimulus properties. Nature. 1989;338:334–337. doi: 10.1038/338334a0. [DOI] [PubMed] [Google Scholar]
- 21.Holopigian K, Blake R, Greenwald MJ. Clinical suppression and amblyopia. Invest Ophthalmol Vis Sci. 1988;29:444–451. [PubMed] [Google Scholar]
- 22.Hubel DH, Wiesel TN. Binocular interaction in striate cortex of kittens reared with artificial squint. J Neurophysiol. 1965;28:1041–1059. doi: 10.1152/jn.1965.28.6.1041. [DOI] [PubMed] [Google Scholar]
- 23.Ikeda H, Tremain KE. Amblyopia occurs in retinal ganglion cells in cats reared with convergent squint without alternating fixation. Exp Brain Res. 1979;35:559–582. doi: 10.1007/BF00236772. [DOI] [PubMed] [Google Scholar]
- 24.Jacobson SG, Ikeda H. Behavioural studies of spatial vision in cats reared with convergent squint: is amblyopia due to arrest of development? Exp Brain Res. 1979;34:11–26. doi: 10.1007/BF00238338. [DOI] [PubMed] [Google Scholar]
- 25.König P. A method for the quantification of synchrony and oscillatory properties of neuronal activity. J Neurosci Methods. 1994;54:31–37. doi: 10.1016/0165-0270(94)90157-0. [DOI] [PubMed] [Google Scholar]
- 26.Leopold DA, Logothetis NK. Activity changes in early visual cortex reflect monkeys' percepts during binocular rivalry. Nature. 1996;379:549–553. doi: 10.1038/379549a0. [DOI] [PubMed] [Google Scholar]
- 27.Levelt WJM. On binocular rivalry. Royal Van Gorcum; Assen: 1965. [Google Scholar]
- 28.Levi DM, Klein SA. Vernier acuity, crowding and amblyopia. Vision Res. 1985;25:979–991. doi: 10.1016/0042-6989(85)90208-1. [DOI] [PubMed] [Google Scholar]
- 29.Logothetis NK, Schall JD. Neuronal correlates of subjective visual perception. Science. 1989;245:761–763. doi: 10.1126/science.2772635. [DOI] [PubMed] [Google Scholar]
- 30.Logothetis NK, Schall JD. Binocular motion rivalry in macaque monkeys: eye dominance and tracking eye movements. Vision Res. 1990;30:1409–1419. doi: 10.1016/0042-6989(90)90022-d. [DOI] [PubMed] [Google Scholar]
- 31.Lumer ED. A neural model of binocular integration and rivalry based on the coordination of action-potential timing in primary visual cortex. Cereb Cortex. 1998;8:553–561. doi: 10.1093/cercor/8.6.553. [DOI] [PubMed] [Google Scholar]
- 32.Mitchell DE, Giffin F, Wilkinson F, Anderson P, Smith ML. Visual resolution in young kittens. Vision Res. 1976;16:363–366. doi: 10.1016/0042-6989(76)90197-8. [DOI] [PubMed] [Google Scholar]
- 33.Mitchell DE, Ruck M, Kaye MG, Kirby S. Immediate and long-term effects on visual acuity of surgically induced strabismus in kittens. Exp Brain Res. 1984;55:420–430. doi: 10.1007/BF00235272. [DOI] [PubMed] [Google Scholar]
- 34.Mitzdorf U. Current source-density method and application in cat cerebral cortex: investigation of evoked potentials and EEG phenomena. Physiol Rev. 1985;65:37–100. doi: 10.1152/physrev.1985.65.1.37. [DOI] [PubMed] [Google Scholar]
- 35.Mower GD, Duffy FH. Animal models of strabismic amblyopia: comparative behavioral studies. Behav Brain Res. 1983;7:239–251. doi: 10.1016/0166-4328(83)90194-8. [DOI] [PubMed] [Google Scholar]
- 36.Murthy VN, Fetz EE. Synchronization of neurons during local field potential oscillations in sensorimotor cortex of awake monkeys. J Neurophysiol. 1996;76:3968–3982. doi: 10.1152/jn.1996.76.6.3968. [DOI] [PubMed] [Google Scholar]
- 37.Polonsky A, Blake R, Braun J, Heeger DJ. Neuronal activity in human primary visual cortex correlates with perception during binocular rivalry. Nat Neurosci. 2000;3:1153–1159. doi: 10.1038/80676. [DOI] [PubMed] [Google Scholar]
- 38.Press WH, Flannery BP, Teukolsky SA, Vetterling WT. Numerical recipes in C. Cambridge University Press; Cambridge: 1992. [Google Scholar]
- 39.Roelfsema PR, König P, Engel AK, Sireteanu R, Singer W. Reduced synchronization in the visual cortex of cats with strabismic amblyopia. Eur J Neurosci. 1994;6:1645–1655. doi: 10.1111/j.1460-9568.1994.tb00556.x. [DOI] [PubMed] [Google Scholar]
- 40.Sengpiel F, Blakemore C. Interocular control of neuronal responsiveness in cat visual cortex. Nature. 1994;368:847–850. doi: 10.1038/368847a0. [DOI] [PubMed] [Google Scholar]
- 41.Sheinberg DL, Logothetis NK. The role of temporal cortical areas in perceptual organization. Proc Natl Acad Sci USA. 1997;94:3408–3413. doi: 10.1073/pnas.94.7.3408. [DOI] [PMC free article] [PubMed] [Google Scholar]
- 42.Srinivasan R, Russell DP, Edelman GM, Tononi G. Increased synchronization of neuromagnetic responses during conscious perception. J Neurosci. 1999;19:5435–5448. doi: 10.1523/JNEUROSCI.19-13-05435.1999. [DOI] [PMC free article] [PubMed] [Google Scholar]
- 43.Tong F, Engel SA. Interocular rivalry revealed in the human cortical blind-spot representation. Nature. 2001;411:195–199. doi: 10.1038/35075583. [DOI] [PubMed] [Google Scholar]
- 44.Tononi G, Srinivasan R, Russell DP, Edelman GM. Investigating neural correlates of conscious perception by frequency-tagged neuromagnetic responses. Proc Natl Acad Sci USA. 1998;95:3198–3203. doi: 10.1073/pnas.95.6.3198. [DOI] [PMC free article] [PubMed] [Google Scholar]
- 45.von Noorden GK. Theory and management of strabismus. C. V. Mosby; St. Louis, MO: 1990. [Google Scholar]
- 46.Wolfe JM. Reversing ocular dominance and suppression in a single flash. Vision Res. 1984;24:471–478. doi: 10.1016/0042-6989(84)90044-0. [DOI] [PubMed] [Google Scholar]
- 47.Wolfe JM. Stereopsis and binocular rivalry. Psychol Rev. 1986;93:269–282. [PubMed] [Google Scholar]