

Abstract
In the present work, we investigated the relationship between mitochondrial function and Ca2+ homeostasis in brain slices obtained from mice that aged normally. In acute preparations, the cerebellar neurons had similar values for intracellular free Ca2+([Ca2+]i) regardless of their age (range, 6 weeks to 24 months). However, compared with the young slices, the aged neurons (20–24 months) showed an enhanced rate of [Ca2+]i increases as a function of the time the slices were maintained in vitro. When slices were stimulated (KCl depolarization), there were significant differences in the patterns of [Ca2+]isignal displayed by the young and old cerebellar granule neurons. More importantly, the aged neurons showed a significant delay in their capacity to recover the resting [Ca2+]i. The relationship between [Ca2+]i and mitochondrial membrane potential was assessed by recording both parameters simultaneously, using fura-2 and rhodamine-123. In both young and aged neurons, the cytosolic [Ca2+]i signal was associated with a mitochondrial depolarization response. In the aged neurons, the mitochondria had a significantly longer repolarization response, and quantitative analysis showed a direct correlation between the delays in mitochondrial repolarization and [Ca2+]i recovery, indicating the causal relationship between the two parameters. Thus, the present results show that the reported changes in Ca2+homeostasis associated with aging, which manifest principally in a decreased capacity of maintaining a stable resting [Ca2+]i or recovering the resting [Ca2+]i values after stimulation, are primarily attributable to a metabolic dysfunction in which the mitochondrial impairment plays an important role.
Keywords: aging, Ca2+ homeostasis, mitochondrial membrane potential, resting Ca2+ values, ATP production, neuronal vulnerability, rhodamine-123, cerebellar granule neurons, brain slices
Mitochondria are intracellular organelles that provide cells with energy and are intimately involved in numerous cellular processes. In the nerve cells, mitochondria serve as a dynamic store, involved in the regulation of Ca2+ homeostasis (Duchen, 1999; Nicholls and Budd, 2000). Mitochondria can prevent excessive [Ca2+]i increases by continuously providing the energetic support (i.e., ATP) required by the activity of various Ca2+ ATPases and by acting as a high-capacity cellular Ca2+store (Nicholls and Budd, 2000), frequently placed in strategic positions to reduce the diffusion of Ca2+across the cytosol (Tinel et al., 1999). The effect of mitochondria in the regulation of [Ca2+]i appears to be particularly relevant in neuronal cells, in which Ca2+ uptake by neighboring mitochondria controls the kinetics of plasma-membrane Ca2+ channels and modulates the excitotoxic effect of glutamate (Stout et al., 1998; Friel, 2000). Increases of Ca2+ in the mitochondrial matrix activate dehydrogenases coupled to the Krebs cycle (Gunter et al., 2000), resulting in the activation of respiratory chain activity. Matrix Ca2+ can also directly increase ATP production by activating the F0F1 ATPase (Territo et al., 2000). Thus, mitochondrial dysfunctions could result in severe alterations of normal [Ca2+]ihomeostasis.
Several lines of evidence suggest that mitochondria are affected by aging, becoming progressively more damaged in senescent tissue (Lenaz, 1998; Cortopasi and Wong, 1999). Aged mitochondria display a significant reduction in the activity of the various electron-transport complexes and an age-associated alteration in the mitochondrial membrane potential (Hagen et al., 1997; Kwong and Sohal, 2000). These changes are seen as a consequence of a vicious cycle of accumulated mitochondrial oxidative stress and damage of the mitochondrial DNA (Lenaz, 1998; Toescu et al., 2000).
The possibility that changes in Ca2+homeostasis might explain the functional impairment in old brains forms the basis of the Ca2+ hypothesis of neuronal aging (Khachaturian, 1994). Several recent reviews examined the available evidence (Thibault et al., 1998; Verkhratsky and Toescu, 1998) and pointed out the existing discrepancies. Elevated resting [Ca2+]i and reductions in the amplitude of the stimulation-induced [Ca2+]i signals in aged neurons have been reported in some studies (Martinez Serrano et al., 1992; Kirischuk and Verkhratsky, 1996), whereas others reported either no changes in the resting [Ca2+]i (Hartmann et al., 1996a; Murchison and Griffith, 1998) or increases in the amplitude of the [Ca2+]i signals (Duckles et al., 1996) and in the Ca2+influx pathway (Thibault et al., 1998).
The interplay between mitochondrial metabolic status and Ca2+ homeostasis in neurons has been studied primarily in the context of acute excitotoxicity and neurodegeneration (Stout et al., 1998; Duchen, 1999, 2000; Mattson et al., 2000; Nicholls and Budd, 2000). Little is known about this relationship during normal, physiological aging. Here we have studied, for the first time, the relationship between mitochondrial function and [Ca2+]i dynamics in neurons in brain slices obtained from mice that aged in normal conditions. We demonstrate here that the aged neurons show a mitochondrial dysfunction characterized by a significant prolongation of the process of mitochondrial membrane potential repolarization. This mitochondrial impairment is associated with alterations in Ca2+ homeostasis that result in a decreased capacity to maintain a stable resting [Ca2+]i or recover the resting [Ca2+]i values after stimulation.
MATERIALS AND METHODS
Cerebellar slices. Young (4–6 weeks) and old (20–24 months) mice (C57BL/6) were purchased from B&K International (Hull, UK) and maintained in the animal care facilities at the University of Birmingham. All experiments were conducted in compliance with the institutional and national guidelines for humane animal handling. The animals were killed by cervical dislocation (schedule I), and the cerebellum was rapidly removed (∼1 min) and glued to the cutting block of the vibroslicer (Campden Instruments, Loughborough, UK), with manual control on advance, using a high-vibration speed setting (9–10 of 11). Parasagittal slices (250–350 μm thickness) were cut in ice-cold artificial CSF (aCSF) containing (in mm): 4.7 KCl, 2.5 CaCl2, 25 NaHCO3, 1.2 KH2PO4, 1.2 MgSO4, and 11 glucose, equilibrated continuously with 95% O2 and 5% CO2, to maintain the pH at 7.4. During cutting and for the initial period of equilibration (30 min), the aCSF was supplemented with 225 mm sucrose to reduce the level of neuronal damage (Moyer and Brown, 1998). Cutting was done at 0–4°C, and the slices were transferred into the sucrose-based equilibration aCSF, gassed, and maintained at room temperature. After 30 min, the slices were transferred to a slice-holding chamber (based on a 100 μm cell strainer; Becton Dickinson, Mountain View, CA), maintained fully submerged (2–3 cm) in a beaker that contained the normal aCSF (with 118 mm NaCl instead of sucrose), and continuously gassed. The slices were maintained in these conditions for different periods of time until use.
Ca2+ imaging experiments. For [Ca2+]iexperiments, the slices were loaded by transferring them with an inverted glass Pasteur pipette to a smaller container in a small, bench-top oven, that was maintained at 33°C. This glass container was filled with 1 ml of aCSF supplemented with fura-2 AM at a concentration of 10 μm. During the 30 min loading, the medium was continuously and gently bubbled with the 95% O2 and 5% CO2 gas mixture. After loading, the slices were returned to the holding chamber and maintained for another 30 min to allow complete de-esterification of the Ca2+ dye.
For experimentation, the slices were transferred into a perfusion bath, placed on the stage of an upright microscope (Olympus BW 50I; Olympus Optical, Tokyo, Japan), and visualized through a 60× water-immersion objective. The slices were fully submerged and superfused with aCSF containing 20 μm picrotoxin, at a rate of 1.5 ml/min and at room temperature, in a gravity-fed system consisting of four separate reservoirs (60 ml plastic syringes) bubbled independently. Each reservoir had a separate tube (controlled by a three-way stopcock); the four separate outlets were glued together and opened in the bath, near the surface of the slice, with their precise positioning being achieved using a macromanipulator. When the slices were stimulated, the exposure period was controlled manually by first closing the line containing the aCSF and then opening, at time 0, the line containing the stimulus for the required amount of time. The proximity of the tube opening to the area of the slice that was visualized secured rapid access of the stimuli to the neurons, independent of the concentration changes in the bath.
Images were taken using an intensified GenIV camera (Universal Imaging, Marlow, UK). The excitation light (340 and 380 nm wavelength) was provided by a monochromator (Cairn Research Ltd., Faversham, UK), controlled through MetaFluor software (Universal Imaging Corporation, West Chester, PA). The emission was set with a 535 ± 25 nm cutoff filter (Chroma Technology Corp., Brattleboro, VT) placed in a Sutter (Novato, CA) filter wheel installed in front of the camera.
Images were collected at a rate of 0.2–3 Hz; analysis was performed offline, using as region of interest (ROI) the entire soma of individual neurons. [Ca2+]i levels were calculated from the ratio of emitted fluorescence on excitation at 340 and 380 nm, using the standard Grynkiewicz formula (Grynkiewicz et al., 1985). For calibration, the slices were exposed sequentially (at room temperature) to an aCSF solution containing 5 μmionomycin and either 10 mmCa2+ or no Ca2+ and 1 mm EGTA, to obtain the Rmax (1.75) andRmin (0.55), respectively.
Dual measurements of [Ca2+]i and mitochondrial membrane potential. For these experiments, the slices were loaded sequentially with fura-2 AM, as described above, followed by incubation for 10 min with a solution containing 10 μm rhodamine-123 (Sigma/RBI, Poole, UK). Rhodamine was used in preference to other mitochondrial dyes, such as tetramethylrhodamine ethyl ester (TMRE) or tetramethylrhodamine methyl ester (TMRM), because it has a better cell retention as a result of its lower membrane permeability (Nicholls and Ward, 2000; Toescu and Verkhratsky, 2000). To provide consistency between experiments and to allow direct comparisons, the rhodamine-123 solutions used were prepared daily and loaded under identical conditions. Furthermore, particularly for the fura/rhodamine studies, the intensifier gain on the camera was always set at the same value. For collecting images, the slices were exposed sequentially to 340, 380, and 480 nm wavelength light, and the emission was collected through two separate filters (535/25 nm and 560LP; Chroma Technology Corp.) placed in the Sutter filter wheel and controlled by the MetaFluor program. A full set of the three images for each excitation wavelength, at 512 × 512 pixels, with no binning, can be collected at 2 Hz.
Comparison between the properties of young and old slices.Taking into account that aged animals show clear functional impairment (Barnes 1994; Zyzak et al., 1995), it is very important for allin vitro studies to establish the quality of the experimental model (i.e., the slice), to be able to differentiate between age-dependent changes in the physiological status of the neurons, which should be manifest from the start of the in vitro experimentation period, and the dysfunctions induced by the preparation methods (slicing and conditions of maintenance). Several studies on brain slices obtained from aged animals showed that the basic features of neuronal electrophysiology (e.g., resting membrane potential, input resistance, action potential threshold, and amplitude) are not different, at least for hippocampal neurons, in the aged neurons compared with the young adults (Thibault et al., 2001). Because other studies assessing the morphology of the slices showed that the aged slices are more sensitive to the isolation conditions than the young ones (Moyer and Brown, 1998), it was important to assess the quality of our older slices and to compare them with the young ones. For these controls, all experiments were performed at early time points after slice isolation and equilibration so that the influence of the factors associated with in vitro maintenance could be minimized.
One criterion used was the percentage of compromised cells, as assessed by the use of nuclear dyes [5 μm of the membrane-permeant Hoechst 33842 (Hoe) and 10 μm propidium iodide (PI)]. The slices, soon after equilibration and transfer in the normal (NaCl-based) aCSF, were loaded for 10 min in bubbled aCSF with both dyes and then transferred to the experimental chamber for fluorescence measurements, under continuous perfusion. Images were taken near the surface of the slice and 30 and 60 μm deeper within the slice. The assessment of the percentage of PI-positive cells out of the total number of cells labeled by Hoe showed that there was no significant difference between the young and aged slices (∼75% of the cells on the surface of the slice stained for PI, whereas at 60 μm deep in the slice, only 20–25% of the cells were PI-positive).
Another criterion used for comparison was the loading efficiency of the fura, measuring independently the baseline average fluorescence intensity at 340 and 380 nm excitation for the neurons deeper in the slice (50 μm). No difference was found between these fluorescence values [for 340 nm excitation: 270 ± 20 fluorescence units (FU), after background subtraction for young neurons, mean ± SEM, versus 250 ± 20 FU for older neurons; for 380 nm excitation: 440 ± 20 FU for young neurons versus 390 ± 30 FU for older neurons], indicating a similar loading efficiency (Fig.1).
Fig. 1.

Efficiency of fura-2 loading in cerebellar slices obtained from young and aged animals. Images (separate for 340 and 380 nm excitation wavelengths) were obtained ∼40 μm below the slice surface. The graph compares the background-subtracted fluorescence levels for 340 and 380 nm images, comparing the young and old slices (mean ± SEM of 7 separate sets of images collected from 4 animals for the young group and 3 animals for the old group). No significant differences were found between the young and the old animals.A.U., Arbitrary units.
Finally, using the morphometric analysis package MetaMorph (Universal Imaging, Downingtown, PA), we measured, on the basis of the bright 380 nm images, the surface area of the granule neurons in a series of images; no significant differences were found between young and old neurons.
Chemicals and reagents. All chemicals were purchased from Sigma.
Statistics. Each set of experiments is representative of at least four independent experiments performed on different preparations. Statistical significance was assessed by the unpaired Student'st test, performed using Excel 97 (Microsoft, Seattle, WA).
RESULTS
Resting [Ca2+]i values
We first examined whether aging induces changes in the value of neuronal resting [Ca2+]i. This is a very important issue that is compounded by the scattering of currently available results (Thibault et al., 1998; Verkhratsky and Toescu, 1998). As argued, part of this variability might be explained by the choice of experimental model, and few studies have used the most physiological brain preparation, the brain slice (Verkhratsky and Toescu, 1998). In the present experiments, cerebellar brain slices were obtained from animals of different ages and loaded with fura-2 AM during the equilibration period. The resting [Ca2+]i values were thus determined within the first 1–1.5 hr after slice cutting. As seen in Figure 2, there was no significant difference between the mean resting [Ca2+]i value of cerebellar granule neurons across the entire range of ages from 6 weeks to 24 months [71 ± 3 nmCa2+ at 6 weeks (n = 76) vs 74 ± 4 nmCa2+ at 24 months (n = 33); p ≫ 0.05; two-tailed t test]. Similar values were recorded for Purkinje neurons [79 ± 5 nm Ca2+ at 6 weeks (n = 22) vs 86 ± 9 nmCa2+ at 24 months (n = 15); p ≫ 0.05; two-tailed t test].
Fig. 2.

Measurement of resting [Ca2+]i at early time points after slice isolation. Brain slices were loaded with fura-2 AM after a minimal re-equilibration period, and all [Ca2+]i recordings were performed within 60–90 min after brain dissection. The numbers on the graph represent the numbers of neurons in each respective age group. There was no statistical significant difference between the mean resting [Ca2+]i value for any of the age groups (one-way ANOVA).
Maintenance of resting [Ca2+]i
Because the starting point is not necessarily a predictor for the subsequent development of a process, we were interested in determining whether one reason to explain the discrepancy in the published data regarding the resting [Ca2+]i in aged neurons would be an increase in this parameter as a function of the time of maintenance in vitro. For these experiments, the cerebellar slices obtained from animals of different ages (6 weeks and 24 months) were maintained in vitro for different periods of time, in the absence of any stimulation (i.e., kept in the holding chamber in normal aCSF media and continuously bubbled with O2 and CO2). At regular intervals, individual slices (different slices for each individual time point) were loaded with fura-2 AM and the resting [Ca2+]i was measured 50–70 μm deep in the slice, so as to avoid the complications associated with surface damage of the slice (see Materials and Methods) (Moyer and Brown, 1998). In agreement with previous data regarding the selection criteria for healthy neurons (Thibault et al., 2001), for this analysis we included only neurons that had a resting [Ca2+]i value <150 nm.
Figure 3A is a scatterplot of all of the data obtained from both young and old slices at the various time points of the investigation. A two-factor repeated-measures ANOVA was used to assess the existence of a possible statistical difference between these two sets of data. This analysis showed that, with respect to the age factor, the two sets of data were significantly different (p < 0.001). Post hoc analysis indicated that the differences in resting [Ca2+]i between the young and old slices became statistically significant after ∼3 hr (at 3 hr, p = 0.051; at 4 hr, p = 0.003). To understand better the dynamics of the changes in resting [Ca2+]i with time, we used linear and nonlinear regression models to fit the data sets. Of the three main models used (linear, sigmoidal, and exponential), both the young and old data were best fitted by an exponential model [y = A × exp(−(x/B)] (Fig. 3B). Although the intercepts (A) were similar (64.80 ± 1.38 for young and 61.99 ± 1.66 for old), the rate factors (B) were different (−23.38 ± 2.85 and −11.73 ± 0.92 for young and old, respectively), and from the fact that the statistically calculated 95% confidence limits (CLs) for each of them do not overlap (minimal 95% CL for young, −17.79; maximal 96% CL for old, −13.55), it can be concluded that the increase in resting [Ca2+]i in the old neurons as a function of time of in vitro maintenance takes place at a significantly higher rate than in the younger slices. These relationships were not affected by the presence of 1 μm TTX in the incubation buffer, indicating that the differences in the capacity of the neurons to maintain their resting [Ca2+]iare not attributable to a higher level of spontaneous neuronal activity in the aged slices.
Fig. 3.
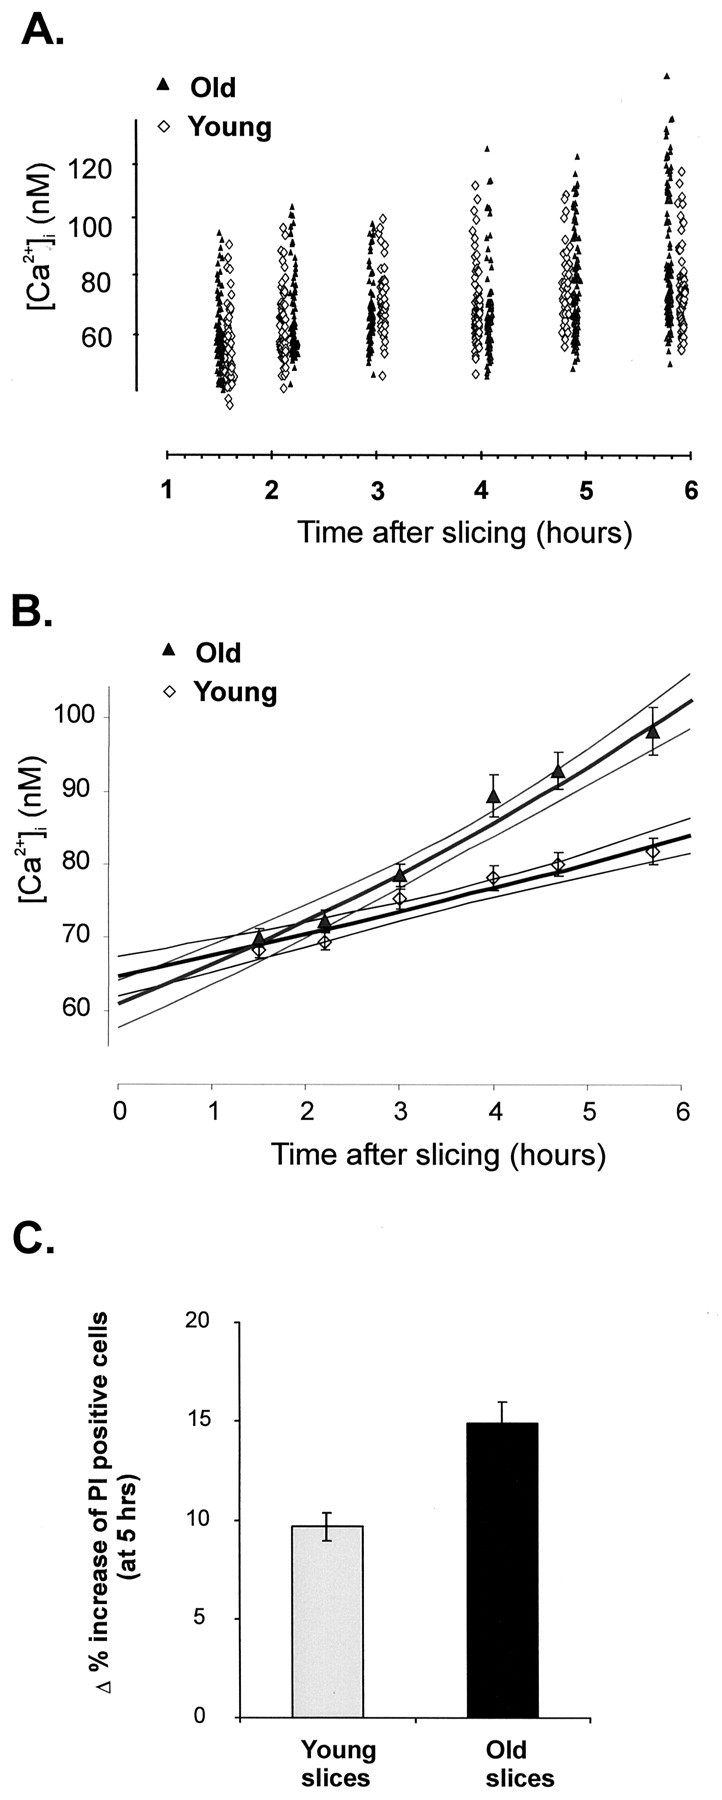
Analysis of resting [Ca2+]i values of cerebellar granule neurons from young (6 weeks) and aged (24 months) slices, maintainedin vitro for extended times. A, Scatterplot of resting [Ca2+]i values of cerebellar granule neurons from young (6 weeks) and aged (24 months) slices, maintained in vitro. After cutting, the slices were maintained in a brain slice holding chamber, in aCSF bubbled with O2 and CO2, for various periods of time. For each age, three separate animals were used; for each time point, a separate slice was loaded with fura-2 AM at the respective time point. The slices were imaged [340 and 380 nm images were taken of several fields (5–7 per slice)] and the resting [Ca2+]i values were calculated offline. B, Graph of the mean ± SEM [Ca2+]i value for each time point and for each experimental group presented in A. The data inA were curve-fitted with various linear and nonlinear models to find the best fit, as described in Results. The graph shows the exponential best fit for each of the data sets (Young and Old), together with the calculated 95% CL, to illustrate the fact that for the first 3 hr the curves are superimposable, after which time the curves become significantly different. C, Increase in neuronal death in slices maintained in vitro for 5 hr. Slices were loaded for 10 min with a PI/Hoe mixture at 1 hr after slice isolation and after 6 hr of in vitro maintenance in the slice-holding chamber (3 young animals, 7 slices at 1 hr and 6 slices at 6 hr; 3 old animals, 5 slices for both 1 and 6 hr). Images of two to three fields per slice were taken, and the number of PI-positive cells (normalized for the total number of cells as labeled by Hoe) was calculated. The graph shows the percentage increase in the number of PI-positive cells over the 5 hr interval of in vitro maintenance.
Using a similar experimental protocol, we also observed that in vitro maintenance was associated with a gradual increase in the number of granule neurons that stain positive with PI, a nuclear dye that stains cells with compromised plasma membrane permeability. Over a 5 hr interval, in the young slices the number of PI-positive cells increased by 9.7 ± 0.7% (n = 7 fields per slice at each time point; three animals), whereas in the old slice, over the same time interval, the increase in the PI-positive cells was larger (15.0 ± 1.1%; p ≪ 0.05; t test), indicating an increased vulnerability of the neurons in the aged slices to in vitro maintenance conditions (Fig. 3C).
Ca2+ responses to KCl-evoked depolarization
The next issue examined was that of possible changes in the dynamics of the [Ca2+]i response to neuronal stimulation as a function of aging. To reduce the problems potentially associated with age-dependent changes in glutamate receptor expression (Gazzaley et al., 1996), for these experiments we used a simple KCl-evoked depolarization protocol (in the presence of 1 μm TTX, to avoid the possible amplification of the signals through secondary action potential-mediated events), effectively clamping the neurons at a depolarized membrane potential for the duration of KCl exposure. In slices from young animals (6–8 weeks of age), a 30 sec depolarization with 50 mm KCl induced an expected Ca2+ signal (Fig.4). In most neurons (85% from a total of 80 neurons analyzed), the [Ca2+]i response was monophasic, with a complete recovery of the resting [Ca2+]i. In a small percentage of neurons (15%), the initial Ca2+ signal was followed by two to five slow oscillations of somatic [Ca2+]i (Fig. 4, neuron 2). Although not investigated in detail, these occasional oscillations were not influenced by 1 μm TTX.
Fig. 4.

Depolarization-induced [Ca2+]i responses in cerebellar granule neurons in slices from young (6-week-old) animals. Slices (250 μm thickness) were loaded with 10 μm fura-2 AM, mounted in a perfusion chamber, and perfused through a plastic pipette brought with a micromanipulator to the vicinity of the area visualized through the microscope objective (perfusion rate, 1.5 ml/min). KCl (50 mm) was applied as indicated by the barabove the Ca2+ trace. The figure represents two individual Ca2+ traces obtained from the two neurons in the granular area of the cerebellar slice. For the set of images labeled A–E and corresponding to the regions labeled A–E on the Ca2+ traces, a mask obtained from the 380 nm images was applied to reduce the surrounding noise signal.
The same experiments were performed on slices from aged animals. Taking into account the potential for dysregulation of Ca2+ homeostasis as a function of the time of slice maintenance in in vitro conditions (see above), all of these experiments were performed within 2 hr after slicing; for analysis, only neurons that displayed a low (<150 nm) and stable [Ca2+]i were included for analysis. In Figure 5, a set of four neurons is shown that, in a fortunate manner, illustrate the main patterns of [Ca2+]i response in aged cerebellar granule neurons in response to KCl depolarization. The main type of response (65% from a total of 57 neurons) is that recorded for neuron 1: a monophasic Ca2+response, similar to that observed in young neurons (type 1 response). The response of another 30% of the neurons is typified by neurons 3 and 4 in Figure 5: an initial monophasic Ca2+ signal that started to recover after removal of the depolarizing stimulus but never reached the prestimulus resting [Ca2+]ilevels because the neurons started to show a secondary [Ca2+]i increase (type 2 response). This increase was irreversible. Finally, in ∼15% of the cases, the neurons did not respond, or showed only a minimal increase in [Ca2+]i as a result of the KCl stimulation. Instead, these neurons (neuron 2) showed a late, irreversible [Ca2+]iincrease.
Fig. 5.
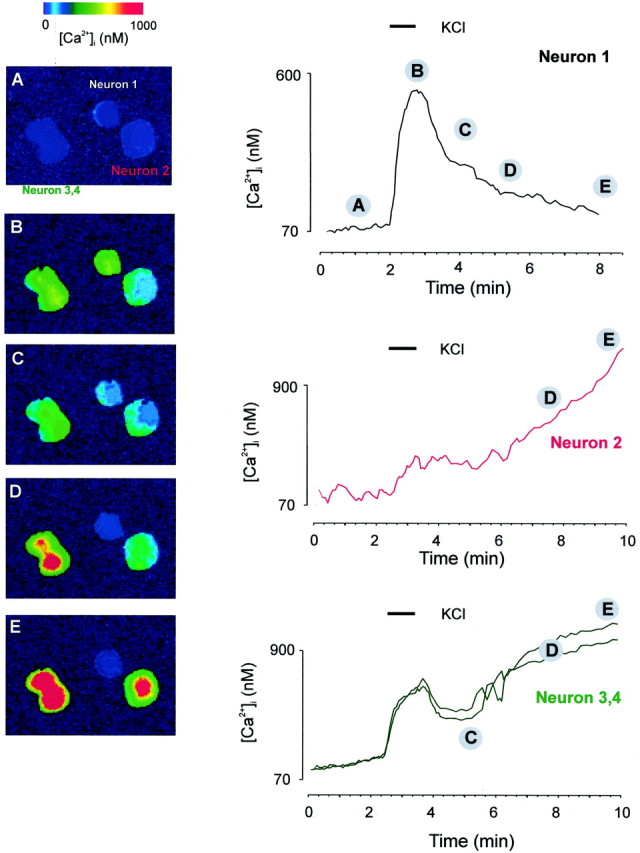
Depolarization-induced [Ca2+]i responses in cerebellar granule neurons in slices from old (22- to 24-month-old) animals. Slices (250 μm thickness) were treated and perfused as described in the legend to Figure 4. KCl (50 mm) was applied as indicated by the bar above the Ca2+trace. The figure represents four individual Ca2+traces obtained from four neurons in the granular area of the cerebellar slice (labeled 1–4). For the set of images labeled A–E and corresponding to theregions labeled A–E on the Ca2+traces, a mask obtained from the 380 nm images was applied to reduce the surrounding noise signal.
Apart from the differences in the pattern of [Ca2+]i response to neuronal depolarization, additional significant differences between the young and old cerebellar granule neurons were revealed by a direct comparison of the [Ca2+]i traces. For this type of analysis, the main pattern of [Ca2+]i response in young neurons (Fig. 4) was compared only with responses in the older neurons that did not show the second-phase loss of Ca2+ homeostasis [i.e., only old neurons displaying a type 1 response (monophasic response with full recovery), such as neuron 1 in Fig. 5]. The results of this comparison (Fig.6) show that whereas the rate of [Ca2+]i increase and the amplitude of the [Ca2+]i response is similar in the two populations, for the old neurons there was a clear slowdown in the recovery of [Ca2+]i after the removal of the stimulus (Fig. 6A). At the end of the stimulation period, the mean [Ca2+]i values were similar in both preparations (512.3 ± 18.4 and 521.5 ± 12.4 nm Ca2+ for the young and old neurons, respectively). However, during the recovery period, the average [Ca2+]i values differed significantly between the aged and young neurons. At 60 sec after the removal of the depolarization stimulus, [Ca2+]i in the old neurons was 75% larger than in the young neurons [166.6 ± 3.9 nm Ca2+ (young) vs 292.6 ± 12.2 nmCa2+ (old)]. The [Ca2+]i values became similar in the two preparations by 4 min (67.6 ± 3.0 vs 75.1 ± 8.1 nmCa2+ for young vs old, respectively). Two-way repeated-measures ANOVA (using time and age as analysis factors) on [Ca2+]i values obtained from individual neurons at different time points after the removal of the depolarization stimulus indicated that age affects the values of [Ca2+]iin a highly statistically significant manner (p= 0.009). These differences were also confirmed by calculating the rate of [Ca2+]irecovery (Fig. 6B), which shows that at all time points after the removal of the stimulus, the rate of recovery in the aged neurons was lower than in the young neurons (p = 0.0121 for the age-factor effect; two-way ANOVA).
Fig. 6.
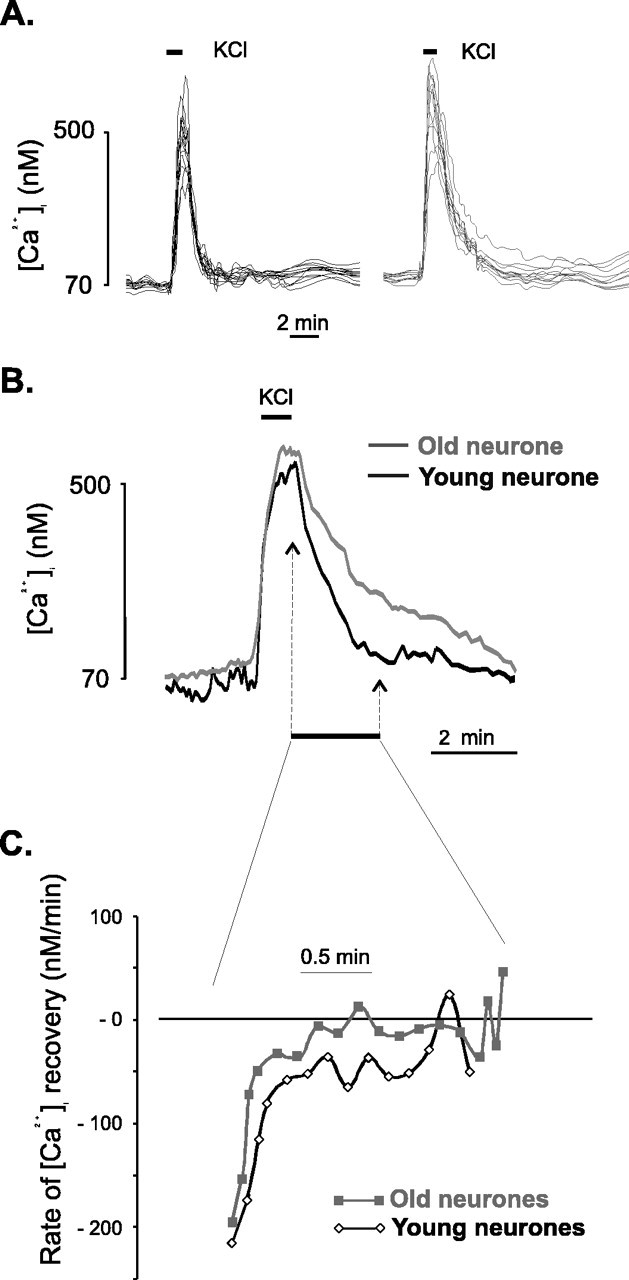
Comparison of [Ca2+]i response to neuronal depolarization in cerebellar granule neurons in slices from young and aged animals. A, Illustration of the range of [Ca2+]i responses to depolarization-evoked stimulation (indicated by the barabove the traces) in a young slice (left) and an old slice (right). For each panel, the traces show data from two separate experiments. B, Superimposition of mean [Ca2+]i traces obtained from cerebellar granule neurons in response to KCl-evoked depolarization in young (black line) and old (gray line) animals. For the aged group, only neurons that showed a monophasic response with full recovery of the resting [Ca2+]i were included for analysis. The traces are aligned for the initiation time point. The traces show the average trace obtained from a representative experiment (7 neurons for the young slices and 5 for the old slices).C, The rate of [Ca2+]irecovery was calculated from the [Ca2+]i values (for the period of time marked in A) as the first-order differential of the Ca2+ trace with respect to time, and is expressed in units of ratio per minute. The first data point displayed on the graph corresponds to the moment at which KCl perfusion was stopped, and the trace covers the period of time highlighted in B. The two-factor ANOVA on the two data sets (young and old) indicated a statistically significant difference between them (p = 0.015).
Dual measurements of [Ca2+]i and mitochondrial membrane potential
The decrease in the capacity of old neurons to maintain a stable resting [Ca2+]iover longer periods of time in vitro (Figs. 2, 3) and the significant reduction in their rate of [Ca2+]i recovery after stimulation all point to a possible reduction in the metabolic–energetic reserves of these aged neurons. Mitochondria are a major site of cellular ATP production (Nicholls and Budd, 2000); furthermore, during aging, mitochondrial dysfunctions have been reported by several studies (Lenaz, 1998). Thus, experiments were performed to assess simultaneously the dynamics of [Ca2+]i and mitochondrial responses to depolarization-induced stimulation. Because the major factor in determining the level of mitochondrial ATP production is the mitochondrial membrane potential (Ψmito) (Nicholls and Budd, 2000), we monitored this parameter using rhodamine-123. This Nerstian dye distributes across the membranes strictly as a function of their membrane potential; thus, it accumulates in mitochondria preferentially (Nicholls and Ward, 2000; Toescu and Verkhratsky, 2000). After depolarization, the dye is released from the mitochondria, with a resultant increase in the cytosolic signal. For this type of experiment, the use of rhodamine-123 is preferable to the use of the other mitochondrial dyes, such as TMRM or TMRE, because it has a much lower membrane permeability (Nicholls and Ward, 2000). As a consequence, a decrease in the rhodamine-123 signal during or immediately after cell stimulation is attributable to rhodamine reuptake by repolarizing mitochondria rather than to loss of dye to the extracellular medium (Nicholls and Ward, 2000; Toescu and Verkhratsky, 2000).
In Figure 7, the superimposed [Ca2+]i and rhodamine-123 traces obtained from single, individual cerebellar granule neurons are shown. For both young (Fig. 7A) and old (Fig. 7B) neurons, the responses show similar features: the depolarization-evoked increase in [Ca2+]i was associated with a mitochondrial depolarization, the latter being initiated after a short lag period. This lag period most likely reflects the time taken for the increase in cytosolic Ca2+ to reach the threshold for the activation of the mitochondrial Ca2+uniporter (Gunter et al., 2000). The other salient feature of these traces is that the start of the recovery of the [Ca2+]i after the removal of the stimulus did not correlate strictly with the initiation of the fast mitochondrial repolarization.
Fig. 7.
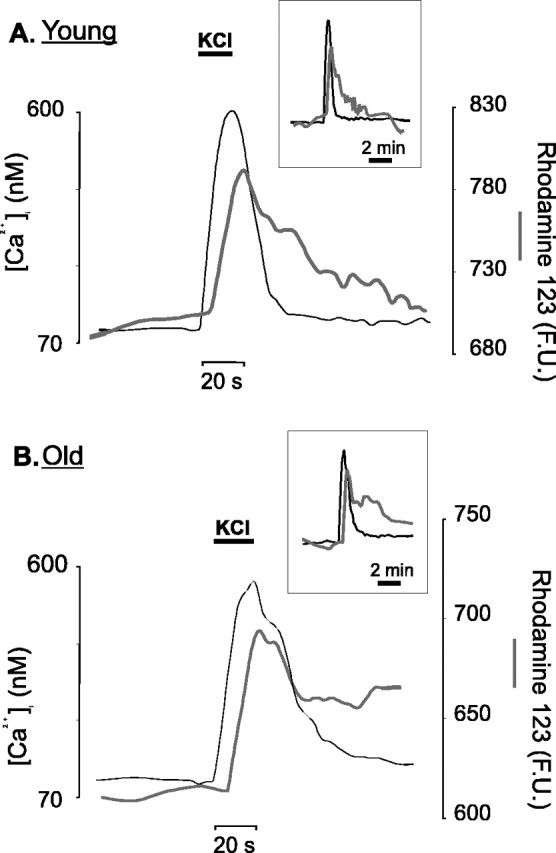
Simultaneous measurements of [Ca2+]i and mitochondrial membrane potential. The slices were loaded sequentially with 10 μmfura-2 AM and 10 μm rhodamine-123 and perfused with 50 mm KCl as indicated by the bars above the traces. A, A trace representative of an individual cerebellar granule neuron recorded in a brain slice from a young animal (6 weeks of age). [Ca2+]i values (left axis) are in nanomolar Ca2+, whereas the rhodamine-123 readings (right axis) are expressed as fluorescence units (F.U.), in effect, gray-level values. Each individual time point represents the average signal derived from an ROI that covered the whole of the neuronal soma.Inset, Combined traces for the length of the entire experiment. B, Same presentation, but the trace illustrates the response of a single cerebellar granule neuron from an aged (23-month-old) animal. Thin black lines, [Ca2+]i; gray lines, rhodamine-123 signals.
The differences in [Ca2+]i responses between the two neuronal populations have been discussed above (Fig. 6) and are shown in Figure 8, which compares directly the rhodamine-123 traces obtained from young and aged neurons, revealing additional important differences regarding the mitochondrial response. First, in the aged neurons, the rhodamine-123 signal is significantly lower (Fig. 8A) [739 ± 42 FU (young) vs 574 ± 33 FU (old) (n = 23);p < 0.05]. In Figure 8B, the data for each trace are normalized for the corresponding peak response to reveal the differences in the dynamics of the mitochondrial depolarization response to neuronal stimulation; in the aged neurons the initial lag period is increased and, most importantly, the repolarization response is significantly delayed.
Fig. 8.
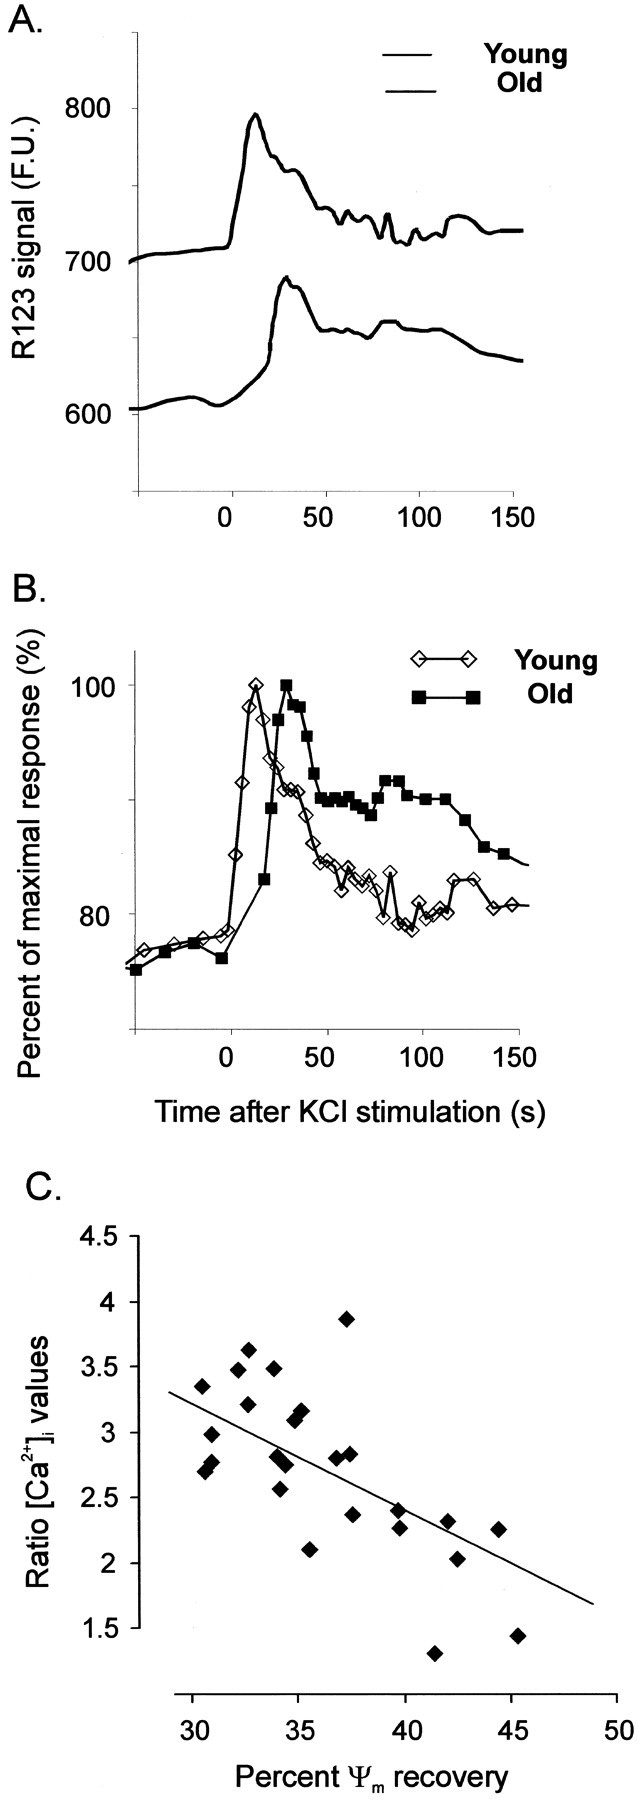
Comparison of the response of rhodamine-123 to neuronal depolarization in cerebellar granule neurons in slices from young and aged animals. A, The average rhodamine-123 (R123) fluorescence traces from one representative experiment (young slices, 7 neurons; old slices, 6 neurons) are plotted, in fluorescence units (F.U.) against time, for the first 150 sec after the initiation of KCl perfusion. B, The same set of data are replotted, normalizing for the maximal rhodamine signal for each group independently. Traces are carefully aligned so that time = 0 corresponds to the start of the KCl perfusion, which lasted 30 sec.C, Correlation between the mitochondrial Ψmito and [Ca2+]irecovery measured at 60 sec after the initiation of neuronal stimulation. For calculation of the Ψmito recovery, the amplitude of the depolarization-evoked mitochondrial response (in fluorescence units) was taken as 100%, and the amount of fluorescence decrease associated with mitochondrial repolarization was expressed as a percentage of this value. For calculation of the [Ca2+]i recovery, the ratio between the [Ca2+]i value at 60 sec and the resting [Ca2+]i was calculated and is expressed on the ordinate. The solid line shows the linear regression best fit for the experimental values.
Thus, in the aged neurons both the [Ca2+]i recovery and the mitochondrial repolarization are delayed compared with the young neurons. Figure 8C shows the relationship between these two parameters. The recovery of the [Ca2+]i at 1 min in old cells was expressed as the ratio between the [Ca2+]i value at that time and the resting [Ca2+]i, whereas the mitochondrial repolarization response at the same time point was expressed as a percentage of recovery. The graph clearly shows that there is a close and significant (p < 0.001) correlation between these values; the poorer the mitochondrial Ψmito recovery (and most of the old neurons have only a 30% recovery at 60 sec), the slower the [Ca2+]i recovery (i.e., a larger ratio between [Ca2+]i/[Ca2+]i-rest).
The data in Figure 8A show that the aged neurons have a lower absolute reading of rhodamine-123 fluorescence. This would indicate a lower level of loading of rhodamine-123 in the aged neurons that might, taking into account the strict Nerstian distribution of the dye in intracellular compartments, also indicate an increased degree of mitochondrial depolarization in these old neurons (Toescu and Verkhratsky, 2000). The rhodamine-123 loading of the young and old neurons was tested using the mitochondrial protonophore carbonylcyanide m-chlorophenylhydrazone (CCCP) (10 μm), which, by collapsing the mitochondrial membrane potential, allows the complete release of rhodamine-123 from the mitochondria (Toescu and Verkhratsky, 2000). As seen in Figure9, CCCP induced a significantly higher increase in the neuronal rhodamine-123 signal in the young neurons than in the old ones (81.5 ± 5.1% increase in young neurons vs 66.5 ± 3.2% in the old neurons; p < 0.001), indicating a lower level of rhodamine-123 loading in the aged neurons.
Fig. 9.
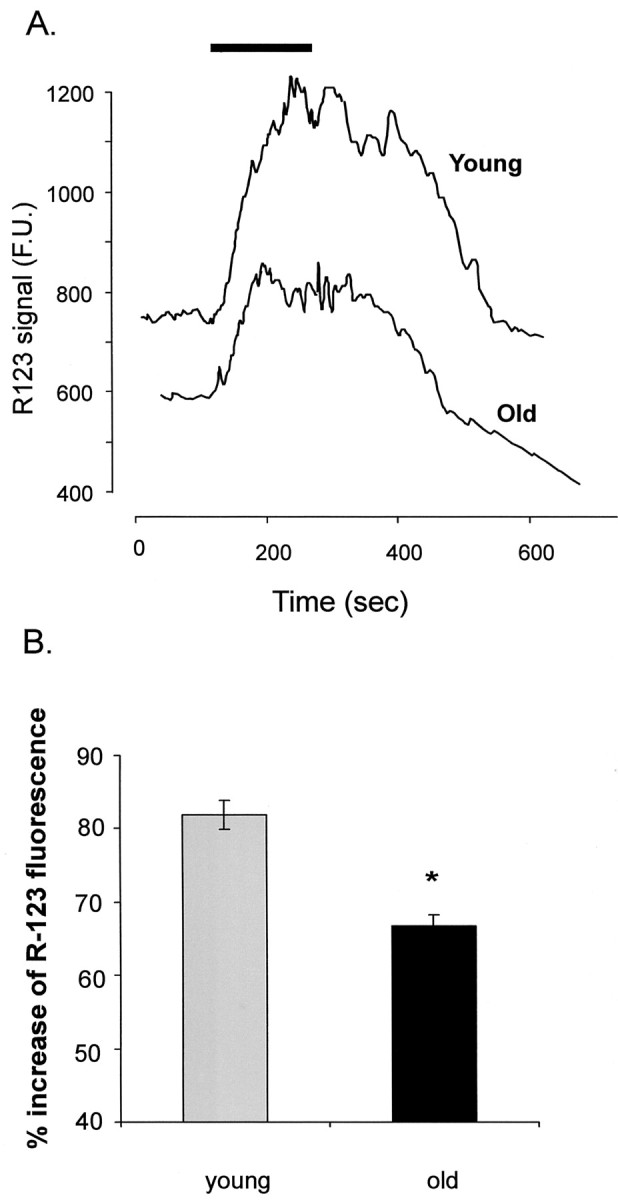
Carbonylcyanidep-(trifluoromethoxy)phenylhydrazone (FCCP)-induced release of rhodamine-123 from loaded slices.A, Traces of FCCP (1 μm)-induced release of rhodamine-123 (R123) from slices obtained from young and old animals. Each trace represents the average of raw rhodamine fluorescence signals from one individual experiment (13 cells for the young and 11 cells for the old) evoked by FCCP during the exposure time indicated by the solid bar above the traces.B, Bar graph (mean ± SEM from 7 images from 3 separate animals for each age group) of the FCCP effect on the rhodamine-123 (R-123) signal. In the old slices, the protonophore induces a significantly (*p < 0.001) lower increase in the rhodamine-123 signal, indicating lower rhodamine-123 loading.
DISCUSSION
In this paper, we have analyzed, for the first time, the relationship between neuronal Ca2+homeostasis and mitochondrial status during the process of normal aging. Although age-related changes in Ca2+ homeostasis have been reported before, most of these studies have been performed in acutely isolated neurons or subcellular preparations (Verkhratsky and Toescu, 1998), whereas here we have used a more physiologically relevant preparation, the brain slice. The most significant change in Ca2+ homeostasis was seen during a sensitive, energy-dependent phase of Ca2+signaling, the recovery of the resting [Ca2+]i after neuronal stimulation. This deficit was associated with a mitochondrial impairment of membrane repolarization that would be indicative of a limitation in the capacity of mitochondria to provide energy support during phases of metabolic stress. This explanation would also underpin the increased vulnerability of the aged neurons reported here.
Age-dependent changes in Ca2+ homeostasis
One of the main conclusions of our experiments is that in acutely isolated brain slices, there is no change in the values of resting [Ca2+]i of cerebellar granule neurons as a function of the age of the animal. This value has a very important functional meaning: resting [Ca2+]i is set, at steady state, by the balance between the Ca2+ entry systems (Ca2+ channels primarily) and Ca2+ removal systems (primarily ATPases). A change in any of the Ca2+ transport systems, as predicted by the Ca2+hypothesis of aging (Khachaturian, 1994; Verkhratsky and Toescu, 1998), must affect, especially when acting over long periods of time, the value of resting [Ca2+]i. We found that, when measured a short time after slice preparation, the resting Ca2+ is not different in young or aged animals, indicating that the aged cerebellar neurons do not have a chronic dysfunction of any of the major Ca2+ homeostatic pathways.
In contrast, the capacity of neurons to maintain a stable resting [Ca2+]i during prolonged in vitro maintenance was significantly different in young and old slices. This process is an indicator of an increased vulnerability of aged neurons. Although no reports are available assessing the cerebellar neurons directly, various reports indicate an increased neuronal vulnerability with age (Shetty and Turner, 1999;Joseph et al., 2000). The increase in resting [Ca2+]i in aged neurons as a function of time in vitro might also explain the scattering of results reported in previous studies: increased (Kirischuk and Verkhratsky, 1996), decreased (Hartmann et al., 1996b), or unchanged (Campbell et al., 1998; Murchison and Griffith, 1998) resting [Ca2+]i.
Aging also determines, in cerebellar neurons, changes in the behavior of the [Ca2+]iresponse to neuronal stimulation. In the aged neurons with a stable resting [Ca2+]i, only 50% responded with a simple monophasic [Ca2+]i increase resembling that recorded in younger neurons. The remaining neurons, regardless of their ability to produce a Ca2+ signal, showed a clear delayed Ca2+ dysregulation, which is an additional indication of their increased vulnerability. This vulnerability is unlikely to be the result of an increased Ca2+ load, because the amplitude of the [Ca2+]i response and the rate of the [Ca2+]i increase was not different in the young and aged neurons. This latter point is also important in the context of the debate about the age-related changes in Ca2+-channel activity (Thibault et al., 1998; Verkhratsky and Toescu, 1998). In hippocampal neurons, aging leads to a substantial increase in L-type Ca2+-channel density (Thibault et al., 1998). In basal forebrain neurons, aging does not significantly affect the density of L-type channels but does increase the number of T-type channels (Murchison and Griffith, 1996). In peripheral neurons, both the T- and L-type channels are reduced significantly (Kostyuk et al., 1993). In the present experiments, in conditions in which the Ca2+ channels are expected to be a main component in generating the KCl-evoked [Ca2+]i signal, the similarities of the upstroke phase of the Ca2+ response between young and old neurons indicate no significant changes in Ca2+-channel activity in aged cerebellar granule neurons. However, no electrophysiological studies of the cerebellar neurons during aging are available to date.
Another important difference between the two ages is the significant slowing down of the recovery of [Ca2+]i levels in the aged neurons after stimulation. This feature of Ca2+ homeostasis in old neurons has been reported in previous studies and represents in fact one of the few constants in the field (Verkhratsky and Toescu, 1998). A delay in the recovery of resting [Ca2+]i after stimulation could be attributable to an alteration of one of the Ca2+ extrusion systems. In non-neuronal tissues, an age-dependent decrease in the expression of the gene coding for one sarco/endoplasmic reticulum (ER) Ca2+-ATPase (SERCA) subtype has been reported previously (Maciel et al., 1990); in peripheral neurons, a decrease in the activity of either SERCA (Pottorf et al., 2000) or plasma membrane Ca2+-ATPase (PMCA) (Michaelis et al., 1996) was demonstrated that was linked, directly or indirectly, with alterations in the calmodulin-dependent activation step. In central neurons, direct measurements of the caffeine-sensitive Ca2+ pools showed that aging results in a decrease in the ER Ca2+ pools (Verkhratsky et al., 1994).
Mitochondrial dysfunction in aged neurons
Another factor that might account for the delayed [Ca2+]i recovery is the metabolic and energetic status of the aged neurons. Removal of Ca2+ from the cytosol is a process that is dependent on ATP supply, either directly, through the activities of the SERCA and PMCA, or indirectly, because Ca2+ extrusion through the Na+/Ca2+exchanger depends on the Na+ gradient established by the Na+/K+ATPase. Neurons can generate ATP through both cytosolic glycolysis and mitochondrial oxidative phosphorylation (Nicholls and Budd, 2000). The present results indicate a degree of mitochondrial dysfunction in aged neurons. When loaded under identical conditions, the aged neurons showed a significantly lower rhodamine-123 uptake, indicative of a depolarized status (Toescu and Verkhratsky, 2000). More importantly, the mitochondrial repolarization after the removal of stimulation in these aged neurons was delayed. The initial depolarization of mitochondria that follows the starting of the [Ca2+]i signal has been described previously (Duchen, 1999); it is determined by the mitochondrial Ca2+ uptake (Peng et al., 1998). The lag period observed is indicative of the time taken by the [Ca2+]i to reach threshold levels for the activation of the mitochondrial Ca2+ uniporter (Gunter et al., 2000). The recovery of the mitochondrial membrane potential, as monitored by the return of rhodamine-123 fluorescence levels to prestimulus values, is not the result of pumping out the accumulated mitochondrial Ca2+, because mitochondria can maintain the accumulated Ca2+ for long periods (Vergun et al., 1999). Also, the starting time point of repolarization, which is variable from neuron to neuron, can precede the starting of the [Ca2+]irecovery (data not shown) (Duchen, 1999) and is not associated with an additional increase in [Ca2+]i. Instead, the repolarization is most likely attributable to a Ca2+-dependent activation of the respiratory chain, resulting in an increase in the rate of H+ pumping out of the mitochondrial matrix and increased ATP production (McCormack and Denton, 1994). Thus, the significant decrease in aged neurons in the rate of mitochondrial repolarization points to a defective coupling between Ca2+ and mitochondrial metabolism that might result in a decrease in the capacity of mitochondria from aged neurons to provide sufficient ATP to meet the excessive energetic demands associated with stimulation. This metabolic insufficiency might also provide an additional mechanism to account for the recent data reporting an impairment of the postsynaptic Ca2+ homeostasis that is expressed only during suprathreshold stimulation, and even then, only during the late stages of a train stimulation (Thibault et al., 2001).
Mitochondrial dysfunctions may be an important underlying process in aging (Ames et al., 1995); evidence indicates that several aspects of mitochondrial metabolism are affected in an age-dependent manner. In the brain, the activity of the complex III of the respiratory chain, considered crucial for the activity of the entire oxidative phosphorylation system, was significantly decreased in old mice (Kwong and Sohal, 2000); measurements in hepatocytes showed a marked degree of age-related decline of the average mitochondrial membrane potential (Hagen et al., 1997). The observations presented here tell a similar story, but future experiments are required to determine whether the changes observed in aged neurons are attributable to mitochondrial DNA lesions/mutations (Cortopasi and Wong, 1999) or to other structural or functional changes (Toescu et al., 2000).
Conclusions
In conclusion, the most important finding reported here is that the age-dependent changes in Ca2+homeostasis, which are manifested primarily as a decrease in the capacity of the neurons to recover resting [Ca2+]i after intense stimulation, are associated and most likely attributable to significant alterations in the metabolic status of the mitochondria that result in delays in the depolarization–repolarization cycle of the mitochondrial membrane potential.
Footnotes
This work was supported by the Biotechnology and Biological Sciences Research Council through the Science of Aging Initiative.
Correspondence should be addressed to Dr. E. C. Toescu, Department of Physiology, Division of Medical Sciences, University of Birmingham, Edgbaston, B15 2TT, UK. E-mail: e.c.toescu@bham.ac.uk.
REFERENCES
- 1.Ames BN, Shigenaga MK, Hagen TM. Mitochondrial decay in aging. Biochim Biophys Acta. 1995;1271:165–170. doi: 10.1016/0925-4439(95)00024-x. [DOI] [PubMed] [Google Scholar]
- 2.Barnes CA. Normal aging: regionally specific changes in hippocampal synaptic transmission. Trends Neurosci. 1994;17:13–18. doi: 10.1016/0166-2236(94)90029-9. [DOI] [PubMed] [Google Scholar]
- 3.Campbell VA, Segurado R, Lynch MA. Regulation of intracellular Ca2+ concentration by interleukin-1β in rat cortical synaptosomes: an age-related study. Neurobiol Aging. 1998;19:575–579. doi: 10.1016/s0197-4580(98)00097-9. [DOI] [PubMed] [Google Scholar]
- 4.Cortopasi G, Wong A. Mitochondria in organismal aging and degeneration. Biochim Biophys Acta. 1999;1410:183–193. doi: 10.1016/s0005-2728(98)00166-2. [DOI] [PubMed] [Google Scholar]
- 5.Duchen M. Contributions of mitochondria to animal physiology: from homeostatic sensor to calcium signalling and cell death. J Physiol (Lond) 1999;516:1–17. doi: 10.1111/j.1469-7793.1999.001aa.x. [DOI] [PMC free article] [PubMed] [Google Scholar]
- 6.Duchen MR. Mitochondria and Ca2+ in cell physiology and pathophysiology. Cell Calcium. 2000;28:339–348. doi: 10.1054/ceca.2000.0170. [DOI] [PubMed] [Google Scholar]
- 7.Duckles SP, Tsai H, Buchholz JN. Evidence for decline in intracellular calcium buffering in adrenergic nerves of aged rats. Life Sci. 1996;58:2029–2035. doi: 10.1016/0024-3205(96)00194-4. [DOI] [PubMed] [Google Scholar]
- 8.Friel DD. Mitochondria as regulators of stimulus-evoked calcium signals in neurons. Cell Calcium. 2000;28:307–316. doi: 10.1054/ceca.2000.0172. [DOI] [PubMed] [Google Scholar]
- 9.Gazzaley AH, Siegel SJ, Kordower JH, Mufson EJ, Morrison JH. Circuit-specific alterations of N-methyl-d-aspartate receptor subunit 1 in the dentate gyrus of aged monkeys. Proc Natl Acad Sci USA. 1996;93:3121–3125. doi: 10.1073/pnas.93.7.3121. [DOI] [PMC free article] [PubMed] [Google Scholar]
- 10.Grynkiewicz G, Poenie M, Tsien RY. A new generation of Ca2+ indicators with greatly improved fluorescence properties. J Biol Chem. 1985;260:3440–3450. [PubMed] [Google Scholar]
- 11.Gunter T, Buntinas L, Sparagna G, Eliseev R, Gunter K. Mitochondrial calcium transport: mechanisms and functions. Cell Calcium. 2000;28:285–296. doi: 10.1054/ceca.2000.0168. [DOI] [PubMed] [Google Scholar]
- 12.Hagen T, Yowe D, Bartholomew J, Wehr C, Do K, Park J, Ames B. Mitochondrial decay in hepatocytes from old rats: membrane potential declines, heterogeneity, and oxidants increase. Proc Natl Acad Sci USA. 1997;94:3064–3069. doi: 10.1073/pnas.94.7.3064. [DOI] [PMC free article] [PubMed] [Google Scholar]
- 13.Hartmann H, Eckert A, Velbinger K, Rewsin M, Muller W. Down-regulation of free intracellular calcium in dissociated brain cells of aged mice and rats. Life Sci. 1996a;59:435–450. doi: 10.1016/0024-3205(96)00323-2. [DOI] [PubMed] [Google Scholar]
- 14.Hartmann H, Velbinger K, Eckert A, Muller W. Region-specific downregulation of free intracellular calcium in aged rat brain. Neurobiol Aging. 1996b;17:557–563. doi: 10.1016/0197-4580(96)84400-9. [DOI] [PubMed] [Google Scholar]
- 15.Joseph JA, Denisova NA, Bielinski D, Fisher DR, Shukitt-Hale B. Oxidative stress protection and vulnerability in aging: putative nutritional implications for intervention. Mech Aging Dev. 2000;116:141–153. doi: 10.1016/s0047-6374(00)00128-7. [DOI] [PubMed] [Google Scholar]
- 16.Khachaturian ZS. Calcium hypothesis of Alzheimer's disease and brain aging. Ann NY Acad Sci. 1994;747:1–11. doi: 10.1111/j.1749-6632.1994.tb44398.x. [DOI] [PubMed] [Google Scholar]
- 17.Kirischuk S, Verkhratsky A. Calcium homeostasis in aged neurons. Life Sci. 1996;59:451–459. doi: 10.1016/0024-3205(96)00324-4. [DOI] [PubMed] [Google Scholar]
- 18.Kostyuk P, Pronchuk N, Savchenko A, Verkhratsky A. Calcium currents in aged rat dorsal root ganglion neurons. J Physiol (Lond) 1993;461:467–483. doi: 10.1113/jphysiol.1993.sp019523. [DOI] [PMC free article] [PubMed] [Google Scholar]
- 19.Kwong L, Sohal R. Age-related changes in activities of mitochondrial electron transport complexes in various tissues of the mouse. Arch Biochem Biophys. 2000;373:16–22. doi: 10.1006/abbi.1999.1495. [DOI] [PubMed] [Google Scholar]
- 20.Lenaz G. Role of mitochondria in oxidative stress and ageing. Biochim Biophys Acta. 1998;1366:53–67. doi: 10.1016/s0005-2728(98)00120-0. [DOI] [PubMed] [Google Scholar]
- 21.Maciel LM, Polikar R, Rohrer D, Popovich BK, Dillmann WH. Age-induced decreases in the messenger RNA coding for the sarcoplasmic reticulum Ca2+-ATPase of the rat heart. Circ Res. 1990;67:230–234. doi: 10.1161/01.res.67.1.230. [DOI] [PubMed] [Google Scholar]
- 22.Martinez Serrano A, Blanco P, Satrustegui J. Calcium binding to the cytosol and calcium extrusion mechanisms in intact synaptosomes and their alterations with aging. J Biol Chem. 1992;267:4672–4679. [PubMed] [Google Scholar]
- 23.Mattson MP, LaFerla FM, Chan SL, Leissring MA, Shepel PN, Geiger JD. Calcium signaling in the ER: its role in neuronal plasticity and neurodegenerative disorders. Trends Neurosci. 2000;23:222–229. doi: 10.1016/s0166-2236(00)01548-4. [DOI] [PubMed] [Google Scholar]
- 24.McCormack J, Denton R. Signal transduction by intramitochondrial Ca2+ in mammalian energy metabolism. News Physiol Sci. 1994;9:71–76. [Google Scholar]
- 25.Michaelis M, Bigelow D, Sconeich C, Williams T, Ramonada L, Yin D, Huhmer A, Yao Y, Gao J, Squier T. Decreased plasma membrane calcium transport activity in aging brain. Life Sci. 1996;59:405–412. doi: 10.1016/0024-3205(96)00319-0. [DOI] [PubMed] [Google Scholar]
- 26.Moyer JR, Brown TH. Methods for whole-cell recording from visually preselected neurons of perirhinal cortex in brain slices from young and aging rats. J Neurosci Methods. 1998;86:35–54. doi: 10.1016/s0165-0270(98)00143-5. [DOI] [PubMed] [Google Scholar]
- 27.Murchison D, Griffith WH. High-voltage-activated calcium currents in basal forebrain neurons during aging. J Neurophysiol. 1996;76:158–174. doi: 10.1152/jn.1996.76.1.158. [DOI] [PubMed] [Google Scholar]
- 28.Murchison D, Griffith W. Increased calcium buffering in basal forebrain neurons during aging. J Neurophysiol. 1998;80:350–364. doi: 10.1152/jn.1998.80.1.350. [DOI] [PubMed] [Google Scholar]
- 29.Nicholls D, Budd S. Mitochondria and neuronal survival. Physiol Rev. 2000;80:315–360. doi: 10.1152/physrev.2000.80.1.315. [DOI] [PubMed] [Google Scholar]
- 30.Nicholls D, Ward M. Mitochondrial membrane potential and neuronal glutamate excitotoxicity: mortality and millivolts. Trends Neurosci. 2000;23:166–174. doi: 10.1016/s0166-2236(99)01534-9. [DOI] [PubMed] [Google Scholar]
- 31.Peng T, Jou M, Sheu S, Greenamyre J. Visualization of NMDA receptor-induced mitochondrial calcium accumulation in striatal neurons. Exp Neurol. 1998;149:1–12. doi: 10.1006/exnr.1997.6599. [DOI] [PubMed] [Google Scholar]
- 32.Pottorf WJ, Duckles SP, Buchholz JN. SERCA function declines with age in adrenergic nerves from the superior cervical ganglion. J Autonom Pharmacol. 2000;20:281–290. doi: 10.1046/j.1365-2680.2000.00194.x. [DOI] [PubMed] [Google Scholar]
- 33.Shetty AK, Turner DA. Vulnerability of the dentate gyrus to aging and intracerebroventricular administration of kainic acid. Exp Neurol. 1999;158:491–503. doi: 10.1006/exnr.1999.7107. [DOI] [PubMed] [Google Scholar]
- 34.Stout AK, Raphael HM, Kanterewicz BI, Klann E, Reynolds IJ. Glutamate-induced neuron death requires mitochondrial calcium uptake. Nat Neurosci. 1998;1:366–373. doi: 10.1038/1577. [DOI] [PubMed] [Google Scholar]
- 35.Territo PR, Mootha VK, French SA, Balaban RS. Ca2+ activation of heart mitochondrial oxidative phosphorylation: role of the F0/F1-ATPase. Am J Physiol. 2000;278:C423–C435. doi: 10.1152/ajpcell.2000.278.2.C423. [DOI] [PubMed] [Google Scholar]
- 36.Thibault O, Porter N, Chen K, Blalock E, Kaminker P, Clodfelter G, Brewer L, Landfield P. Calcium dysregulation in neuronal aging and Alzheimer's disease: history and new directions. Cell Calcium. 1998;24:417–433. doi: 10.1016/s0143-4160(98)90064-1. [DOI] [PubMed] [Google Scholar]
- 37.Thibault O, Hadley R, Landfield PW. Elevated postsynaptic [Ca2+]i and L-type calcium channel activity in aged hippocampal neurons: relationship to impaired synaptic plasticity. J Neurosci. 2001;21:9744–9756. doi: 10.1523/JNEUROSCI.21-24-09744.2001. [DOI] [PMC free article] [PubMed] [Google Scholar]
- 38.Tinel H, Cancela J, Mogami H, Gerasimenko J, Gerasimenko O, Tepikin A, Petersen O. Active mitochondria surrounding the pancreatic acinar granule region prevent spreading of inositol trisphosphate-evoked cytosolic Ca2+ signals. EMBO J. 1999;18:4999–5008. doi: 10.1093/emboj/18.18.4999. [DOI] [PMC free article] [PubMed] [Google Scholar]
- 39.Toescu E. Apoptosis and cell death in neuronal cells: where does Ca2+ fit in? Cell Calcium. 1998;24:387–403. doi: 10.1016/s0143-4160(98)90062-8. [DOI] [PubMed] [Google Scholar]
- 40.Toescu E, Verkhratsky A. Assessment of mitochondrial polarization status in living cells based on analysis of the spatial heterogeneity of rhodamine 123 fluorescence staining. Pflügers Arch. 2000;440:941–947. doi: 10.1007/s004240000390. [DOI] [PubMed] [Google Scholar]
- 41.Toescu EC, Myronova N, Verkhratsky A. Age-related structural and functional changes of brain mitochondria. Cell Calcium. 2000;28:329–338. doi: 10.1054/ceca.2000.0167. [DOI] [PubMed] [Google Scholar]
- 42.Vergun O, Keelan J, Khodorov BI, Duchen MR. Glutamate-induced mitochondrial depolarisation and perturbation of calcium homeostasis in cultured rat hippocampal neurons. J Physiol (Lond) 1999;519:451–466. doi: 10.1111/j.1469-7793.1999.0451m.x. [DOI] [PMC free article] [PubMed] [Google Scholar]
- 43.Verkhratsky A, Toescu E. Calcium and neuronal aging. Trends Neurosci. 1998;21:2–7. doi: 10.1016/s0166-2236(97)01156-9. [DOI] [PubMed] [Google Scholar]
- 44.Verkhratsky A, Shmigol A, Kirischuk S, Pronchuk N, Kostyuk P. Age-dependent changes in calcium currents and calcium homeostasis in mammalian neurons. Ann. NY Acad Sci. 1994;747:365–381. doi: 10.1111/j.1749-6632.1994.tb44423.x. [DOI] [PubMed] [Google Scholar]
- 45.Zyzak DR, Otto T, Eichenbaum H, Gallagher M. Cognitive decline associated with normal aging in rats: a neuropsychological approach. Learn Mem. 1995;2:1–16. doi: 10.1101/lm.2.1.1. [DOI] [PubMed] [Google Scholar]