

Abstract
In the retina, AII (rod) amacrine cells are essential for integrating rod signals into the cone pathway. In addition to being interconnected via homologous gap junctions, these cells make extensive heterologous gap junctions with ON-cone bipolar cells (BCs). These gap junctions are the pathway for transfer of rod signals to the ON-system. To investigate the functional properties of these gap junctions, we performed simultaneous whole-cell recordings from pairs of AII amacrine cells and ON-cone bipolar cells in the in vitro slice preparation of the rat retina. We demonstrate strong electrical coupling with symmetrical junction conductance (∼1.2 nS) and very low steady-state voltage sensitivity. However, signal transmission is more effective in the direction from AII amacrine cells to ON-cone bipolar cells than in the other direction. This functional rectification can be explained by a corresponding difference in membrane input resistance between the two cell types. Signal transmission has low-pass filter characteristics with increasing attenuation and phase shift for increasing stimulus frequency. Action potentials in AII amacrine cells evoke distinct electrical postsynaptic potentials in ON-cone bipolar cells. Strong and temporally precise synchronization of subthreshold membrane potential fluctuations are commonly observed.
Keywords: gap junctions, electrical synapses, rod pathway, AII amacrine cells, bipolar cells, retina, synaptic transmission
Networks of inhibitory interneurons in several regions of the CNS are extensively interconnected by electrical synapses. The major structural elements of these synapses are gap junctions, specialized intercellular contacts formed by a family of transmembrane proteins termed connexins (Kumar and Gilula, 1996). Most of the electrical synapses are formed by gap junctions between neurons of the same type (homologous gap junctions). In contrast, heterologous coupling might be relatively rare (Galarreta and Hestrin, 2001). The retina provides striking examples of populations of neurons that make both homologous and heterologous gap junctions, such as AII (rod) amacrine cells. AII amacrine cells are essential for integrating rod signals into the cone pathway and are interconnected by gap junctions (Kolb and Famiglietti, 1974), thereby forming a network of electrically coupled neurons (Veruki and Hartveit, 2002). In addition to these homologous gap junctions, AII amacrine cells make extensive heterologous gap junctions with ON-cone bipolar cells (BCs) (Kolb and Famiglietti, 1974; McGuire et al., 1984; Strettoi et al., 1992, 1994; Chun et al., 1993). These connections are the pathway through which rod signals are conveyed to the ON-system. There is strong evidence that the neuron-specific connexin36 is expressed by AII amacrine cells and is the subunit of the homologous gap junctions (Feigenspan et al., 2001; Mills et al., 2001). Importantly, the heterologous gap junctions made with ON-cone bipolar cells are thought to be heterotypic, because ON-cone bipolar cells do not seem to express connexin36 (Feigenspan et al., 2001; Mills et al., 2001). Although the electrical synapses between AII amacrine cells were analyzed recently in detail (Veruki and Hartveit, 2002), little is known about the functional characteristics and precise role of electrical synapses between AII amacrine cells and ON-cone bipolar cells. For example, is the electrical junction conductance large enough that action potentials in AII amacrine cells can be transmitted to bipolar cells? Are the synapses symmetrical or is there evidence for rectification? What are the consequences of the difference in cell size and membrane input resistance between AII amacrine cells and bipolar cells? To which extent will the electrical synapses synchronize the membrane potentials between AII amacrine cells and bipolar cells? As a first step toward unraveling the operational characteristics of this microcircuit, we have performed simultaneous dual recordings from pairs of such cells in an in vitro slice preparation of the rat retina. We demonstrate strong, bidirectional electrical coupling between AII amacrine cells and ON-cone bipolar cells with identical conductances for each direction of coupling. However, the coupling coefficient for transmission from AII amacrine cells to ON-cone bipolar cells is considerably larger than for transmission in the other direction. This functional rectification can be explained by a corresponding difference in membrane input resistance between the two types of cells. We also demonstrate that action potentials in AII amacrine cells evoke discrete electrical postsynaptic potentials (PSPs) in ON-cone bipolar cells. Finally, the strong electrical coupling acts to tightly synchronize both oscillatory and non-oscillatory subthreshold membrane potential fluctuations between AII amacrine cells and ON-cone bipolar cells.
MATERIALS AND METHODS
Albino rats (4–7 weeks postnatal) were deeply anesthetized with halothane in oxygen and killed by cervical dislocation (procedure approved under the surveillance of the Norwegian Animal Research Authority). Detailed accounts of the methods, including preparation of retinal slices, have been published previously (Hartveit, 1997; Veruki and Hartveit, 2002). Anesthesia, dissection, and preparation of slices were done under normal room illumination. During recording, the room lights were dimmed moderately for the purpose of observing monitor displays better. Thus, we consider the slices to be light adapted.
The extracellular perfusing solution was bubbled continuously with 95% O2–5% CO2 and had the following composition (in mm): 125 NaCl, 25 NaHCO3, 2.5 KCl, 2.5 CaCl2, 1 MgCl2, 10 glucose, pH 7.4 (20–24°C). In relaxation experiments with measurement of the steady-state voltage sensitivity of the electrical junction conductance, the extracellular solution contained 2.5 mm Co2+(replacing an equimolar concentration of Ca2+) and 300 nm TTX to block voltage-gated membrane currents. TTX was also added in experiments with application of sinusoidal stimuli to study frequency dependence of electrical coupling. The recording pipettes (4–6 MΩ for amacrine cells; 6–9 MΩ for bipolar cells) were filled with a solution containing (in mm): 140 K-gluconate, 5 HEPES, 1 CaCl2, 1 MgCl2, 5 EGTA, 4 Na2ATP, 0.5 GTP. In relaxation experiments (see above), the recording pipette solution contained (in mm): 125 CsCl, 4 NaCl, 5 HEPES, 1 CaCl2, 1 MgCl2, 5 EGTA, 15 tetraethylammonium chloride, 4 Na2ATP, 0.5 GTP. For both intracellular solutions, Lucifer yellow was added (1 mg/ml), and pH was adjusted to 7.3 with KOH or CsOH. The holding potentials were corrected on-line for liquid junction potentials.
Antagonists of chemical synaptic transmission were added directly to the external solution. The concentrations of the drugs were as follows (in μm): 30 3-((RS)-2-carboxypiperazin-4-yl)-propyl-1-phosphonic acid (Tocris Cookson, Bristol, UK), 10 6-cyano-7-nitroquinoxaline-2,3-dione (Tocris Cookson), 10 bicuculline methchloride (Tocris Cookson), 500 picrotoxin (Sigma-Aldrich, St. Louis, MO), 1 strychnine (Research Biochemicals, Natick, MA).
Dual whole-cell recordings were made with an EPC9/2 amplifier (HEKA Elektronik, Lambrecht, Germany). The fast current-clamp feedback circuitry of the EPC9/2 was used in all current-clamp recordings. For some voltage-clamp experiments, the digital-analog converter-stimulus template corresponded to the digitization of a previously recorded action potential (Veruki and Hartveit, 2002). The series resistance in both cells was regularly monitored by applying a series of 10 mV hyperpolarizing voltage pulses. The average series resistance was 16 ± 1 (SEM) MΩ for amacrine cells (n = 18) and 17 ± 2 MΩ for bipolar cells (n = 18). Cells with series resistance >40 MΩ were excluded from analysis.
Data analysis was performed with PulseFit (HEKA Elektronik), Igor Pro (WaveMetrics, Lake Oswego, OR), AxoGraph (Axon Instruments, Union City, CA), and DataView (Dr. W. J. Heitler, University of St. Andrews, UK). To calculate the electrical junction conductance (Gj), we assumed an equivalent-circuit model and corrected for errors introduced by non-zero series resistance and finite membrane resistance (Veruki and Hartveit, 2002). In relaxation experiments with measurement of the steady-state voltage sensitivity of the electrical junction conductance, the voltage steps (applied to the presynaptic cell) were 10 sec in duration from a holding potential of −50 mV to voltages between −120 and +10 mV (10 mV steps). Larger Vj steps could not be performed because they compromised the integrity of the cells. The time course of postsynaptic current traces was estimated by curve fitting with a monoexponential function,I(t) = Aexp(−t/τ) +Iss, where I(t) is the current as a function of time, τ is the time constant,Iss is the steady-state current amplitude, and the instantaneous current at time 0 (I0) is equal to the sum ofA and Iss. The steady-state junctional conductance at each Vj was normalized to the instantaneous conductance at the same voltage, and the resulting Gj,ss values (calculated asIss/I0) were plotted as a function of Vj.
Normalized cross-correlograms of continuous membrane potential recordings were calculated as the correlation of the two records divided by the number of points and the SD of each voltage record. Accordingly, the cross-correlation amplitude can vary between +1 and −1 and depends only on the degree of synchrony between the voltage records and not on their absolute amplitude. Sliding, color-coded two-dimensional (2D) cross-correlograms of pairs of voltage records of duration T seconds were calculated from consecutive pairs of data segments, each of 500 msec duration, and shifted 100 msec forward in time relative to the previous segment. Each segment was mean-subtracted before calculating the cross-correlation, which is therefore mathematically equivalent to the cross-covariance. A matrix was then constructed in which consecutive 1D cross-correlation functions constitute consecutive columns with time running along thex-axis and the time lag of the correlation function running along the y-axis. The normalized correlation amplitude was coded by color. The time-averaged cross-correlogram was calculated as the average of each row of the 2D cross-correlogram. All cross-correlograms were calculated with the bipolar cell as the nonreference cell and the AII amacrine cell as the reference cell.
Statistical analyses were performed with Student's two-tailedt tests, with a level of significance of p< 0.05 (unpaired, unless otherwise stated). Data are presented as means ± SEM (n = number of cells or cell pairs).
RESULTS
Identification of AII amacrine and ON-cone bipolar cells in retinal slices
All recordings were aimed at pairs of AII amacrine cells and presumed ON-cone bipolar cells in rat retinal slices (Fig.1). Although AII amacrine cells constitute a homogeneous population of cells (Wässle et al., 1993), ON-cone bipolar cells are a heterogeneous group encompassing four to five cell types (Euler et al., 1996; Hartveit, 1997). Although it is not possible to target ON-cone bipolar cells for recording with absolute confidence, the cell bodies of these cells tend to be located distally in the inner nuclear layer but proximally to the cell bodies of the rod bipolar cells (Euler and Wässle, 1995). All cells were filled with Lucifer yellow, and at the end of each recording, fluorescence microscopy allowed visualization of both cells (Fig. 1,bottom). Cells were classified by direct, visual observation of fluorescent images at the microscope. In this way it was possible to visually trace and identify the processes belonging to each cell. In some cases, it was necessary to withdraw the pipette from the AII amacrine cell. This led to a rapid leakage of Lucifer yellow and strongly reduced the staining of this cell, such that the bipolar cell could be observed in isolation and then classified properly. In addition, each cell pair was carefully drawn by hand, and some cell pairs were photographed at a series of focal planes (Hartveit, 1997). For AII amacrine cells, the morphological characteristics included lobular appendages and arboreal dendrites. For bipolar cells, they included a dendrite ascending to the outer plexiform layer and an axon descending to the inner plexiform layer with a branching pattern and stratification level of the axon terminal system specific for each type. ON-cone bipolar cells were identified as having axons stratifying in stratum 3 (S3), S4, or S5 of the inner plexiform layer and were classified according to the following criteria (Euler and Wässle, 1995; Hartveit, 1997). Type 5 and 6 cells have narrowly stratifying axon terminals located directly distal (type 5) or directly proximal (type 6) to the inner cholinergic band, which can be visualized regularly as an optically dense band with differential interference contrast optics (Euler and Wässle, 1995). Type 7 cells have a more diffusely stratifying axon terminal, centered at the same level as the axon terminal of type 6 cells (approximately at the border between S3 and S4). Type 8 cells have an axon terminal that branches proximally in S4 and descends into S5. We did not record from type 9 cone bipolar cells. OFF-cone bipolar cells were identified as having axon terminals stratifying in S1 or S2 of the inner plexiform layer. Rod bipolar cells were identified by one or two larger swellings at the axon terminal in S5.
Fig. 1.
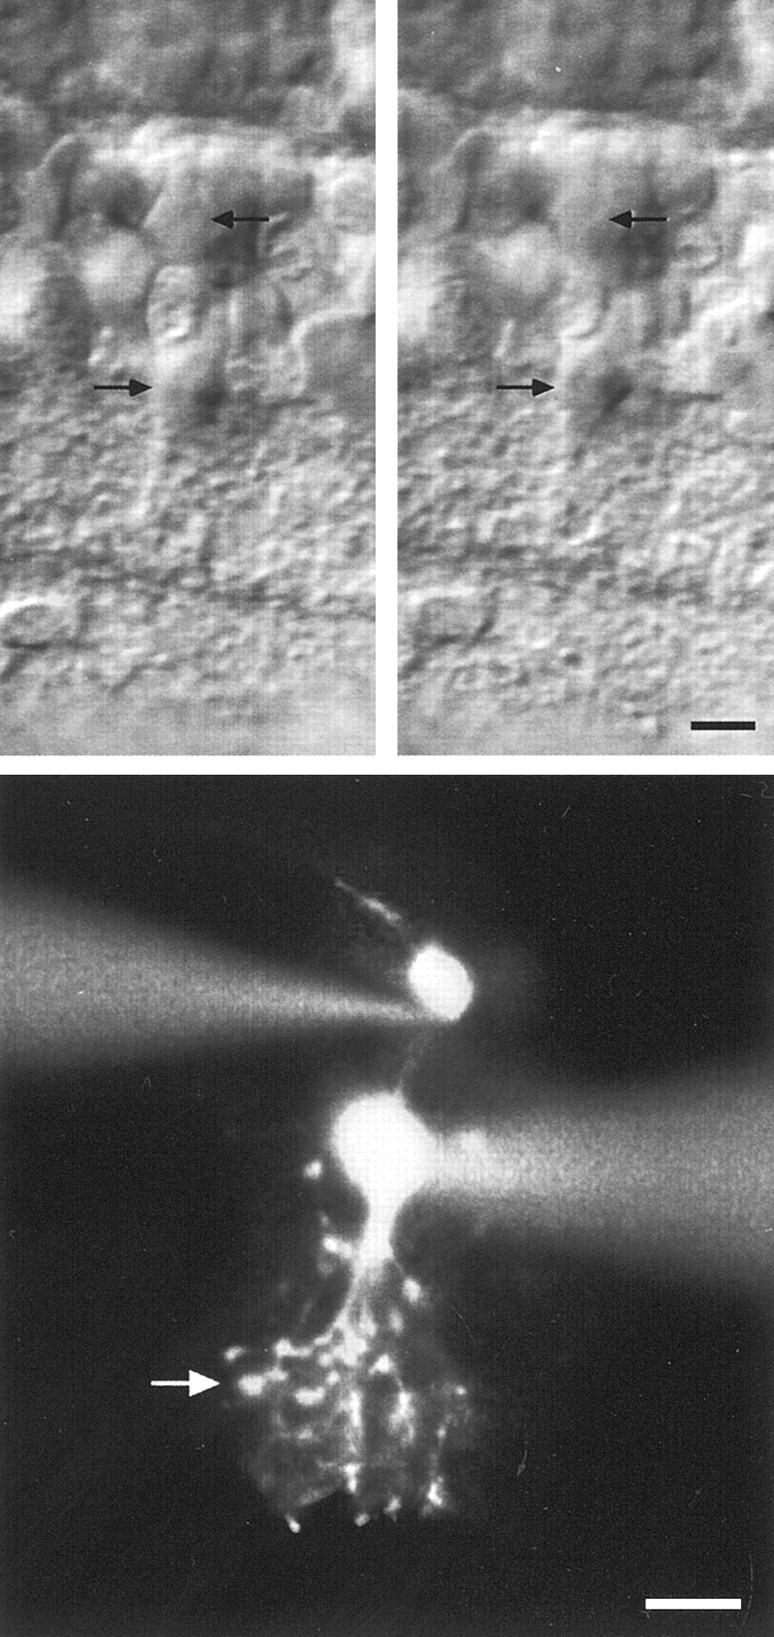
Visualization of simultaneously recorded AII amacrine cells and ON-cone bipolar cells. Top two panels, An AII amacrine cell (bottom arrows) and a type 7 ON-cone bipolar cell (top arrows) in anin vitro slice from rat retina, visualized with infra-red differential interference contrast videomicroscopy. In theleftpanel, the ON-cone bipolar cell is in focus; in the rightpanel, the AII amacrine cell is in focus. Bottom, Composite fluorescence photomicrograph of same cell pair after filling with Lucifer yellow. The level of stratification of the axon terminal of the ON-cone bipolar cell is indicated by an arrow. Scale bars, 10 μm.
Electrical coupling of AII amacrine cells and ON-cone bipolar cells
With a pair of cells in whole-cell voltage clamp, we tested for electrical coupling by applying voltage commands to one cell and recording the current responses in both cells. A cell is referred to as presynaptic when it is the cell in which an experimental manipulation is initiated and as postsynaptic when it responds to a membrane potential change in the presynaptic cell (Nolan et al., 1999). Application of a hyperpolarizing voltage step evoked an inward current in the presynaptic cell, and when cells were electrically coupled it also evoked an outward current in the postsynaptic cell (Fig.2A,B). Application of a depolarizing voltage step evoked an outward current in the presynaptic cell and an inward current in the postsynaptic cell (Fig. 2A,B). Recordings were performed in the presence of antagonists of chemical neurotransmitters to isolate the effects of electrical coupling from chemical synaptic transmission (see Materials and Methods). In addition, where appropriate, experiments were repeated in control solution without antagonists to verify that the results obtained did not depend on blocked chemical synaptic transmission as such. For all cell pairs, the electrical coupling was reciprocal.
Fig. 2.

Junction conductance of electrical synapses between AII amacrine cells and ON-cone bipolar cells. A, With a cell pair in voltage clamp (Vh = −60 mV), 300 msec voltage pulses (V) of −20, −10, and +15 mV are applied to the AII amacrine cell while current responses are recorded from both cells (IAII andIBC). Hyperpolarizing pulses applied to the AII amacrine cell result in inward currents in this cell and outward currents in the bipolar cell (type 7). A depolarizing pulse in the AII amacrine cell results in an outward current in this cell and an inward current in the bipolar cell. Here and in subsequent figures, the recording configuration is drawn with the AII amacrine cell on theleft and the ON-cone bipolar cell on theright. B, Same as in A, but voltage pulses are applied to the bipolar cell (V). C, Current–voltage relationship for the junctional current (Ij) versus the junctional voltage (Vj) for cell pair inA and B; voltage pulses (from −20 to +20 mV, 5 mV increments) applied to AII amacrine cell (as inA). The data points have been fit with a straight line (slope = Gj). D,Same as in C, but voltage pulses applied to bipolar cell (as in B). E, Comparison ofGj in each direction indicates nonrectifying electrical coupling [Gj (BC→ AII) for bipolar cell presynaptic;Gj (AII→ BC) for AII amacrine cell presynaptic]. The dashed line has a slope of 1 [Gj (BC→AII) = Gj (AII→ BC)]. F, Relaxation experiments to determine steady-state voltage sensitivity of electrical junction conductance between two coupled cells. Experimental paradigm as in A and B, but presynaptic voltage pulses are 10 sec in duration (−60 to +60 mV, 10 mV increments).Traces illustrate postsynaptic current responses (IAII) with voltage pulses applied to the bipolar cell (left, type 8) and postsynaptic current responses (IBC) with voltage pulses applied to the AII amacrine cell (right). Note that for larger amplitude voltage pulses, there is slight decay of postsynaptic currents toward a (non-zero) steady-state level. Dashed lines indicate baseline current. G, Plot of steady-state junctional conductance (Gj,ss) as a function ofVj. Gj,ss at eachVj is plotted as mean ± SEM. Data points are normalized to the instantaneous value at eachVj. Data for each direction of coupling are plotted separately, with either an AII amacrine cell (○) or a bipolar cell (●) postsynaptic.
A total of 31 AII amacrine–ON-cone bipolar cell pairs displayed electrical coupling as described above. After fluorescence microscopy and visualization with Lucifer yellow, all cell pairs were observed to be in potential physical contact with each other as judged by overlap between the arboreal dendrites of the AII amacrine cell and the arborization of the axon terminal of the ON-cone bipolar cell. The ON-cone bipolar cells were classified (Euler and Wässle, 1995) as type 5 (n = 3), type 6 (n = 3), type 7 (n = 15), and type 8 (n = 7). We also recorded two coupled pairs in which the bipolar cell was either a type 5 or 6 and one coupled pair in which the bipolar cell could not be visualized adequately. Two AII amacrine–ON-cone bipolar cell pairs did not display electrical coupling and subsequently, after visualization, were found to have nonoverlapping processes. We also recorded from cell pairs in which only one member of the pair was either an AII amacrine cell or an ON-cone bipolar cell. Electrical coupling was never observed between such cells.
Electrical junction conductance
With both cells in voltage clamp, we estimated the junction conductance (Gj) by applying a series of voltage commands to the presynaptic cell and recording the evoked currents in both the presynaptic and the postsynaptic cell (Fig.2A,B). The junction current (Ij) versus junction voltage (Vj) relationship, corrected for non-zero series resistance and finite membrane input resistance, was linear (Fig. 2C,D), indicating thatGj was independent ofVj over the range of voltages (±20 mV) and pulse durations (500 msec) tested. Accordingly,Gj was measured as the slope of a straight line fitted to the I–V relation [1362 pS (Fig. 2C); 1399 pS (Fig. 2D)]. The junctional conductance was very similar for both directions of coupling (Fig. 2E). The meanGj was 1203 ± 158 pS for coupling from AII amacrine cells to ON-cone bipolar cells (n = 18 cell pairs; range, 102–3353 pS) and 1206 ± 148 pS for coupling from ON-cone bipolar cells to AII amacrine cells (range, 109–3124 pS). When the cell pairs were classified according to the type of bipolar cell in each pair (n = 16 cell pairs), the mean Gj values were as follows (Gj averaged for both directions of coupling): 106 and 646 pS (type 5), 596 and 1379 pS (type 6), 1233 ± 83 pS (type 7; n = 7), and 1414 ± 460 pS (type 8; n = 5). There was no statistically significant difference between type 7 and type 8 cell pairs (p = 0.66). Type 5 and type 6 cell pairs were not included in the statistical comparisons because of limited sample sizes. Gj was quite stable over the duration of recording (typically 20–30 min).
Voltage sensitivity of electrical junction conductance
The voltage sensitivity of the steady-state electrical junction conductance (Gj,ss) was examined by applying 10-sec-long voltage pulses to the presynaptic cell and measuring the evoked current in the postsynaptic cell. The transjunctional voltage (Vj) was varied from −70 or −60 mV to +60 mV. Within this voltage range, there was little dependence of Gj,ss onVj. Figure 2F shows postsynaptic current families in an AII amacrine cell and an ON-cone bipolar cell, while voltage pulses were applied to the corresponding presynaptic cell. For Vj< −40 mV and Vj > +40 mV, there was slight relaxation of the postsynaptic current. Figure 2Gshows the resulting Gj,ss versusVj for data pooled from three to six cell pairs. Because of the limited range ofVj values tested, no attempt was made to fit the Gj,ss versusVj data to a Boltzmann relationship (Spray et al., 1981).
Coupling coefficient
In current clamp, a current step in the presynaptic cell evoked a presynaptic and postsynaptic voltage change of the same polarity, as expected for transmission via electrical synapses (Fig.3A,B). For each cell pair and for each direction of coupling, a coupling coefficient was calculated as the ratio of the voltage change in the noninjected cell to that in the injected cell. When the two directions of coupling were compared, coupling was found to be consistently asymmetric (Fig. 3C). The mean steady-state coupling coefficient in the direction AII → ON-cone bipolar cell was 0.61 ± 0.04 (n = 9 cell pairs), whereas the mean steady-state coupling coefficient in the direction ON-cone bipolar cell → AII was 0.30 ± 0.03 (same nine cell pairs). To quantify the apparent rectification, we calculated the ratio of the higher to the lower coupling coefficient for each cell pair (i.e., the Kratio) (Nolan et al., 1999). The mean K ratio was 2.2 ± 0.2. This rectification cannot be accounted for by the junction conductance, which was symmetrical (Fig. 2E). An alternative explanation for the asymmetrical coupling coefficient is a difference in membrane input resistance (reflecting the difference in cell size) between the two coupled cells (441 ± 36 MΩ for AII amacrine cells; 1030 ± 112 MΩ for ON-cone bipolar cells). We investigated this by plotting the K ratio for each coupled pair against the ratio of postsynaptic to presynaptic membrane input resistances (calculated in the direction of the larger coupling coefficient) (Fig. 3D). The result suggests that the asymmetry of coupling coefficients can be well accounted for by the difference in membrane input resistance. For seven of these coupled cell pairs, we repeated the measurements in control solution without blockers. There was no statistically significant difference in theK ratio between the two conditions (K ratio with blockers, 1.8 ± 0.2; K ratio without blockers, 1.7 ± 0.2; p = 0.3; paired t test). Thus, the asymmetry did not depend on the presence of blockers of chemical synaptic transmission.
Fig. 3.

Estimation of coupling coefficients between electrically coupled cells. A, With both cells in current clamp, 500 msec current pulses (I) of −50, −25, and +50 pA are applied to the AII amacrine cell while voltage responses are recorded from both cells (VAII,VBC). Injection of negative current results in hyperpolarization of both cells, and injection of positive current results in depolarization of both cells. B, Same as in A, but current pulses of −20, −10, and +20 pA are applied to the bipolar cell (type 6). C, Comparison of coupling coefficients in each direction indicates apparent rectification for all cell pairs (BC →AII for bipolar cell presynaptic; AII →BC for AII amacrine cell presynaptic). Thestraight line has a slope of 1 (i.e., coupling coefficient is the same in both directions). D, Relation between apparent rectification (K ratio) and input resistance ratio. The continuous line represents the values expected when pairs of cells are connected by asymmetrical coupling coefficients and input resistances, but symmetricalGj. The horizontal andvertical dashed lines represent values expected when pairs of cells have identical coupling coefficients and input resistances, respectively.
Frequency dependence of electrical synaptic transmission
Electrical coupling between nerve cells can have the functional characteristics of a low-pass filter (Bennett, 1977). To investigate this we applied sinusoidal current stimuli of varying frequency (1–100 Hz) to electrically coupled cell pairs while recording the voltage modulation in both cells (Fig.4A,B). For each frequency we calculated the coupling coefficient and the phase shift for both directions of coupling (Veruki and Hartveit, 2002). The coupling coefficient at each frequency was normalized to the coupling coefficient for steady-state responses in the same direction for the same cell pair. The signal transmission in both directions of coupling had clear low-pass characteristics, with increasing attenuation and phase shift for increasing stimulus frequency. Furthermore, the transmission characteristics for each direction of coupling closely mirrored each other (Fig. 4C).
Fig. 4.
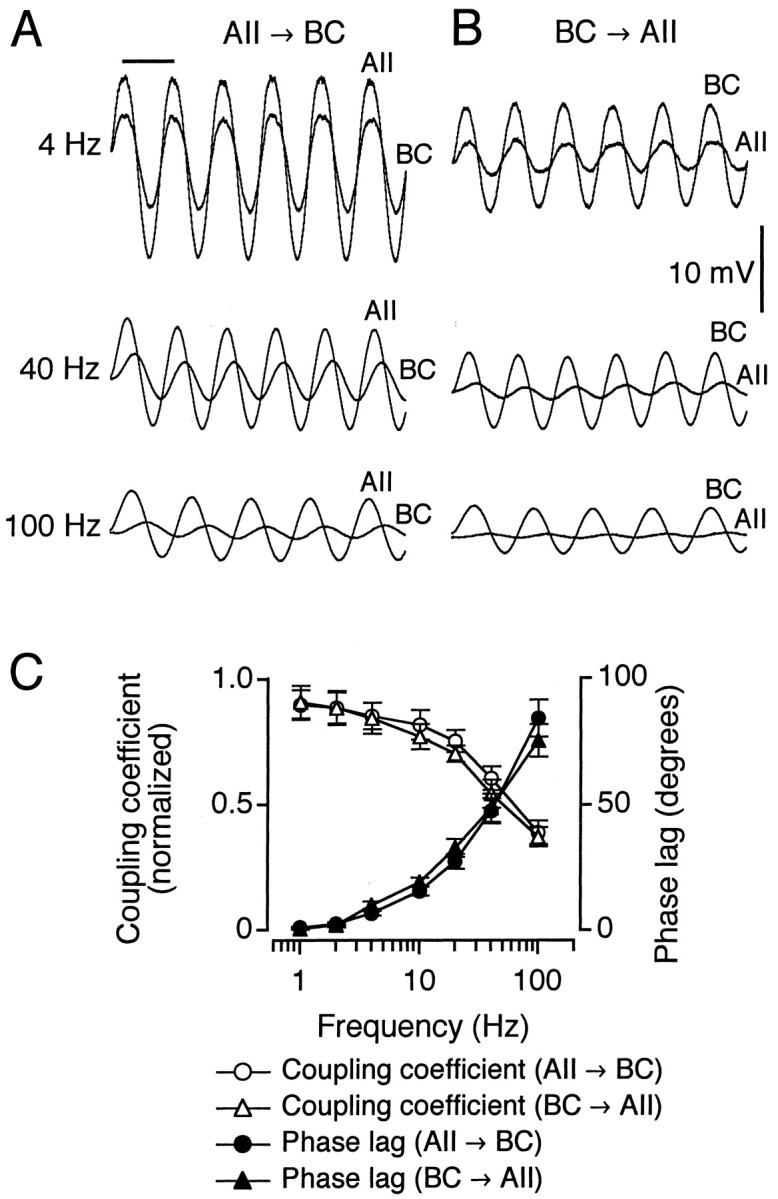
Electrical coupling between AII amacrine cells and ON-cone bipolar cells displays transmission characteristics of a low-pass filter. A, B, Increasing phase lag and response attenuation between the voltage oscillations evoked in the presynaptic and postsynaptic cells of a coupled pair when injecting sinusoidal current stimuli of increasing frequency in the presynaptic cell. A, AII amacrine cell presynaptic (current stimulus 100 pA peak-to-peak amplitude) and bipolar cell (type 6) postsynaptic (each trace is the average of 3–9 sweeps). Horizontal calibration bar indicates duration of one stimulus period (250 msec for 4 Hz, 25 msec for 40 Hz, and 10 msec for 100 Hz; A,B). B, Same as in A, but bipolar cell presynaptic (current stimulus 30 pA peak-to-peak amplitude) and AII amacrine cell postsynaptic (eachtrace is the average of 3–9 sweeps). C, Bode plot showing frequency dependence of response attenuation (coupling coefficient normalized to steady-state coupling coefficient) and phase lag of sinusoidal voltage response for both directions of coupling (n = 6 cell pairs).
Electrical postsynaptic potentials and signal transmission between coupled cells
Spike generation between pairs of AII amacrine cells can be synchronized precisely, and there is evidence that spikes can be transmitted through electrical synapses between these cells (Veruki and Hartveit, 2002). The question therefore arises whether electrical synapses between AII amacrine cells and ON-cone bipolar cells allow for a similar transmission of spikes. Although AII amacrine cells can generate TTX-sensitive spikes (Boos et al., 1993; Veruki and Hartveit, 2002), we did not observe similar spikes generated by ON-cone bipolar cells in situ.
For electrically coupled cell pairs, we observed that spontaneous action potentials in the AII amacrine cell evoked slow depolarizations in the ON-cone bipolar cell (Fig.5A). There were no failures. Adding TTX blocked action potentials in AII amacrine cells and the corresponding depolarizations in ON-cone bipolar cells (Fig.5B). Figure 5C shows a series of traces with postsynaptic depolarizations in an ON-cone bipolar cell aligned by a spike in the presynaptic cell (AII). The postsynaptic depolarizations had an average amplitude of 2.0 ± 0.1 mV (range, 1.1–3.0 mV; n = 40 responses), a 10–90% rise time of 2.6 ± 0.1 msec (range, 1.3–5.8 msec), and a latency from the presynaptic spike of 0.32 ± 0.02 msec (range, 0.04–0.65 msec). The latency was determined as the time interval between the maximum slope of the presynaptic action potential (measured as the peak of the first derivative of that waveform) and the onset of the postsynaptic depolarization (measured as 5% of the peak amplitude). The low variability of the postsynaptic depolarizations and the absence of failures suggest that the connection was monosynaptic and that the depolarizations corresponded to electrical PSPs. The average coupling coefficient (ratio between the amplitude of the postsynaptic depolarization and the amplitude of the presynaptic spike) was 0.22. This was lower than the steady-state coupling coefficient between the same cell pair, which was 0.61, consistent with frequency-dependent attenuation of transmission. Similar observations and quantitative measurements of electrical PSPs were made for a total of eight cell pairs. The mean peak amplitude was 1.6 ± 0.3 mV (range, 0.1–2.8 mV), the mean 10–90% rise time was 2.2 ± 0.4 msec (range, 1.2–4.2 msec), and the mean latency from the presynaptic spike was 0.37 ± 0.09 msec (range, 0.15–0.78 msec). The mean coupling coefficient was 0.18 ± 0.06 (range, 0.02–0.49).
Fig. 5.

Transmission of action potentials from AII amacrine cells and electrical PSPs in ON-cone bipolar cells.A, Spontaneous activity of a simultaneously recorded, electrically coupled cell pair. Spikes in the AII amacrine cell occur together with slower depolarizations in the ON-cone bipolar cell (type 7). B, TTX blocks spiking in the AII amacrine cell and corresponding subthreshold depolarizations in the ON-cone bipolar cell.C, Left, Recording configuration, both cells in current clamp. Right, Overlaid spontaneous activity (Control) traces of AII amacrine cell and bipolar cell aligned by a spike in the AII amacrine cell (n = 6). Same cell pair as A.D, Left, Recording configuration; AII amacrine cell voltage clamped with prerecorded action potential waveform and bipolar cell in current clamp. Right, Overlaid evoked activity traces of AII amacrine cell and bipolar cell aligned by a simulated spike in the AII amacrine cell (n = 6); recorded in the presence of TTX. Same cell pair as A. E, Spontaneous activity of a simultaneously recorded, electrically coupled cell pair. Note simultaneously occurring subthreshold depolarizations (vertical arrows) in the AII amacrine cell and the bipolar cell (type 8), presumably evoked by spiking activity in other AII amacrine cells independently coupled to both cells. A spike in the AII amacrine cell evokes an additional subthreshold depolarization in the bipolar cell.F, Spontaneous activity of simultaneously recorded, electrically coupled cell pairs (left, type 6 bipolar cell; middle and right, type 7 bipolar cell, same cell pair). Note subthreshold depolarizations (vertical arrows) in the AII amacrine cell (left) or the bipolar cell (middle andright) unaccompanied by corresponding depolarizations in the other cell of the pair.
The transmission characteristics between electrically coupled AII amacrine cells and cone bipolar cells were studied by application of simulated action potentials as voltage-clamp templates. After recording a series of electrical PSPs evoked by spontaneous presynaptic action potentials in the AII amacrine cells (Fig. 5C), we added TTX to the extracellular solution, changed the recording configuration of the AII amacrine cell from current clamp to voltage clamp, and applied a previously recorded action potential as a voltage-clamp command. The postsynaptic depolarizations evoked by the simulated action potential were similar to those evoked by spontaneous action potentials (Fig.5D). To quantify the comparison, we measured three response parameters: latency, coupling coefficient, and 10–90% rise time of the postsynaptic depolarization. There was no significant difference between the values of each of the three parameters compared between control and TTX conditions (p > 0.16;n = 6 cell pairs; paired t test for each response parameter). This suggests that voltage-gatedINa does not influence the coupling characteristics or the time course of the postsynaptic response and that the transmission of action potentials from AII amacrine cells to ON-cone bipolar cells can be explained by a passive, electrotonic mechanism.
Although our recordings were from pairs consisting of one AII amacrine cell and one bipolar cell, we sometimes observed indirect evidence for electrical coupling to other cells, making it likely that electrical coupling encompasses a more extensive network of cells. In the example shown in Figure 5E, an ON-cone bipolar cell displayed an electrical PSP corresponding to an action potential in a simultaneously recorded AII amacrine cell. In addition, both cells displayed correlated subthreshold depolarizations, presumably electrical PSPs caused by action potentials in other AII amacrine cells connected independently to the recorded cells. In other cases, presumed electrical PSPs occurred only in the AII amacrine cell of a coupled pair (Fig. 5F, left) or only in the ON-cone bipolar cell of a coupled pair (Fig. 5F, middleand right), suggesting that they were caused by spikes in other AII amacrine cells coupled predominantly (or exclusively) to only one of the recorded cells.
Subthreshold membrane potential synchronization and oscillation
Electrical synapses are able to mediate temporally precise synchronization not only of action potentials but of subthreshold membrane potential fluctuations as well (Galarreta and Hestrin, 2001;Veruki and Hartveit, 2002). An important question is therefore whether such patterns of synchronization can be observed between AII amacrine cells and ON-cone bipolar cells. For a quantitative analysis, we constructed sliding-window, 2D cross-correlograms between pairs of simultaneously recorded cells. The 2D cross-correlograms in Figure6B were calculated from 15-sec-long, continuous voltage records from a pair of electrically coupled cells (Fig. 6A) and show strong, continuous synchronization of membrane potential fluctuations. This was observed both in the control condition (Fig. 6A,top, B, left) and in the combined presence of antagonists of chemical synaptic transmission, TTX and Co2+ (replacing Ca2+ in the external solution) (Fig.6A, bottom, B,right). The time-averaged cross-correlogram for each condition is shown in Figure 6D (left,blue traces; top row control, bottom row with blockers). For each 2D cross-correlogram, we calculated the peak amplitude, peak location (relative to zero time delay), and half-width duration of each (1D) cross-correlogram as a function of recording time. The peak amplitude was taken as a measure of synchrony. For both recording conditions, the variability in synchrony over time was minimal, with a mean value of 0.824 ± 0.004 (n = 148 1D cross-correlograms) in the control condition and 0.763 ± 0.006 with blockers. The peak amplitude of the time-averaged cross-correlograms was located very close to zero time delay, and there was little fluctuation in the location of the peak as a function of time (Fig. 6C). This indicates a consistent, near-zero time shift between the membrane potential fluctuations in the two cells. In the control condition, the location of the peak was +2.8 ± 0.1 msec (Fig. 6C, left), indicating that the AII amacrine cell led and the ON-cone bipolar cell followed (see Materials and Methods). In the combined presence of antagonists, TTX and Co2+, the location of the peak reversed (−2.3 ± 0.1 msec) (Fig. 6C, right), indicating that the AII amacrine cell no longer led the bipolar cell. Further experiments attributed this effect to the presence of TTX (see below).
Fig. 6.
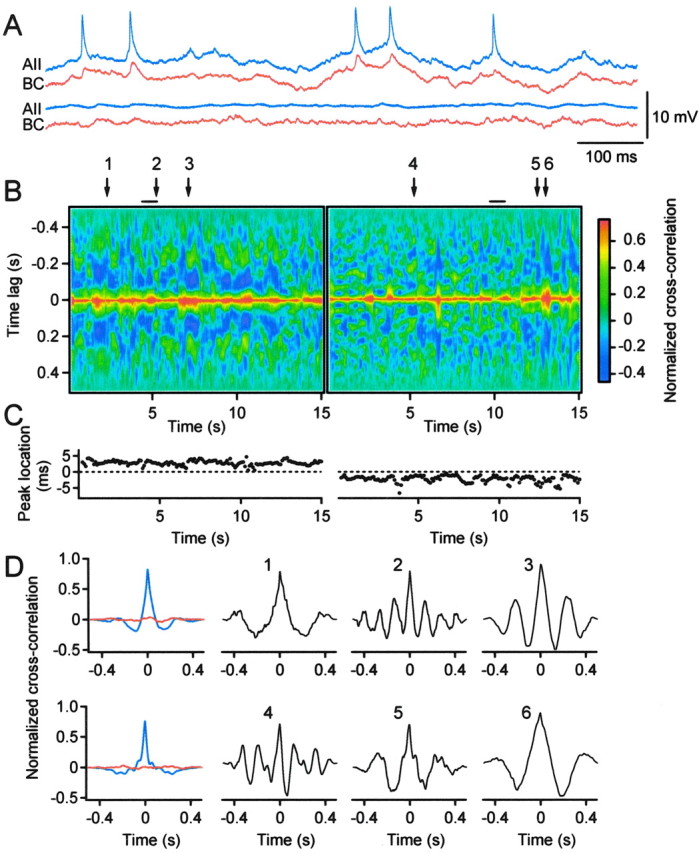
Synchronous subthreshold membrane potential fluctuations during spontaneous activity. A, Spontaneous activity of a pair of simultaneously recorded, electrically coupled cells (AII amacrine cell, blue; cone bipolar cell type 7, red) in control solution (top) and in the presence of antagonists of chemical synaptic transmission, TTX and Co2+ (bottom). B,Sliding 2D cross-correlograms for 15 sec continuous recordings of same cell pair as in A (left, control condition; right, with blockers). Horizontal axis, Time at the center of the 0.5 sec sliding window;vertical axis, time lag from the center (zero time delay) of the window. The normalized correlation amplitude is coded by color (bar, right). Period of recordings in A is indicated by solid horizontal lines. C, Location of peak amplitude in 2D cross-correlograms in B (left, control condition; right, with blockers). D, One-dimensional cross-correlograms (top row, control condition; bottom row, with blockers): time-averaged normal (blue) and shuffled (red) cross-correlograms (left); cross-correlograms centered at time points corresponding to arrows 1,2, and 3 in B (control condition); cross-correlograms centered at time points corresponding toarrows 4, 5, and 6 inB (with blockers).
Two-dimensional cross-correlograms were constructed for a total of 16 cell pairs in control solution. The average peak amplitude of time-averaged cross-correlograms was 0.74 ± 0.03 (range, 0.53–0.91), and the average location of the peak was +3.2 ± 0.5 msec (range, +0.3 to +8.8 msec). In the presence of antagonists of chemical synaptic transmission, the average peak amplitude was 0.73 ± 0.04 (n = 17), and after adding TTX along with the antagonists it was 0.72 ± 0.04 (n = 13). The location of the peak amplitude did not change significantly in the presence of antagonists of chemical synaptic transmission (p = 0.11; paired t test;n = 16), but in the additional presence of TTX the average location of the peak changed from +3.3 ± 0.6 to −1.6 ± 1.3 msec (p = 0.004; pairedt test; n = 13). As a control, we constructed shuffled cross-correlograms with segments for the second cell chosen in random order with respect to the first cell. Additionally, cross-correlograms were constructed from pairs of AII amacrine cells and either rod bipolar cells or OFF-cone bipolar cells (n = 5; recorded in the presence of antagonists of chemical synaptic transmission). We never observed consistent peaks in shuffled (Fig. 6D, left, red traces) or noncoupled cross-correlograms (data not shown).
For most cell pairs the cross-correlograms indicated that the strong synchronization was accompanied by discrete periods of markedly oscillatory membrane potential fluctuations. The degree of oscillation varied over time with continuous synchronization alternating between oscillatory (Fig. 6D, top, panels 2 and 3) and non-oscillatory activity (Fig.6D, top, panel 1), evidence of marked short-term dynamics in network activity. The period of oscillation was typically 100–300 msec. In the presence of blockers, synchronization still alternated between oscillatory (Fig.6C, bottom, panels 4 and 5) and non-oscillatory activity (Fig. 6D,bottom, panel 6). This suggests that oscillatory synchronization does not depend on chemical neurotransmission, Na+-dependent action potentials, or voltage-gated Ca2+currents.
DISCUSSION
There is increasing evidence for the widespread existence of gap junctions, functionally corresponding to electrical synapses, in several regions of the CNS (Galarreta and Hestrin, 2001). In the retina, homologous and heterologous gap junctions were detected decades ago and have been assigned a role both in pathways for transfer of visual signals and in networks of neurons thought to be important for adjustment of visual sensitivity and spatial resolution. Electrical synapses between AII amacrine cells and ON-cone bipolar cells are considered essential for the flow of visual signals in the retina under dark-adapted conditions (Kolb and Famiglietti, 1974; Bloomfield and Dacheux, 2001). To investigate functional aspects of this microcircuit, we have used simultaneous dual recording to directly demonstrate and functionally characterize strong electrical coupling between AII amacrine cells and ON-cone bipolar cells. The electrical synapses have symmetrical junction conductances with very low voltage sensitivity, mediate sign-conserving signaling, and show a strong propensity to synchronize membrane potential fluctuations. There is strong functional rectification with preferential transmission of membrane potential changes from AII amacrine cells to ON-cone bipolar cells. Action potentials in AII amacrine cells evoke distinct electrical PSPs in ON-cone bipolar cells. Electrical coupling was detected between AII amacrine cells and every type of bipolar cell proposed to correspond to ON-cone bipolar cells (Euler et al., 1996; Hartveit, 1997), except ON-cone bipolar cell type 9, which is rare (Euler and Wässle, 1995; Hartveit, 1997) and was not recorded in the present study. The experiments were performed in mature tissue, thus excluding the possibility that the observations are unique to a particular developmental stage in maturation of the neuronal tissue.
We believe that the observed electrical coupling between AII amacrine cells and ON-cone bipolar cells is caused by flow of current through gap junctions. The observed responses have the functional properties expected for electrical coupling mediated by gap junctions (Bennett, 1977). We observed electrical coupling only in cell pairs with overlapping processes. Finally, we never observed electrical coupling when either an AII amacrine cell or an ON-cone bipolar cell was recorded simultaneously with any other type of cell (except when recording from pairs of AII amacrine cells) (Veruki and Hartveit, 2002), regardless of whether the cells were in potential physical contact. Our estimate of the electrical junction conductance will be influenced by several sources of error that to some extent could cancel each other. On the one hand, the existence of indirect pathways of coupling between two monosynaptically coupled cells will tend to overestimate the true junction conductance. On the other hand, our measurements include the cytoplasmic resistance along the processes of each coupled cell, and this will tend to underestimate the true junction conductance.
Morphological investigations at the ultrastructural level have identified a structural asymmetry of the gap junctions between AII amacrine cells and ON-cone bipolar cells (Strettoi et al., 1992), and it has been speculated that this is related to a functional asymmetry of the corresponding electrical synapses (Vaney, 1997). Recently, this idea was challenged by studies suggesting that tracer coupling between AII amacrine cells and ON-cone bipolar cells was bidirectional (Trexler et al., 2001) and that depolarizing responses to photopic visual signals may be conveyed to AII amacrine cells (Xin and Bloomfield, 1999). Alternatively, it was suggested that the structural asymmetry could reflect some form of regulation of the signal transmission between AII amacrine cells and ON-cone bipolar cells (Strettoi et al., 1992). In the present study, with a light-adapted slice preparation, we demonstrate directly that the electrical junction conductance was consistently symmetric and the steady-state voltage-sensitivity was very low (within the physiologically relevant range examined). The functional characteristics of the electrical coupling seem well suited for efficient transfer of visual signals between the two cell types. The strong asymmetry of coupling coefficients indicates that transmission will be more effective in the direction from AII amacrine cells to ON-cone bipolar cells. This functional rectification could be a consequence of the corresponding difference in membrane input resistance between the two cell types (reflecting the difference in cell size). The low coupling coefficient for transmission from ON-cone bipolar cells to AII amacrine cells could also be a mechanism to prevent extensive cross-talk between different types of ON-cone bipolar cells electrically coupled to the same AII amacrine cell. It is likely, however, that the degree of coupling could be regulated by changes in the electrical junction conductance through activation of intracellular second messenger systems. Although changes in tracer coupling need not reflect corresponding changes in electrical coupling, there is indeed evidence that tracer coupling between AII amacrine cells and bipolar cells is under modulatory control, possibly related to network switching between rod and cone pathways associated with light adaptation (Mills and Massey, 1995). It was proposed that the gap junctions between AII amacrine cells and ON-cone bipolar cells would be closed by increasing levels of light, mediated by an increase in the intracellular concentration of cGMP. In our experiments, no attempt was made to directly manipulate the concentration of cGMP or any other potential intracellular second messenger. Furthermore, the open probability of the gap junction channels is unknown and cannot be determined from the measured electrical junction conductance without knowing the number of channels and the single-channel conductance. It will be important to determine whether the electrical junction conductance between AII amacrine cells and ON-cone bipolar cells is under modulatory control and how this might be controlled by the state of light adaptation.
The electrical synapses displayed the functional characteristics of a low-pass filter with similar transmission characteristics for both directions of coupling. For steady-state signals, we found coupling coefficients up to ∼75% for coupling from AII amacrine cells to ON-cone bipolar cells. For higher-frequency signals like action potentials, coupling coefficients were lower (2–49%), but they evoked distinct electrical PSPs in the ON-cone bipolar cells. In experiments with prerecorded action potentials as voltage-clamp templates, the evoked electrical PSPs in ON-cone bipolar cells were very similar to those evoked by spontaneous action potentials, suggesting that propagation of action potentials (Martina et al., 2000) toward the site of coupling does not constitute a mechanism for amplifying the coupling strength between AII amacrine cells and ON-cone bipolar cells. Because of cable filtering along the ON-cone bipolar axon, the temporal characteristics of the electrical PSPs will most likely be even more transient at the axon terminals than at the soma where we recorded them. This is likely to be of considerable functional importance for the release characteristics of the chemical synapses made by the ON-cone bipolar cells on processes of amacrine cells and ganglion cells in the inner plexiform layer (Strettoi et al., 1994).
Our study demonstrates temporally precise synchronization of subthreshold membrane potential fluctuations between AII amacrine cells and ON-cone bipolar cells. Under our experimental conditions, the AII amacrine cell generally leads and the ON-cone bipolar cell follows. This relationship was blocked by TTX, suggesting that it could be mediated by the regenerative properties of the voltage-dependentINa in the AII amacrine cells. An important issue for future research will be to determine how the membrane potential of an AII amacrine cell can influence transmitter release from the axon terminal of an ON-cone bipolar cell to which it is electrically coupled.
We are unaware of any evidence suggesting the presence of chemical synapses between AII amacrine cells and ON-cone bipolar cells. Thus, the direct interaction between these cell types must be limited to electrical synapses, but there might be indirect pathways of interaction. Chemical synaptic output from ON-cone bipolar cells to amacrine cells (Strettoi et al., 1994) could mediate negative feedback to the AII amacrine cells. Chemical synaptic output from AII amacrine cells to OFF-cone bipolar cells (Strettoi et al., 1992) could suppress excitatory input to amacrine cells with inhibitory connections to ON-cone bipolar cells. Under natural conditions, it is likely that such network interactions, as well as common chemical synaptic input from rod bipolar cells to electrically coupled AII amacrine cells (Strettoi et al., 1992), will interact with the electrical synapses between AII amacrine cells and between AII amacrine cells and ON-cone bipolar cells. An important next step will be to investigate directly the dynamic interactions within these heterogeneous networks.
Footnotes
This work was supported by the Norwegian Research Council (NFR 123487/310, 129566/310, 123485/310, 141392/310) and the Meltzer fund (University of Bergen).
Correspondence should be addressed to Espen Hartveit, University of Bergen, Department of Anatomy and Cell Biology, Årstadveien 19, N-5009 Bergen, Norway. E-mail: espen.hartveit@iac.uib.no.
REFERENCES
- 1.Bennett MVL. Electrical transmission: a functional analysis and comparison to chemical transmission. In: Kandel ER, editor. The handbook of physiology: the nervous system, Vol I. American Physiological Society; Washington, DC: 1977. pp. 357–416. [Google Scholar]
- 2.Bloomfield SA, Dacheux RF. Rod vision: pathways and processing in the mammalian retina. Prog Ret Eye Res. 2001;20:351–384. doi: 10.1016/s1350-9462(00)00031-8. [DOI] [PubMed] [Google Scholar]
- 3.Boos R, Schneider H, Wässle H. Voltage- and transmitter-gated currents of AII-amacrine cells in a slice preparation of the rat retina. J Neurosci. 1993;13:2874–2888. doi: 10.1523/JNEUROSCI.13-07-02874.1993. [DOI] [PMC free article] [PubMed] [Google Scholar]
- 4.Chun MH, Han SH, Chung JW, Wässle H. Electron microscopic analysis of the rod pathway of the rat retina. J Comp Neurol. 1993;332:421–432. doi: 10.1002/cne.903320404. [DOI] [PubMed] [Google Scholar]
- 5.Euler T, Wässle H. Immunocytochemical identification of cone bipolar cells in the rat retina. J Comp Neurol. 1995;361:461–478. doi: 10.1002/cne.903610310. [DOI] [PubMed] [Google Scholar]
- 6.Euler T, Schneider H, Wässle H. Glutamate responses of bipolar cells in a slice preparation of the rat retina. J Neurosci. 1996;16:2934–2944. doi: 10.1523/JNEUROSCI.16-09-02934.1996. [DOI] [PMC free article] [PubMed] [Google Scholar]
- 7.Feigenspan A, Teubner B, Willecke K, Weiler R. Expression of connexin36 in AII amacrine cells of the mammalian retina. J Neurosci. 2001;21:230–239. doi: 10.1523/JNEUROSCI.21-01-00230.2001. [DOI] [PMC free article] [PubMed] [Google Scholar]
- 8.Galarreta M, Hestrin S. Electrical synapses between GABA-releasing interneurons. Nat Rev Neurosci. 2001;2:425–433. doi: 10.1038/35077566. [DOI] [PubMed] [Google Scholar]
- 9.Hartveit E. Functional organization of cone bipolar cells in the rat retina. J Neurophysiol. 1997;77:1716–1730. doi: 10.1152/jn.1997.77.4.1716. [DOI] [PubMed] [Google Scholar]
- 10.Kolb H, Famiglietti EV. Rod and cone pathways in the inner plexiform layer of cat retina. Science. 1974;186:47–49. doi: 10.1126/science.186.4158.47. [DOI] [PubMed] [Google Scholar]
- 11.Kumar NM, Gilula NB. The gap junction communication channel. Cell. 1996;84:381–388. doi: 10.1016/s0092-8674(00)81282-9. [DOI] [PubMed] [Google Scholar]
- 12.Martina M, Vida I, Jonas P. Distal initiation and active propagation of action potentials in interneuron dendrites. Science. 2000;287:295–300. doi: 10.1126/science.287.5451.295. [DOI] [PubMed] [Google Scholar]
- 13.McGuire BA, Stevens JK, Sterling P. Microcircuitry of bipolar cells in cat retina. J Neurosci. 1984;4:2920–2938. doi: 10.1523/JNEUROSCI.04-12-02920.1984. [DOI] [PMC free article] [PubMed] [Google Scholar]
- 14.Mills SL, Massey SC. Differential properties of two gap junctional pathways made by AII amacrine cells. Nature. 1995;377:734–737. doi: 10.1038/377734a0. [DOI] [PubMed] [Google Scholar]
- 15.Mills SL, O'Brien JJ, Li W, O'Brien J, Massey SC. Rod pathways in the mammalian retina use connexin 36. J Comp Neurol. 2001;436:336–350. [PMC free article] [PubMed] [Google Scholar]
- 16.Nolan MF, Logan SD, Spanswick D. Electrophysiological properties of electrical synapses between rat sympathetic preganglionic neurones in vitro. J Physiol (Lond) 1999;519:753–764. doi: 10.1111/j.1469-7793.1999.0753n.x. [DOI] [PMC free article] [PubMed] [Google Scholar]
- 17.Spray DC, Harris AL, Bennett ML. Equilibrium properties of a voltage-dependent junctional conductance. J Gen Physiol. 1981;77:77–93. doi: 10.1085/jgp.77.1.77. [DOI] [PMC free article] [PubMed] [Google Scholar]
- 18.Strettoi E, Raviola E, Dacheux RF. Synaptic connections of the narrow-field, bistratified rod amacrine cell (AII) in the rabbit retina. J Comp Neurol. 1992;325:152–168. doi: 10.1002/cne.903250203. [DOI] [PubMed] [Google Scholar]
- 19.Strettoi E, Dacheux RF, Raviola E. Cone bipolar cells as interneurons in the rod pathway of the rabbit retina. J Comp Neurol. 1994;347:139–149. doi: 10.1002/cne.903470111. [DOI] [PubMed] [Google Scholar]
- 20.Trexler EB, Li W, Mills SL, Massey SC. Coupling from AII amacrine cells to ON cone bipolar cells is bidirectional. J Comp Neurol. 2001;437:408–422. doi: 10.1002/cne.1292. [DOI] [PubMed] [Google Scholar]
- 21.Vaney DI. Neuronal coupling in rod-signal pathways of the retina. Invest Ophthalmol Vis Sci. 1997;38:267–273. [PubMed] [Google Scholar]
- 22.Veruki ML, Hartveit E. AII (rod) amacrine cells form a network of electrically coupled interneurons in the mammalian retina. Neuron. 2002;33:935–946. doi: 10.1016/s0896-6273(02)00609-8. [DOI] [PubMed] [Google Scholar]
- 23.Wässle H, Grünert U, Röhrenbeck J. Immunocytochemical staining of AII-amacrine cells in the rat retina with antibodies against parvalbumin. J Comp Neurol. 1993;332:407–420. doi: 10.1002/cne.903320403. [DOI] [PubMed] [Google Scholar]
- 24.Xin D, Bloomfield SA. Comparison of the responses of AII amacrine cells in the dark- and light-adapted rabbit retina. Vis Neurosci. 1999;16:653–665. doi: 10.1017/s0952523899164058. [DOI] [PubMed] [Google Scholar]