

Abstract
The three-dimensional morphology of the axosomatic synaptic structures between a calyx of Held and a principal neuron in the medial nucleus of the trapezoid body (MNTB) in the brainstem of young postnatal day 9 rats was reconstructed from serial ultrathin sections. In the apposition zone between the calyx and the principal neuron two types of membrane specializations were identified: synaptic contacts (SCs) with active zones (AZs) and their associated postsynaptic densities (PSDs) constituted ∼35% (n = 554) of the specializations; the remaining 65% (n = 1010) were puncta adherentia (PA). Synaptic contacts comprised ∼5% of the apposition area of presynaptic and postsynaptic membranes. A SC had an average area of 0.100 μm2, and the nearest neighbors were separated, on average, by 0.59 μm. Approximately one-half of the synaptic vesicles in the calyx were clustered within a distance of 200 nm of the AZ membrane area, a cluster consisting of ∼60 synaptic vesicles (n = 52 SCs). Approximately two synaptic vesicles per SC were “anatomically docked.”
Comparing the geometry of the synaptic structure with its previously studied functional properties, we find that during a single presynaptic action potential (AP) (1) ∼35% of the AZs release a transmitter quantum, (2) the number of SCs and anatomically docked vesicles is comparable with the low estimates of the readily releasable pool (RRP) of quanta, and (3) the broad distribution of PSD areas [coefficient of variation (CV) = 0.9] is likely to contribute to the large variability of miniature EPSC peaks. The geometry of the reconstructed synapse suggests that each of the hundreds of SCs is likely to contribute independently to the size and rising phase of the EPSC during a single AP.
Keywords: electron microscopy, three-dimensional reconstruction, synapse, active zones, puncta adherentia, synaptic vesicles
A quantitative description of the signal cascade underlying synaptic transmission requires that the temporal and spatial dependence of those steps that couple a presynaptic action potential (AP) to a postsynaptic potential must be known. Important steps are (1) the diffusion of Ca2+ in the presynaptic terminal driving the exocytosis of transmitter-containing vesicles (Katz, 1969), (2) the diffusion of transmitter in the synaptic cleft after fusion has occurred, (3) the transient opening of postsynaptic channels after binding of transmitter to its cognate receptors (del Castillo and Katz, 1957), and (4) clearance of transmitter. Some of these steps have been elucidated in the mammalian brain for the glutamatergic giant synapse in the medial nucleus of the trapezoid body (MNTB) in the acoustic pathway. The large somatic terminals of bushy cells in the ventral cochlear nucleus (VCN), known as calyces of Held, form synapses with cell bodies of the principal neurons of the MNTB (Held, 1898; Lenn and Reese, 1966; Nakajima, 1971; Petelina, 1975; Casey and Feldman, 1985;Kandler and Friauf, 1993; Forsythe, 1994; Rowland et al., 2000). The trains of APs in the bushy cells of the VCN are converted to an equivalent inhibitory signal transmitted to the lateral superior olive (LSO) (Smith et al., 1998).
In young rats [postnatal day 9 (P9)] both the presynaptic and postsynaptic elements of the synapse can be patch clamped simultaneously (Borst et al., 1995; Takahashi et al., 1996; Borst and Sakmann, 1998) to measure transmitter release under defined internal and external ionic and membrane potential conditions. The size and time course of AP-evoked calyceal Ca2+ influx (Borst and Sakmann, 1996, 1998), occupancy of the putative Ca2+ sensor driving vesicle fusion (Bollmann et al., 2000; Schneggenburger and Neher, 2000), and the equilibration of intracellular Ca2+ with the endogenous Ca2+ buffer and the eventual Ca2+ clearance (Helmchen et al., 1997) can be measured accurately as well as the latency, size, and time course of evoked quantal EPSCs and multiquantal EPSCs (Borst and Sakmann, 1996; Sahara and Takahashi, 2001).
A quantitative knowledge of the geometry of the presynaptic and postsynaptic structures is required for a more detailed understanding of the mechanisms underlying synaptic transmission and provides important constraints for numerical simulations. On the presynaptic side, time- and space-dependent build-up and collapse of [Ca2+]i domains around the internal pore of Ca2+ channels at an active zone (AZ), the buffered diffusion, and the subsequent interaction of free Ca2+ with the Ca2+ sensor can, at present, be simulated only (Yamada and Zucker, 1992; Bertram et al., 1999; Smith, 2001;Meinrenken et al., 2002). Realistic values of the number, distribution, and geometry of synaptic contacts (SCs) including the distribution of synaptic vesicles are essential for constraining such simulations. On the postsynaptic side the time course and amplitude of spontaneous and evoked EPSCs are used to infer the rate of quantal release (del Castillo and Katz, 1954). This inference requires simulations of the transient increase of glutamate concentration in the synaptic cleft, reversible binding of glutamate to glutamate receptor (GluR) channels, and eventual uptake and diffusion of glutamate out of the cleft. To a large extent these processes are governed by the geometry of the synaptic cleft and the postsynaptic densities (PSDs).
Here we report the three-dimensional reconstruction of a giant synaptic structure formed between the calyx of Held and the soma of a principal neuron in the MNTB, made from contours of serial ultrathin sections. The present study provides a quantitative analysis of the number, density, and area of SCs and their associated synaptic vesicles and the volume and geometry of the synaptic cleft.
MATERIALS AND METHODS
Fixation and tissue processing. All experiments were performed in accordance with the animal welfare guidelines of the University of Freiburg and the Max Planck Society.
For the complete reconstruction of the calyx and the principal neuron, the brain of one Wistar rat was used (selected from four perfused animals, P9, body weight ∼15 gm). The animals were anesthetized deeply with sodium pentobarbital (Nembutal, 60 mg/kg body weight) and perfused transcardially with physiological saline, followed by a phosphate-buffered solution (PB; 0.1 m solution, pH 7.4) containing 2.5% glutaraldehyde (Polyscience Europe GmbH, Eppelheim, Germany) for 15–20 min at room temperature. After 1 hr of postfixation the brains were removed from the skull and stored overnight in fresh fixative at 4°C. Serial 100-μm-thick vibratome sections (Leica VT1000S, Wetzlar, Germany) were cut in the frontal plane through the MNTB complex. After a thorough rinsing in 0.1 m PB (3–5×, 10 min for each step), the sections were postfixed for 1 hr in PB-buffered 1% osmium tetroxide, pH 7.4 (containing 6.86 gm sucrose/100 ml), at room temperature in the dark. After several rinses (3–5×, 15 min for each step) in 0.1 m PB the sections were stained en bloc with aqueous 1% uranyl acetate (1 hr in the dark). After several rinses they were dehydrated in an ascending series of ethanol (30 min for each step) and propylene oxide (2×, 10 min for each step) and then flat-embedded in Durcopan (Fluka, Neu-Ulm, Germany). Finally, the sections were polymerized at 60°C for 2–3 d.
From one flat-embedded vibratome section through the middle portion of the MNTB, serial ultrathin sections (∼70 nm in thickness, silver to light gray interference colors) were cut through the MNTB complex on a Reichardt Ultracut S (Leica) and collected on Formvar-coated slot copper grids. Of each of the 270 serial ultrathin sections, four to six electron micrographs of the calyx and the principal cell body were photographed at a primary magnification of 4500×. The micrographs were scanned at high resolution (1800 dpi) on a Zeiss SCAI scanner (Oberkochen, Germany). These images provided the basis for the subsequent three-dimensional morphological reconstruction of the presynaptic and postsynaptic structures.
For the reconstruction of the 52 individual SCs and associated synaptic vesicles, two Wistar rats (P9) were used. One rat brain was perfused transcardially, fixed, and processed according to the protocol described above; the other brain was perfused with a PB-buffered solution containing 1% paraformaldehyde, 2.5% glutaraldehyde, and 0.1% picric acid, pH 7.4. Vibratome sections of the MNTB complex were processed further according to a modified protocol originally developed by Phend et al. (1992).
Serial ultrathin sections (∼60 nm in thickness) through individual synapses were taken from different animals to check for inter-individual differences. Electron microscopic (EM) images were photographed at a primary magnification of 20,400×, and SCs were reconstructed from ultrathin sections taken from both osmium-treated (n = 32; 187 sections) and osmium-free (Phend et al., 1992) material (n = 20; 136 sections). No structural differences were found between the two EM preparations, and data sets were pooled. SCs were selected on the basis of their completeness and optimal angle of sectioning, i.e., perpendicular to the synaptic cleft.
Distinction between SCs and puncta adherentia. For the reconstruction of individual SCs (n = 52) only those membrane specializations were used that met the following three criteria: (1) presence of synaptic vesicles in close proximity to the presynaptic density, (2) an asymmetry between presynaptic and postsynaptic density, and (3) a widening of the synaptic cleft. For the complete reconstruction all membrane specializations that showed vesicle accumulations and met criterion 1 were classified as SCs. Because of the often nonideal orientation of the synaptic cleft to the plane of sectioning, criteria 2 and 3 applied in only 27% of all SCs. All other membrane specializations were classified as puncta adherentia (PA). A membrane specialization classified as SC had, on average, 10.6 ± 8.9 synaptic vesicles (mean ± SD) located within a distance of 50 nm to the AZ membrane. In a randomly chosen subset ofn = 50 PA, we found, on average, 0.6 ± 1.1 vesicles within 50 nm from the membrane specialization. The classification of PA versus SCs agreed among three observers in >98% of the cases.
Three-dimensional reconstruction. Three-dimensional reconstructions were made by alignment of serial EM images of the synaptic structure between a single calyx and its principal neuron with the use of a software tool named CAR (Contour Alignment Reconstruction; contact kurt.saetzler@iwr.uni-heidelberg.de) running on a Silicon Graphics computer, as described in detail previously (Sätzler, 2000, 2001). In brief, two successive sections were aligned via rotation and translation such that corresponding structures like mitochondria and membrane specializations in the two sections superimposed. To compensate for distortions introduced by the sectioning, we had to transform the images anisotropically and linearly. Alignment was followed by a contouring of membranes by visually defining markers. The subsequent linear interpolation between these markers resulted in a polygonal membrane “contour.” The three-dimensional geometry was reconstructed from the stacks of all contoured sections. By filling these stacks with tetrahedra (Boissonnat, 1988; Boissonnat and Geiger, 1992; Eils and Sätzler, 1999), we calculated volumes and surface areas of the presynaptic and postsynaptic structures of interest.
Data analysis. Surface area values were obtained by summing those triangular areas that formed the boundary of the reconstructed object. Accordingly, the volume of the object was determined as the sum of the volumes of all tetrahedra inside the object (Eils and Sätzler, 1999), which are directly proportional to the estimated section thickness. Varying the average section thickness in the reconstruction by 14% (assuming a mean thickness of 60 or 80 nm instead of the 70 nm used for the reconstruction) leads to the same variation in the reconstructed volume estimate. This represents also an upper bound of the error in surface area measurements introduced by variation of section thickness, although surface measurements are dependent on the real shape and the actual orientation of the reconstructed structure within the slices. For the structure of the reconstructed calyx, varying the section thickness by 14% results in a variation of the calyx surface area by 5%.
To estimate the number and size of SCs (or PA), we first marked all surface points on the three-dimensional reconstruction of the presynaptic cell membrane that were part of a SC (or PA). In a second step all those triangles of the surface of the calyx were labeled if at least two of the corner points were found to be part of a SC (or PA). In a final step the connected surface patches were defined as follows. Starting from a single, labeled triangle, all those triangles were taken to be connected that met the following criteria: (1) the triangle itself was labeled, and (2) the triangle had at least one side in common with a triangle of the surface patch. Performing this final step iteratively provided individual and connected surface patches defining single SCs (or PA). These surface patches were regrouped manually in part by inspecting the original EM images to compensate for “linking” errors introduced by locally misaligned sections. For each individual patch the surface area and the center of gravity were calculated. We compared this surface area estimate to the product of the summed contour length of a complete AZ and section thickness (two-dimensional estimate) in a subset of 12 perpendicular cut SCs. The two-dimensional estimate was 17% lower.
For simulations of nearest-neighbor distances between SCs or between PA we used the triangulated mesh of the contact area (see below), attributing contacts randomly to triangles with a probability proportional to their area. Each triangle could contribute to a contact only once. For the simulations we constrained the nearest-neighbor distances to be at least 100 nm for SCs and PA (similar to the measured values of the reconstructed calyx).
To estimate the cleft volume, we first extracted all those triangles from the reconstructed surface of the calyx and the cell body that were in close apposition to each other (<70 nm), which we named the contact area. We then estimated the mean cleft width by measuring the mean distance between presynaptic and postsynaptic membranes from the reconstruction (28 ± 9 nm, measured at n = 184,087 points), which was in good agreement with the cleft width measured directly in sections perpendicularly cut to the synaptic cleft (27 ± 4 nm; n = 1673). The product of mean distance and apposition area provided the estimate of the cleft volume.
The distribution of synaptic vesicles at AZs was determined in individual SCs (n = 52). In these contacts we traced the AZ and measured vesicle diameters at the middle of the membrane bilayer. All vesicle-to-AZ distances were determined by subtracting the radius of the vesicle from the distance between the center of gravity of each vesicle and the membrane trace of the AZ. This distance denotes a membrane-to-membrane distance.
When the number of docked or clustered vesicles is estimated, the correction factor for possible vesicle double counts according toAbercrombie (1946) would be ∼0.56. Because, however, we counted only those vesicles with a clear ring-like structure, this would cause an underestimate of the true number; therefore, the numbers reported in this study remain uncorrected.
The number of synaptic vesicles clustered at an AZ was determined by counting all vesicles within a 200 nm distance in sections in which the AZ could be seen. To correct for not including the vesicles located in sections directly adjacent to an AZ, we applied a correction factor of 1.3. This factor represents the ratio between the total intracellular volume within a 200 nm distance from a (idealized) planar circular AZ (radius, 178 nm) and the part of that volume contained in the analyzed sections.
Glutaraldehyde fixation and release. To estimate the amount of vesicular release that might occur during tissue fixation (Smith and Reese, 1980), we measured the presynaptic APs, EPSCs, and kainate-evoked synaptic currents during fixation of an acute MNTB slice preparation. Whole-cell recordings of principal cells and stimulation of afferent fibers were performed as described in detail previously (Borst and Sakmann, 1996). During fixation the afferently evoked EPSCs were abolished (Fig.1A, left) before the presynaptic action potentials or the sensitivity to kainate (Fig. 1A, right) was affected. In addition, the fixation was not accompanied by an increase in the frequency of spontaneous or delayed EPSCs (Fig. 1B). These results suggest that it is unlikely that the fixative induced a substantial change in the distribution of synaptic vesicles near the presynaptic membrane. The view that negligible vesicular release occurs during fixation also is supported by the fact that we did not observe large numbers of omega-shaped profiles at SCs in the EM images.
Fig. 1.
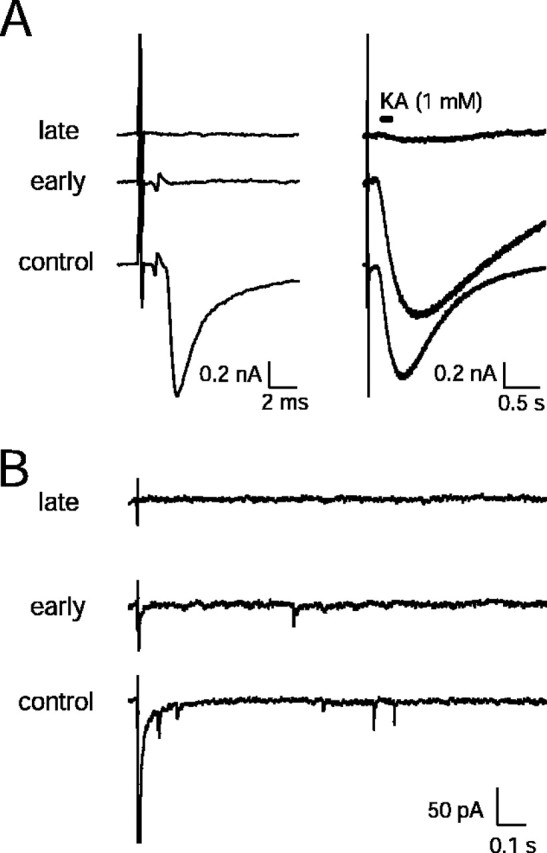
Transmitter release at a MNTB synapse during chemical fixation. A, Left, Afferently evoked prespikes (presynaptic AP recorded in postsynaptic cell) and EPSCs at three different time points during bath perfusion of the experimental chamber with fixatives (1% paraformaldehyde/2.5% glutaraldehyde, dissolved in Ringer's solution, pH 7.4). At bottom, the control is shown before fixation. The middle traces show ∼20 sec after the start of fixation and the top traces at ∼2 min after the start of fixation. A, Right, The same traces are shown at a lower time resolution, illustrating postsynaptic response to kainate (KA; 1 mm, dissolved in Ringer's), which was applied by pressure ejection from a nearby patch pipette. EPSCs were blocked before prespikes or before the sensitivity to KA was clearly changed (middle traces).B, Chemical fixation was not accompanied by an increase in spontaneous or delayed EPSCs. In this experiment fixatives were applied by pressure ejection from a nearby pipette. In thebottom trace before fixation the afferently evoked EPSC (amplitude, ∼1.5 nA at −80 mV) was followed by delayed and spontaneous EPSCs. In the middle trace early during the fixation both evoked EPSCs and spontaneous EPSCs were reduced. In thetop trace late during the fixation both evoked and spontaneous EPSCs were blocked. In A andB the traces have been offset vertically for display purposes.
RESULTS
General description and structures of interest
Figure 2A shows an EM cross section through the synapse between a calyx of Held and an MNTB principal neuron. The image represents a patchwork of five EM micrographs comprising the outlines of the calyx highlighted in yellow and the cell body of the principal neuron in blue, with its nucleus shown in brown. The calyx is a complex nerve terminal forming a cap with finger-like stalks that envelope the principal neuron. These presynaptic stalks could be followed over several micrometers along the surface of the cell body, sometimes approaching the opposite pole of the principal neuron where they terminate abruptly. The cup-like structure covered ∼40% of the ovoid soma of the principal neuron. The remaining surface area of the principal neuron was not studied in detail; however, some of the finger-like stalks appeared to be surrounded by glial processes. The thickness of the calyx was variable and mostly <1 μm. The diameter of the principal cell body was ∼22 μm in the longer and 18 μm in the shorter axis. The nucleus had an eccentric position, being located closer to the synaptic membrane. Figure 2B shows the two membrane specializations in the apposition zone between the calyx and postsynaptic membrane (marked region of Fig. 2A at higher magnification), which were classified as SCs (Fig 2, arrow) and PA (Fig. 2,arrowhead), as described in Materials and Methods.
Fig. 2.
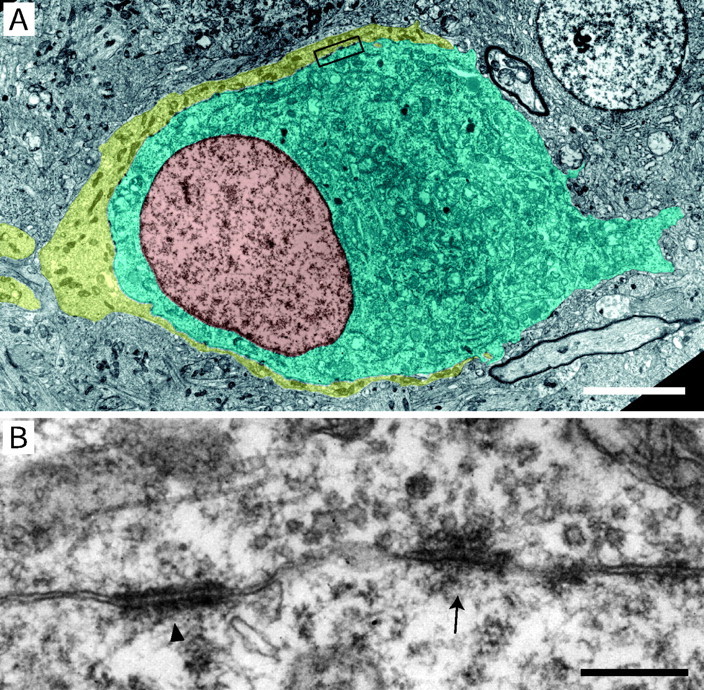
Cross section through a calyx of Held and a principal neuron in the MNTB. A, EM image of the nerve terminal and the cell body of the principal neuron in the MNTB. The image was obtained by a computer-aided montage of five electron micrographs of a single ultrathin section (imaged at a magnification of 3000×). The structures of interest were outlined and laid transparently over the montage; the presynaptic calyx is shown inyellow, the postsynaptic principal neuron inblue, and the nucleus in brown. Scale bar, 5 μm. B, The boxed region inA at higher magnification (imaged at 20,400×). The SC is marked by an arrow, and a neighboring PA is marked by an arrowhead. Scale bar, 0.3 μm.
The SCs are spread over the apposition zone between the cell body and the terminal, including the finger-like stalks. They are always characterized by a cluster of synaptic vesicles located in the proximity of the presynaptic density, asymmetric presynaptic and postsynaptic densities, and a broadening of the synaptic cleft (Fig.3). In their apposition zone the presynaptic and postsynaptic membranes show another membrane structure, which we refer to as PA. These have been described in the adult cat MNTB to be part of an organelle assembly named mitochondria-associated adherens complex (MAC) (Rowland et al., 2000). Figure4 shows a serial section through a PA.
Fig. 3.
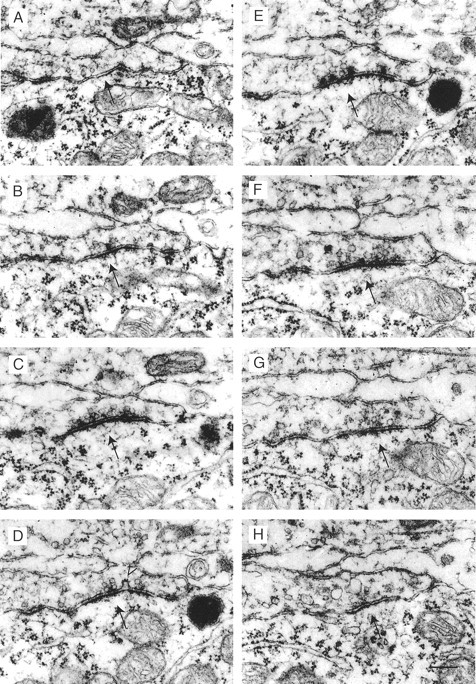
Serial section through a synaptic contact.A–H, Selected serial sections of a SC (arrow) between a presynaptic calyx and the postsynaptic principal neuron. The open arrowhead in Dpoints to a vesicle fused with the presynaptic membrane. Scale bar: (inH) A–H, 0.25 μm.
Fig. 4.
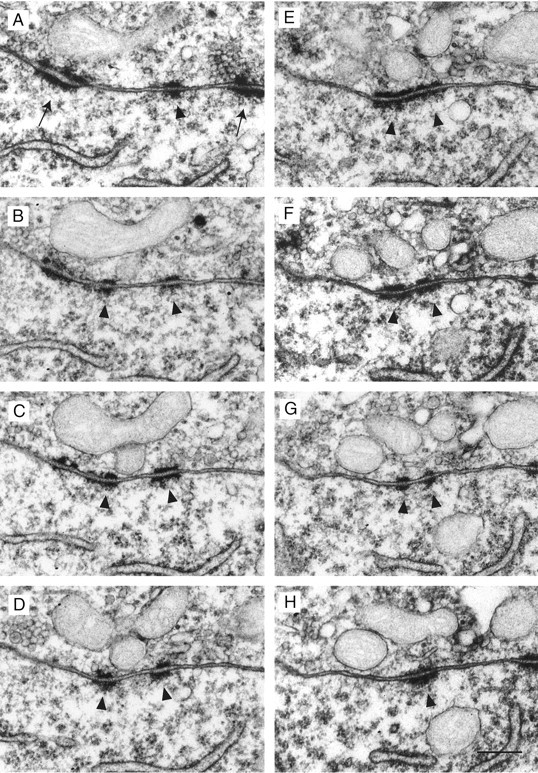
Serial section through a PA. A–H, Serial sections through a PA are shown. In A, two adjacent SCs are visible for a comparison of the two different types of membrane apposition. The PA is labeled by arrowheads, and SCs are labeled by arrows. In contrast to the SCs, the PA shows symmetric presynaptic and postsynaptic densities and lacks a synaptic vesicle accumulation and a widening of the cleft. The whole PA appears to be perforated, as seen in B–D, G. Scale bar: (in H) A–H, 0.25 μm.
Because the structure of the calyx changes during development from a cup- to a multifinger-like shape, we measured the mean thickness of the calyx at membrane specializations (MS), compared this value with the mean thickness measured at randomly chosen points, and found that the mean thickness of the calyx at MS is larger than the mean thickness at randomly chosen points. The difference was small but significant (MS, 790 ± 550 nm; random, 690 ± 550 nm; Student's ttest; p < 0.001).
Membrane specializations
Figures 3 and 4 show serial sections through specialized membrane contacts at high magnification. These were referred to as synaptic contacts (SCs) when synaptic vesicles were accumulated close to the presynaptic dense region (Fig.3A–H). The presynaptic and postsynaptic densities formed bands of electron-dense fuzzy material, and both densities were interrupted frequently, appearing as perforated structures. Regularly, dense material connecting the presynaptic and postsynaptic membranes was seen in the synaptic cleft. The SCs shown in Figure3A–H also exhibited a characteristic widening of the synaptic cleft and an asymmetry in the presynaptic and postsynaptic densities. At some SCs coated vesicles or endocytotic half-vesicles were located at the borders of AZs. Approximately one-third of the membrane specializations in the apposition zone were identified as SCs.
The more frequently occurring type of membrane specialization were PA (Rose et al., 1995). These were characterized by two parallel bands of electron-dense material of approximately the same width at the presynaptic and postsynaptic membranes (Fig.4A–H) but lacking synaptic vesicles and the wide broadening of the cleft typical for SCs.
In the entire calyx a total of 29 “spine-like” protrusions of the postsynaptic membrane was observed (Fig.5A,B). They resembled the somatic appendages or somatic spicules described by Tolbert and Morest (1982). In all, 32 SCs were located on these appendages. The protrusions were variable in size, and some of them lacked a spine neck whereas others were comparable with the “stubby” spines on dendrites of neocortical and hippocampal pyramidal neurons, although we never observed a spine apparatus.
Fig. 5.
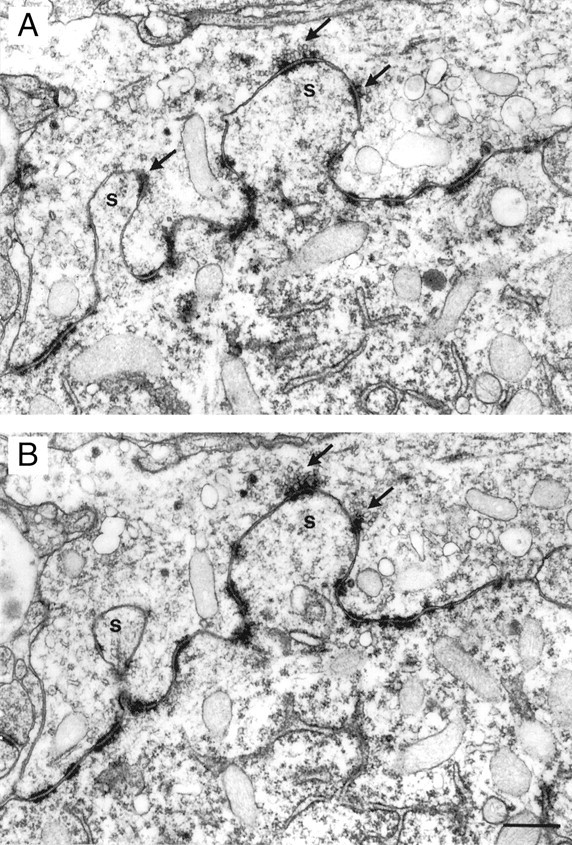
Spine-like protrusion at the soma of the principal neuron. A, B, Two successive EM images of sections through two typical spine-like membrane protrusions of the soma of the postsynaptic cell (labeled s). The protrusion on theleft has a narrow “spine neck.” Note the presence of SCs identified by the dense accumulation of synaptic vesicles (black arrows) and numerous PA. Only the SCs on spine-like protrusions are labeled. Scale bar, 0.5 μm.
Figure 6 shows a three-dimensional reconstruction of a spine-like protrusion with two AZs that are located opposite to each other at the neck. They are relatively large-sized and not perforated. The reconstruction of the volume and surfaces of such structures was made from stacks of contoured sections (Fig.6A) by filling the stacks with tetrahedra (Fig.6B).
Fig. 6.

A three-dimensional reconstruction from contoured sections. A, Superposition of contoured sections to form a “stack of contours” from serial EM images of a spine-like protrusion. The postsynaptic membrane is marked in blue, the AZs in red, and PSDs in orange. The two SCs are 0.5 μm apart. B, The stack of contours shown in A was filled by tetrahedra, which generates a triangulated surface (outlines oftriangles marked in gray). Section thickness, 60 nm.
Geometry of the synapse
Surfaces of calyx and cell body
Figure 7 shows three-dimensional surface views of the calyx and principal cell body obtained by surface reconstruction from a stack of 270 serial ultrathin sections with a thickness of ∼70 nm. The calyx is shown in yellow and the principal neuron in blue. The surface of the calyx and cell body is viewed from two sides by rotating the reconstruction around the horizontal axis (Fig. 7A,B). The calyx rests like a cup on the soma, covering ∼40% of the surface of the principal neuron. From the surface of the calyx numerous “finger-like” stalks enclose the cell body. In Figure 7C the postsynaptic membrane was made transparent to illustrate the eccentric location of the nucleus, positioned closer to the innervated membrane of the cell body.
Fig. 7.
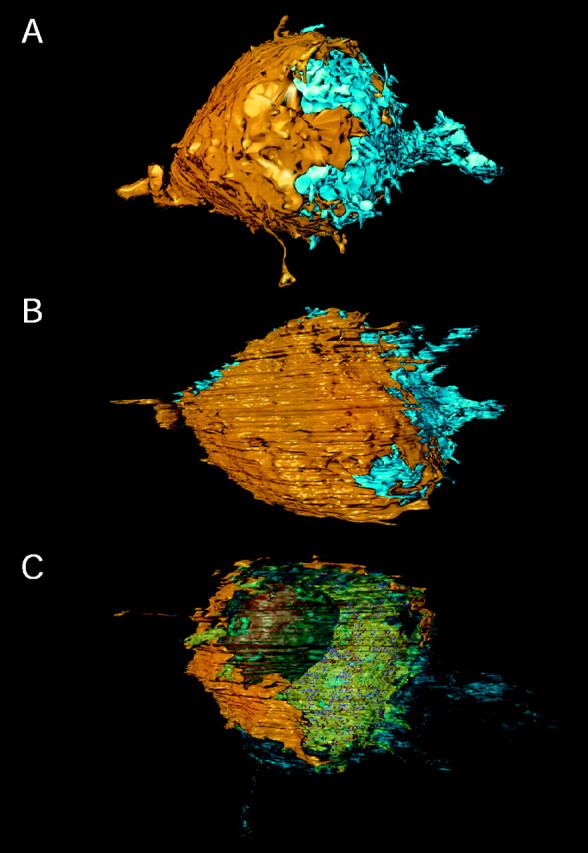
Surface views of the three-dimensional reconstruction of a calyx of Held and the principal neuron.A, Top view of the calyx and the cell body of the MNTB principal neuron. The calyx (left) is shown inyellow and the principal neuron (right) in blue. The nerve terminal forms a cup-like structure covering ∼40% of the surface area of the principal neuron. The final part of the preterminal axon that gives rise to the giant terminal is seen on the left. B, Side view after rotating the reconstruction by 90° around the x-axis. At the edges of the cap numerous finger-like stalks can be identified.C, Surface view of the reconstruction in which part of the surface membrane was made transparent to illustrate the eccentric location of the nucleus (brown) next to the calyx. The membrane specializations can be seen as small spots inred (SCs) and magenta (PA), respectively. The postsynaptic axon (bottom) and dendritic processes (right) were not reconstructed fully.
Volume and surface area of calyx and soma
The area of the plasma membrane surrounding the calyx, including both the apposition zone with the principal neuron and the noninnervating part of the membrane, was ∼2500 μm2. The calyceal membrane surrounded a volume of ∼480 μm3 or 0.48 pl. The area of the surface membrane of the principal cell body was 2400 μm2 of which ∼40% (1000 μm2) was apposed to the calyx. The volume of the cell body was ∼3400 μm3or 3.4 pl, more than sevenfold larger than the volume of the calyx (Table 1).
Table 1.
Geometry of a giant synapse in the MNTB
| Volume (μm3) | Surface (μm2) | |||
|---|---|---|---|---|
| Calyx | 477 | 2484 | ||
| Principal neuron | 3419 | 2443 | ||
| Nucleus | 711 | 526 | ||
| Areas (μm2) | Number | Total | Mean | SD |
| Apposition area | 1022 | |||
| AZ | 554 | 55.2 | 0.0996 | 0.0861 |
| PA | 1010 | 46.4 | 0.0459 | 0.0419 |
Volume of the synaptic cleft
The volume estimate of the cleft separating the two apposed surface membranes of calyx and soma depends on the degree of “smoothing” of the rugged surface created by triangulation of the contours between successive sections. Distortions of the surface were caused by variations in section thickness (we assumed an average thickness of 70 nm) and the sectioning procedure. The distribution of distances measured between the presynaptic and postsynaptic membrane shows that the mean distance was 28 ± 9 nm. This value, in combination with the area of the apposition zone, yields an extrapolated volume of 28.0 μm3 or 0.028 pl for the synaptic cleft separating presynaptic and postsynaptic cell, ∼20-fold smaller than the volume of the calyx.
Number and size of specialized contacts
Figure 8 illustrates a view onto the synaptic surface of the calyx. The locations of SCs (Fig.8A,C, red) and PA (Fig.8B,C, magenta) are indicated. The number of PA (n = 1010) was nearly twofold larger than that of SCs (n = 554). The specialized contact zones of the calyx and cell body membrane, not differentiating between SCs and PA, comprised an area of ∼100 μm2, which is ∼10% of the apposition area. Approximately one-half (55 μm2) of the specialized contact area was occupied by SCs and the other one-half (46 μm2) by PA, indicating that the SCs were larger, on average.
Fig. 8.
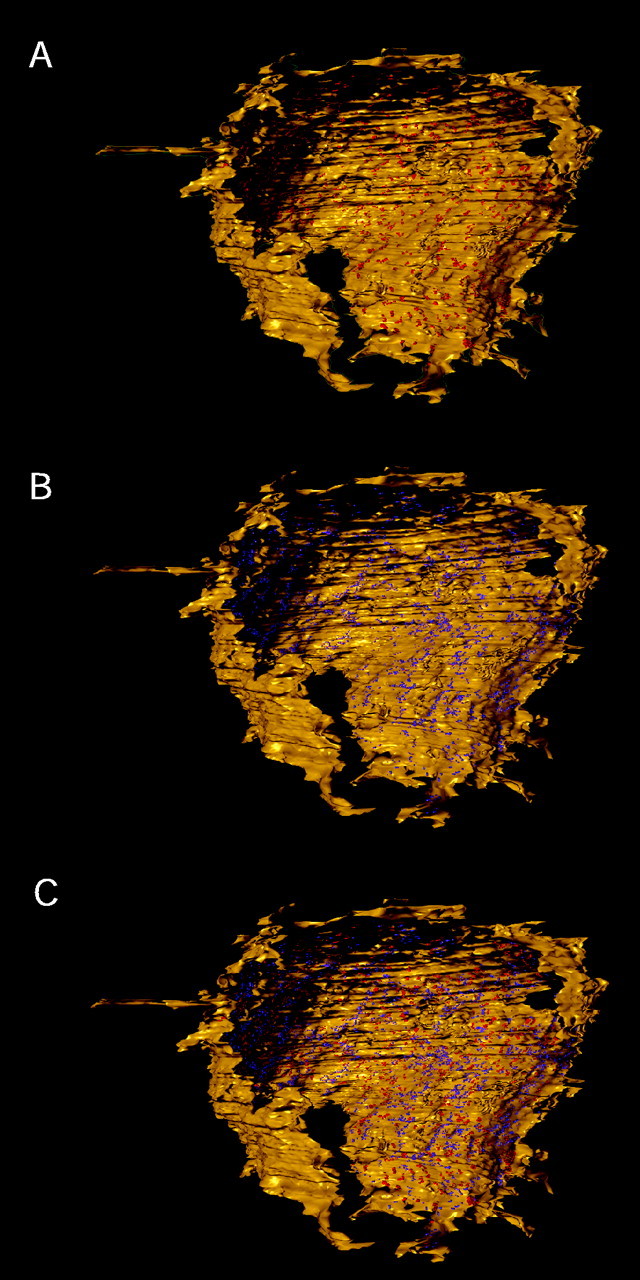
Distribution of membrane specializations in the apposition zone between the calyx and the principal neuron.A, En face view on the synaptic surface of the calyx (yellow) showing the distribution of SCs highlighted in red. B, Reconstruction of the same calyx surface as shown in A with the distribution of PA highlighted in magenta.C, Same view as in A and Bshowing an overlay of the distributions of SCs and PA. Same color code is used as in A and B.
The mean surface area of a SC was 0.100 μm2, and its size distribution was characterized by a large variability [coefficient of variation (CV) = 0.9] (Fig. 9A). The surface area of a PA had a mean of 0.046 μm2, approximately one-half of the size of the area of a SC. Their size distribution shows a similar degree of variability (CV = 0.9) (Fig. 9A).
Fig. 9.

Geometry of membrane specializations in the apposition zones between the calyx and the principal neuron.A, Histogram (left) of the distribution of surface areas of SCs (gray; mean 0.100 ± 0.086 μm2) and PA (black; mean 0.046 ± 0.042 μm2) and the corresponding cumulative histogram (right). Bin width, 0.01 μm2. B, Histogram of the distribution of nearest-neighbor distances between SCs marked ingray (mean, 0.589 ± 0.296 μm) and PA marked inblack (mean, 0.374 ± 0.179 μm). The right panel shows the corresponding cumulative histograms (same color code). Bin width, 0.02 μm. The dashed lines are nearest-neighbor distances taken from a simulated representation of SCs (dashed gray line) and PA (dashed black line), which were spread randomly across the apposition area of calyx and principal neuron.
Distance between specialized contacts
The average distance between nearest-neighbor SCs, measured from their center of gravity, varied widely between 0.15 and 1.3 μm, with a mean of 0.59 μm (CV = 0.5). The distribution of distances between a PA and its nearest neighbor indicates that PA were, as expected, more closely spaced, the mean nearest-neighbor distance between PA being 0.37 μm (CV = 0.5) (Fig. 9B).
To check whether SCs and PA were distributed homogeneously on the apposition zone, we simulated a distribution of points on the calyx membrane that represented the centers of gravity of SCs and PA, respectively. SCs and PA (numbers taken from measurements) were spread randomly across the apposition area. We then compared means and SDs of the distances between nearest-neighbor SCs and PA for the following combinations: distance from SC to closest SC (SC–SC) and closest PA (SC–PA), distance between PA and closest PA (PA–PA) and closest SC (PA–SC), and distance between membrane specializations irrespective of whether they are a SC or a PA (MS–MS). We compared these random distributions with the measured distributions by using a Kolmogorov–Smirnov (K–S) test to establish whether the simulated and measured distributions of nearest-neighbor distances were different (Press et al., 1992).
The results of the K–S test showed that the measured and simulated distributions of nearest-neighbor distances were significantly different for SC–SC distances (p = 0.01) and for all other combinations (p < 0.001) (Fig.9B, Table 2). This suggests that membrane specializations are not distributed randomly across the apposition area.
Table 2.
Simulation of nearest-neighbor distances between membrane specializations
| Distances (μm) | Measured | Simulated | |||
|---|---|---|---|---|---|
| Mean | SD | Mean | SD | K–S p | |
| SC–SC | 0.590 | 0.296 | 0.590 | 0.325 | 0.01 |
| SC–PA | 0.489 | 0.214 | 0.429 | 0.237 | <0.001 |
| PA–PA | 0.374 | 0.179 | 0.444 | 0.229 | <0.001 |
| PA–SC | 0.577 | 0.261 | 0.582 | 0.325 | <0.001 |
| MS–MS | 0.364 | 0.146 | 0.357 | 0.186 | <0.001 |
Presynaptic active zones
We attempted to identify subsets of synaptic vesicles as anatomical correlates for different pools of releasable quanta of transmitter as postulated from measurements of release rates (for review, see Schneggenburger et al., 2002). The total number of synaptic vesicles in the calyx and the average number of clustered synaptic vesicles at an AZ were estimated by measuring the number of vesicles located from the AZ within a specified distance of ∼500 and 200 nm, respectively. Furthermore, the number of “anatomically docked” vesicles was estimated by counting those vesicles in which no cytoplasmic space was visible between the vesicle and the AZ membranes (Fig. 10A–C). A total of 52 SCs was reconstructed, including the vesicles clustered at the AZs. Figure 10C shows an EM image of one representative section through a SC with a cluster of synaptic vesicles located in close proximity of the presynaptic density. The geometric quantities relating to the location and size of synaptic vesicles at an AZ in a section are indicated schematically in Figure 10D.
Fig. 10.
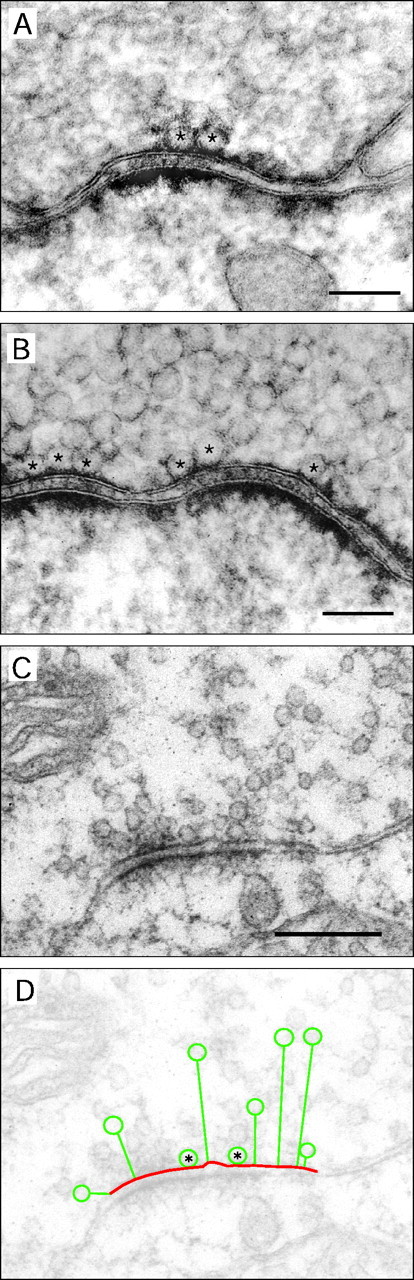
Quantification of synaptic vesicle cluster geometry at SCs. A, B, Two different SCs at high magnification with anatomically docked vesicles (marked byasterisks). Scale bar, 0.1 μm. C, Electron micrograph of another single SC showing the dense accumulation of synaptic vesicles at the AZ. Scale bars: C, D, 0.25 μm. D, Same micrograph as in C. Schematic representation of geometric measurements is shown for a subset of synaptic vesicles: AZ membrane (red line) and shortest distance (green straight lines) between the membrane of the synaptic vesicles (green circles) and the AZ membrane. Anatomically docked vesicles are marked by asterisks. All parameters were measured in two dimensions.
Clusters of synaptic vesicles
First we determined the number of synaptic vesicles that were found within a certain distance from the membrane of a given SC in all consecutive sections in which the SC could be identified. In the calyx cup-like compartment this distance was ∼500 nm, somewhat smaller than the mean thickness of the terminal in this region. Typically, four to five ultrathin sections were needed to reconstruct a SC and to determine the number of associated synaptic vesicles. Figure11A illustrates a three-dimensional reconstruction of a single SC in which the number of synaptic vesicles around an AZ could be determined unequivocally. Figure 11B shows two SCs located opposite to each other at a spine-like protrusion with the associated synaptic vesicles, illustrating that, in some cases, distinction between vesicles associated with different SCs is ambiguous. Extrapolating from the sample of 52 SCs, with on average 125 ± 82 synaptic vesicles, to the total number of AZs (n = 554), the calyx would contain at least 70,000 synaptic vesicles (Table3). More likely, the total number of synaptic vesicles in a calyx is somewhat higher because those located in sections adjacent to SCs and those not associated with SCs were not counted.
Fig. 11.

A three-dimensional reconstruction of SCs and associated vesicle clusters. A, Cluster of synaptic vesicles near a SC. The surface membrane of the principal neuron is shown in blue, the AZ in red, and synaptic vesicles in green. Note the large size of the pool of synaptic vesicles at this SC (n = 304).B, Two spine-like protrusions, one with two SCs (on theright). The SCs are located opposite to each other on the neck of the protrusion. Same color code is used as inA. Here the individual clusters of synaptic vesicles are not clearly discernible at these two SCs (n = 358).
Table 3.
Geometric quantities of the calyx relevant for release
| Measured | Extrapolated | |
|---|---|---|
| Number of AZs | 554 | |
| Average area of AZ (μm2) | 0.0996 | |
| Average area of synaptic vesicle (μm2) | 0.0067 | |
| Number of VDCCs open per AZ, if | ||
| VDCCs are distributed in the entire calyx membrane | 0.5 | |
| VDCCs are located in innervating calyx membrane | 1.25 | |
| VDCCs are located only in AZ membrane | 20 | |
| Number of synaptic vesicles in a calyx3-a | >70,000 | |
| Number of clustered vesicles within 200 nm of AZ in calyx | 45,000 | |
| Number of docked vesicles (<20 nm distance) in calyx | 2800 | |
| Number of docked vesicles (<10 nm distance) in calyx | 1100 |
The quantity measured at 52 AZs was extrapolated to 554 AZs of the complete reconstruction (mean areas of the two populations of SCs are not significantly different; Student's t test; p = 0.59). VDCC, Voltage-dependent calcium channel.
Approximately 50% of the synaptic vesicles were located within a distance of 200 nm from an AZ (data not shown). Because this distance is approximately one-half of the average distance between nearest-neighbor SCs, synaptic vesicles found within this distance were considered to form a “cluster” associated with the SC, as shown in one example (Fig.12A). Here, 28 synaptic vesicles of those shown (green) formed a cluster according to our 200 nm criterion (Fig. 12B), with the average nearest distance from the AZ membrane being 84 nm. The distribution of the number of synaptic vesicles (within a 200 nm distance cluster) measured for 52 SCs shows that each cluster comprises a mean of 63 ± 29 synaptic vesicles (Fig. 12C), which are located at an average distance of 87 ± 15 nm from an AZ, corresponding to approximately two vesicle diameters (see below). Extrapolation to 554 SCs and accounting for vesicles located in sections adjacent to the AZ (see Materials and Methods) suggest that in the calyx ∼45,000 synaptic vesicles were clustered around the AZs.
Fig. 12.
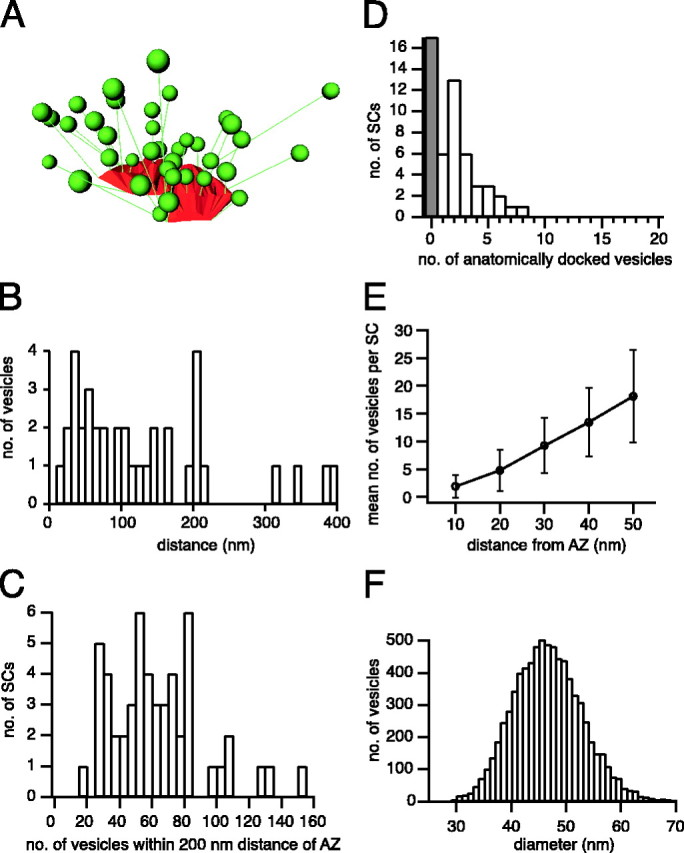
Geometry of synaptic vesicle clusters.A, Three-dimensional view of a single SC showing the distribution of distances of synaptic vesicles (green) from the AZ membrane (red). Distances are shown as linesconnecting a synaptic vesicle and the nearest point on the AZ. For clarity, a relatively small SC was chosen for display.B, Histogram of the distribution of distances of synaptic vesicles from the presynaptic membrane at the SC shown inA. The total number of synaptic vesicles was 37. The number of synaptic vesicles clustered within 200 nm was 28.C, Histogram showing the number of SCs with 0–4, 5–9, etc. synaptic vesicles within 200 nm from the AZ. D, Number of SCs with 0, 1, 2, etc. anatomically docked vesicles (i.e., no visible cytoplasmic space between synaptic vesicle and AZ membrane). The number of SCs lacking docked vesicles is represented by thegray column. E, Diagram showing the number of synaptic vesicles per SC (mean ± SD) located within a given distance from the AZ membrane. F, Histogram of the distribution of vesicle diameters (mean, 46 ± 7 nm;n = 7799).
Docked synaptic vesicles and vesicle size
Synaptic vesicles that are docked anatomically (Fig.10A,B,D, asterisks) to an AZ may represent a morphological correlate of the readily releasable pool (RRP) of quanta as estimated from EPSCs (Schneggenburger et al., 1999; Wu and Borst, 1999) and capacitance measurements (Sun and Wu, 2001). Figure12D illustrates the distribution of the number of anatomically docked vesicles. The number of docked vesicles increased with AZ area (rPearson = 0.62; data not shown). On average, 2.0 ± 2.0 synaptic vesicles were docked per SC (n = 104 for 52 SCs). We also analyzed the average number of synaptic vesicles located within a given distance from an AZ (10–50 nm) (Fig. 12E). The number of synaptic vesicles located within 10 nm from the AZ membrane (1.9 ± 2.0) was in good agreement with the number of anatomically docked vesicles. At larger distances from the AZ membrane this number increased from 4.8 ± 3.8 (within 20 nm) up to 18.1 ± 8.3 (within 50 nm).
The diameter of all analyzed synaptic vesicles was 46 ± 7 nm (Fig. 12F). We did not observe a significant difference in diameters of synaptic vesicles depending on their location or their distance from the AZ (data not shown).
DISCUSSION
Three-dimensional reconstruction of a calyx of Held revealed a structure composed of a cup with several fingers enveloping its postsynaptic target, as previously observed by light microscopy (Kandler and Friauf, 1993). The membrane area (2500 μm2) and volume (0.48 pl) of the reconstructed calyx corresponded well with estimates derived from measurements of capacitance (2400 μm2, which includes <30 μm of axon and assumes 10 fF/μm2) (Borst and Sakmann, 1998) and fluorescence (0.4 pl; Helmchen et al., 1997) of unfixed tissue from animals of the same age (P9). This similarity suggests that tissue fixation and sectioning did not distort overall morphology substantially.
The average surface area of an AZ was 0.100 μm2, which lies between the average size of AZs in the end bulb of Held of the juvenile rat (0.066 μm2; Nicol and Walmsley, 2002) and of the adult cat (0.14 μm2; Ryugo et al., 1997) and is somewhat larger than that in the adult cat calyx of Held (0.07 μm2; Rowland et al., 2000). In other mammalian CNS synapses smaller and larger values are observed (range, 0.03–0.14 μm2; Pierce and Mendell, 1993; Harris and Sultan, 1995; Schikorski and Stevens, 1999;Xu-Friedman et al., 2001). In most of these studies a preponderance of small AZs also was observed, suggesting that AZ size distribution is independent of the general morphology of the nerve terminal.
PA are not distributed randomly and may form focal adhesion complexes that stabilize the apposition of presynaptic and postsynaptic membranes. PA also have been reported in the mossy fiber→CA3 pyramidal cell synapse (Chicurel and Harris, 1992) and in the CA1 area of the hippocampus (Spacek and Harris, 1998).
Geometry of the calyx of Held as a determinant of release
A comparison of the number of Ca2+channels estimated to be open during an AP (∼12,000; Borst and Sakmann, 1996) and the number of SCs in the reconstructed calyx (554) suggests that, for each AZ, ∼20 channels open during the peak of the Ca2+ influx. This value is comparable with the numbers estimated for synaptic boutons in layer 2/3 pyramidal neurons (Koester and Sakmann, 2000). However, not all calcium channels are concentrated at AZs (Wu et al., 1999). A lower estimate is obtained if calcium channels are assumed to be distributed evenly over the entire calyx membrane. In this case only ∼0.5 channels would open per AZ, because the AZ area constitutes 2% of the total surface area (Table 3). The nearest-neighbor distance between open channels would be >400 nm. Such low estimates are not in agreement with the apparent low variance in the calcium signals controlling release (Borst and Sakmann, 1999; Meinrenken et al., 2002).
Quantal content of evoked EPSCs and number of SCs
The estimate of 554 SCs agrees well with the number of functional SCs estimated from fluctuation analysis of evoked EPSCs (Meyer et al., 2001). A single AP releases ∼200 quanta (Borst and Sakmann, 1996;Schneggenburger et al., 1999; Bollmann et al., 2000), suggesting that only ∼35% of all AZs release a packet of glutamate. Estimates of the size of the readily releasable pool (RRP) of vesicles vary between ∼800 (Schneggenburger et al., 1999; Wu and Borst, 1999; Bollmann et al., 2000) and up to ∼5000 (Sun and Wu, 2001). The differences are probably attributable to differences in the exact definition of the pool and to the methods used for estimating its size.
The morphological correlate for the RRP of quanta may be the number of anatomically docked vesicles, i.e., those vesicles being in direct contact with the AZ membrane (Schikorski and Stevens, 2001) (but seeXu-Friedman et al., 2001). In the present study the calyx had <1200 docked vesicles, in agreement with the lower estimates of the RRP size. If we assume, however, that synaptic vesicles located within 20 nm from the AZ can be released rapidly, the total number of available synaptic vesicles would be ∼3000, comparable with the midrange estimates of the RRP size (Schneggenburger and Neher, 2000; Sakaba and Neher, 2001). Although more direct experiments are needed to ascertain that vesicles located at >10 nm from the membrane can be released within 10 msec, the distance from the membrane could contribute to the heterogeneity in their apparent Ca2+ sensitivity (Sakaba and Neher, 2001).
For the largest estimate of the RRP (∼5000 releasable vesicles suggested by capacitance measurements) >8 vesicles per SC would be released within a few milliseconds. The observed capacitance increase of ∼0.4 pF (Sun and Wu, 2001) corresponds to an increase in the active zone size of 40 μm2, almost doubling the AZ area. Under such conditions the diffusional distance between synaptic vesicles and open calcium channels could be increased substantially, which would contribute to the lower release probability of releasable synaptic vesicles during recovery from synaptic depression (Wu and Borst, 1999; Meinrenken et al., 2002). On the other hand, a single AP will lead to an increase in the AZ area of <10%.
Properties of SCs at other CNS synapses
Synaptic contacts had, on average, 2.0 docked vesicles, whereas SCs in cerebellum, hippocampus, or cortex contain, on average, at least 10 docked vesicles (Harris and Sultan, 1995; Schikorski and Stevens, 1999; Xu-Friedman et al., 2001). The relatively high sensitivity of the release process to the fixatives, i.e., the rapid block of release during superfusion with fixative, argues against a substantial influence of the fixatives on synaptic vesicle distribution in the calyx, in agreement with previous results obtained in cultured neurons (Rosenmund and Stevens, 1997). We cannot exclude that the number of docked vesicles may increase during development, but in the calyx of Held in the adult cat or the end bulb of Held in the juvenile rat these numbers were also comparatively low (Rowland et al., 2000;Nicol and Walmsley, 2002). In most studies, including the present one, the number of docked vesicles varied greatly, with CVs typically ranging between 0.5 and 1.0. This variability may be explained in part by the large variability in AZ sizes, because large AZs generally have more docked vesicles (Schikorski and Stevens, 1999).
Geometry of PSDs and GluR channels
The estimated mean number of quanta released per AP (∼200; Borst and Sakmann, 1996) indicates that the distance between PSDs activated by released glutamate is 0.9 μm, on average, assuming random activation of SCs across the apposition zone. Therefore, cross-activation of GluR channels between different SCs is unlikely to shape the rising phase and peak of the EPSC during a single AP-evoked transmission. However, AMPA receptors (AMPARs) desensitize rapidly (Geiger et al., 1995), and simulations of the cleft diffusion of glutamate (A. Roth, unpublished data) indicate that during repetitive stimulation the distance could be short enough to cause GluR activation and/or desensitization by spillover from neighboring release sites (Otis et al., 1996). At experimentally induced maximal release rates this could cause an underestimate of the RRP measured from the EPSC amplitude (Sakaba and Neher, 2001; Sun and Wu, 2001).
Density of GluR channels
Approximately 20 AMPAR channels open during the peak of a quantal EPSC (Sahara and Takahashi, 2001). Assuming a peak open probability of 0.5 for AMPAR channels at saturating glutamate concentrations (Geiger et al., 1995; Koh et al., 1995), the number of functional channels per PSD would be ∼40. This is a lower limit considering that AMPARs may not be saturated during the release of a single quantum (Silver et al., 1996; Ishikawa et al., 2002). When distributed evenly across the PSD area (0.100 μm2), the density of functional AMPAR channels would be ∼400 μm−2 with a spacing of >40 nm. This estimate is comparable with an estimate of the functional AMPAR channel density of PSDs in CA1 and CA3 pyramidal neurons in rat hippocampus (Nusser et al., 1998).
NMDA receptor (NMDAR)-mediated peak current during an evoked EPSC is ∼4 nA at –80 mV in the absence of external magnesium (J. H. Bollmann, unpublished data). If we assume a channel conductance of ∼50 pS (Spruston et al., 1995; Clark et al., 1997), then ∼1000 NMDAR channels are open during the peak of the EPSC, suggesting that approximately five NMDAR channels open at each of the 200 PSDs. Because NMDAR occupancy and open probability depend on the subunit composition (Wyllie et al., 1998), which is not known, these estimates are speculative.
Thus at those PSDs exposed to a transmitter packet, ∼20–30 GluR channels are opened during the peak of the EPSC. The variability (CV = 0.9) of PSD area suggests that the variability in miniature EPSC amplitude (CV of ∼0.5) (Borst and Sakmann, 1996; Sahara and Takahashi, 2001) is attributable mostly to the variability in the number of AMPARs present at different SCs.
K.S. and L.F.S. contributed equally to this work.
We thank S. Nestel for her extraordinary skills in producing large series of ultrathin sections. We thank A. Roth for performing simulations of glutamate diffusion in the synaptic cleft and of AMPAR-mediated EPSCs. We also thank him, together with Drs. T. Kuner, C. Meinrenken, R. Schneggenburger, and J. Waters and Professor E. Neher, for critically reading a previous version of this manuscript. In addition, we thank M. Winter and I. Dehof for excellent technical assistance. Finally, we thank Professor W. Jäger and Drs. R. Eils and K. Saracoglu from the Interdisciplinary Center of Scientific Computing in Heidelberg for technical support and fruitful discussions.
Correspondence should be addressed to Bert Sakmann, Department of Cell Physiology, Max Planck Institute for Medical Research, Jahnstrasse 29, D-69120 Heidelberg, Germany.
REFERENCES
- 1.Abercrombie M. Estimation of nuclear population from microtome sections. Anat Rec. 1946;94:239–246. doi: 10.1002/ar.1090940210. [DOI] [PubMed] [Google Scholar]
- 2.Bertram R, Smith GD, Sherman A. Modeling study of the effects of overlapping Ca2+ microdomains on neurotransmitter release. Biophys J. 1999;76:735–750. doi: 10.1016/S0006-3495(99)77240-1. [DOI] [PMC free article] [PubMed] [Google Scholar]
- 3.Boissonnat JD. Shape reconstruction from planar cross sections. Comput Vis Graph Image Process. 1988;44:1–29. [Google Scholar]
- 4.Boissonnat JD, Geiger B (1992) Three-dimensional reconstruction of complex shapes based on the Delaunay triangulation. INRIA Technical Report 1697.
- 5.Bollmann JH, Sakmann B, Borst JGG. Calcium sensitivity of glutamate release in a calyx-type terminal. Science. 2000;289:953–957. doi: 10.1126/science.289.5481.953. [DOI] [PubMed] [Google Scholar]
- 6.Borst JGG, Sakmann B. Calcium influx and transmitter release in a fast CNS synapse. Nature. 1996;383:431–434. doi: 10.1038/383431a0. [DOI] [PubMed] [Google Scholar]
- 7.Borst JGG, Sakmann B. Calcium current during a single action potential in a large presynaptic terminal of the rat brainstem. J Physiol (Lond) 1998;506:143–157. doi: 10.1111/j.1469-7793.1998.143bx.x. [DOI] [PMC free article] [PubMed] [Google Scholar]
- 8.Borst JGG, Sakmann B. Effect of changes in action potential shape on calcium currents and transmitter release in a calyx-type synapse of the rat auditory brainstem. Philos Trans R Soc Lond B Biol Sci. 1999;354:347–355. doi: 10.1098/rstb.1999.0386. [DOI] [PMC free article] [PubMed] [Google Scholar]
- 9.Borst JGG, Helmchen F, Sakmann B. Pre- and postsynaptic whole-cell recordings in the medial nucleus of the trapezoid body of the rat. J Physiol (Lond) 1995;489:825–840. doi: 10.1113/jphysiol.1995.sp021095. [DOI] [PMC free article] [PubMed] [Google Scholar]
- 10.Casey MA, Feldman ML. Aging in the rat medial nucleus of the trapezoid body. II. Electron microscopy. J Comp Neurol. 1985;232:401–413. doi: 10.1002/cne.902320311. [DOI] [PubMed] [Google Scholar]
- 11.Chicurel ME, Harris KM. Three-dimensional analysis of the structure and composition of CA3 branched dendritic spines and their synaptic relationships with mossy fiber boutons in the rat hippocampus. J Comp Neurol. 1992;325:169–182. doi: 10.1002/cne.903250204. [DOI] [PubMed] [Google Scholar]
- 12.Clark BA, Farrant M, Cull-Candy SG. A direct comparison of the single-channel properties of synaptic and extrasynaptic NMDA receptors. J Neurosci. 1997;17:107–116. doi: 10.1523/JNEUROSCI.17-01-00107.1997. [DOI] [PMC free article] [PubMed] [Google Scholar]
- 13.del Castillo J, Katz B. Quantal components of the end-plate potential. J Physiol (Lond) 1954;124:560–573. doi: 10.1113/jphysiol.1954.sp005129. [DOI] [PMC free article] [PubMed] [Google Scholar]
- 14.del Castillo J, Katz B. Interaction at end-plate receptors between different choline derivatives. Proc R Soc Lond B Biol Sci. 1957;146:369–381. doi: 10.1098/rspb.1957.0018. [DOI] [PubMed] [Google Scholar]
- 15.Eils R, Sätzler K. Shape reconstruction from volumetric data. In: Jähne B, Haussecker H, Geissler P, editors. Handbook of computer vision and applications, Vol 2. Academic; San Diego: 1999. pp. 791–815. [Google Scholar]
- 16.Forsythe ID. Direct patch recording from identified presynaptic terminals mediating glutamatergic EPSCs in the rat CNS in vitro. J Physiol (Lond) 1994;479:381–387. doi: 10.1113/jphysiol.1994.sp020303. [DOI] [PMC free article] [PubMed] [Google Scholar]
- 17.Geiger JR, Melcher T, Koh DS, Sakmann B, Seeburg PH, Jonas P, Monyer H. Relative abundance of subunit mRNAs determines gating and Ca2+ permeability of AMPA receptors in principal neurons and interneurons in rat CNS. Neuron. 1995;15:193–204. doi: 10.1016/0896-6273(95)90076-4. [DOI] [PubMed] [Google Scholar]
- 18.Harris KM, Sultan P. Variation in the number, location, and size of synaptic vesicles provides an anatomical basis for the nonuniform probability of release at hippocampal CA1 synapses. Neuropharmacology. 1995;34:1387–1395. doi: 10.1016/0028-3908(95)00142-s. [DOI] [PubMed] [Google Scholar]
- 19.Held H (1898) Die centrale Gehörleitung. Arch Anat Physiol, Anat Abt 201–248.
- 20.Helmchen F, Borst JGG, Sakmann B. Calcium dynamics associated with a single action potential in a CNS presynaptic terminal. Biophys J. 1997;72:1458–1471. doi: 10.1016/S0006-3495(97)78792-7. [DOI] [PMC free article] [PubMed] [Google Scholar]
- 21.Ishikawa T, Sahara Y, Takahashi T. A single packet of transmitter does not saturate postsynaptic glutamate receptors. Neuron. 2002;34:613–621. doi: 10.1016/s0896-6273(02)00692-x. [DOI] [PubMed] [Google Scholar]
- 22.Kandler K, Friauf E. Pre- and postnatal development of efferent connections of the cochlear nucleus in the rat. J Comp Neurol. 1993;328:161–184. doi: 10.1002/cne.903280202. [DOI] [PubMed] [Google Scholar]
- 23.Katz B. The release of neural transmitter substances: the Sherrington lectures. Thomas; Springfield, IL: 1969. [Google Scholar]
- 24.Koester HJ, Sakmann B. Calcium dynamics associated with action potentials in single nerve terminals of pyramidal cells in layer 2/3 of the young rat neocortex. J Physiol (Lond) 2000;529:625–646. doi: 10.1111/j.1469-7793.2000.00625.x. [DOI] [PMC free article] [PubMed] [Google Scholar]
- 25.Koh DS, Geiger JR, Jonas P, Sakmann B. Ca2+-permeable AMPA and NMDA receptor channels in basket cells of rat hippocampal dentate gyrus. J Physiol (Lond) 1995;485:383–402. doi: 10.1113/jphysiol.1995.sp020737. [DOI] [PMC free article] [PubMed] [Google Scholar]
- 26.Lenn NJ, Reese TS. The fine structure of nerve endings in the nucleus of the trapezoid body and the ventral cochlear nucleus. Am J Anat. 1966;118:375–389. doi: 10.1002/aja.1001180205. [DOI] [PubMed] [Google Scholar]
- 27.Meinrenken CJ, Borst JGG, Sakmann B. Calcium secretion coupling at calyx of Held governed by nonuniform channel–vesicle topography. J Neurosci. 2002;22:1648–1667. doi: 10.1523/JNEUROSCI.22-05-01648.2002. [DOI] [PMC free article] [PubMed] [Google Scholar]
- 28.Meyer AC, Neher E, Schneggenburger R. Estimation of quantal size and number of functional active zones at the calyx of Held synapse by nonstationary EPSC variance analysis. J Neurosci. 2001;21:7889–7900. doi: 10.1523/JNEUROSCI.21-20-07889.2001. [DOI] [PMC free article] [PubMed] [Google Scholar]
- 29.Nakajima Y. Fine structure of the medial nucleus of the trapezoid body of the bat with special reference to two types of synaptic endings. J Cell Biol. 1971;50:121–134. doi: 10.1083/jcb.50.1.121. [DOI] [PMC free article] [PubMed] [Google Scholar]
- 30.Nicol MJ, Walmsley B. Ultrastructural basis of synaptic transmission between endbulbs of Held and bushy cells in the rat cochlear nucleus. J Physiol (Lond) 2002;539:713–723. doi: 10.1113/jphysiol.2001.012972. [DOI] [PMC free article] [PubMed] [Google Scholar]
- 31.Nusser Z, Lujan R, Laube G, Roberts JD, Molnar E, Somogyi P. Cell type and pathway dependence of synaptic AMPA receptor number and variability in the hippocampus. Neuron. 1998;21:545–559. doi: 10.1016/s0896-6273(00)80565-6. [DOI] [PubMed] [Google Scholar]
- 32.Otis TS, Wu YC, Trussell LO. Delayed clearance of transmitter and the role of glutamate transporters at synapses with multiple release sites. J Neurosci. 1996;16:1634–1644. doi: 10.1523/JNEUROSCI.16-05-01634.1996. [DOI] [PMC free article] [PubMed] [Google Scholar]
- 33.Petelina EV. The ultrastructure of synapses in the nucleus of the trapezoid body of the bat. Arkh Anat Gistol Embriol. 1975;68:14–18. [PubMed] [Google Scholar]
- 34.Phend KD, Weinberg RJ, Rustioni A. Techniques to optimize post-embedding single and double staining for amino acid neurotransmitters. J Histochem Cytochem. 1992;40:1011–1020. doi: 10.1177/40.7.1376741. [DOI] [PubMed] [Google Scholar]
- 35.Pierce JP, Mendell LM. Quantitative ultrastructure of Ia boutons in the ventral horn: scaling and positional relationships. J Neurosci. 1993;13:4748–4763. doi: 10.1523/JNEUROSCI.13-11-04748.1993. [DOI] [PMC free article] [PubMed] [Google Scholar]
- 36.Press WH, Teukolsky SA, Vetterling WT, Flanery BP. Numerical recipes in C. Cambridge UP; Cambridge: 1992. Statistical description of data. pp. 609–655. [Google Scholar]
- 37.Rose O, Grund C, Reinhardt S, Starzinski-Powitz A, Franke WW. Contactus adherens, a special type of plaque-bearing adhering junction containing M-cadherin, in the granule cell layer of the cerebellar glomerulus. Proc Natl Acad Sci USA. 1995;92:6022–6026. doi: 10.1073/pnas.92.13.6022. [DOI] [PMC free article] [PubMed] [Google Scholar]
- 38.Rosenmund C, Stevens CF. The rate of aldehyde fixation of the exocytotic machinery in cultured hippocampal synapses. J Neurosci Methods. 1997;76:1–5. doi: 10.1016/s0165-0270(97)00061-7. [DOI] [PubMed] [Google Scholar]
- 39.Rowland KC, Irby NK, Spirou GA. Specialized synapse-associated structures within the calyx of Held. J Neurosci. 2000;20:9135–9144. doi: 10.1523/JNEUROSCI.20-24-09135.2000. [DOI] [PMC free article] [PubMed] [Google Scholar]
- 40.Ryugo DK, Pongstaporn T, Huchton DM, Niparko JK. Ultrastructural analysis of primary endings in deaf white cats: morphologic alterations in endbulbs of Held. J Comp Neurol. 1997;385:230–244. doi: 10.1002/(sici)1096-9861(19970825)385:2<230::aid-cne4>3.0.co;2-2. [DOI] [PubMed] [Google Scholar]
- 41.Sahara Y, Takahashi T. Quantal components of the excitatory postsynaptic currents at a rat central auditory synapse. J Physiol (Lond) 2001;536:189–197. doi: 10.1111/j.1469-7793.2001.00189.x. [DOI] [PMC free article] [PubMed] [Google Scholar]
- 42.Sakaba T, Neher E. Quantitative relationship between transmitter release and calcium current at the calyx of Held synapse. J Neurosci. 2001;21:462–476. doi: 10.1523/JNEUROSCI.21-02-00462.2001. [DOI] [PMC free article] [PubMed] [Google Scholar]
- 43.Sätzler K (2000) 3-D Rekonstruktion von elektronenmikroskopischen Serienschnitten. Naturwissenschaftlich-Mathematische Gesamtfakultät der Universität Heidelberg.
- 44. Sätzler K. 3-D Rekonstruktion von Serienschnitten. Forschung und wissenschaftliches Rechnen, Beiträge zum Heinz-Billing-Preis 2000 Plesser T, Hayd H. 2001. GWDG-Bericht 56:31–47.
- 45.Schikorski T, Stevens CF. Quantitative fine-structural analysis of olfactory cortical synapses. Proc Natl Acad Sci USA. 1999;96:4107–4112. doi: 10.1073/pnas.96.7.4107. [DOI] [PMC free article] [PubMed] [Google Scholar]
- 46.Schikorski T, Stevens CF. Morphological correlates of functionally defined synaptic vesicle populations. Nat Neurosci. 2001;4:391–395. doi: 10.1038/86042. [DOI] [PubMed] [Google Scholar]
- 47.Schneggenburger R, Neher E. Intracellular calcium dependence of transmitter release rates at a fast central synapse. Nature. 2000;406:889–893. doi: 10.1038/35022702. [DOI] [PubMed] [Google Scholar]
- 48.Schneggenburger R, Meyer AC, Neher E. Released fraction and total size of a pool of immediately available transmitter quanta at a calyx synapse. Neuron. 1999;23:399–409. doi: 10.1016/s0896-6273(00)80789-8. [DOI] [PubMed] [Google Scholar]
- 49.Schneggenburger R, Sakaba T, Neher E. Vesicle pools and short-term synaptic depression: lessons from a large synapse. Trends Neurosci. 2002;25:206–212. doi: 10.1016/s0166-2236(02)02139-2. [DOI] [PubMed] [Google Scholar]
- 50.Silver RA, Cull-Candy SG, Takahashi T. Non-NMDA glutamate receptor occupancy and open probability at a rat cerebellar synapse with single and multiple release sites. J Physiol (Lond) 1996;494:231–250. doi: 10.1113/jphysiol.1996.sp021487. [DOI] [PMC free article] [PubMed] [Google Scholar]
- 51.Smith GD. Modeling local and global calcium signals using reaction diffusion equations. In: Schutter ED, editor. Computational neuroscience. CRC; Boca Raton, FL: 2001. pp. 49–85. [Google Scholar]
- 52.Smith JE, Reese TS. Use of aldehyde fixatives to determine the rate of synaptic transmitter release. J Exp Biol. 1980;89:19–29. doi: 10.1242/jeb.89.1.19. [DOI] [PubMed] [Google Scholar]
- 53.Smith PH, Joris PX, Yin TCT. Anatomy and physiology of principal cells of the medial nucleus of the trapezoid body (MNTB) of the cat. J Neurophysiol. 1998;79:3127–3142. doi: 10.1152/jn.1998.79.6.3127. [DOI] [PubMed] [Google Scholar]
- 54.Spacek J, Harris KM. Three-dimensional organization of cell adhesion junctions at synapses and dendritic spines in area CA1 of the rat hippocampus. J Comp Neurol. 1998;393:58–68. doi: 10.1002/(sici)1096-9861(19980330)393:1<58::aid-cne6>3.0.co;2-p. [DOI] [PubMed] [Google Scholar]
- 55.Spruston N, Jonas P, Sakmann B. Dendritic glutamate receptor channels in rat hippocampal CA3 and CA1 pyramidal neurons. J Physiol (Lond) 1995;482:325–352. doi: 10.1113/jphysiol.1995.sp020521. [DOI] [PMC free article] [PubMed] [Google Scholar]
- 56.Sun JY, Wu LG. Fast kinetics of exocytosis revealed by simultaneous measurements of presynaptic capacitance and postsynaptic currents at a central synapse. Neuron. 2001;30:171–182. doi: 10.1016/s0896-6273(01)00271-9. [DOI] [PubMed] [Google Scholar]
- 57.Takahashi T, Forsythe ID, Tsujimoto T, Barnes-Davies M, Onodera K. Presynaptic calcium current modulation by a metabotropic glutamate receptor. Science. 1996;274:594–597. doi: 10.1126/science.274.5287.594. [DOI] [PubMed] [Google Scholar]
- 58.Tolbert LP, Morest DK. The neuronal architecture of the anteroventral cochlear nucleus of the cat in the region of the cochlear nerve root: electron microscopy. Neuroscience. 1982;7:3053–3067. doi: 10.1016/0306-4522(82)90229-9. [DOI] [PubMed] [Google Scholar]
- 59.Wu LG, Borst JGG. The reduced release probability of releasable vesicles during recovery from short-term synaptic depression. Neuron. 1999;23:821–832. doi: 10.1016/s0896-6273(01)80039-8. [DOI] [PubMed] [Google Scholar]
- 60.Wu LG, Westenbroek RE, Borst JGG, Catterall WA, Sakmann B. Calcium channel types with distinct presynaptic localization couple differentially to transmitter release in single calyx-type synapses. J Neurosci. 1999;19:726–736. doi: 10.1523/JNEUROSCI.19-02-00726.1999. [DOI] [PMC free article] [PubMed] [Google Scholar]
- 61.Wyllie DJA, Behe P, Colquhoun D. Single channel activations and concentration jumps: comparison of recombinant NR1a/NR2A and NR1a/NR2D NMDA receptors. J Physiol (Lond) 1998;510:1–18. doi: 10.1111/j.1469-7793.1998.001bz.x. [DOI] [PMC free article] [PubMed] [Google Scholar]
- 62.Xu-Friedman MA, Harris KM, Regehr WG. Three-dimensional comparison of ultrastructural characteristics at depressing and facilitating synapses onto cerebellar Purkinje cells. J Neurosci. 2001;21:6666–6672. doi: 10.1523/JNEUROSCI.21-17-06666.2001. [DOI] [PMC free article] [PubMed] [Google Scholar]
- 63.Yamada WM, Zucker RS. Time course of transmitter release calculated from simulations of a calcium diffusion model. Biophys J. 1992;61:671–682. doi: 10.1016/S0006-3495(92)81872-6. [DOI] [PMC free article] [PubMed] [Google Scholar]