

Abstract
Synaptic short-term plasticity is considered to result from multiple cellular mechanisms, which may include presynaptic and postsynaptic contributions. We have recently developed a nonstationary EPSC fluctuation analysis (Scheuss and Neher, 2001) to estimate synaptic parameters and their transient changes during short-term synaptic plasticity. Extending the classical variance–mean approach, a short train of stimuli is applied repetitively, and the resulting EPSCs are analyzed for means, variances, and covariances. This provides estimates of the quantal size and quantal content for each EPSC in the train, and furthermore, an estimate of the number of release sites. The latter is less sensitive to heterogeneity in the release probability than that of the variance–mean approach. Here, we applied this analysis to the calyx of Held synapse in brainstem slices of young rats (postnatal day 8–10). We found significant negative covariance in the amplitude of successive EPSCs in a train. The analysis showed that the 10-fold depression in the EPSC amplitude during 100 Hz trains at elevated extracellular Ca2+ concentration resulted from a 2.5-fold reduction in quantal size caused by postsynaptic AMPA receptor desensitization and saturation, and a fourfold reduction in quantal content, which was partially relieved by application of cyclothiazide. The number of release sites estimated by covariance analysis was ≈2000 and significantly larger than estimates from variance–mean parabolas.
Keywords: synaptic transmission, short-term plasticity, quantal analysis, covariance analysis, release site, release probability, quantal size
Short-term synaptic plasticity is considered as an important element of information processing in neuronal circuits (Abbott et al., 1997; Tsodyks and Markram, 1997). Multiple cellular mechanisms have to be considered to contribute to synaptic short-term plasticity. Because these act most likely simultaneously and in parallel (Zucker, 1989; Fisher et al., 1997), their individual contributions cannot readily be studied in separation. Especially at synapses with large quantal contents, presynaptic and postsynaptic contributions to short-term plasticity are difficult to separate. Ideally, one would like to obtain independent measures of the number of released quanta (quantal content) and of the average quantal size to indicate presynaptic and postsynaptic efficacy of synaptic transmission, respectively. These parameters can, in principle, be provided by fluctuation or quantal analysis of EPSC amplitudes. However, variance–mean analysis according to a binomial model of synaptic transmission (for review, see Clements and Silver, 2000) has so far mainly been applied to steady-state sequences recorded under a variety of conditions (Silver et al., 1998; Reid and Clements, 1999;Oleskevich et al. 2000). Sequences of double pulses (Oleskevich et al., 2000) and repetitive trains of stimuli (Clamann et al., 1989; Meyer et al., 2001) have also been used, but no analysis dedicated to short-term plasticity in such nonstationary cases was presented.
We have recently derived a theoretical framework for a nonstationary EPSC fluctuation analysis (Scheuss and Neher, 2001), where the covariance in the amplitude of successive EPSCs in short, repetitively applied trains of stimuli is considered in addition to their variances and means. This allows to determine the quantal size and quantal content for each EPSC in the stimulus train. Furthermore, it provides an estimate of the number of release sites, which is less sensitive to heterogeneity in the release probability than the estimates obtained by the classical variance–mean approach (Scheuss and Neher, 2001).
Here we applied nonstationary EPSC fluctuation analysis to synaptic transmission at the calyx of Held. Among other synapses (e.g., climbing fiber/Purkinje cell synapses, Silver et al., 1998; dentate gyrus basket cell/granule cell synapses, Kraushaar and Jonas, 2000), the calyx of Held provides important prerequisites for a successful quantal or fluctuation analysis (Korn and Faber, 1991; Walmsley, 1993; Forsythe et al., 1995). At this synapse, presynaptic as well as postsynaptic components of depression have already been reported (Borst et al., 1995; von Gersdorff et al., 1997; Schneggenburger et al., 1999; Sakaba and Neher 2001). We induced strong depression at this synapse by applying 100 Hz trains of action potentials (APs) at elevated Ca2+ concentration and determined the relative contributions of presynaptic and postsynaptic mechanisms by this new method of nonstationary fluctuation analysis. Moreover, we asked the question how the covariance-based estimates of release sites relate to other estimates of the binomial parameter N and to the total number of vesicles that can be synchronously released during trains of APs.
MATERIALS AND METHODS
Electrophysiological recordings. Brainstem slices were prepared from 8- to 10-d-old Wistar rats after decapitation without anesthesia, following institutional guidelines. We cut 200-μm-thick slices in ice-cold bicarbonate buffered solution (BBS), containing (in mm): NaCl 125, KCl 2.5, MgCl2 3, CaCl2 0.1, NaHCO3 25, NaH2PO4 1.25, ascorbic acid 0.4, myo-inositol 3, and Na-pyruvate 2, pH 7.4, when bubbled with carbogen (95% O2 and 5% CO2). Recordings were performed at room temperature (21–24°C). The standard external recording solution was a BBS, which contained 4 mmCaCl2, 1 mmMgCl2 and 50 μmd(−)-2-amino-5-phosphonopentanoic acid (DAP-5). In some experiments, 100 μm cyclothiazide (CTZ) and 1 mm kynurenic acid (KYN) were applied. Postsynaptic cells were visualized with infrared gradient contrast illumination (Luigs and Neumann, Ratingen, Germany) through a 60× water-immersion objective on an upright microscope (Axioskop; Zeiss, Oberkochen Germany). EPSCs were evoked by afferent fiber stimulation using bipolar platinum electrodes and recorded at −80 mV holding potential (not corrected for liquid junction potential) with an EPC-9 patch-clamp amplifier (Heka, Lambrecht, Pfalz, Germany). The pipette solution contained (in mm): Cs-gluconate 130, TEA-Cl 20, HEPES 10, Na-phosphocreatine 5, Mg-ATP 4, GTP 0.3, and 5 EGTA, pH 7.2, 295–300 mOsm. The open tip resistance was 2–4 MΩ. During whole-cell recording, we applied 50–85% series resistance (Rs) compensation, such that the uncompensated Rs never exceeded 3 MΩ. Rs tended to increase during recordings, and the Rs compensation was readjusted. The range of Rsaccepted for analysis was 4–12 MΩ before compensation (in exceptions 20 MΩ). Currents were sampled at 50 kHz and filtered at 6 kHz.
Nonstationary fluctuation analysis. Routines for analysis were written and executed with the software IgorPro (WaveMetrics, Lake Oswego, OR). As a first step of the analysis, digitized current traces were compensated off-line for Rserrors (Traynelis, 1998), assuming a reversal potential of +10 mV for the EPSCs (Meyer et al., 2001). EPSC amplitudes were determined as difference between peak and baseline current. Peak detection was based on analyzing first and second derivatives. The baseline current was determined as average current over an interval of 0.2–0.5 msec directly preceding the EPSC in case of recordings under control conditions. In the presence of CTZ, double exponentials were fitted to the decay phase of the preceding EPSC, and the baseline current was taken as the extrapolation of that fit to the time of the peak of the actual EPSC.
For estimating synaptic parameters during short-term plasticity, nonstationary fluctuation analysis evaluates the ensemble mean and variance of each EPSC (pair of successive EPSCs in the case of covariance) in a short, repetitively applied train of stimuli (Fig.1A) (Scheuss and Neher, 2001). Corresponding responses in different trains represent identical conditions, if sufficient recovery time between such trains is allowed (10 sec in our experiments). A typical data set consisted of ∼70 repetitions of 100 Hz trains with five stimuli each. The stability of the obtained data were assessed by fitting a straight line to the amplitudes of the first stimulus in the train plotted versus repetition number (Fig. 1B). For analysis, data sets were chosen which displayed <20% change in the regression line (compareOleskevich et al., 2000). The ensemble meani of theith EPSC amplitudeIi,r in the train was determined according to:
| Equation 1 |
where r denotes the individual repetition andR the total number of trains. EPSC amplitudesIi,r were measured as described above. To minimize contamination of the variance and covariance estimates by long-term trends or drifts, it is advantageous to compute the statistical parameters first within small sets of sequential records and to average these subsequently to provide the mean of the parameter (Clamann et al., 1989; Scheuss and Neher, 2001). Most effective suppression of trends and drifts is achieved by using small sets of sequential records. We chose sets of two sequential records for this analysis and accordingly the ensemble variance of the amplitude of theith EPSC was calculated by:
| Equation 2 |
and the ensemble covariance of the amplitudes of successive EPSCs i and i + 1 by:
| Equation 3 |
The SDs of the statistical parameters determined this way were estimated as given in Scheuss and Neher (2001).
Fig. 1.

Nonstationary variance–mean analysis of EPSCs under control conditions. A, Example traces of trains of five EPSCs at 100 Hz, recorded every 10 sec at 4 mm [Ca2+] and a holding potential of −80 mV, after off-line correction for remaining access resistance (Rs) errors (see Materials and Methods). For nonstationary analysis, ensemble mean and variance of the peak amplitude were calculated for each EPSC in the train by summation over all train repetitions r (Eqs. 1, 2).B, Amplitudes of all EPSCs in a train (except fourth for better visibility) plotted versus train repetition number (r = 79 trains; repeated every 10 sec) show the trial-to-trial fluctuation in peak amplitude. Leak current (continuous line) and Rs(broken line) are shown in the bottom part of the panel. A regression line fitted to the time dependence of first EPSC amplitudes reveals a change of −5.6% during the whole data set. C, EPSC amplitude variance–mean plot: a parabola passing through the origin and the data from first and second EPSCs was drawn (q* = 24.3 ± 10.1 pA; Nvar = 695 ± 982; mean ± SD). The variance for third to fifth EPSC lies below this parabola. A linear fit to the data from third to fifth EPSC yields q*line = 10.2 ± 1.2 pA (mean ± SD). D, EPSC amplitude variance–mean mean plot: a line can be placed through the data from first and second EPSC (q* andNvar as above; continuous line). The data from third to fifth response do not fall on this line, indicating a reduction in quantal size, which causes the data points to lie on a family of lines of identical slope but reducedy-axis intercept (e.g., broken line). InC and D, error bars indicate SD.
Synaptic parameters are estimated from the mean, variance, and covariance of EPSC amplitudes based on a binomial model for transmitter release (Vere-Jones, 1966; Zucker, 1973; Zucker, 1989;Quastel, 1997), assuming that release occurs from Nindependent sites. We assume that a release site has maximally one vesicle docked and releases one vesicle or none per stimulus with some release probability. Because morphologically defined active zones at various CNS excitatory synapses were found to have more than one docked vesicle (Schikorski and Stevens, 1997; Xu-Friedman et al., 2001), we consider an active zone as a group of release sites (see Discussion). The release probability after stimulus i (within a train) is assumed to be the product of the vesicular availabilitypAi and the output probabilitypOi at a site. A single released vesicle causes a quantal current qi, and the average EPSC amplitude at stimulus i in a stimulus train is:
| Equation 4 |
In case that qi is not dependent on the stimulus number, the classical parabolic variance–mean relationship (Silver et al., 1998; Clements and Silver, 2000; Scheuss and Neher, 2001) is:
| Equation 5 |
which can also be written in a linear form:
| Equation 6 |
Here q* andNvar are the estimates of the quantal size and the number of release sites obtained either from the initial slope and the width of a parabolic fit to a variance–mean plot (Eq.5), or from the y-axis intercept and the slope of a linear fit to a variance/mean–mean plot (Eq. 6), respectively. The estimates are related to the true parameters by:
| Equation 7 |
and
| Equation 8 |
where CVqIntra, CVqInter, and CVpp denote the coefficients of variation of intrasite and intersite quantal variability (Frerking and Wilson, 1996) and of heterogeneity in the release probability (Silver et al., 1998), respectively.
Including the covariance Covi,i + 1 of the amplitudes of successive EPSCs in the analysis allows one to obtain an estimate of the quantal sizeqi* for each EPSC in a train (whereas the variance–mean approach considersq* as a common parameter). If the interval between successive stimuli within a train is sufficiently short (10 msec in our experiments), such that recovery can be neglected, Equation 45 in Scheuss and Neher (2001) allows one to calculate qi*as:
| Equation 9 |
The relation between the estimateqi* and the true quantal size qi is the same as in Equation 7 for the variance–mean approach. The parameterDi,i + 1 represents the postsynaptic contribution to covariance, which might be present in addition to that caused by depletion of releasable vesicle pools.Di,i + 1 is negative, if it arises from postsynaptic receptor saturation or desensitization. The variance term Vari/i in Equation 9 can be considered as a first-order estimate forqi* (initial slope of the variance–mean parabola, Eq. 5) and the covariance term representing a correction to this estimate. The extent to which the quantal size estimateqi* is affected by nonzero Di,i + 1 depends on the relative size of the correction term. It will be shown below that for most experimental estimates in our study, the correction term is small. In this case, upper and lower bounds forqi* delineate a narrow range of values, considering the extreme cases of all (Di,i + 1 = −∞) or no (Di,i + 1 = 0) covariance being of postsynaptic origin. Because the quantal size for response ican be estimated both with the covariance between response iand its subsequent response i + 1 (Eq. 7), as well as its preceding response i − 1 (Eq. 45 in Scheuss and Neher, 2001), we determined the mean of both estimates, except for the first and the last EPSC in trains.
An estimate for N from EPSC covariance was obtained from (Eq. 27 in Scheuss and Neher, 2001):
| Equation 10 |
with the estimate being related to the true parameter by:
| Equation 11 |
Here the term (1 + C1,2) is the correction for heterogeneity in the release probability among release sites. It depends on the mean and CVpp of the output probability distribution. Scheuss and Neher (2001) showed that (1 + C1,2) is smaller than the corresponding term (1 + CVpp2) in Equation 8 (forNvar), and furthermore that (1 + C1,2) ≈ 1 for a mean output probability close to 0.5. This indicates that the estimateNcov should be much less dependent on heterogeneity in the release probability thanNvar. It is, however, very sensitive to postsynaptic contributions represented by the termD1,2.
For linear fits the procedure suggested by Orear (1982) was used. Other fits were performed with the built-in procedure of IgorPro based on minimization of χ2. Fits to variance–mean plots were always constrained to pass through the origin, because the observed baseline variance from an interval of 5 msec preceding trains of stimuli was two to four orders of magnitude smaller than the variance data of EPSCs, and was therefore neglected (cf. Clements and Silver, 2000). All fits were weighted with the reciprocal of the SD. Detection of miniature EPSCs (mEPSCs) was done with the event detection routine based on template-matching provided by the AxoGraph 4 software (Axon Instruments, Foster City, CA). Results are reported as mean ± SEM, unless reported otherwise. Statistical significance was tested applying the Student'st test.
RESULTS
Variance–mean analysis under control conditions
To study the mechanisms underlying the strong synaptic depression observed at the calyx of Held synapse (Fig. 1A) (Borst et al., 1995; Wang and Kaczmarek, 1998; Schneggenburger et al., 1999), we applied a standard protocol consisting of trains of five stimuli at 100 Hz at 4 mm extracellular [Ca2+], which were repeated every 10 sec. The use of 4 mm[Ca2+] was expected to yield an initial release probability of ∼0.5 (Schneggenburger et al., 1999). At a release probability of 0.5, the covariance in the amplitude of successive EPSCs should be maximal. Furthermore, it was shown before that this particular value provides estimates for binomial N (number of release sites) from the covariance analysis, which are relatively insensitive to heterogeneity in the release probability (see Materials and Methods). The first EPSC in a train had an average amplitude of 8.35 ± 1.69 nA (n = 10). At the fifth response, EPSCs were depressed to 11.7 ± 3.1% (n = 10) of their initial amplitudes.
We first analyzed the variances between EPSCs, as summarized in Figure1 for a typical experiment under control conditions. The principle of nonstationary fluctuation analysis is indicated in Figure1A, showing example traces of three consecutively recorded trains of EPSCs. Figure 1B shows values of EPSC amplitudes Ii,r as a function of repetition number r. For each EPSC in the train, the ensemble mean and variance of the peak amplitude is determined by summing over all repetitions r, in this caser = 79 in total (Eqs. 1, 2). In the variance–mean plot (Fig. 1C), the location of the data points for the first and the second EPSC are consistent with a parabolic relationship. The initial slope of this parabola gives a quantal size ofq* = 24.3 pA. Its width, according to Eq. 5, suggests a value ofNvar = 695 release sites. The data from the third to the fifth response, however, lie below this parabola, indicating a reduced quantal size late in the depressing train. A line fit to the data of third to fifth response yieldsqline* = 11.1 pA. Because we cannot exclude that the second EPSC has a reduced variance similar to the third to fifth response, we did not use the data shown in Figure 1C for estimating the quantal size reduction. Instead, we used a combination of nonstationary and stationary fluctuation analysis (see below). In the variance–mean mean plot (Fig. 1D), a reduction in quantal size is expected to cause the data points to lie on a family of lines of equal slope (1/Nvar), but with decreasingy-axis intercept (q*). Such a reduction in the apparent quantal size was observed in 9 of 10 cells analyzed under control conditions. In the 10th cell, all data points in the variance–mean plot were compatible with a linear fit (see below).
Combining stationary and nonstationary fluctuation analysis
To verify whether the apparent quantal size reduction observed in the variance–mean analysis is a use-dependent phenomenon during the train, we performed experiments in which EPSC fluctuations were analyzed both under nonstationary conditions (as in Fig. 1), as well as under stationary conditions during reduced release probabilities (Silver et al., 1998; Clements and Silver, 2000).
In these experiments, EPSCs were first recorded at low stimulation frequency of 0.25 Hz at two lower values of [Ca2+] (usually at 1 and 2 mm) (Fig. 2A,B). Under these conditions, EPSC amplitudes were comparable with those obtained for the second to fifth response in 100 Hz trains recorded subsequently at 4 mm[Ca2+] (Fig. 2A,B). Nonstationary variance–mean analysis was performed at 4 mm [Ca2+], as shown before in Figure 1. The data from the first EPSC in trains at 4 mm [Ca2+] were combined with the data obtained at low stimulation frequency and lower [Ca2+] for stationary EPSC fluctuation analysis. In the resulting variance–mean plot (Fig. 2C, cross symbols), this data could be fitted with a parabola (q* = 23.3 pA;Nvar = 473). The data from nonstationary EPSC fluctuation analysis showed a reduction of the mean quantal size for the second to fifth EPSC during 100 Hz trains (Fig.2C, filled circles), as observed before (Fig.1C). A line fit to the data of the third to fifth response in trains gave an estimate for the quantal size late in trains ofqline* = 7.1 pA. Although the scatter in the data in Figure 2C is considerable, it is evident that the variance of EPSCs during the train is significantly smaller than that of EPSCs of similar amplitude recorded at lower [Ca2+] (compare second EPSC and EPSC at 2 mm[Ca2+], third EPSC and EPSC at 1 mm [Ca2+];p < 0.001).
Fig. 2.
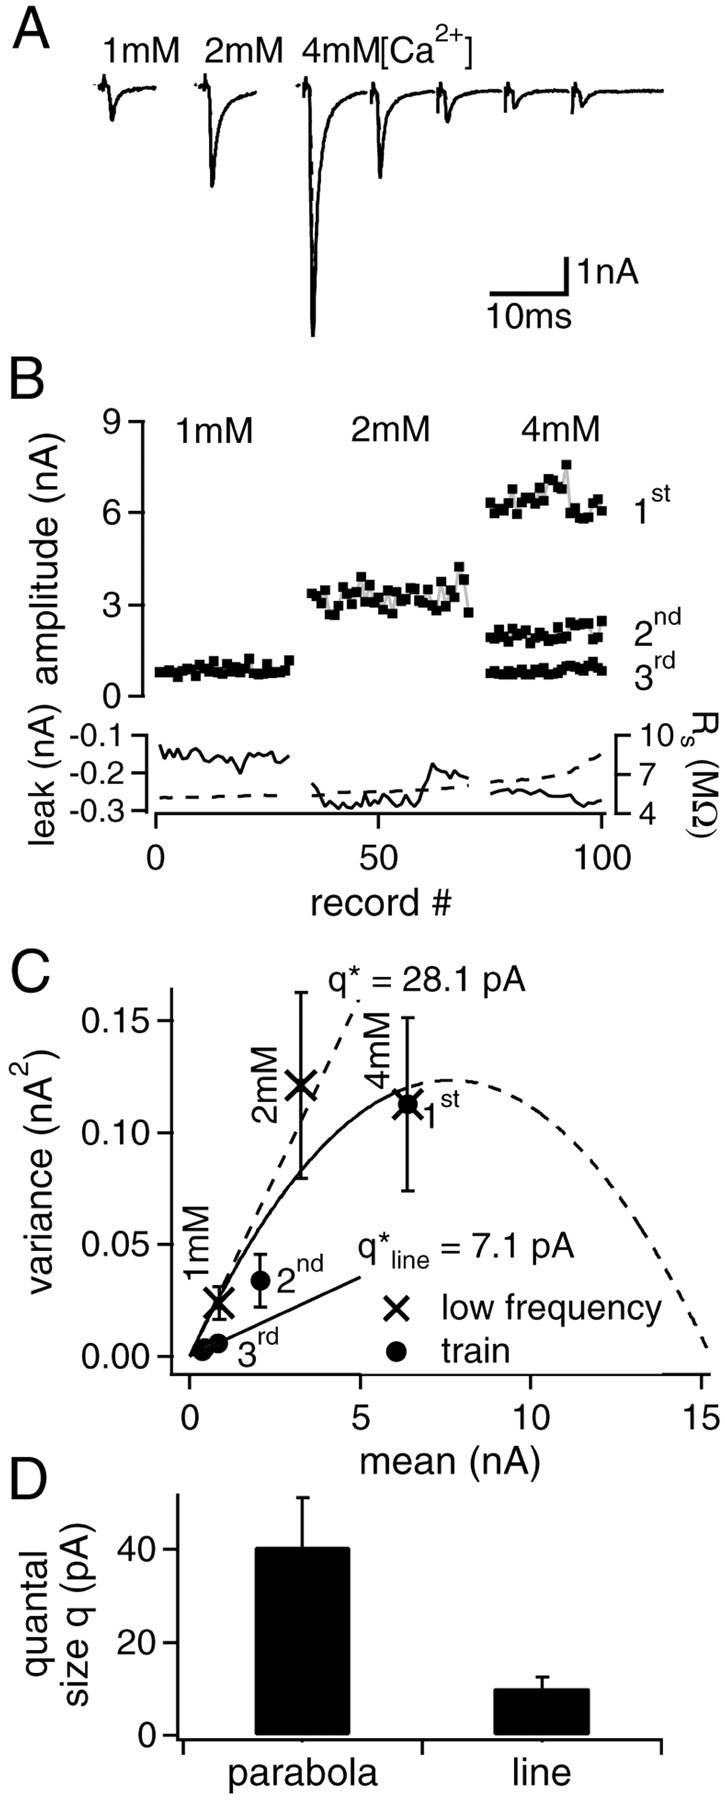
Combination of nonstationary and stationary variance–mean analysis. A, Single EPSC example traces after off-line Rs compensation from stationary recording epochs (0.25 Hz) at 1 and 2 mm[Ca2+] are shown together with an EPSC train at 100 Hz in 4 mm [Ca2+].B, Plot of all EPSC amplitudes versus stimulus–train repetition number (except fourth and fifth in train for better visibility). Leak current (continuous line) andRs (broken line) are documented in thebottom part of the panel. C,Variance–mean plot for the stationary data (crosses) and the train data (circles). A parabolic fit to the stationary data including the value of the first EPSC in the train yields q* = 28.1 ± 7.2 pA and Nvar = 618 ± 367 (mean ± SD). The data from the late, depressed EPSCs lie below this parabola. A line fitted to the data of the last three EPSCs in the train yields a slope of qline = 7.1 pA. Error bars indicate SD. D, Summary of the quantal size estimates from the parabolic (left bar) and linear fits (right bar) corrected for quantal size variability from five experiments.
The quantal size estimates obtained from the combination of stationary and nonstationary variance–mean analysis in five cells are summarized in Figure 2D after correction for quantal size variability (see below). As can be seen, the quantal size qlate in trains (Fig. 2D, right bar) was only ≈ 25% (p < 0.05) of the quantal size estimated from parabolic fits to EPSC variance–mean plots obtained under stationary conditions (Fig. 2D, left bar). The latter value (q = 40.6 ± 10.6 pA; n = 5) is in good agreement with the direct estimate of quantal size from amplitude distributions of mEPSCs (32.3 ± 6.9 pA,n = 4) (see Fig. 5C, left panel, open bar). We thus hypothesize that the apparent reduction of quantal sizes for the third to fifth EPSCs in 100 Hz trains (Figs. 1C,2C) reflects a use-dependent reduction of postsynaptic responsiveness, possibly caused by partial desensitization (Trussell et al., 1993; Otis et al., 1996) and/or saturation (Neher and Sakaba, 2001; Sun and Wu, 2001) of postsynaptic AMPA receptors (AMPA-Rs).
Fig. 5.
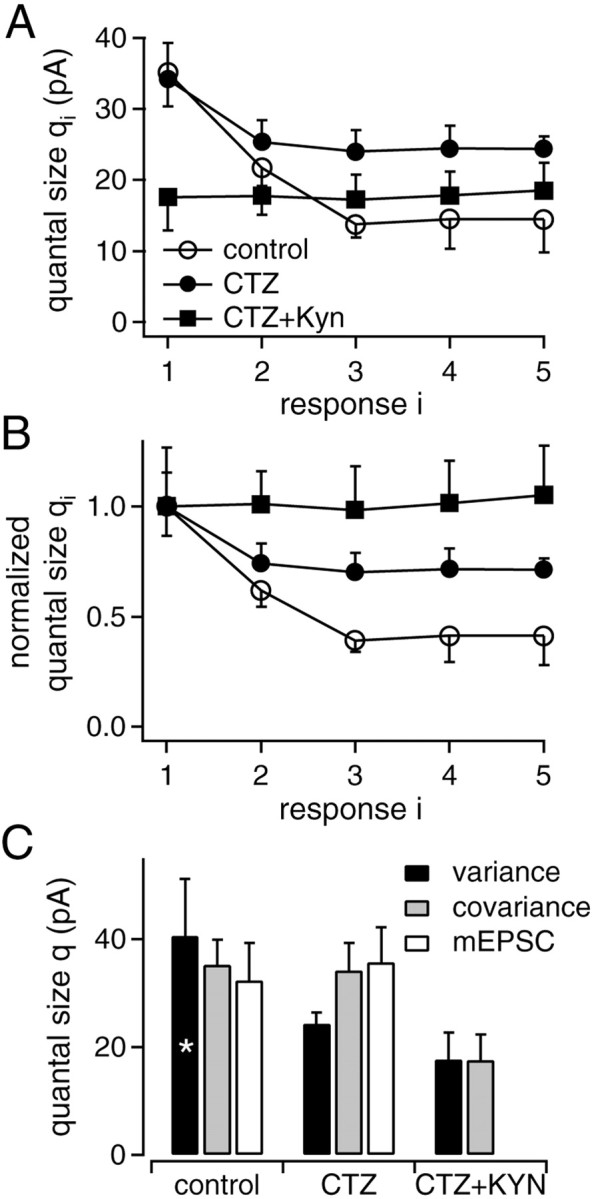
Summary of the quantal size estimates for each stimulus in the train. A, Plot of the average quantal size estimates for each response in the train as obtained from the covariance approach (Eq. 9) under control conditions (n = 10), in the presence of CTZ (n = 11), and with combined application of CTZ and KYN (n = 9). B, Data as inA, but normalized to the respective initial quantal sizes in the trains. C, Comparison of quantal size estimates from the variance–mean plot (black bars), the quantal size estimates for the first EPSC in a train from the covariance approach (gray bars), and the quantal size estimate determined from mEPSC data (open bars). The asterisk indicates that the corresponding value was obtained from stationary variance–mean analysis (Fig. 2D), because in the nonstationary case under control conditions, parabolas could not be fitted (Fig.1C).
Variance–mean analysis in the presence of CTZ and KYN
To test this hypothesis, we repeated the nonstationary variance–mean analysis in the presence of 100 μm CTZ alone, which should prevent, or at least slow down AMPA-R desensitization (Yamada and Tang, 1993; Trussell et al., 1993; Partin et al., 1994), and in combination with 1 mm KYN, which is a rapidly dissociating competitive antagonist at AMPA-R (Diamond and Jahr, 1997) and should reduce AMPA-R saturation. However, CTZ has also been reported to increase glutamatergic transmission via presynaptic mechanisms (Diamond and Jahr, 1995; Bellingham and Walmsley, 1999;Ishikawa and Takahashi, 2001). As will be shown below (see Figs. 5, 6), the analysis of covariance allows to distinguish between presynaptic and postsynaptic effects of the pharmacological manipulations, and indeed confirms such presynaptic effects.
Fig. 6.
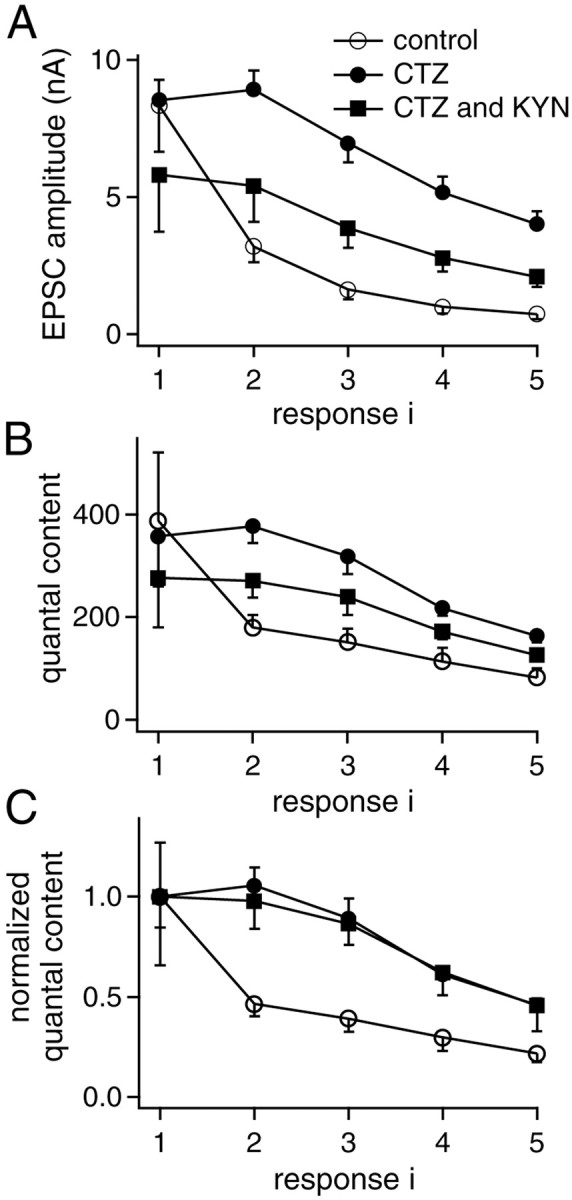
Quantal content of each response in the five stimuli train at 100 Hz. A, Plot of the mean EPSC amplitudes for each response in the train versus response number under control conditions (n = 10), in the presence of CTZ (n = 11), and with combined application of CTZ and KYN (n = 9). B, Quantal content in each response averaged across cells, obtained by dividing the EPSC amplitudes by the quantal size determined from the covariance approach.C, Quantal content data from B normalized with respect to the initial quantal content in trains.
In the presence of CTZ, the average EPSC amplitude for the first stimulus (8.5 ± 0.7 nA, n = 11) (see summary in Fig. 6A) was comparable with that observed in control conditions. In the presence of both CTZ and KYN, it was 5.8 ± 2.1 nA (n = 9, see summary in Fig. 6A). In contrast, the relative EPSC amplitude for the fifth stimulus under both conditions (CTZ: 50 ± 8%, n = 11; CTZ and KYN: 54 ± 12%, n = 9) was significantly larger than that in control conditions (11.7 ± 3.1%, see above;p < 0.05), as expected for a postsynaptic contribution to synaptic depression.
Figure 3 summarizes the variance–mean analysis of a recording in the presence of CTZ and KYN. Under these conditions, in four of nine cells, the complete variance–mean data set could be fitted with a parabola (Fig. 3C). In contrast to control conditions (Fig. 1C), no deviation of the second to fifth responses from the parabola was apparent. Also, in the variance/mean–mean plot (Fig. 3D), the data points now fell on a line with negative slope, as expected from the binomial model for constant quantal sizes (Eq. 6). This suggests that the use-dependent reduction in quantal size was largely abolished in the presence of CTZ and KYN (see also Neher and Sakaba, 2001). In the remaining five cells, the variance–mean plots could not be fitted with parabolas. However, because line fits to these variance–mean plots gaveq* values that were not significantly different from the values obtained by parabolic fits to the other four cells (data not shown), we assume that the linear variance–mean plots sampled only the linearly rising phase of the expected parabolas (see also Meyer et al., 2001).
Fig. 3.

Nonstationary variance–mean analysis of a recording in the presence of CTZ and KYN. A, Example trace after off-line Rs correction.B, Amplitudes of EPSCs in a train plotted versus train repetition number (r = 85 trains). Leak current (continuous line) and Rs(broken line) are shown in the bottompart of the panel. A regression line fitted to the first EPSC amplitudes reveals a change of −5.5% during the data set.C, EPSC amplitude variance–mean plot: the complete data set for all five EPSCs could be fitted with a parabola (q* = 29.9 ± 5.2 pA;Nvar = 357 ± 222; mean ± SD). D, EPSC amplitude variance–mean mean plot: the complete data set for all five EPSCs can be fitted with a line (q*, Nvaras above). In C and D, error bars indicate SD.
Correlation and covariance of successive responses in a train
The variance–mean analysis above indicates that the quantal size decreases in a use-dependent manner during synaptic depression. Therefore, it is desirable to estimate the quantal size for each EPSC in a train of stimuli. In the variance–mean plot, the quantal size is estimated from the initial slope of a parabolic fit (Eq. 5), such that the resulting quantal size estimate is a common value for all EPSCs in a train. Also, quantal sizes can only be reliably estimated from variance–mean data if the release probability is sufficiently low (compare initial slope of the variance–mean parabola).We showed previously that estimates for the quantal size of any EPSC in the train can be obtained by forming the sum of the variance/mean ratio and a term containing the covariance between successive EPSC amplitudes (Eq.9) (Scheuss and Neher, 2001). This is the case when correlations between successive responses result from depletion of releasable vesicles. The covariance term can be considered as a correction to the variance/mean ratio accounting for the nonlinear quadratic term in the parabolic variance–mean relationship (Eq. 5) at higher release probabilities.
We found that consecutive EPSCs were negatively correlated at the calyx of Held synapse under the conditions of our measurements (Fig.4). To visualize a case of such correlation under control conditions, nine successive example traces shown in Figure 4A were plotted at a larger scale in Figure 4B and displayed in different gray scales according to the amplitude of the first EPSC. By this procedure a negative correlation is readily apparent: large EPSC amplitudes in the first response (dark) most often resulted in small amplitudes in the second response, and vice versa (Fig. 4B).
Fig. 4.

Correlation and covariance between successive responses in a train. A, Nine example traces of first and second EPSCs in a train from consecutive sweeps (gray) and their mean (black) display the range of trial-to-trial fluctuations in their amplitudes (same cell as in Fig. 1). B, Correlation between the amplitudes in the pairs of consecutive EPSCs shown in A,visualized by color coding the traces in different scales of gray according to the amplitude of the first EPSC. C, Scatter plot of second versus first EPSC amplitude from all trains analyzed (n = 79) in the cell shown in A andB. This indicates that indeed in the majority of cases the second EPSC amplitude is smaller than its mean (horizontal dotted line), if the first EPSC amplitude was larger than its respective mean (vertical dotted line), and vice versa.D, Plot of the average covariance in the amplitudes of consecutive EPSCs in the five stimulus train under control conditions (n = 10), in the presence of CTZ (n = 11), and for combined application of CTZ and KYN (n = 9). E, Plot of the average correlation coefficient between the amplitudes of consecutive EPSCs in the five stimuli train for each of the three conditions.F, Plot of the terms Vari/Ii and Covi,i + 1/Ii + 1 (continuous lines) of Eq. 9 averaged over all cells under control conditions. The broken line connects estimates forqi* calculated with the assumption that all observed covariance is of presynaptic origin [i.e., (1 − Di,i + 1 = 1), Eq.9]. It is seen, that with this assumptionq1* is slightly (but not significantly, p > 0.5) larger thanq* calculated from the mean and CVq of mEPSC distributions (diamond symbol). This comparison provides an estimate for the correction factor for postsynaptic contributions to covariance (1 − D1,2) (see Results).
Figure 4C provides a scatter plot of second versus first EPSC amplitudes in 79 trains of this particular experiment. The quantitative analysis of the covariances between each pair of consecutive EPSC in a train, averaged across all cells recorded under the different pharmacological conditions is shown in Figure4D. Under control conditions, in the first pair of EPSCs, the absolute covariance was maximal, and it progressively declined along the train to almost zero as expected from the binomial model (Vere-Jones, 1966; Quastel, 1997; Scheuss and Neher, 2001). In the presence of CTZ, the covariance is effectively unchanged as compared to control conditions (p > 0.5) (Fig.4D, closed and open circles, respectively). The additional application of KYN reduced the covariances (p < 0.1) (Fig. 4D, squares). This reduction can be attributed to the partial block of postsynaptic AMPA-R by KYN (Fig.5A).
We did not observe that CTZ reduced the negative covariance in successive EPSC amplitudes (Fig. 4D), as might be expected if postsynaptic AMPA-R desensitization contributes to correlations in successive EPSC amplitudes. However, because in statistical terms the covariance is the variance of the joint distribution of successive EPSC amplitudes, a reduction in correlation is not necessarily expected to change the covariance. However, it is expected to change the correlation coefficient, which is a measure for dependence between the EPSC amplitudes at stimulus i andj, defined by Covi,j/(Vari·Varj)1/2. The correlation coefficient of the amplitudes in pairs of successive EPSCs is shown in Figure 4E. It is negative throughout the train. Similarly to the covariance, its absolute value is maximal for the first pair of stimuli and progressively declines along the train. However, the initial correlation coefficient under control conditions is −0.44 ± 0.06 (n = 10), whereas in the presence of CTZ it is only −0.17 ± 0.05 (n = 11) (p < 0.005) (Fig.4E, open and closed circles,respectively). In the presence of CTZ and KYN, the correlation coefficient might be even smaller (p < 0.2) (Fig. 4E, squares). These findings suggest that the use-dependent reduction in quantal size, caused by postsynaptic receptor desensitization and saturation, contributed significantly to the negative correlation between successive EPSCs observed under control conditions. The negative correlation remaining in the presence of CTZ and KYN (different from zero with p < 0.25) (Fig. 4E, squares) is most likely caused by presynaptic mechanisms, because under these conditions, quantal sizes were virtually constant during the five stimuli 100 Hz trains (see below, Fig. 5).
As discussed above, correlation between successive EPSCs in a train not only results from vesicle depletion. It may also be a consequence of postsynaptic receptor desensitization and saturation. This can be accounted for in the covariance approach by dividing the total covariance by a term (1 − Di,i + 1) (Eq. 9, Materials and Methods). This correction term can be determined from the ratio of the correlation coefficients between successive EPSC amplitudes obtained under two recording conditions, which are equivalent except for the presence and absence of postsynaptic effects (Scheuss and Neher, 2001, their Eq. 49). Calculating the ratios of the correlation coefficients under control conditions to those of CTZ alone and with KYN (Fig.4E), we obtained a first order of magnitude estimate for the correction term (1 − Di,i + 1). For the first two pairs of EPSCs, it was found to be 3.8 and 3.2, respectively, indicating that the contribution of postsynaptic effects to the covariance (Di,i + 1) is about three and two times as much as that of vesicle depletion, respectively.
Estimates for the quantal size of each response in the train
Using the mean, variance, and covariance in the amplitudes of successive EPSCs, we estimated the average quantal size for each EPSC in a train of stimuli (Eq. 9). We applied a correction for the postsynaptic contribution to covariance under control conditions [Eq.9; (1 − D1,2) = 3, (1 − D2,3) = 2 and (1 −D3,4) = (1 −D4,5) = 1]. These parameters were chosen on the basis of a comparison of the correlation coefficients (Fig. 4E; see above) and, since the latter might suffer from CTZ having presynaptic effects, in addition on a separate evaluation of the variance and the covariance terms in Equation 9 under control conditions, as outlined in the following. Figure 4F shows the variance and the covariance terms of Equation 9 in separation (continuous lines). The sum of their absolute values yields the quantal size estimate (broken line) for the case that all of the measured covariance is attributed to vesicle pool depletion (Di,i + 1 = 0). Comparing this estimate for the first EPSC to mEPSC data (Fig. 4F, diamond symbol) shows that the contribution of the covariance term should be scaled down by a factor of (1 −D1,2) ≈ 1.6 (Eq. 9) to avoid overestimation of q*.
Clearly, the estimate for (1 −D1,2) cannot be considered very accurate. However, Figure 4F shows that the contribution of the covariance term (bottom continuous line) to qi* is relatively small and, therefore, the influence of (1 −D1,2) is minor. The covariance term will be even smaller for trains of EPSCs under physiological conditions when the release probability is lower. In case of CTZ alone and with KYN, the postsynaptic contributions to covariance are expected to be effectively absent, and the covariance term in Equation 9 was found to be an order of magnitude lower than the variance term under these conditions (data not shown), such that a correction would have no significant effect. Thus, as long as the relative contribution of the covariance term has been evaluated and found to be negligible, quantal size estimates can simply be obtained from variance–mean ratios (Eq. 9).
The quantal size estimates of Figure 5 were corrected for quantal size variability, by multiplication with (1 + CVq2) (Eq. 7), as a common factor accounting for intrasite as well as intersite quantal variability. The coefficient of variation CVq was determined from amplitude distributions of spontaneously occurring mEPSCs (control: CVq = 0.5 ± 0.1; CTZ: 0.55 ± 0.08; n = 4). In the presence of CTZ and KYN, mEPSCs were too small for sampling the entire amplitude distribution; the value for CVq was therefore taken as the average of control and CTZ data.
Under control conditions using the choice of Di,i + 1 values given above, the quantal size estimateq1 of the first EPSC was 35.2 ± 4.7 pA (n = 10) (Fig. 5A, open circles). For the second to fifth EPSC in trains, estimates showed a strong reduction, reaching a plateau at 41 ± 13% of its initial value (Fig. 5B, open circles). In the presence of CTZ, the quantal size estimate for the first EPSC (34.2 ± 5.1 pA,n = 11) (Fig. 5A, closed circles) was comparable with that obtained in control conditions, but its relative reduction during trains was smaller (n = 11) (Fig.5B, closed circles). In the case of combined application of CTZ and KYN, the quantal size estimate was unchanged along the train (Fig. 5A,B, squares). Its absolute value was 17.8 ± 4.7 pA (n = 9), reflecting the blocking action of KYN on AMPA-R. These results further support the notion that both postsynaptic AMPA-R desensitization (Trussell et al., 1993; Otis et al., 1996; Neher and Sakaba, 2001) and saturation (Auger et al., 1998;Neher and Sakaba, 2001) contribute to the apparent use-dependent reduction of quantal size.
The quantal size estimates from EPSC fluctuation analysis and mEPSCs data show reasonable agreement (Fig. 5C). Under control conditions, the obtained values are not significantly different (p > 0.6) (Fig. 5C, left panel). In the presence of CTZ, it is expected that the estimate from the variance–mean plot (Fig. 5C, middle panel, black bar) is slightly smaller than the other estimates made in the presence of CTZ, because the covariance analysis showed that in the presence of CTZ alone (Fig. 5A,B, filled circles), quantal sizes are reduced in the second and subsequent EPSCs. The reduction in quantal size down to ≈40% during trains under control conditions (Fig. 5B) is confirmed by the result from combining stationary and nonstationary variance–mean analysis (p > 0.4) (Fig. 2D).
Quantification of the presynaptic contribution to depression
Knowing the average quantal size for each EPSC in trains (Fig.5A) allows us to calculate the mean number of quanta released in response to each stimulus (“quantal content”). The average quantal content for each EPSC in a train is shown in Figure6B for the three pharmacological conditions used here. It is seen that in the presence of CTZ (closed symbols), the relative decrease of quantal content with each stimulus is less than in its absence (Fig.6B, open symbols). This effect is seen more clearly when the values are normalized to the quantal content during the first response (Fig. 6C). The data obtained in the presence of CTZ, and with CTZ and KYN almost superimpose (Fig. 6C, closed symbols). Interestingly, the relative quantal content decays significantly faster under control conditions. This indicates a presynaptic effect of CTZ, which acts to retard the development of synaptic depression, as observed previously in endbulb of Held synapses (Bellingham and Walmsley, 1999), maybe because of a CTZ-induced broadening of presynaptic APs (Ishikawa and Takahashi, 2001), which might render the second to fifth AP more effective in evoking transmitter release.
Cumulative quantal contents and the estimate of Nfrom EPSC fluctuation analysis
Knowing the quantal content for each EPSC in the train, it was interesting to examine how the cumulative quantal contentNcum compares to the estimates of the number of release sites (binomial parameter N) obtained from EPSC fluctuation analysis. This readdresses the question of how many vesicles are released during short trains of EPSCs at high-frequency stimulation (Schneggenburger et al., 1999; Bollmann et al., 2000;Taschenberger and von Gersdorff, 2000) accounting for the reduction in quantal size during trains (Fig. 5A).
To address this point, we performed additional experiments, in which 100 Hz trains with 21 stimuli were applied to induce steady-state levels of synaptic depression (Fig.7A). These experiments were done in each cell first under control conditions at 4 mm [Ca2+], and subsequently in the presence of 100 μm CTZ. The back-extrapolated cumulative EPSC amplitude as a measure for the size of the pool of releasable vesicles (Fig. 7B) (Elmquist and Quastel, 1965; Schneggenburger et al., 1999) was found to be identical to the cumulative EPSC amplitude up to the fifth stimulus, both with and without CTZ (Fig. 7C) (n = 6 cells). Because both values agreed well, we used the cumulative EPSC amplitude at the fifth stimulus obtained in the cells shown in Figures 1-6 as a measure equivalent to the back-extrapolated cumulative EPSC amplitude. To correct for the reduction in quantal size apparent in Figure5A, we summed up the quantal contents (Fig.6B) for estimating the number of released vesicles,Ncum.
Fig. 7.

Estimates of the number of releasable vesicles during 100 Hz trains and of the number of release sites.A, Average (n = 5) of example traces in response to long stimulus trains (21 stimuli) under control conditions and in the presence of CTZ. B, Plot of the cumulative EPSC amplitude along the stimulus train under both conditions from the same experiment as in A. Assuming that the linear rising phase of the cumulative EPSC amplitudes results from constant refilling during the stimulus train, a linear fit to this range (response 11 to response 21) provides the contribution of refilled vesicles to the overall cumulative response. They-axis intercept of the back-extrapolated fit therefore yields an equivalent of the pool size of immediately releasable vesicles. C, Plot of the pool estimate from the back-extrapolated fits to the cumulative EPSC amplitudes versus the cumulative EPSC amplitude at the fifth response. Data from six experiments obtained under control conditions and with 100 μm CTZ for each cell are plotted. The data fall close to the unity line (dotted line), indicating that cumulative EPSC amplitude at the fifth stimulus is equivalent to the value of the back-extrapolated cumulative EPSC amplitude. D,Histogram summarizing the releasable pool estimates and the estimates of the number of release sites from the variance–mean plots and the covariance approach under control conditions (n= 10), in the presence of CTZ (n = 11), and with combined application of CTZ and KYN (n = 9). Theasterisk indicates that the corresponding value was obtained from stationary variance–mean analysis (Fig. 2), because in the nonstationary case under control conditions, parabolas could not be fitted (Fig. 1C).
In Figure 7D, the N estimates from the three methods (variance–mean analysis, covariance approach applied to first and second EPSC, and cumulative EPSC amplitudes,Ncum) are compared for the data obtained under all three pharmacological conditions. We expectNcum to be equal or smaller than the number of release sites, because with heterogeneous release probabilities, vesicles with low release probability might not effectively be released by short 100 Hz stimulus trains.Nvar andNcov were not corrected for intersite quantal variability (Eqs. 8, 11), thus we assume that all quantal size (mEPSC) variability is intrasite. If all of the variability would be intersite, the values would be larger by ∼25%. Both estimates were not corrected for heterogeneity in the release probability (Eq. 8, 11), the effects of the latter are evaluated below. In control,Ncov was corrected for the postsynaptic contribution to covariance (Eq. 11) applying (1 −D1,2) = 3 as above for the quantal size estimates. It should be noted that in contrast to the quantal size estimates, (1 −D1,2) is a multiplicative correction factor for the estimate of N. Despite the difficulties in determining (1 − D1,2), we consider the N estimate from covariance under control conditions to be valid as an order of magnitude estimate. Furthermore, the N estimates from covariance in the presence of CTZ alone and with KYN, which do not require this correction, give similar values of ∼2000 sites (Fig. 7D, gray bars). The Nestimate from EPSC variance–mean analysis, on the other hand, was much smaller, ranging from 500 to 900 sites for the different pharmacological conditions (Fig. 7D, black bars). The cumulative amount of vesicles released under control conditions was ≈900 (Fig. 7D, open bar). This value was larger than the previous estimate by Schneggenburger et al. (1999), because of the correction for postsynaptic effects, which was applied here, but not in the previous study.
Interestingly, the N estimates from covariance (Fig.7D, gray bars) were significantly larger than all otherN estimates (p < 0.1), and approach the numbers of vesicles that can be released by flash photolysis (≈1700; Schneggenburger and Neher, 2000) and by long-lasting presynaptic depolarization (≈2200, Sakaba and Neher, 2001; ≈4200,Sun and Wu, 2001). Again, it should be noted that the Nestimate from covariance critically depends on the assumptions about (1 − D1,2). Nevertheless, the estimates for N from variance, unless corrected for heterogeneity in release probability, most likely are not closely related to the number of release sites, but rather to the number of active zones (see also Meyer et al., 2001). In the case that these discrepancies arose exclusively from heterogeneity in release probability, a comparison of Nvar with a “best estimate” of the actual number of release sitesN would provide information on CVpp, the coefficient of variation in release probability among sites (Eq.8). Assuming N to be 2000, we arrive at CVpp of ≈100%, somewhat larger than previous estimates (22–71%, Walmsley et al., 1988; >50%,Murthy et al., 1997). However, CVpp is probably not a fixed parameter, but might change during activity dependent synaptic depression, because early depletion of high release probability sites is expected to change the shape of the release probability distribution.
DISCUSSION
Applying nonstationary fluctuation analysis, we showed that quantal size and quantal content for each EPSC in a train of stimuli can be estimated separately by analyzing mean, variance, and covariances of EPSC amplitudes. We found significant negative covariance in the amplitudes of successive EPSCs in a train, which had a large contribution from postsynaptic effects. The analysis showed that depression in the EPSC amplitude during 100 Hz trains down to 10% of its initial value resulted from a 2.5-fold reduction in quantal size, and a fourfold reduction in quantal content. The number of release sites estimated by covariance analysis was ≈2000 and significantly larger than estimates from variance–mean parabolas, suggesting heterogeneity in the release probability among release sites.
Use-dependent changes in quantal size
It has previously been shown that postsynaptic mechanisms contribute to synaptic depression at calyx-type synapses (Trussell et al., 1993; Otis et al., 1996; Bellingham and Walmsley, 1999; Oleskevich et al., 2000; Brenowitz and Trussell, 2001). Moreover, by using a combination of deconvolution with a variant of nonstationary fluctuation analysis, Neher and Sakaba (2001) observed a strong reduction in quantal size caused by desensitization and saturation after prolonged presynaptic depolarization. Our data suggest that postsynaptic AMPA-R desensitization (Otis et al., 1996) and possibly saturation (Auger et al., 1998) occur during repetitive AP stimulation under the applied conditions. The quantal size reduction we observe in the presence of CTZ alone (down to 70%) (Fig. 5A,B, closed circles) might not only arise from saturation, but also partially because of remaining, cumulative desensitization (see also Meyer et al., 2001). CTZ has been shown to block desensitization in the “flip” splice variant of AMPA-Rs almost completely, whereas it only retards desensitization in the “flop” form (Partin et al., 1994), which is predominantly expressed in principal neurons of the medial nucleus of the trapezoid body (Geiger et al., 1995). The blocking effect of KYN might protect AMPA-R from binding glutamate and consequently from becoming desensitized. On the other hand, AMPA-R might be partially saturated in the presence of CTZ, because the absolute EPSC amplitudes during the second and third response were often larger than during the first one, because of the build-up of AMPA-R-mediated synaptic currents (Fig. 3A). The finding of constant quantal sizes in the presence of both CTZ and KYN (Fig.5A,B, squares) argues against presynaptic mechanisms of quantal size reduction, such as incomplete refilling with transmitter, which might be a consequence of rapidly recycling vesicles (Pyle et al., 2000). Furthermore, it indicates that the blocking efficiency of KYN does not change during the trains at 4 mm[Ca2+]. This in turn suggests (Tong and Jahr, 1994), that multivesicular release at active zones is minor under the applied conditions. However, even at higher release probability with 15 mm [Ca2+], evidence for multivesicular release has been reported recently (Meyer et al., 2001).
The quantal size estimates according to Eq. 9 require a correction for postsynaptic contributions to covariance (1 −Di,i + 1), which can only be determined roughly. Nevertheless, we consider our estimates reliable, because the total contribution of covariance is small, particularly for depressed responses (Fig. 4F). We would expect that for lower initial release probability at physiological [Ca2+] the contribution of covariance is even smaller, such that quantal sizes could be estimated simply from variance/mean ratios, but this would need to be tested beforehand by evaluation of the covariance. The quantal size estimates of ≈35 pA for the first EPSC in trains from nonstationary EPSC fluctuation analysis are consistent with mEPSC data (Fig. 5C) (Borst and Sakmann, 1996; Chuhma and Ohmori, 1998; Schneggenburger et al., 1999). Furthermore, the reduction in quantal size during trains (Fig.5A,B) is in agreement with data obtained from the combination of nonstationary and stationary EPSC variance analysis (Fig. 2D).
Presynaptic mechanisms of depression
In addition to the postsynaptic reduction in quantal size, we found that presynaptic mechanisms contributed with a fourfold reduction in quantal content (Fig. 6C, open circles) to the depression during 100 Hz trains (Fig. 6A). One class of presynaptic mechanisms of depression is related to a reduction in Ca2+ influx, which might be caused by use-dependent changes in the AP waveform, Ca2+ channel inactivation (Forsythe et al., 1998), Ca2+ depletion from the synaptic cleft (Borst and Sakmann, 1999a), and activation of metabotropic autoreceptors (Takahashi et al., 1996; von Gersdorff et al., 1997). This class of mechanisms does probably not contribute to depression under the conditions used here, because it has been shown that despite changes in AP waveform, APs stay equally effective in inducing presynaptic Ca2+ influx during short 100 Hz trains (Borst and Sakmann, 1999b). Another class of presynaptic mechanisms of depression comprises the availability and release-competence of synaptic vesicles. This includes vesicle pool depletion (von Gersdorff et al., 1997; Wu and Borst, 1999;Schneggenburger et al., 1999), adaptation of the Ca2+ sensor for release (Hsu et al., 1996), activity-dependent inactivation of the release machinery (Betz, 1970; Waldeck et al., 2000; Kraushaar and Jonas, 2000), and lateral inhibition (Dobrunz et al., 1997).
Our results give some support to vesicle pool depletion as a presynaptic mechanism for depression at the calyx of Held, because we found that negative correlation in the amplitudes of successive EPSCs persisted in the presence of CTZ and KYN (Fig. 4E), albeit to a small degree. In addition, some presynaptic inactivation factor might be present, as postulated for the endbulb of Held, where it was shown to be altered by CTZ (Bellingham and Walmsley, 1999). However, because data from the calyx of Held obtained under presynaptic voltage-clamp do not show such presynaptic action of CTZ (Sakaba and Neher, 2001), we suggest CTZ effects on K+currents (Ishikawa and Takahashi, 2001) as the cause for presynaptic changes. Furthermore, our data are consistent with heterogeneity of release probability (Wu and Borst, 1999; Sakaba and Neher, 2001). This is because the covariance analysis, which is less sensitive to such heterogeneity, gives values for N (Fig. 7D, gray bars) that are in better agreement with pool sizes obtained recently by pool-depleting stimuli (≈1700 in Schneggenburger and Neher, 2000; ≈2200 in Sakaba and Neher, 2001; ≈4200 in Sun and Wu, 2001) than those from the variance–mean approach (Fig. 7D, black bars). An additional reason for the lower N estimates from variance–mean analysis might be postsynaptic receptor saturation (Meyer et al., 2001, their Fig. 9).
Functional release sites versus active zones
It is widely accepted that an active zone can release maximally one vesicle in response to a presynaptic AP, possibly because of some inhibition of the remaining vesicles (Triller and Korn, 1982), such as the proposed “lateral inhibition” between vesicles in the releasable pool (Dobrunz et al., 1997). Arguing in favor of this univesicular release constraint, it has been shown that theN estimates from binomial and variance–mean analysis are similar to the number of morphologically determined active zones (Korn et al., 1981; Silver et al., 1998; Oleskevich et al. 2000).N estimates from variance–mean analysis at the calyx of Held (this work and Meyer et al., 2001) report, indeed, values very close to the numbers of active zones as estimated in a morphological analysis (≈600, Sätzler et al., 2001). These numbers, however, represent only a fraction of the number of vesicles that can be released within a few milliseconds by strong pool-depleting stimuli, such as presynaptic voltage-clamp depolarization or Ca2+ uncaging (Schneggenburger and Neher, 2000; Sakaba and Neher, 2001; Sun and Wu, 2001). We therefore propose that various limitations of the classical variance–mean analysis, arising from heterogeneity in the release probability, as we show here, as well as from saturation of postsynaptic receptors (Meyer et al., 2001), lead to N estimates that do not represent the full complement of release ready vesicles.
The release sites of an active zone most probably share a common, or overlapping set of postsynaptic receptors. Thus, in case of multivesicular release, neurotransmitter quanta might interact to cause saturation of postsynaptic receptors (Tong and Jahr, 1994; Auger et al., 1998). In the past, this was suggested as an alternative explanation for all-or-none synaptic transmission, assuming saturation of postsynaptic receptors irrespective of the number of released vesicles (Edwards et al., 1990). Our finding that theN-estimate from covariance can be as high as the number of readily releasable vesicles suggests that heterogeneity in the release probability among sites may present a serious problem for the interpretation of binomial N estimates (see also Silver et al., 1998). Such heterogeneity might arise from different priming states of docked vesicles (Xu et al., 1998), vesicles carrying variable amounts of synaptic proteins required for fusion (Littleton et al., 2001), and/or differences in the relative localization of release sites and Ca2+ channels (Neher, 1998). Thus, if an active zone would contain more release sites, but only a fraction with a relatively high release probability compared with the others, this could explain some of the observations that led to the proposal of the single-vesicle hypothesis.
Footnotes
This work was supported by the Deutsche Forschungsgemeinschaft (Grant SFB 406) and a fellowship from the Deutsche Forschungsgemeinschaft (Graduiertenkolleg “Signal-Mediated Transport of Proteins and Vesicles”) to V.S. We thank R. Angus Silver for helpful comments on this manuscript.
Correspondence should be addressed to Erwin Neher, Max Planck Institute für biophysikalische Chemie, Abteilung Membranbiophysik (140), Am Faßberg 11, D-37077 Göttingen, Germany. E-mail: eneher@gwdg.de.
REFERENCES
- 1.Abbott LF, Varela JA, Sen K, Nelson SB. Synaptic depression and cortical gain control. Science. 1997;275:220–224. doi: 10.1126/science.275.5297.221. [DOI] [PubMed] [Google Scholar]
- 2.Auger C, Kondo S, Marty A. Multivesicular release at single functional synaptic sites in cerebellar stellate and basket cells. J Neurosci. 1998;18:4532–4547. doi: 10.1523/JNEUROSCI.18-12-04532.1998. [DOI] [PMC free article] [PubMed] [Google Scholar]
- 3.Bellingham MC, Walmsley B. A novel presynaptic inhibitory mechanism underlies paired pulse depression at a fast central synapse. Neuron. 1999;23:159–170. doi: 10.1016/s0896-6273(00)80762-x. [DOI] [PubMed] [Google Scholar]
- 4.Betz WJ. Depression of transmitter release at the neuromuscular junction of the frog. J Physiol (Lond) 1970;206:629–644. doi: 10.1113/jphysiol.1970.sp009034. [DOI] [PMC free article] [PubMed] [Google Scholar]
- 5.Bollmann JH, Sakmann B, Borst JGG. Calcium sensitivity of glutamate release in a calyx-type terminal. Science. 2000;289:953–957. doi: 10.1126/science.289.5481.953. [DOI] [PubMed] [Google Scholar]
- 6.Borst JG, Sakmann B. Calcium influx and transmitter release in a fast CNS synapse. Nature. 1996;383:431–434. doi: 10.1038/383431a0. [DOI] [PubMed] [Google Scholar]
- 7.Borst JGG, Sakmann B. Depletion of calcium in the synaptic cleft of a calyx-type synapse in the rat brainstem. J Physiol (Lond) 1999a;521:123–133. doi: 10.1111/j.1469-7793.1999.00123.x. [DOI] [PMC free article] [PubMed] [Google Scholar]
- 8.Borst JGG, Sakmann B. Effect of changes in action potential shape on calcium currents and transmitter release in a calyx-type synapse of the rat auditory brainstem. Philos Trans R Soc Lond B Biol Sci. 1999b;354:355–363. doi: 10.1098/rstb.1999.0386. [DOI] [PMC free article] [PubMed] [Google Scholar]
- 9.Borst JG, Helmchen F, Sakmann B. Pre- and postsynaptic whole-cell recordings in the medial nucleus of the trapezoid body of the rat. J Physiol (Lond) 1995;489:825–840. doi: 10.1113/jphysiol.1995.sp021095. [DOI] [PMC free article] [PubMed] [Google Scholar]
- 10.Brenowitz S, Trussell LO. Minimizing synaptic depression by control of release probability. J Neurosci. 2001;21:1857–1867. doi: 10.1523/JNEUROSCI.21-06-01857.2001. [DOI] [PMC free article] [PubMed] [Google Scholar]
- 11.Chuhma N, Ohmori H. Postnatal development of phase-locked high-fidelity synaptic transmission in the medial nucleus of the trapezoid body of the rat. J Neurosci. 1998;18:512–520. doi: 10.1523/JNEUROSCI.18-01-00512.1998. [DOI] [PMC free article] [PubMed] [Google Scholar]
- 12.Clamann HP, Mathis J, Luscher HR. Variance analysis of excitatory postsynaptic potentials in cat spinal motoneurons during posttetanic potentiation. J Neurophysiol. 1989;61:403–416. doi: 10.1152/jn.1989.61.2.403. [DOI] [PubMed] [Google Scholar]
- 13.Clements JD, Silver RA. Unveiling synaptic plasticity: a new graphical and analytical approach. Trends Neurosci. 2000;23:105–113. doi: 10.1016/s0166-2236(99)01520-9. [DOI] [PubMed] [Google Scholar]
- 14.Diamond JS, Jahr CE. Asynchronous release of synaptic vesicles determines the time course of the AMPA receptor-mediated EPSC. Neuron. 1995;15:1097–1107. doi: 10.1016/0896-6273(95)90098-5. [DOI] [PubMed] [Google Scholar]
- 15.Diamond JS, Jahr CE. Transporters buffer synaptically released glutamate on a submillisecond time scale. J Neurosci. 1997;17:4672–4687. doi: 10.1523/JNEUROSCI.17-12-04672.1997. [DOI] [PMC free article] [PubMed] [Google Scholar]
- 16.Dobrunz LE, Huang EP, Stevens CF. Very short-term plasticity in hippocampal synapses. Proc Natl Acad Sci USA. 1997;94:14843–14847. doi: 10.1073/pnas.94.26.14843. [DOI] [PMC free article] [PubMed] [Google Scholar]
- 17.Edwards FA, Konnerth A, Sakmann B. Quantal analysis of inhibitory synaptic transmission in the dentate gyrus of rat hippocampal slices: a patch-clamp study. J Physiol (Lond) 1990;430:213–249. doi: 10.1113/jphysiol.1990.sp018289. [DOI] [PMC free article] [PubMed] [Google Scholar]
- 18.Elmquist D, Quastel DMJ. A quantitative study of the end-plate potentials in isolated human muscle. J Physiol (Lond) 1965;178:505–529. doi: 10.1113/jphysiol.1965.sp007639. [DOI] [PMC free article] [PubMed] [Google Scholar]
- 19.Fisher SA, Fischer TM, Carew TJ. Multiple overlapping processes underlying short-term synaptic enhancement. Trends Neurosci. 1997;20:170–177. doi: 10.1016/s0166-2236(96)01001-6. [DOI] [PubMed] [Google Scholar]
- 20.Forsythe ID, Barnes-Davies M, Brew HM. The calyx of Held: A model system for transmission at mammalian glutamatergic synapses. In: Wheal H, Thomson A, editors. Excitatory amino acids and synaptic transmission, Ed 2. Academic; San Diego: 1995. pp. 133–144. [Google Scholar]
- 21.Forsythe ID, Tsujimoto T, Barnes-Davies M, Cuttle MF, Takahashi T. Inactivation of presynaptic calcium current contributes to synaptic depression at a fast central synapse. Neuron. 1998;20:797–807. doi: 10.1016/s0896-6273(00)81017-x. [DOI] [PubMed] [Google Scholar]
- 22.Frerking M, Wilson M. Effects of variance in mini amplitude on stimulus-evoked release: a comparison of two models. Biophys J. 1996;70:2078–2091. doi: 10.1016/S0006-3495(96)79774-6. [DOI] [PMC free article] [PubMed] [Google Scholar]
- 23.Geiger JR, Melcher T, Koh DS, Sakmann B, Seeburg PH, Jonas P, Monyer H. Relative abundance of subunit mRNAs determines gating and Ca2+ permeability of AMPA receptors in principal neurons and interneurons in rat CNS. Neuron. 1995;15:193–204. doi: 10.1016/0896-6273(95)90076-4. [DOI] [PubMed] [Google Scholar]
- 24.Hsu S-F, Augustine GJ, Jackson MB. Adaptation of Ca2+ -triggered exocytosis in presynaptic terminals. Neuron. 1996;17:501–512. doi: 10.1016/s0896-6273(00)80182-8. [DOI] [PubMed] [Google Scholar]
- 25.Ishikawa T, Takahashi T. Mechanisms underlying presynaptic facilitatory effect of cyclothiazide at the calyx of Held of juvenile rats. J Physiol (Lond) 2001;533:423–431. doi: 10.1111/j.1469-7793.2001.0423a.x. [DOI] [PMC free article] [PubMed] [Google Scholar]
- 26.Korn H, Faber DS. Quantal analysis and synaptic efficacy in the CNS. Trends Neurosci. 1991;14:439–445. doi: 10.1016/0166-2236(91)90042-s. [DOI] [PubMed] [Google Scholar]
- 27.Korn H, Triller A, Mallet A, Faber DS. Fluctuating responses at a central synapse: n of binomial fit predicts number of stained presynaptic boutons. Science. 1981;213:898–901. doi: 10.1126/science.6266015. [DOI] [PubMed] [Google Scholar]
- 28.Kraushaar U, Jonas P. Efficacy and stability of quantal GABA release at a hippocampal interneuron-principal neuron synapse. J Neurosci. 2000;20:5594–5607. doi: 10.1523/JNEUROSCI.20-15-05594.2000. [DOI] [PMC free article] [PubMed] [Google Scholar]
- 29.Littleton JT, Bai J, Vyas B, Desai R, Baltus AE, Garment MB, Carlson SD, Ganetzky B, Chapman ER. Synaptotagmin mutants reveal essential functions for the C2B domain in Ca2+-triggered fusion and recycling of synaptic vesicles in vivo. J Neurosci. 2001;21:1421–1433. doi: 10.1523/JNEUROSCI.21-05-01421.2001. [DOI] [PMC free article] [PubMed] [Google Scholar]
- 30.Meyer AC, Neher E, Schneggenburger R. Estimation of quantal size and number of functional active zones at the calyx of Held synapse by non-stationary EPSC variance analysis. J Neurosci. 2001;21:7889–7900. doi: 10.1523/JNEUROSCI.21-20-07889.2001. [DOI] [PMC free article] [PubMed] [Google Scholar]
- 31.Murthy VN, Sejnowski TJ, Stevens CF. Heterogeneous release properties of visualized individual hippocampal synapses. Neuron. 1997;18:599–612. doi: 10.1016/s0896-6273(00)80301-3. [DOI] [PubMed] [Google Scholar]
- 32.Neher E. Vesicle pools and Ca2+ microdomains: new tools for understanding their roles in neurotransmitter release. Neuron. 1998;20:389–399. doi: 10.1016/s0896-6273(00)80983-6. [DOI] [PubMed] [Google Scholar]
- 33.Neher E, Sakaba T. Combining deconvolution and noise analysis for the estimation of transmitter release rates at the calyx of Held. J Neurosci. 2001;21:444–461. doi: 10.1523/JNEUROSCI.21-02-00444.2001. [DOI] [PMC free article] [PubMed] [Google Scholar]
- 34.Oleskevich S, Clements J, Walmsley B. Release probability modulates short-term plasticity at a rat giant terminal. J Physiol (Lond) 2000;524 Pt 2:513–523. doi: 10.1111/j.1469-7793.2000.00513.x. [DOI] [PMC free article] [PubMed] [Google Scholar]
- 35.Orear J. Least squares when both variables have uncertainties. Am J Physics. 1982;50:912–916. [Google Scholar]
- 36.Otis T, Zhang S, Trussell LO. Direct measurement of AMPA receptor desensitization induced by glutamatergic synaptic transmission. J Neurosci. 1996;16:7496–7504. doi: 10.1523/JNEUROSCI.16-23-07496.1996. [DOI] [PMC free article] [PubMed] [Google Scholar]
- 37.Partin KM, Patneau DK, Mayer ML. Cyclothiazide differentially modulates desensitization of alpha-amino-3-hydroxy-5-methyl-4-isoxazolepropionic acid receptor splice variants. Mol Pharmacol. 1994;46:129–138. [PubMed] [Google Scholar]
- 38.Pyle JL, Kavalali ET, Piedras-Rentería ES, Tsien RW. Rapid reuse of readily releasable pool vesicles at hippocampal synapses. Neuron. 2000;28:221–231. doi: 10.1016/s0896-6273(00)00098-2. [DOI] [PubMed] [Google Scholar]
- 39.Quastel DM. The binomial model in fluctuation analysis of quantal neurotransmitter release. Biophys J. 1997;72:728–753. doi: 10.1016/s0006-3495(97)78709-5. [DOI] [PMC free article] [PubMed] [Google Scholar]
- 40.Reid CA, Clements JD. Postsynaptic expression of long-term potentiation in the rat dentate gyrus demonstrated by variance–mean analysis. J Physiol (Lond) 1999;518:121–130. doi: 10.1111/j.1469-7793.1999.0121r.x. [DOI] [PMC free article] [PubMed] [Google Scholar]
- 41.Sakaba T, Neher E. Quantitative relationship between transmitter release and calcium current at the calyx of Held synapse. J Neurosci. 2001;21:462–476. doi: 10.1523/JNEUROSCI.21-02-00462.2001. [DOI] [PMC free article] [PubMed] [Google Scholar]
- 42.Sätzler K, Söhl L, Saracoglu K, Nestel S, Frotschner M, Eils R, Lübke JH, Sakmann B. 3-D reconstruction, detailed analysis of active zones located at the calyx of Held. Soc Neurosci Abstr. 2001;27:384.15. [Google Scholar]
- 43.Scheuss V, Neher E. Estimating synaptic parameters from mean, variance, and covariance in trains of synaptic responses. Biophys J. 2001;81:1970–1989. doi: 10.1016/S0006-3495(01)75848-1. [DOI] [PMC free article] [PubMed] [Google Scholar]
- 44.Schikorski T, Stevens CF. Quantitative ultrastructural analysis of hippocampal excitatory synapses. J Neurosci. 1997;17:5858–5867. doi: 10.1523/JNEUROSCI.17-15-05858.1997. [DOI] [PMC free article] [PubMed] [Google Scholar]
- 45.Schneggenburger R, Neher E. Intracellular calcium dependence of transmitter release rates at a fast central synapse. Nature. 2000;406:889–893. doi: 10.1038/35022702. [DOI] [PubMed] [Google Scholar]
- 46.Schneggenburger R, Meyer AC, Neher E. Released fraction and total size of a pool of immediately available transmitter quanta at a calyx synapse. Neuron. 1999;23:399–409. doi: 10.1016/s0896-6273(00)80789-8. [DOI] [PubMed] [Google Scholar]
- 47.Silver RA, Momiyama A, Cull-Candy SG. Locus of frequency-dependent depression identified with multiple-probability fluctuation analysis at rat climbing fibre-Purkinje cell synapses. J Physiol (Lond) 1998;510:881–902. doi: 10.1111/j.1469-7793.1998.881bj.x. [DOI] [PMC free article] [PubMed] [Google Scholar]
- 48.Sun J-Y, Wu L-G. Fast kinetics of exocytosis revealed by simultaneous measurements of presynaptic capacitance and postsynaptic currents at a central synapse. Neuron. 2001;30:171–182. doi: 10.1016/s0896-6273(01)00271-9. [DOI] [PubMed] [Google Scholar]
- 49.Takahashi T, Forsythe ID, Tsujimoto T, Barnes-Davies M, Onodera K. Presynaptic calcium current modulation by a metabotropic glutamate receptor. Science. 1996;274:594–597. doi: 10.1126/science.274.5287.594. [DOI] [PubMed] [Google Scholar]
- 50.Taschenberger H, von Gersdorff H. Fine-tuning an auditory synapse for speed and fidelity: developmental changes in presynaptic waveform, EPSC kinetics, and synaptic plasticity. J Neurosci. 2000;20:9162–9173. doi: 10.1523/JNEUROSCI.20-24-09162.2000. [DOI] [PMC free article] [PubMed] [Google Scholar]
- 51.Tong G, Jahr CE. Multivesicular release from excitatory synapses of cultured hippocampal neurons. Neuron. 1994;12:51–59. doi: 10.1016/0896-6273(94)90151-1. [DOI] [PubMed] [Google Scholar]
- 52.Traynelis SF. Software-based correction of single compartment series resistance errors. J Neurosci Methods. 1998;86:25–34. doi: 10.1016/s0165-0270(98)00140-x. [DOI] [PubMed] [Google Scholar]
- 53.Triller A, Korn H. Transmission at a central inhibitory synapse. III. Ultrastructure of physiologically identified and stained terminals. J Neurophysiol. 1982;48:708–736. doi: 10.1152/jn.1982.48.3.708. [DOI] [PubMed] [Google Scholar]
- 54.Trussell LO, Zhang S, Raman IM. Desensitization of AMPA receptors upon multiquantal neurotransmitter release. Neuron. 1993;10:1185–1196. doi: 10.1016/0896-6273(93)90066-z. [DOI] [PubMed] [Google Scholar]
- 55.Tsodyks M, Markram H. The neural code between neocortical pyramidal neurons depends on neurotransmitter release probability. Proc Natl Acad Sci USA. 1997;94:719–723. doi: 10.1073/pnas.94.2.719. [DOI] [PMC free article] [PubMed] [Google Scholar]
- 56.Vere-Jones D. Simple stochastic models for the release of quanta of transmitter from a nerve terminal. Aust J Stat. 1966;8:53–63. [Google Scholar]
- 57.von Gersdorff H, Schneggenburger R, Weis S, Neher E. Presynaptic depression at a calyx synapse: the small contribution of metabotropic glutamate receptors. J Neurosci. 1997;17:8137–8146. doi: 10.1523/JNEUROSCI.17-21-08137.1997. [DOI] [PMC free article] [PubMed] [Google Scholar]
- 58.Waldeck RF, Pereda A, Faber DS. Properties and plasticity of paired-pulse depression at a central synapse. J Neurosci. 2000;20:5312–5320. doi: 10.1523/JNEUROSCI.20-14-05312.2000. [DOI] [PMC free article] [PubMed] [Google Scholar]
- 59.Walmsley B. In: Quantal analysis of synaptic transmission. In: Electrophysiology. A Practical Approach. Wallis DI, editor. IRL, Oxford UP; Oxford: 1993. pp. 109–141. [Google Scholar]
- 60.Walmsley B, Edwards FR, Tracey DJ. Nonuniform release probabilities underlie quantal synaptic transmission at a mammalian excitatory central synapse. J Neurophysiol. 1988;60:889–908. doi: 10.1152/jn.1988.60.3.889. [DOI] [PubMed] [Google Scholar]
- 61.Wang L-Y, Kaczmarek LK. High-frequency firing helps replenish the readily releasable pool of synaptic vesicles. Nature. 1998;394:384–388. doi: 10.1038/28645. [DOI] [PubMed] [Google Scholar]
- 62.Wu LG, Borst JG. The reduced release probability of releasable vesicles during recovery from short-term synaptic depression. Neuron. 1999;23:821–832. doi: 10.1016/s0896-6273(01)80039-8. [DOI] [PubMed] [Google Scholar]
- 63.Xu T, Binz T, Niemann H, Neher E. Multiple kinetic components of exocytosis distinguished by neurotoxin sensitivity. Nat Neurosci. 1998;1:192–200. doi: 10.1038/642. [DOI] [PubMed] [Google Scholar]
- 64.Xu-Friedman MA, Harris KM, WG R. Three-dimensional comparison of ultrastructural characteristics at depressing and facilitating synapses onto cerebellar Purkinje cells. J Neurosci. 2001;21:6666–6672. doi: 10.1523/JNEUROSCI.21-17-06666.2001. [DOI] [PMC free article] [PubMed] [Google Scholar]
- 65.Yamada KA, Tang CM. Benzothiadiazides inhibit rapid glutamate receptor desensitization and enhance glutamatergic synaptic currents. J Neurosci. 1993;13:3904–3915. doi: 10.1523/JNEUROSCI.13-09-03904.1993. [DOI] [PMC free article] [PubMed] [Google Scholar]
- 66.Zucker RS. Changes in the statistics of transmitter release during facilitation. J Physiol (Lond) 1973;229:787–810. doi: 10.1113/jphysiol.1973.sp010167. [DOI] [PMC free article] [PubMed] [Google Scholar]
- 67.Zucker RS. Short-term synaptic plasticity. Annu Rev Neurosci. 1989;12:13–31. doi: 10.1146/annurev.ne.12.030189.000305. [DOI] [PubMed] [Google Scholar]