Abstract
The ability of neuroglia to buffer local increases of extracellular K+ has been known from in vitrostudies. This property may confer on these cells an active role in the modulation and spreading of cortical oscillatory activities. We addressed the question of the spatial buffering in vivoby performing single and double intraglial recordings, together with measures of the extracellular K+ and Ca2+ concentrations ([K+]out and [Ca2+]out) in the cerebral cortex of cats under ketamine and xylazine anesthesia during patterns of slow sleep oscillations and spike-wave seizures. In addition, we estimated the fluctuations of intraglial K+concentrations ([K+]in). Measurements obtained during the slow oscillation indicated that glial cells phasically take up part of the extracellular K+ extruded by neurons during the depolarizing phase of the slow oscillation. During this condition, the redistribution of K+ appeared to be local. Large steady increases of [K+]out and phasic potassium accumulations were measured during spike-wave seizures. In this condition, [K+]in rose before [K+]out if the glial cells were located at some distance from the epileptic focus, suggesting faster K+ diffusion through the interglial syncytium. The simultaneously recorded [Ca2+]outdropped steadily during the seizures to levels incompatible with efficient synaptic transmission, but also displayed periodic oscillations, in phase with the intraseizure spike-wave complexes. In view of this fact, and considering the capability of K+ to modulate neuronal excitability both at the presynaptic and postsynaptic levels, we suggest that the K+ long-range spatial buffering operated by glia is a parallel synchronizing and/or spreading mechanism during paroxysmal oscillations.
Keywords: epilepsy, intracellular, sleep, potassium, calcium, oscillations
The traditional view asserts that glial cells maintain homeostasis of the extracellular ionic concentrations, whereas neurons, through their ability to spike, provide information propagation and processing. Among the mechanisms underlying the regulatory function of glial cells, the maintenance of a constant extracellular potassium concentration ([K+]out) would be mainly achieved through spatial buffering (Orkand et al., 1966; Walz, 1989; Newman, 1995). Moreover, the presence of receptors for various neurotransmitters on glial membranes (Sontheimer et al., 1988; Bormann and Kettenmann, 1988; MacVicar et al., 1989; Rosier et al., 1993;Steinhäuser and Gallo, 1996), as well as the release of neurotransmitters by glial cells (Martin et al., 1990; Levi and Patrizio, 1992; Levi and Gallo, 1995; Araque et al., 1999) suggests a new relationship between glia and neurons. Overwhelming evidence for such physiological properties came from studies conducted in vitro or in cultures, conditions with a poor behavioral repertoire. We therefore approached the neuron–glia dialogue during normal slow sleep oscillations, as well as, to mark the difference between physiology and pathology, paroxysmal spike-wave (SW) seizures developing from them.
During slow-wave sleep, the cortex generates a slow oscillation (<1 Hz, mostly in the 0.6–0.9 Hz range as a function of the depth of sleep), and the membrane potential of neurons alternates between depolarization and hyperpolarization (Steriade et al., 1993b). Similarly, glial cells display the slow oscillation as phasic depolarizing potentials, although with a different time course than that of neurons (Amzica and Neckelmann, 1999). This slow cortical oscillation may evolve into SW seizures in parallel with an increased synchronization of cortical networks (Steriade and Amzica, 1994;Steriade and Contreras, 1995; Steriade et al., 1998). The mechanisms underlying this transition are not fully understood. Accumulation of K+ in the extracellular space is known to favor epileptic discharges (Zuckermann and Glaser, 1968), and increases of the [K+]outhave been well documented during seizures (Fertziger and Ranck, 1970;Futamachi et al., 1974; Moody et al., 1974). A failure in K+ uptake by glial cells has been shown to cause paroxysmal activity (Janigro et al., 1997). Moreover, SW seizures are associated with extracellular Ca2+depletion (Heinemann et al., 1977, 1986; Somjen, 1980; Pumain et al., 1983; Hablitz and Heinemann, 1987), which could compromise synaptic transmission. Several questions remain: (1) in the absence of reliable synaptic transmission, what supports increased synchronization during epileptic discharges? (2) How does glial spatial buffering of K+ work during normal and paroxysmal oscillations? (3) What mechanism creates the oscillatory behavior (2–3 Hz) during SW seizures?
To answer these questions we tested whether the activity of glial cells shows dynamic changes that could allow them to modulate neuronal behavior. We performed intracellular recordings of glial cells and neurons (occasionally simultaneous impaling of two cells) together with extracellular field potentials and [K+]out and [Ca2+]outmeasurements during the abovementioned activities. We hypothesize that spatial buffering acts in different ways during normal and paroxysmal sleep oscillations. In the former case we expect that a local and mild increase of the [K+]out is promptly taken up by glia and buffered at a short distance. In contrast, SW seizures accompanied by large variations of [K+]out would require spatial buffering over large cortical territories, thus contributing to the spreading of the seizure.
MATERIALS AND METHODS
Animal preparation. Eighty cats of both sexes were used for these experiments. The surgical procedure started with the administration of ketamine–xylazine anesthesia (15 and 3 mg/kg, respectively), tracheotomy for intubation, and muscle paralysis with gallamine triethiodide. The animals were artificially ventilated (20–30 cycles/min), and the end-tidal CO2concentration was maintained at ∼3.7% (±0.2) by adjusting the O2 concentration in the airflow of the ventilation. Starting with the tracheotomy and throughout the experiment, all incision and pressure points were infiltrated with lidocaine. The presence of high-amplitude slow waves in the EEG and a heart rate <110 beats/min were considered as signs of deep anesthesia. Supplemental doses of anesthetic were applied if the animal began to display fast waves and/or an accelerated heart rate. The craniotomy exposed the suprasylvian gyrus, at which point DC pipettes, field potential coaxial, and K+- or Ca2+-sensitive electrodes were lowered into the cortex. Stability of the recordings was enhanced by cisternal drainage, bilateral pneumothorax, and by filling the hole in the calvarium with a 4% solution of agar. Fluid loss during the experiment was compensated by intravenous injections of saline (20–30 ml/experiment). At the end of the experiments, the animals received a lethal dose of sodium pentobarbital.
Electrode preparation and recordings. Intracellular recordings were obtained from areas 5 and 7 of the suprasylvian gyrus with glass micropipettes (tip diameter, < 0.5 μm) filled with a 3m solution of potassium acetate or with a 0.1m solution of BAPTA (in situ impedance 30–40 MΩ). The same type of electrodes, with larger tips (1–2 μm), was used for the recording of DC extracellular field potentials. These two types of signals were passed through a high-impedance amplifier with active bridge circuitry (Neurodata). The EEG was recorded monopolarly with coaxial tungsten electrodes at a depth of 1 mm and at the surface of the cortex (reference in the paralyzed neck muscles). These potentials were bandpass filtered between 0.3 Hz and 1 kHz. The K+-sensitive microelectrodes (KSMs) were made according to the procedure described in other studies (Janigro et al., 1997; de Curtis et al., 1998). We used double-barrel pipettes in which the KSM was pretreated with dimethylchlorosilane, dried at 120°C for 2 hr, and the tip was filled with the K+ ionophore I-cocktail A (Fluka, Buchs, Switzerland). The rest of the K+-sensitive barrel was filled with KCl (0.2 m), whereas the other barrel was filled with NaCl (2 m). The KSM was calibrated in solutions containing: NaCl 126 mm, KCl 2.3 mm, NaHCO3 26 mm, MgSO4 1.3 mm, CaCl2 2.4 mm, KH2PO4 1.2 mm, glucose 15 mm, HEPES 5 mm, thiourea 0.4 mm, and 3% dextran 70.000, pH 7.3. The K+concentration of the solution was adjusted between 1 and 25 mm by substituting the NaCl with KCl. The relationship between concentration and voltage was derived in accordance with the Nicolsky–Eisenmann equation (Ammann, 1986). The Ca2+-sensitive microelectrodes (CaSMs) were manufactured similarly to the KSMs, then the tip of the barrel was filled with the Ca2+ ionophore I-Cocktail A (Fluka), and the rest of the barrel was filled with CaCl2 (2 m). They were calibrated in solutions where the Ca2+concentration was varied between 0.2 and 6 mm.
The time course of the response of ion-sensitive microelectrodes (ISMs) was measured stepping the electrodes through drops containing different K+ concentrations (2.5, 4.5, 6.5, and 22.5 mm) or Ca2+ concentrations (0.2, 0.5, 1, 1.5, 2, 4, and 6 mm). The drops were held at close distance by silver rings, which were connected to the ground. Only electrodes reaching 90% of the response in <20 msec were used. Thus, the electrodes were far faster than the phenomena under investigation. Because ion potentials could be contaminated through capacitive coupling by field potentials, the latter were measured with the pair electrode and subtracted from the former. The resulting signal was linearized and transposed into concentration values using the parameters extracted from the logarithmic fitting of the calibration points. The headstage amplifier for ISMs was modified with an ultra ultra low input current (<25 fA) amplifier (National Semiconductor). All signals were digitally converted (20 kHz sampling rate) and recorded on tape for off-line analysis.
Analysis. The core of our analysis relies on time relationships between the recorded voltage (concentration) time series. They were approached either statically [through wave-triggered averages (WTA)] or dynamically (through sequential time lags). Both procedures needed the detection of stereotyped points within the oscillatory cycle of slow or paroxysmal oscillations. To detect the beginning of an oscillatory cycle, we calculated the first derivative of an intracellular signal and set a marker every time the derivative crossed the zero line in the upward direction. Avoiding sporadic biphasic wavelets required additional restrictions: only those markers were kept that were preceded by a negative derivative and followed by a positive derivative, for at least 40% of the duration of a cycle.
The WTA was calculated by averaging equal segments from a given recording channel around the time marker detected as explained above. This way, the WTA yields to an average shape of a given waveform over a period of time. Deriving the WTA from potentials recorded simultaneously over several channels allows for the comparison of the respective waveforms at various brain locations. In such cases, the time markers were detected in only one of the channels, and the WTAs were calculated separately for each lead, relative to those markers.
Another method of looking at the relationship between activities at various recording sites was to determine the time lag between corresponding events (e.g., the time lags between the onset of each oscillatory cycle in two intracellularly recorded glial cells), and to follow it as the activities evolve in time. To achieve this, we detected, with the methods described above, the time markers for a given event during each oscillatory cycle, and for each channel separately. Then, after subtracting one from the other, we obtained the time lag separating them.
The slow (<1 Hz) oscillation displays a relatively good stability of frequency and shape (Steriade et al., 1993b). However, the seizures recorded during these experiments were variable in duration and contained intraseizure evolutions. To be able to compare seizures with various features, we developed a procedure that generates the upper envelope of a seizure and artificially rescales its duration to a total duration of 100%. It consisted of determining the start and end points of each seizure at the onset of the first ictal discharge and the offset of the last ictal event, respectively. Then, we extracted the total time period of the seizure between the markers plus a pre- and a post-seizure epoch of 20% of the actual duration of the seizure. A spectral analysis was performed to determine the dominant oscillatory frequency developed during each seizure. The lowest value from all included seizures was used to calculate the minimum duration of a generic window. All considered seizures were thereafter divided into an equal number of windows, a window having at least 1.5 oscillatory periods (reciprocal of the lowest frequency detected as above). We recorded the maximum value from each window. Thus, each seizure was reduced to an envelope with a fixed number of samples. Finally, the envelopes of various seizures were averaged. As an undersampled signal, the envelopes are useful only for the global shape of a seizure. However, the sampling windows are the same for all simultaneously recorded channels, and the phasic events within such a window are coherent with small phase shifts (see Results), indicating that the results drawn from the envelopes are not affected by the undersampling. Both averaged envelopes and WTAs were simultaneously computed with the SD for each sample of the signal.
The envelope, as well as WTAs, derived from time series with simultaneous intracellular potentials and extracellular ion recordings, were further used to calculate the intracellular ionic concentration according to the Nernst equilibrium potential:
where Ex is the measured membrane potential of ion x, whereas Cinand Cex are the intracellular and extracellular concentrations, respectively.
The measures of the degree of synchronization between various time series relied on the calculation of the coherence and/or cross-correlation functions, as described in Bendat and Piersol (2000).
RESULTS
Database
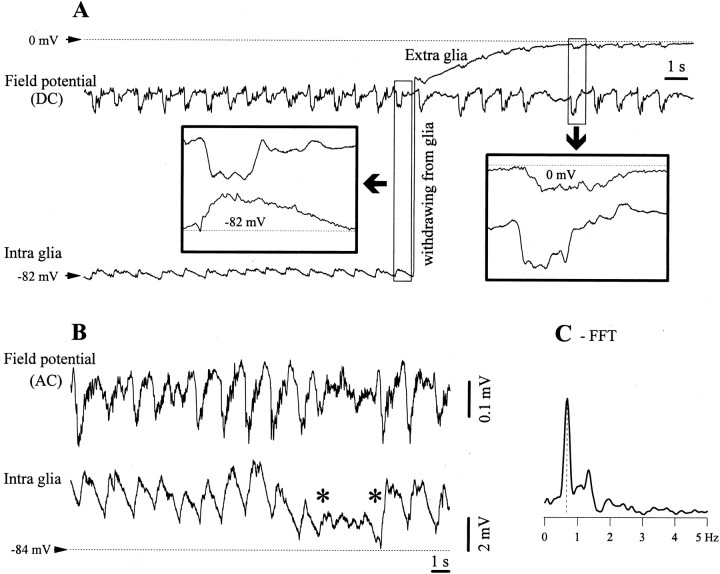
A total of 20 intraneuronal and 180 intraglial recordings were considered for this study, of which 47 were dual glial impalements. Before being considered for analysis, intraglial recordings had to satisfy the following criteria. (1) The impalement had to be accompanied by a sudden drop of the membrane potential (Vm) of more than −70 mV, followed by a stable resting level that needed no current compensation. No spontaneous action potentials were fired during or after the impalement. (2) At the end of the recording, the pipette was withdrawn from the cell and had to display a mirror pattern with respect to the impalement (Fig. 1A). (3) The recording had to be stable throughout and did not require the application of steady hyperpolarizing current. (4) No action potentials could be triggered, either spontaneously or by intracellular depolarizing pulses. The latter had sufficient current intensity to reach a Vm more positive than −55 mV, corresponding to the voltage range where neurons would fire action potentials. The present database does not include glial recordings with resting Vm in the higher (approximately −40 mV) depolarizing range (McKhann et al., 1997). The criteria for good quality intraneuronal recordings were: stable, more negative than −60 mV Vm at rest (without current), and overshooting action potentials.
Fig. 1.
Slow oscillation in glial cells. A, Intracellular and DC field potential recording before the withdrawal of the micropipette from the glia. The two epochs within the squares are expanded to show, for a cycle of the slow oscillation, the relationship between intraglial and extracellular field potentials (atleft) and the similarity of the two field potentials recorded by two different electrodes. The membrane potential (Vm) of the intracellular recording and the neutral extracellular potential are indicated.B, Short period of activated EEG (betweenasterisks) interrupting the slow oscillation, as recorded from a glial cell and AC depth field potential. The activation of the EEG is associated with relative hyperpolarization of the glial cell. C, Power spectrum of a 75 sec period containing the one in B. The main oscillatory frequency is ∼0.7 Hz with some additional components in the 0.1–1.5 Hz frequency band.
The slow oscillation in glial cells
In intraglial recordings the slow oscillation consisted of low-amplitude alternations of the Vm above its resting level (Fig. 1A,B). The resting Vm of glial cells during sleep-like activity dominated by the slow oscillation was −83.2 ± 3.4 mV (mean ± SD) and ranged from −98 to −72 mV. The amplitude of the phasic depolarizations was 1.94 ± 0.37 mV. This value represents the average of the mean amplitudes calculated from 96 glial cells displaying stable periods of slow oscillation for at least 2 min. The period depicted in Figure 1A emphasizes the difference between intraglial potentials (left inset) and the corresponding phasic events recorded extracellularly (right inset). In both cases, the control trace is the DC field potential measured in the vicinity of the impaling site. The withdrawal from the glia produced a sudden voltage deflection and the reversal of the phasic potentials: the glial depolarization was replaced by a field negative wave.
Occasionally, the continuous pattern of slow oscillation was interrupted by brief spontaneous activations of the electrographic activity (Fig. 1B, period between asterisks). Such periods were always reflected in the glial recording as steady hyperpolarizations. The level at which the hyperpolarization occurred could not be distinguished from the minimum value attained during the slow oscillation. Although there is no clear proof in favor or against an active hyperpolarization of glial cells during activated periods, it appears likely that the recorded Vmresults from the absence of superimposed cyclic depolarizations (see Discussion).
The spectral composition, as calculated from glial recordings, was dependent on the state of the network (Amzica and Steriade, 1998), but always contained a major peak at <1 Hz. For the case presented in Figure 1B, the main oscillatory frequency was 0.7 Hz (Fig. 1C).
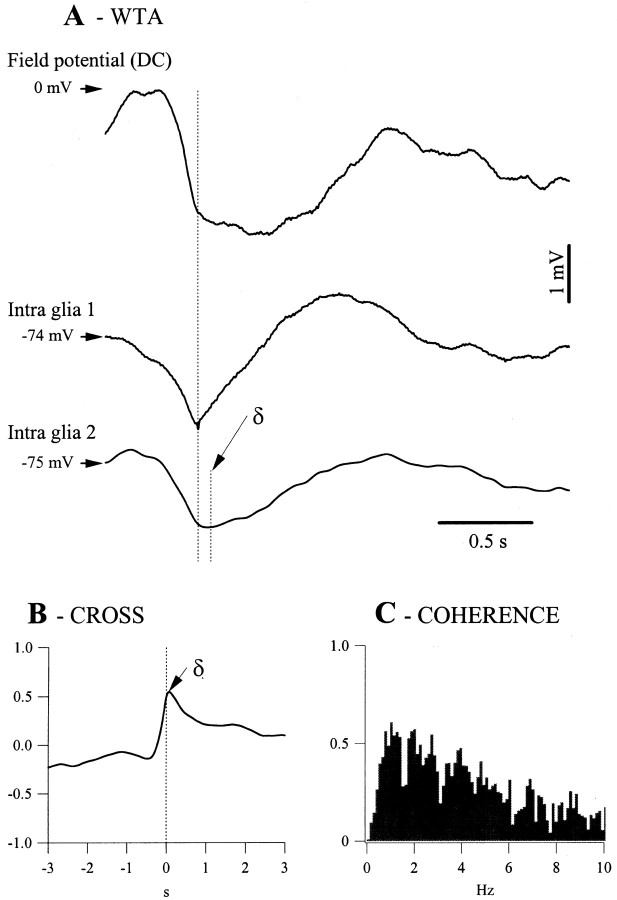
The synchronization of glial cells during the slow oscillation was assessed using simultaneous recordings of glia pairs (Fig.2). The WTAs were calculated around the moment marking the onset of the depolarization of a cycle in one of the glial cells (Fig. 2A). They displayed a time lag that was dependent on the horizontal distance separating the cells. The time lag (δ = 69 msec in this case) was calculated as the average of individual time lags and was the same as the one resulting from the peak of the cross-correlation (Fig. 2B). This coincidence confirms that depolarization onset is a reliable marker for assessing synchrony and that the glial depolarization during the slow oscillation behaves as a propagating phenomenon. The height of the cross-correlation (56%) was slightly lower than the main peak of the coherence function (Fig. 2C, 60%). This behavior reflected the results obtained from all 47 pairs of glia. The average correlation peak was 62 ± 5.4%, lower in all cases than the main coherence peak, which was 64 ± 4.7%. A higher coherence for the main oscillatory frequency than the global correlation indicates that the shape of the glial potentials also contains asynchronous components.
Fig. 2.
Synchronization of the slow oscillation in glial pairs from the suprasylvian cortex. A, WTAs (n = 50) from two glial cells recorded simultaneously with the extracellular field potential. WTAs were triggered by the onset of the depolarization in cell 1(longvertical line). The small vertical line marked with the symbol δ corresponds to the average time lags of the second cell with respect to the first (δ = 69 msec). B, Cross-correlation between the time series of the two intraglial recordings that led to the WTAs inA. The correlation peak has an amplitude of 0.56 and an abscissa corresponding to the time lag (δ) measured inA. C, The coherence function calculated for the same time series displays a main coherent oscillatory peak of 0.6 at ∼1 Hz.
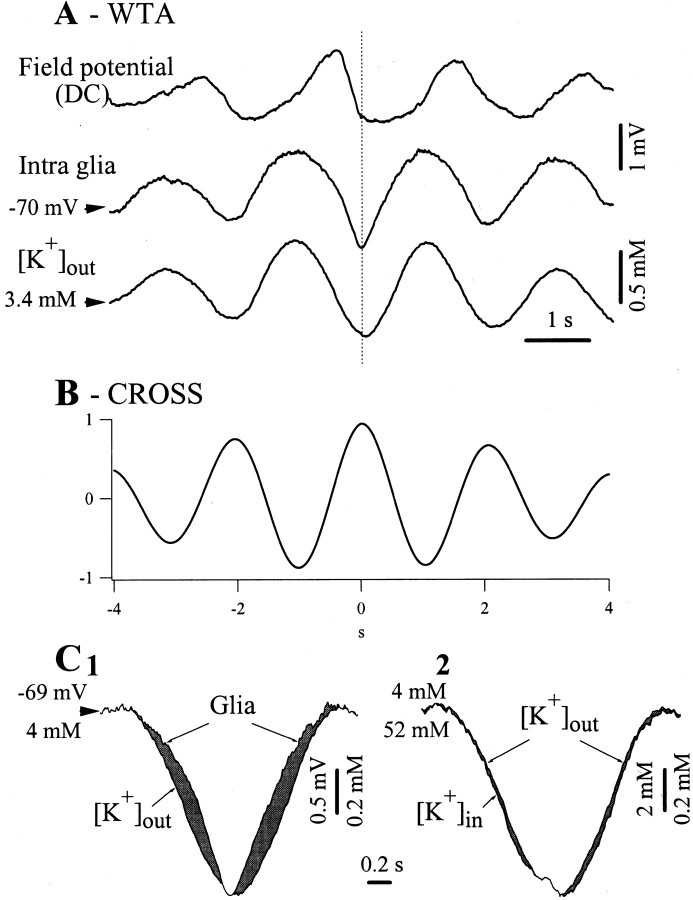
To test the relationship between intraglial potentials and the variations of the [K+]out during the slow oscillation, we placed a KSM close (<0.5 mm) to the intracellular electrode. The results are shown in Figure3. The slow oscillation was associated with similar phasic events in the [K+]out (Fig.3A). The amplitude of the K+variations were in the range of 0.7–1.1 mm (on average, 0.78 ± 0.13 mm), with an average extracellular-concentration/intracellular-voltage ratio of 0.42 mm/mV. During periods with stable slow oscillations, the average resting level of [K]out was 3.2 mm. The cross-correlations between intraglial and K+ variations (Fig. 3B) displayed high peaks (97 ± 3.2%) and short time lags (<7 msec). At this spatial and time resolution, and taking into account the time constants of the KSMs, it would be premature to point to a precise mechanism responsible for the measured time lag, especially because for some parts of the potentials the [K+]o preceded the glial Vm, whereas for others it lagged (Fig. 3C1).
Fig. 3.
Short-range spatial buffering of extracellular K+ during the slow oscillation. Simultaneous recording of a glia, DC field potential, and extracellular K+ concentration ([K+]out). A, WTAs (n = 50) triggered by the onset of the intraglial depolarization show in-phase variations of the [K+]out and glial potentials. The former were obtained after subtracting the DC field potential from the potentials measured with the ion-sensitive microelectrode (see Materials and Methods). B, Cross-correlation between glial and K+ time series performed over a duration of 2 min. The central correlation peak indicates a correlation coefficient of 94%, with a latency of 7 msec (the intraglial potential precedes the K+ concentration). C1, Superimposition of the intraglial and [K+]out WTA signals expanded at the maximum amplitude, to provide a comparison between the dynamic variations of the two signals (the respective starting and calibration values are indicated separately). C2, Superimposition of the extracellular and intracellular K+ concentration WTAs expanded at the maximum amplitude. The latter ([K+]in) was calculated from the Nernst equilibrium potential. Note little dynamic difference with respect to the [K+]out signal.
The superposition of the glial and [K+]out WTAs (Fig.3C) shows that the peak depolarization of the glia was attained at the same time with the maximum [K+]out. The two waves in Figure 3C have different amplitudes, reflected by the respective calibration bars, their superimposition being meant to underline the different dynamics. The glialVm repolarized slower and depolarized faster than the corresponding phases of the concentration. Assuming that the glial membrane is permeable to the measured [K+]out, we calculated the intracellular K+concentration ([K+]in) from the Nernst equation. The superposition of the extracellular and the estimated intracellular concentration curves (Fig. 3C2) shows similar dynamics. Some very small differences were, however, present (see gray areas), betraying an alternative change in the orientation of the concentration gradient. The repolarizing slope is marked by faster variations of the intracellular concentration, whereas the depolarizing slope is associated with faster rise of the extracellular concentration. This situation was verified in 39 of the 45 recordings (87%) where at least one glial cell was recorded simultaneously with the [K+]out. In the remaining cases (n = 6), the [K+]out curve lagged the intracellular potential such to prevent the calculation of the [K+]in.
Spike-wave seizures in glial cells
The aim of this section is to investigate the voltage and time relationships developed between glial cells and their extracellular environment during SW seizures and to set the results in a comparative perspective with respect to their behavior during normal slow sleep oscillations.
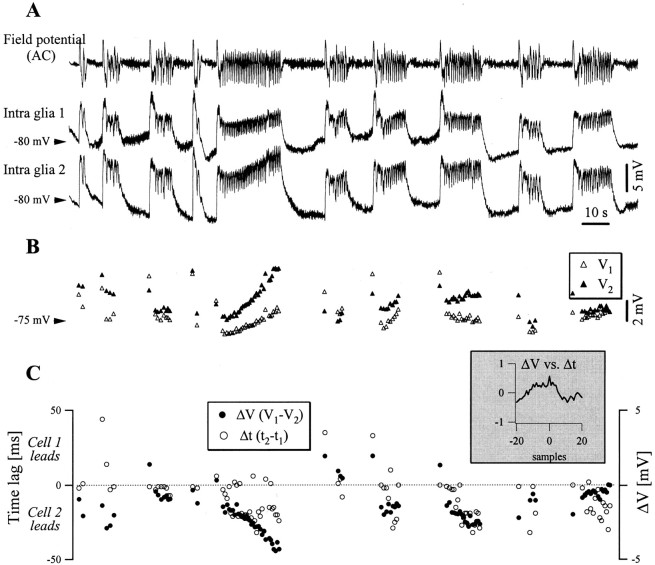
Occasionally the slow oscillation developed into paroxysmal epileptic-like discharges. This transition in glial cells has been shown elsewhere (Amzica and Steriade, 2000). Invariably, SW seizures in glial cells were associated with steady depolarizations, similar to the ones already reported in cortical (Grossman and Hampton, 1968; Sypert and Ward, 1971) and hippocampal (Dichter et al., 1972) glia. Eventually such seizures could develop into recurrent seizures (Fig.4A), providing the optimal condition for studying the dynamic evolution of time and voltage relationships between glial cells within the same animal. These relationships were again studied by means of simultaneous intraglial recordings. Invariably, the seizures induced different amplitudes in the two glial cells. We assume that this is attributable to the fact that one of the cells is located closer to the epileptic “focus.”
Fig. 4.
Dynamic time and voltage relationships between pairs of glial cells during SW seizures. A, Recurrent seizures in a dual intraglial recording. B, Dynamic evolution, cycle-by-cycle, of the maximum voltage of the SW complexes in the two glial cells. Open triangles are for the first glia, black triangles are for the second glia, and both are superimposed at the same voltage scale and aligned with the signals in A. Note that the first cell usually started with a higher amplitude depolarization than the second one (open triangle above black triangle), but displayed during the seizure complexes of lower amplitude. C, Evolution of the individual voltage gradients (black circles) and time lags (open circles) during the seizures depicted in A. The time lag scale is atleft, whereas the voltage scale is atright. The two parameters from this panel had similar time courses, as proved by their cross-correlation (inset), with a peak of 0.57 at 0 samples time lag.
The calculation of the maximum voltage of each oscillating cycle gave a global image of the evolution of the same seizure in glial pairs (Fig.4B). The development of this parameter showed some peculiarities. First, the cell showing the highest depolarization during the initial ictal event tended to reach subsequently a lower level of depolarization during the seizure (68% of the seizures). Second, there was a dynamic evolution of the voltage difference (ΔV = V1 −V2) during the phasic SW complexes (Fig. 4C, black dots). This parameter is of special interest for the voltage and/or concentration gradients that may develop between glial cells belonging to a functional syncytium during seizures. Generally, the voltage difference increased with the progression of the seizure (79% of the seizures). Moreover, the cross-correlation between the voltage differences (ΔV) and the time lags measured at the initiation of an oscillatory cycle (Δt = t2 −t1) showed a direct relationship (Fig.4C, inset). In other words, the greater the voltage gradient between the two glial cells, the greater the lag of the cell showing the smaller depolarization. A study devoted to the dynamic evolution of synchrony between cortical neurons has shown that the time lag between neurons tends to diminish with the progression of the SW seizures (Steriade and Amzica, 1994). Thus, the present findings suggest that the time lag between glial cells is not a reflection of neuronal interaction, but rather of some interglial exchange.
In addition to the already known patterns developed by glial cells during epileptic seizures, we also observed intraseizure oscillations that corresponded to the ictal SW pattern. The first SW complex (Fig.5A1) almost reached the depolarization plateau of the seizure, and thus had the largest amplitude when compared with the following SW complexes (which started at an already depolarized Vm). These phasic depolarizations had similar shapes to the ones accompanying the slow oscillation (Fig. 5A2), although the duration of the cycles was shorter because of the accelerated rhythm of the SW complexes. The frequency recorded during such seizures ranged between 1.5 and 3 Hz, with variability even within a single seizure. Thus, we did not calculate an average value for the seizure frequency.
Fig. 5.
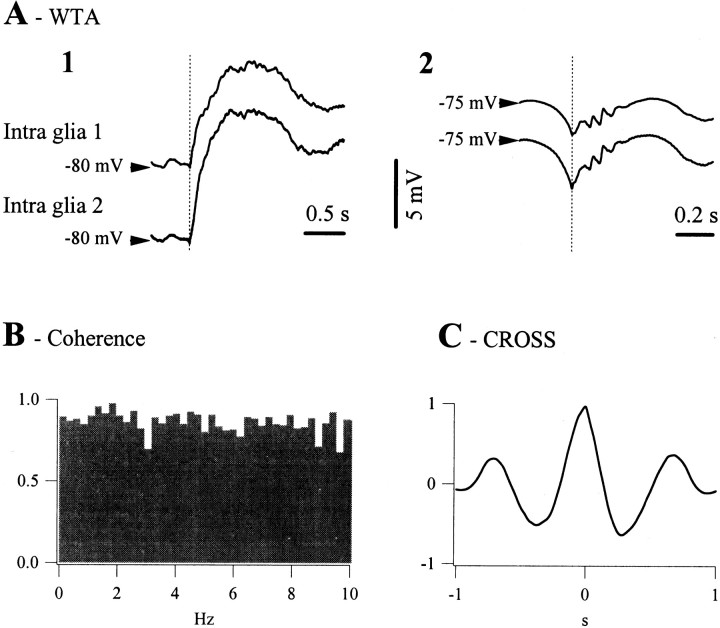
Average voltage relationships and synchronization parameters for the glial pair depicted in Figure 4. A1, WTAs from the first paroxysmal discharges in 10 seizures.A2, WTAs from the ictal SW complexes recorded during the same seizures. B, Coherence function between the two glial cells. The highest peak reached 0.98 at a frequency of 1.9 Hz.C, Cross-correlation between the glial potentials (correlation peak of 0.97 at a time lag of 4 msec, the second cell leading the first one).
Regardless of the ongoing oscillation frequency, the coherence of the glial pairs increased and the time lags were smaller during SW seizures compared with the normal slow sleep oscillations. The average coherence at the highest peak recorded during seizures was 95 ± 3% (Fig.5B), the average correlation was 94 ± 4% (Fig.5C) (n = 120 seizures in 40 pairs), and the time lag was 5 ± 3.2 msec. Notably, the correlation and coherence peaks have closer values than during the slow oscillation, indicating that the SW oscillation dominates the glial activity, leaving little space for asynchronous potentials.
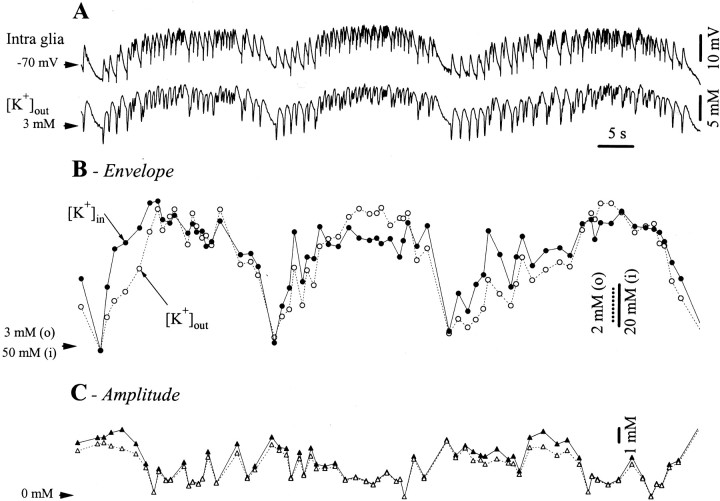
To understand how spatial buffering works during seizures and to test whether it could play a role in the propagation of paroxysmal activities, we recorded glial potentials and the [K+]out during recurrent seizures (Fig. 6). Three consecutive seizures are presented in Figure 6A. We detected the onset points for the phasic events relative to the intraglial recording and calculated the corresponding voltage and extracellular concentration values. The latter generated the [K+]out curve in Figure 6B, and both contributed to the calculation of the [K+]in. Figure6C contains the superimposed amplitudes of the phasic extracellular and intracellular K+concentrations. The main finding was that, for the first SW complexes at the onset of the seizure, the estimated [K+]in increased more rapidly than the [K+]out. This effect was consistent in the majority of seizures (94% of the 95 tested seizures) and lasted in average for the initial 37% cycles of a seizure (average calculated over 89 such seizures). The latest quantification was derived as follows: for each of the 89 seizures, we counted, at the beginning of a seizure, the number of consecutive SW cycles during which the estimated [K+]in was above the [K+]out making up that seizure and divided it by the total number of SW complexes during that seizure. As an example from Figure 6B, during the first seizure the [K+]in rose faster than the [K+]outduring the first seven cycles (of 19 cycles).
Fig. 6.
Long-range spatial buffering of K+ during SW seizures. A, Simultaneous recording of intraglial potentials and [K+]out during three recurrent seizures. B, Superimposed envelopes of the seizures inA from the extracellular (dotted linesand open circles) and intracellular K+ (continuous lines and black circles) concentrations. The envelopes were calculated as follows: the onset points for each SW complex were detected in the intraglial trace, then the corresponding voltage (for the glia) and concentration (for the [K+]out) values were extracted. Furthermore, the [K+]in envelope was derived from the Nernst equation relative to the intraglial potentials and the [K+]out envelopes. The superimposed traces (expanded at the maximum amplitude, note different calibration bars: dotted for extracellular andcontinuous for intracellular and resting concentrations) indicate a faster increase at the onset of the seizures in the [K+]in with respect to the [K+]out. C, Superimposition of the intracellular (dotted line andopen circles) and extracellular (continuous line and black circles) concentration amplitudes of the SW complexes over the envelope shown in B. Note similar amplitude values in the two signals.
The initial [K+]inincrease was not accompanied by a similar change in the amplitude of the phasic variations (Fig. 6C), indicating that there were two distinct processes: a sustained one (Fig. 6B), probably because of long-range spatial buffering of K+, and a phasic one (Fig. 6C) imposed by the phasic oscillations and generated at a local spatial scale.
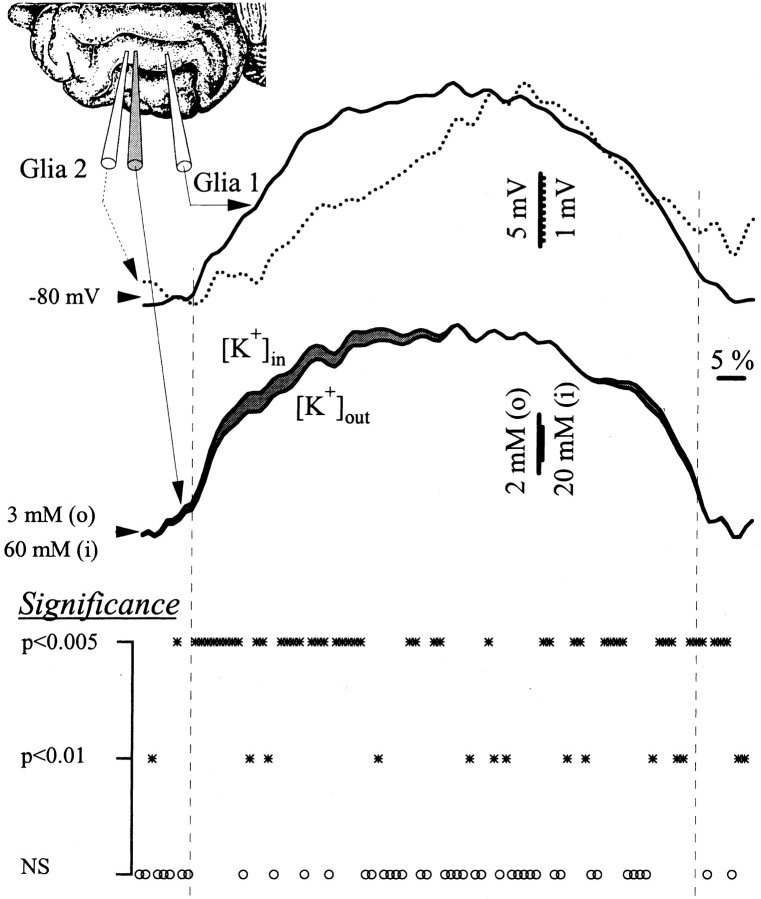
Strong evidence in favor of this hypothesis came from recordings with simultaneous glial pairs and [K+]out measured close to one of the impaled glia (Fig.7). The depolarizing envelopes of 75 seizures (in 23 glial pairs and their corresponding concentration values) were calculated (see Materials and Methods), together with the theoretical curve of the [K+]in. The 23 glial pairs were selected among those recorded at some distance (>2 mm) from each other to have a clear difference between the shape of the seizures. Thus, one cell started to depolarize faster and to a greater degree than the other (Fig. 7, continuous line vsdotted line). This is likely to be attributable to differences in distance between the two glia from the presumed focus of the seizure. Under such circumstances, the estimated [K+]in increased faster in the more distant glial cell than the K+ concentration of its extracellular environment.
Fig. 7.
Propagation of K+ waves during SW seizures. Dual intraglial recording together with the [K+]out. The disposition of the recording electrodes in the suprasylvian gyrus is shown in theinset. The traces represent the average of 20 normalized seizure envelopes. The top superimposition contains the intracellular seizures in the pair of glial cells expanded at their maximum amplitude (see different voltage calibrations:continuous line for cell 1 anddotted line for cell 2, also corresponding to the envelope traces). From the higher amplitude of the signal, it may be inferred that cell 1 is closer to a presumed seizure focus. The bottom panel displays the intracellular and extracellular K+ concentrations superimposed and expanded at their maximum amplitude. The [K+]in was calculated from the Nernst equilibrium potential in relation with the [K+]out and the intracellular trace that was recorded closely to the K+ microelectrode (2). Toward the beginning of the seizure, the estimated [K+]in raised faster than the [K+]out (gray area between the two traces).
To test whether the two concentration curves (Fig. 7, bottom panel) were statistically different, we normalized the individual concentration curves with respect to the value of the first and maximum points in that curve. Then, for each point in the average curve, two rows of data were created from the corresponding points in the individual normalized curves of the intracellular and extracellular concentrations, respectively. A paired t test was conducted for the two rows, and the level of confidence (0.005 or 0.01) or the absence of significance (NS for p > 0.01) was attributed to that particular point. It resulted that the initial third of the generic seizure was associated with statistically significant different dynamics of the concentration curves. Only four samples during this period were not significantly different.
These data suggest that the propagation of the epileptic activity in the cortex may use spatial buffering through the glial syncytium rather than the simple diffusion through the extracellular space. This alternative must also to be evaluated with respect to synaptic transmission through the neuronal network.
Modulation of the cellular activity by calcium levels
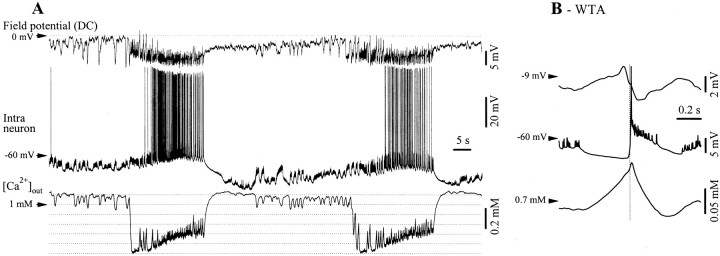
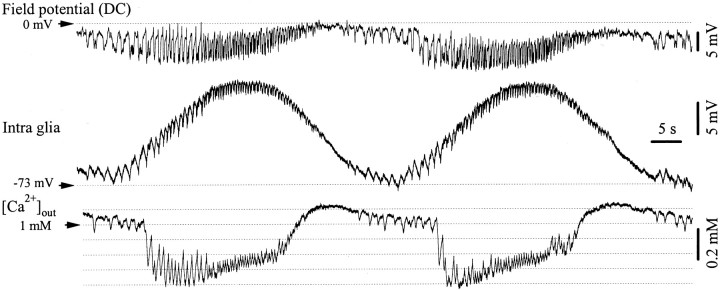
The extracellular Ca2+ concentration ([Ca2+]out) is known to efficiently modulate synaptic transmission. Measurements of the [Ca2+]outduring SW seizures (Fig. 8) disclosed two types of behavior. First, there was a steady reduction of the [Ca2+]out for the whole duration of the epileptic seizure (Fig. 8A), in accordance with previous reports (Heinemann et al., 1977, 1986;Nicholson et al., 1978; Hablitz and Heinemann, 1987). Second, we found periodic variations in [Ca2+]out, in phase with the membrane oscillations recorded intracellularly in neurons (Fig. 8B) and glia (Fig.9).
Fig. 8.
Decrease of extracellular Ca2+concentrations ([Ca2+]out) during SW seizures. A, Simultaneous intracellular recording of a neuron in the suprasylvian gyrus and of neighboring DC field potentials and [Ca2+]out. SW seizures are accompanied by a persistent drop of ∼0.6 mmof the extracellular Ca2+ concentration and by phasic oscillations of the [Ca2+]outduring the SW complexes (B). The WTAs (n = 40) were triggered by the maximum slope of the neuronal depolarization (vertical dotted line) and depict the relationship between the neuronal paroxysmal depolarization, the field potential and the Ca2+ concentration. Extracellular Ca2+ increases during the hyperpolarizing phase foregoing the onset of the ictal discharge and decreases during the subsequent neuronal depolarization.
Fig. 9.
Relationship between [Ca2+]out and glial activities during recurrent SW seizures. Intraglial, DC field potentials and Ca2+ concentrations were measured at short distance (<1 mm) in the suprasylvian gyrus. During seizures, the glial steady depolarization, and presumably the [K+]out, had a different time course from the [Ca2+]out. The latter tended to return to baseline before the end of the seizure.
The steady [Ca2+]out drop during 35 such seizures ranged between 0.3 and 0.6 mm, from a baseline of ∼1.1 mm. If the Ca2+ decrease is caused by postsynaptic uptake, this finding questions the ability of neurons to synchronize large cellular populations and propagate the paroxysmal activity at distance. The phasic variations associated with individual SW complexes had an amplitude of 0.13 ± 0.03 mm (average of 35 WTAs from an equal number of seizures) and were proportional to the depolarizing amplitude of the corresponding neuronal event (correlation coefficient 88 ± 6.2%). If the observed phenomenon was attributable to postsynaptic Ca2+ uptake, it is possible that it modulates the synaptic efficacy and promotes the cyclic pattern, very similar to the way it generates the slow sleep oscillation (Massimini and Amzica, 2001). The progressive drop of Ca2+ observed immediately after the onset of the neuronal depolarization (“spike” component of the SW complex) (Fig. 8B) would promote a gradual disfacilitation that would eventually lead to a silenced network, thus to hyperpolarization of the neurons. During the following hyperpolarization (“wave” component of the SW complex), the [Ca2+]out restores the control levels, thus increasing the synaptic efficacy.
Simultaneous recordings of intraglial potentials and [Ca2+]out (Fig. 9) emphasized the different dynamics of K+and Ca2+ ions during SW seizures. The extracellular Ca2+ depletion occurred from the first SW cycle, whereas the increase of extracellular K+ (as inferred from the intraglial recording) was much slower. Usually, the end of the seizure could be predicted at the moment where the Ca2+levels started to recover, and coincided with the end of the K+ plateau. This finding was consistent in 24 of 29 seizures (83%) and was a far better predicting criteria for seizure arrest than the EEG (Fig. 9).
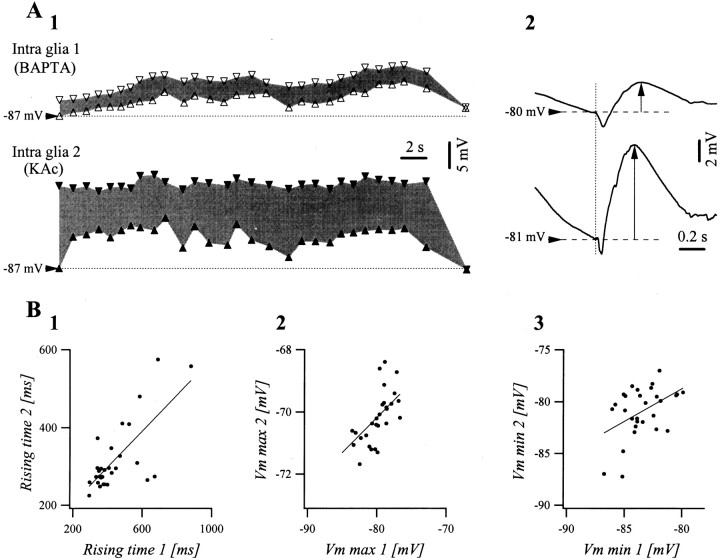
The extracellular depletion of Ca2+occurs, besides at presynaptic and postsynaptic neuronal membrane, by glial uptake. Because [Ca2+]in may modulate the gap junction conductances (Spray and Scemes, 1998), it would have a direct influence on the propagation of seizures. This hypothesis was tested in intraglial recordings with microelectrodes containing the Ca2+ chelator BAPTA (0.1m). The amplitude of the persistent depolarization (Fig.10A1) and of the phasic depolarizations (Fig. 10A2) were diminished by 47 and 55%, respectively (n = 22 seizures). These results could be explained by the fact that the intracellular BAPTA reduced the cytoplasmatic Ca2+, which in turn would open gap junctions (Enkvist and McCarthy, 1994) and would therefore assist the dissipation of intracellular depolarization to adjacent glial cells. Alternatively, it would be likely that the Ca2+-dependent glutamate release from glial cells onto the neighboring neurons (Araque et al., 2000), would have been reduced by BAPTA, thus diminishing their K+-mediated feedback on glial cells.
Fig. 10.
Effect of BAPTA (0.1 mm) on the intraglial steady depolarization associated with SW seizures.A1, Envelopes of a SW seizure in a dual intraglial recording at short distance (∼1 mm). The cell 1 was recorded with a pipette containing 0.1 mm BAPTA, and cell2 was recorded with 3 m potassium acetate. The bottom traces (upward triangles) represent the voltages at the onset of the phasic depolarizations, whereas the top traces (downward triangles) correspond to the maximum voltage reached during each SW complex. Thus, the gray surface designates the phasic depolarizations during individual complexes. A2, WTAs of the SW complexes in the two glial cells recorded simultaneously. Both envelopes and phasic events have diminished amplitudes in the recordings with BAPTA. B1, Rising time of individual SW complexes of cell 2 plotted against the same parameter in cell 1 (dots) and the linear fitting (correlation coefficient r = 0.72).B2, Superior envelope in cell 2 against superior envelope in cell 1 (dots) and linear fitting (r = 0.62). B3, Inferior envelope in cell 2 against inferior envelope in cell 1 (dots) and linear fitting (r = 0.45).
In spite of this, the various parameters resulting from the phasic potentials in BAPTA-recorded glia remained proportional to those recorded simultaneously with control pipettes in glial cells (Fig.10B). In more detail, the rising times of the depolarizing phase were correlated at 72% (Fig.10B1), the maximum potentials attained during each cycle were correlated at 62% (Fig. 10B2), and the potentials in the troughs were correlated only at 45% (Fig.10B3). These results further support the idea that part of the seizure activity is transported through the glial syncytium, although an important component travels through the extraglial space.
DISCUSSION
We have provided evidence for a differential implication of glial cells in the spatial buffering of extracellular K+ during normal (slow sleep oscillations) and pathological (SW seizures) states. The latter have a predominant incidence during sleep (Sato et al., 1973), where they develop from the slow oscillation (Steriade and Amzica, 1994; Steriade and Contreras, 1995; Steriade et al., 1998).
Short-range spatial buffering during the slow sleep oscillation
Although originally described in anesthetized preparations (Steriade et al., 1993b), the presence of a slow (<1 Hz) oscillation has been repeatedly confirmed during natural sleep both in humans (Achermann and Borbely, 1997; Amzica and Steriade, 1997; Simon et al., 2000) and animals (Steriade et al., 1996, 2001), indicating that ketamine–xylazine anesthesia is a valid model for the intracellular study of this oscillation. The importance of understanding the complete mechanisms underlying the generation of the slow oscillation cannot be overestimated as this phenomenon plays a central role in organizing other sleep rhythms such as spindles (Contreras and Steriade, 1995) or thalamic delta (Steriade et al., 1993c), which in turn may assist memory processes (Gais et al., 2000; Stickgold et al., 2000). The study of the slow oscillation also addresses the elementary question of the genesis of oscillatory processes in brain networks.
We believe that pure neuronal networks, in spite of their complexity, cannot account alone for such complex activities as sleep oscillations. There has been no evidence to explain how neurons alone could spontaneously and synchronously shut down their depolarizing phase. The activation of Ca2+-dependent K+ currents toward the end of the depolarizing phase (Steriade et al., 1993a) may explain this phenomenon, however it cannot account for the timing of the [K+]out (Amzica and Massimini, in preparation). Furthermore, it has been noted that the amount of tonic firing in neurons during activated states is similar during the depolarizing phase of the slow oscillation (Steriade et al., 1993a, their Fig. 11). If the neuronal firing alone were responsible for the increased [K+]out, one would expect the glial potentials to depolarize during activated states. Our data suggest otherwise (Fig. 1).
Thus, the pace of the slow oscillation may rely on two nonexclusive mechanisms: (1) a modulation of synaptic efficacy by [Ca2+]out has been recently proposed after discovery of a slow oscillatory pattern of [Ca2+]out, in phase with the neuronal activity (Massimini and Amzica, 2001). This would account for the progressive disfacilitation noted during each depolarizing phase of the slow oscillation (Contreras et al., 1996).
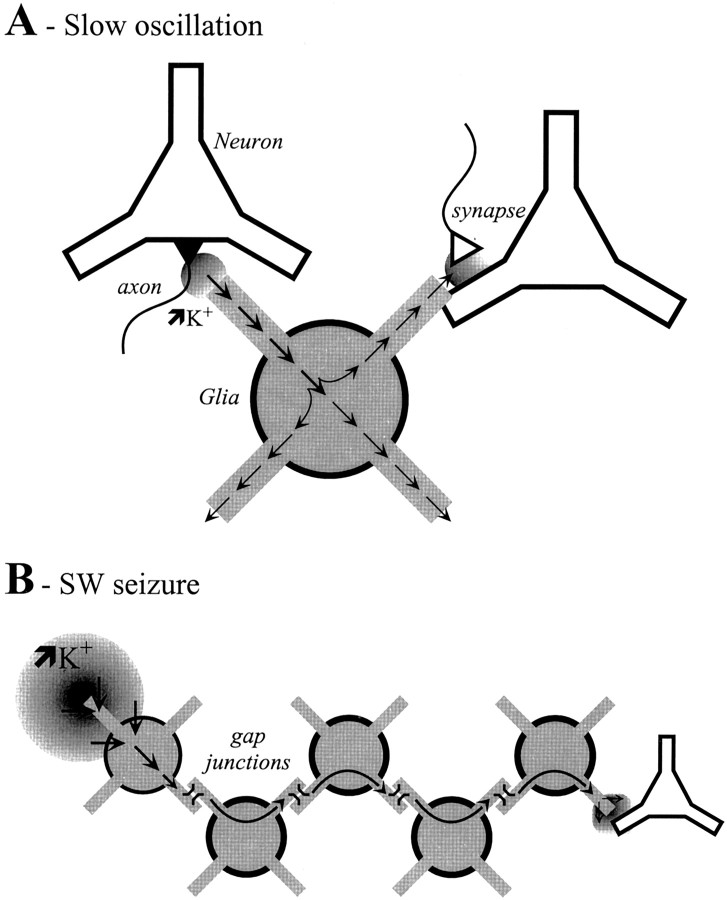
(2) Spatial buffering has been proposed as a possible mechanism regulating the extracellular concentration of K+ (Orkand et al., 1966). During this process, high concentrations of K+ ions, for example close to the axon hillock of a discharging neuron, would be taken up by proximal glial cells and, because of the concentration gradient, would diffuse toward regions with lower [K+]out (Fig.11A). The space constants for spatial buffering are unknown, although several values, ranging from one single astrocyte (Barres et al., 1990) to a glial syncytium (Gardner-Medwin, 1983), have been calculated. The conclusion was reached that the glial syncytium is five times more likely to support the K+ transport than the extracellular diffusion (Gardner-Medwin, 1983; Gardner-Medwin and Nicholson, 1983).
Fig. 11.
Schematic functioning of the spatial buffering during the slow oscillation (A) and SW seizures (B). A, During the depolarizing phase of the slow oscillation, small and local increases of extracellular K+ (circle) may occur in the proximity of the axon hillock. The neighboring glial cells take it up and redistribute it at sites where the [K+]out has normal values. These locations may be close to a synapse, in which case the synaptic efficiency may be modulated, or close to a neuronal membrane so as to modify the excitability of that membrane. B, Important increases in the [K+]out may not be buffered at short distances, in which case the taken up K+ may travel through the glial syncytium and is externalized at a location with lower [K+]out values, where it would modulate the activity of nearby neurons.
Our data show that, during the slow oscillation, there is little accumulation of K+ in the extracellular space (<1.1 mm/cycle) and that this causes a minimal imbalance between the extracellular and intracellular K+ concentrations (Fig. 3). Given that normally glial cells deal with low amounts of K+ but have a high propensity to take up K+, it is likely that spatial buffering would occur at a reduced spatial scale (Fig. 11A), such that K+ would be redistributed in the close neighborhood, including the same neuron. In this way, K+ would be released by glia at locations that it would not have attained in the absence of the process. Thus, the periodic depolarizations of a neuron during the slow oscillation may cause variations of [K+]out that could modulate other membrane areas. For instance, the slow oscillating extracellular K+ may periodically modulate the Ca2+-dependent release of neurotransmitter at the presynaptic level (Llinás and Yarom, 1981; Kocsis et al., 1983; Carbone and Lux, 1984; Balestrino et al., 1986; Rausche et al., 1990), therefore contributing to the pacing of the slow oscillation. Close to a synaptic cleft, K+ accumulated during the depolarizing phase would diminish a GABAB synaptic current shunting such an inhibitory synapse. This could explain why, although inhibitory neurons discharge only during the depolarizing phase of the slow oscillation (Contreras and Steriade, 1995), they do not produce overt IPSPs. Finally, at other locations the initial K+ increase could progressively enhance the excitability of the neuronal membrane by modifying the Nernst equilibrium potential.
Long-range spatial buffering during SW seizures
Compared with the slow sleep oscillation, SW seizures appear as hypersynchronous phenomena. Some consider the fact that time lags between pairs of neurons progressively diminish with the progression of the seizure (Steriade and Amzica, 1994; Neckelmann et al., 1998) as evidence for increased synaptic coupling. However, numerous studies have demonstrated that the [Ca2+]outdecreases during SW seizures (Heinemann et al., 1977, 1986; Somjen, 1980; Pumain et al., 1983; Hablitz and Heinemann, 1987; see also present data). Knowing that synaptic efficacy critically depends on extracellular Ca2+ levels (King et al., 2001) and assuming that the observed depletion is caused by postsynaptic Ca2+ entry, these data challenge the classical view of the cortical synchronization during SW seizures. Although Ca2+ uptake may occur at the presynaptic level (Alici and Heinemann, 1995; Igelmund et al., 1996), several lines of evidence suggest the preponderance of postsynaptic uptake (Heinemann and Pumain 1981; Bollmann et al., 1998;Borst and Sakmann 1999; Rusakov et al., 1999; King et al., 2000). This phenomenon alone could produce a steady decoupling of the neuronal networks during seizures. Therefore, another parallel mechanism has to support the increased synchrony of neurons (Steriade and Amzica, 1994;Neckelmann et al., 1998) and glia (present data) during epileptic discharges.
We propose that a long-range spatial buffering through the glial syncytium may contribute to the spreading of the seizures and to the synchronization of large cortical territories. From the present experiments, two ions could be involved in this process. First, glial cells take up Ca2+ through voltage-dependent channels (MacVicar, 1984), further contributing to the extracellular depletion of this ion. The following increase of the [Ca2+]in, together with the increase resulting from the glutamate-mediated neuronal activity (Cornell-Bell et al., 1990), may cause the release of glutamate from glia (Parpura et al.,. 1994; Pasti et al., 1997; Bezzi et al., 1998) and excitation of the neighboring neurons. The latter sequence is based on the exocytotic release of glutamate stored in intraglial vesicles (Araque et al., 2000). This effect may be enhanced by the increased excitability of neurons resulting from the extracellular Ca2+ depletion (see Hille, 1992).
Second, in agreement with earlier suggestions (Futamachi and Pedley, 1976), a local K+ increase that occurs during an epileptic seizure and creates a persistent intraglial depolarization (Figs. 4-7) travels along the glial syncytium (Fig. 11B). Our in vivo approach cannot precisely establish the distance of such a propagation, but it is known that the epileptic tissue benefits from an enhanced gap junction communication (Lee et al., 1995; Amzica and Neckelmann, 1999;Bordey et al., 2001). The spontaneous SW seizures recorded in our study are very similar to the ones seen in the Lennox-Gastaut syndrome (Niedermeyer, 1988; Halasz, 1991) and, because of the time lags measured between various recording sites, belong to the secondary generalized type. Thus, a primary focus would create subsequent foci along the propagation path at distances equal to the spatial length constant of the syncytium. The fact that the estimated [K+]in increases at some locations faster than the [K+]out (Figs. 6,7) supports this hypothesis.
Do glial cells play an active role in brain oscillations?
The phasic and periodic variations of the glialVm reflect the neuronal and ionic activities occurring in their neighborhood, but also transmitted through the glial syncytium. Neuronal release of neurotransmitters may be detected by the glial receptors, of which the glutamatergic ones (Steinhäuser and Gallo, 1996; Sontheimer et al., 1988) are of particular interest for this study. This direct action modulates intracellular ionic concentrations (especially that of Ca2+). In addition, neuronal activity varies the extracellular ionic concentrations, which also interact with glial membranes (especially K+). The spatial buffering, at short or long distances, as a function of state, contributes to the spreading of the abovementioned variations over a large territory and to the modulation of the target neuronal environment. This glial function appears to be an integrative activity, in opposition to the limited role that has been traditionally assigned to glial cells. For reasons that still need to be investigated, this integrative role of glia appears to be related to sleep and paroxysmal oscillations (states during which the brain is disconnected from the external environment), and ceases during active states normally associated with sensory processing.
Footnotes
This work was supported by the Medical Research Council of Canada (Grant MT-15681). F.A. is a Scholar of Fonds de la Recherche en Santé de Québec and M.M. is a doctoral student. We thank P. Giguère and D. Drolet for technical assistance.
Correspondence should be addressed to Florin Amzica at the above address. E-mail: florin.amzica@phs.ulaval.ca.
REFERENCES
- 1.Achermann P, Borbély AA. Low-frequency (<1 Hz) oscillations in the human sleep EEG. Neuroscience. 1997;81:213–222. doi: 10.1016/s0306-4522(97)00186-3. [DOI] [PubMed] [Google Scholar]
- 2.Alici K, Heinemann U. Effects of low glucose levels on changes in [Ca2+]o induced by stimulation of Schaffer collaterals under conditions of blocked chemical synaptic transmission in rat hippocampal slices. Neurosci Lett. 1995;185:5–8. doi: 10.1016/0304-3940(94)11211-z. [DOI] [PubMed] [Google Scholar]
- 3.Ammann D. Ion selective microelectrodes. Springer; Berlin: 1986. [Google Scholar]
- 4.Amzica F, Neckelmann D. Membrane capacitance of cortical neurons and glia during sleep oscillations and spike-wave seizures. J Neurophysiol. 1999;82:2731–2746. doi: 10.1152/jn.1999.82.5.2731. [DOI] [PubMed] [Google Scholar]
- 5.Amzica F, Steriade M. The K-complex: its slow (<1 Hz) rhythmicity and relation to delta waves. Neurology. 1997;49:952–959. doi: 10.1212/wnl.49.4.952. [DOI] [PubMed] [Google Scholar]
- 6.Amzica F, Steriade M. Cellular substrates and laminar profile of sleep K-complex. Neuroscience. 1998;82:671–686. doi: 10.1016/s0306-4522(97)00319-9. [DOI] [PubMed] [Google Scholar]
- 7.Amzica F, Steriade M. Neuronal and glial membrane potentials during sleep and paroxysmal oscillations in the neocortex. J Neurosci. 2000;20:6648–6665. doi: 10.1523/JNEUROSCI.20-17-06648.2000. [DOI] [PMC free article] [PubMed] [Google Scholar]
- 8.Araque A, Parpura V, Sanzgiri RP, Haydon PG. Tripartite synapses: glia, the unacknowledged partner. Trends Neurosci. 1999;22:208–215. doi: 10.1016/s0166-2236(98)01349-6. [DOI] [PubMed] [Google Scholar]
- 9.Araque A, Li N, Doyle RT, Haydon PG. SNARE protein-dependent glutamate release from astrocytes. J Neurosci. 2000;20:666–673. doi: 10.1523/JNEUROSCI.20-02-00666.2000. [DOI] [PMC free article] [PubMed] [Google Scholar]
- 10.Balestrino M, Aitken PG, Somjen GG. The effects of moderate changes of extracellular K+ and Ca2+ on synaptic and neural function in the CA1 region of the hippocampal slice. Brain Res. 1986;377:229–239. doi: 10.1016/0006-8993(86)90863-2. [DOI] [PubMed] [Google Scholar]
- 11.Barres BA, Chun LL, Corey DP. Ion channels in vertebrate glia. Annu Rev Neurosci. 1990;13:441–474. doi: 10.1146/annurev.ne.13.030190.002301. [DOI] [PubMed] [Google Scholar]
- 12.Bendat JS, Piersol AG. Random data. Wiley; New York: 2000. [Google Scholar]
- 13.Bezzi P, Carmignoto G, Pasti L, Vesce S, Rossi D, Rizzini BL, Pozzan T, Volterra A. Prostaglandins stimulate calcium-dependent glutamate release in astrocytes. Nature. 1998;391:281–285. doi: 10.1038/34651. [DOI] [PubMed] [Google Scholar]
- 14.Bollmann JH, Helmchen F, Borst JG, Sakmann B. Postsynaptic Ca2+ influx mediated by three different pathways during synaptic transmission at a calyx-type synapse. J Neurosci. 1998;15:10409–10419. doi: 10.1523/JNEUROSCI.18-24-10409.1998. [DOI] [PMC free article] [PubMed] [Google Scholar]
- 15.Bordey A, Lyons SA, Hablitz JJ, Sontheimer H. Electrophysiological characteristics of reactive astrocytes in experimental cortical dysplasia. J Neurophysiol. 2001;85:1719–1731. doi: 10.1152/jn.2001.85.4.1719. [DOI] [PubMed] [Google Scholar]
- 16.Bormann J, Kettenmann H. Patch clamp study of GABA receptor Cl− channels in cultured astrocytes. Proc Natl Acad Sci USA. 1988;85:8336–8340. doi: 10.1073/pnas.85.23.9336. [DOI] [PMC free article] [PubMed] [Google Scholar]
- 17.Borst JG, Sakmann B. Depletion of calcium in the synaptic cleft of a calyx-type synapse in the rat brainstem. J Physiol (Lond) 1999;521:123–133. doi: 10.1111/j.1469-7793.1999.00123.x. [DOI] [PMC free article] [PubMed] [Google Scholar]
- 18.Carbone E, Lux HD. A low voltage-activated calcium conductance in embryonic chick sensory neurons. Biophys J. 1984;46:413–418. doi: 10.1016/S0006-3495(84)84037-0. [DOI] [PMC free article] [PubMed] [Google Scholar]
- 19.Contreras D, Steriade M. Cellular basis of EEG slow rhythms: a study of dynamic corticothalamic relationships. J Neurosci. 1995;15:604–622. doi: 10.1523/JNEUROSCI.15-01-00604.1995. [DOI] [PMC free article] [PubMed] [Google Scholar]
- 20.Contreras D, Timofeev I, Steriade M. Mechanisms of long-lasting hyperpolarizations underlying slow sleep oscillations in cat corticothalamic networks. J Physiol (Lond) 1996;494:251–264. doi: 10.1113/jphysiol.1996.sp021488. [DOI] [PMC free article] [PubMed] [Google Scholar]
- 21.Cornell-Bell AH, Finkbeiner SM, Cooper MS, Smith SJ. Glutamate induces calcium waves in cultured astrocytes: long-range glial signaling. Science. 1990;247:470–473. doi: 10.1126/science.1967852. [DOI] [PubMed] [Google Scholar]
- 22.de Curtis M, Manfridi A, Biella G. Activity-dependent pH shifts and periodic recurrence of spontaneous interictal spikes in a model of focal epileptogenesis. J Neurosci. 1998;18:7543–7551. doi: 10.1523/JNEUROSCI.18-18-07543.1998. [DOI] [PMC free article] [PubMed] [Google Scholar]
- 23.Dichter MA, Herman CJ, Selzer M. Silent cells during interictal discharges and seizures in hippocampal penicillin foci. Evidence for the role of extracellular K+ in the transition from the interictal state to seizures. Brain Res. 1972;48:173–183. doi: 10.1016/0006-8993(72)90177-1. [DOI] [PubMed] [Google Scholar]
- 24.Enkvist MO, McCarthy KD. Astroglial gap junction communication is increased by treatment with either glutamate or high K+ concentration. J Neurochem. 1994;62:489–495. doi: 10.1046/j.1471-4159.1994.62020489.x. [DOI] [PubMed] [Google Scholar]
- 25.Fertziger AP, Ranck JB., Jr Potassium accumulation in interstitial space during epileptiform seizures. Exp Neurol. 1970;26:571–585. doi: 10.1016/0014-4886(70)90150-0. [DOI] [PubMed] [Google Scholar]
- 26.Futamachi KJ, Pedley TA. Glial cells and extracellular potassium: their relationship in mammalian cortex. Brain Res. 1976;109:311–322. doi: 10.1016/0006-8993(76)90532-1. [DOI] [PubMed] [Google Scholar]
- 27.Futamachi KJ, Mutani R, Prince DA. Potassium activity in rabbit cortex. Brain Res. 1974;75:5–25. doi: 10.1016/0006-8993(74)90767-7. [DOI] [PubMed] [Google Scholar]
- 28.Gais S, Plihal W, Wagner U, Born J. Early sleep triggers memory for early visual discrimination skills. Nat Neurosci. 2000;3:1335–1339. doi: 10.1038/81881. [DOI] [PubMed] [Google Scholar]
- 29.Gardner-Medwin AR. A study of the mechanisms by which potassium moves through brain tissue in the rat. J Physiol (Lond) 1983;335:353–374. doi: 10.1113/jphysiol.1983.sp014539. [DOI] [PMC free article] [PubMed] [Google Scholar]
- 30.Gardner-Medwin AR, Nicholson CC. Changes of extracellular potassium activity induced by electric current through brain tissue in the rat. J Physiol (Lond) 1983;335:375–392. doi: 10.1113/jphysiol.1983.sp014540. [DOI] [PMC free article] [PubMed] [Google Scholar]
- 31.Grossman RG, Hampton T. Depolarization of cortical glial cells during electrical activity. Brain Res. 1968;11:316–324. doi: 10.1016/0006-8993(68)90027-9. [DOI] [PubMed] [Google Scholar]
- 32.Hablitz JJ, Heinemann U. Extracellular K+ and Ca2+ changes during epileptiform discharges in the immature rat neocortex. Brain Res. 1987;433:299–303. doi: 10.1016/0165-3806(87)90036-8. [DOI] [PubMed] [Google Scholar]
- 33.Halasz P. Runs of rapid spikes in sleep: a characteristic EEG expression of generalized malignant epileptic encephalopathies. A conceptual review with new pharmacological data. Epilepsy Res Suppl. 1991;2:49–71. [PubMed] [Google Scholar]
- 34.Heinemann U, Pumain R. Effects of tetrodotoxin on changes in extracellular free calcium induced by repetitive electrical stimulation and iontophoretic application of excitatory amino acids in the sensorimotor cortex of cats. Neurosci Lett. 1981;21:87–91. doi: 10.1016/0304-3940(81)90063-x. [DOI] [PubMed] [Google Scholar]
- 35.Heinemann U, Lux HD, Gutnick MJ. Extracellular free calcium and potassium during paroxysmal activity in the cerebral cortex of the cat. Exp Brain Res. 1977;27:237–243. doi: 10.1007/BF00235500. [DOI] [PubMed] [Google Scholar]
- 36.Heinemann U, Konnerth A, Pumain R, Wadman WJ. Extracellular calcium and potassium concentration changes in chronic epileptic brain tissue. Adv Neurol. 1986;44:641–661. [PubMed] [Google Scholar]
- 37.Hille B. Ionic channels of excitable membranes. Sinauer; Sunderland, MA: 1992. [Google Scholar]
- 38.Igelmund P, Zhao YQ, Heinemann U. Effects of T-type, L-type, N-type, P-type, and Q-type calcium channel blockers on stimulus-induced pre- and postsynaptic calcium fluxes in rat hippocampal slices. Exp Brain Res. 1996;109:22–32. doi: 10.1007/BF00228623. [DOI] [PubMed] [Google Scholar]
- 39.Janigro D, Gasparini S, D'Ambrosio R, McKhann G, DiFrancesco D., II Reduction of K+ uptake in glia prevents long-term depression maintenance and causes epileptiform activity. J Neurosci. 1997;17:2813–2824. doi: 10.1523/JNEUROSCI.17-08-02813.1997. [DOI] [PMC free article] [PubMed] [Google Scholar]
- 40.King RD, Wiest MC, Montague PR, Eagleman DM. Do extracellular Ca2+ signals carry information through neural tissue? Trends Neurosci. 2000;23:12–13. doi: 10.1016/s0166-2236(99)01516-7. [DOI] [PubMed] [Google Scholar]
- 41.King RD, Wiest MC, Montague PR. Extracellular calcium depletion as a mechanism of short-term synaptic depression. J Neurophysiol. 2001;85:1952–1959. doi: 10.1152/jn.2001.85.5.1952. [DOI] [PubMed] [Google Scholar]
- 42.Kocsis JD, Malenka RC, Waxman SG. Effects of extracellular potassium concentration on the excitability of the parallel fibres of the rat cerebellum. J Physiol (Lond) 1983;334:225–244. doi: 10.1113/jphysiol.1983.sp014491. [DOI] [PMC free article] [PubMed] [Google Scholar]
- 43.Lee SH, Magge S, Spencer DD, Sontheimer H, Cornell-Bell AH. Human epileptic astrocytes exhibit increased gap junction coupling. Glia. 1995;15:195–202. doi: 10.1002/glia.440150212. [DOI] [PubMed] [Google Scholar]
- 44.Levi G, Gallo V. Release of neuroactive amino acids from glia. In: Kettenmann H, Ransom BR, editors. Neuroglia. Oxford UP; New York: 1995. pp. 815–826. [Google Scholar]
- 45.Levi G, Patrizio M. Astrocyte heterogeneity: endogenous amino acids levels and release evoked by non-N-methyl-d-aspartate receptor agonists and by potassium-induced swelling in type-1 and type-2 astrocytes. J Neurochem. 1992;58:1943–1952. doi: 10.1111/j.1471-4159.1992.tb10073.x. [DOI] [PubMed] [Google Scholar]
- 46.Llinás R, Yarom Y. Electrophysiology of mammalian inferior olivary neurones in vitro. Different types of voltage-dependent ionic conductances. J Physiol (Lond) 1981;315:549–567. doi: 10.1113/jphysiol.1981.sp013763. [DOI] [PMC free article] [PubMed] [Google Scholar]
- 47.MacVicar BA. Voltage-dependent calcium channels in glial cells. Science. 1984;226:1345–1347. doi: 10.1126/science.6095454. [DOI] [PubMed] [Google Scholar]
- 48.MacVicar BA, Tse FW, Crichton SA, Kettenmann H. GABA-activated Cl− channels in astrocytes of hippocampal slices. J Neurosci. 1989;9:3577–3583. doi: 10.1523/JNEUROSCI.09-10-03577.1989. [DOI] [PMC free article] [PubMed] [Google Scholar]
- 49.Martin DL, Madelian V, Seligmann B, Shain W. The role of osmotic pressure and membrane potential in K+-taurine release from cultured astrocytes and LRM55 cells. J Neurosci. 1990;10:571–577. doi: 10.1523/JNEUROSCI.10-02-00571.1990. [DOI] [PMC free article] [PubMed] [Google Scholar]
- 50.Massimini M, Amzica F. Extracellular calcium fluctuations and intracellular potentials in the cortex during the slow sleep oscillation. J Neurophysiol. 2001;85:1346–1350. doi: 10.1152/jn.2001.85.3.1346. [DOI] [PubMed] [Google Scholar]
- 51.McKhann GM, D'Ambrosio R, Janigro D. Heterogeneity of astrocyte resting membrane potentials and intracellular coupling revealed by whole-cell and gramicidin-perforated patch recordings from cultured neocortical and hippocampal slice astrocytes. J Neurosci. 1997;17:6850–6863. doi: 10.1523/JNEUROSCI.17-18-06850.1997. [DOI] [PMC free article] [PubMed] [Google Scholar]
- 52.Moody WJ, Jr, Futamachi KJ, Prince DA. Extracellular potassium activity during epileptogenesis. Exp Neurol. 1974;42:248–263. doi: 10.1016/0014-4886(74)90023-5. [DOI] [PubMed] [Google Scholar]
- 53.Neckelmann D, Amzica F, Steriade M. Spike-wave complexes and fast components of cortically generated seizures. III. Synchronizing mechanisms. J Neurophysiol. 1998;80:1480–1494. doi: 10.1152/jn.1998.80.3.1480. [DOI] [PubMed] [Google Scholar]
- 54.Newman EA. Glial cell regulation of extracellular potassium. In: Kettenmann H, Ransom BR, editors. Neuroglia. Oxford UP; New York: 1995. pp. 717–731. [Google Scholar]
- 55.Nicholson C, Ten Bruggencate G, Stöckle H, Steinberg R. Calcium and potassium changes in extracellular microenvironment of cat cerebellar cortex. J Neurophysiol. 1978;41:1026–1039. doi: 10.1152/jn.1978.41.4.1026. [DOI] [PubMed] [Google Scholar]
- 56.Niedermeyer E. The electroencephalogram in the differential diagnosis of the Lennox-Gastaut syndrome. In: Niedermeyer E, Degen R, editors. The Lennox-Gastaut Syndrome. Liss; New York: 1988. pp. 177–220. [Google Scholar]
- 57.Orkand RK, Nicholls JG, Kuffler SW. Effect of nerve impulses on the membrane potential of glial cells in the central nervous system of amphibia. J Neurophysiol. 1966;29:788–806. doi: 10.1152/jn.1966.29.4.788. [DOI] [PubMed] [Google Scholar]
- 58.Parpura V, Basarsky TA, Liu F, Jeftinija K, Jeftinija S, Haydon PG. Glutamate-mediated astrocyte-neuron signalling. Nature. 1994;369:744–747. doi: 10.1038/369744a0. [DOI] [PubMed] [Google Scholar]
- 59.Pasti L, Volterra A, Pozzan T, Carmignoto C. Intracellular calcium oscillations in astrocytes: a highly plastic, bidirectional form of communication between neurons and astrocytes in situ. J Neurosci. 1997;17:7817–7830. doi: 10.1523/JNEUROSCI.17-20-07817.1997. [DOI] [PMC free article] [PubMed] [Google Scholar]
- 60.Pumain R, Kurcewicz I, Louvel J. Fast extracellular calcium transients: involvement in epileptic processes. Science. 1983;222:177–179. doi: 10.1126/science.6623068. [DOI] [PubMed] [Google Scholar]
- 61.Rausche G, Igelmund P, Heinemann U. Effects of changes in extracellular potassium, magnesium and calcium concentration on synaptic transmission in area CA1 and the dentate gyrus of rat hippocampal slices. Pflügers Arch. 1990;415:588–593. doi: 10.1007/BF02583510. [DOI] [PubMed] [Google Scholar]
- 62.Rosier A, Arckens L, Orban GA, Vandesande F. Immunocytochemical detection of astrocyte GABAA receptors in cat visual cortex. J Histochem Cytochem. 1993;41:685–692. doi: 10.1177/41.5.8385682. [DOI] [PubMed] [Google Scholar]
- 63.Rusakov DA, Kullmann DM, Stewart MG. Hippocampal synapses: do they talk to their neighbours? Trends Neurosci. 1999;22:382–388. doi: 10.1016/s0166-2236(99)01425-3. [DOI] [PubMed] [Google Scholar]
- 64.Sato S, Dreifuss FE, Penry JK. The effect of sleep on spike-wave discharges in absence seizures. Neurology. 1973;23:1335–1345. doi: 10.1212/wnl.23.12.1335. [DOI] [PubMed] [Google Scholar]
- 65.Simon NR, Manshanden I, Lopes da Silva FH. A MEG study of sleep. Brain Res. 2000;860:64–76. doi: 10.1016/s0006-8993(00)01974-0. [DOI] [PubMed] [Google Scholar]
- 66.Somjen GG. Stimulus-evoked and seizure-related responses of extracellular calcium activity in spinal cord compared to those in cerebral cortex. J Neurophysiol. 1980;44:617–632. doi: 10.1152/jn.1980.44.4.617. [DOI] [PubMed] [Google Scholar]
- 67.Sontheimer H, Kettenmann H, Backus KH, Schachner M. Glutamate opens Na+/K+ channels in cultured astrocytes. Glia. 1988;1:328–336. doi: 10.1002/glia.440010505. [DOI] [PubMed] [Google Scholar]
- 68.Spray DC, Scemes E. Effects of pH (and Ca) on gap junction channels. In: Kaila K, Ransom BR, editors. pH and brain function. Wiley; New York: 1998. pp. 477–489. [Google Scholar]
- 69.Steinhäuser C, Gallo V. News on glutamate receptors in glial cells. Trends Neurosci. 1996;19:339–345. doi: 10.1016/0166-2236(96)10043-6. [DOI] [PubMed] [Google Scholar]
- 70.Steriade M, Amzica F. Dynamic coupling among neocortical neurons during evoked and spontaneous spike-wave seizure activity. J Neurophysiol. 1994;72:2051–2069. doi: 10.1152/jn.1994.72.5.2051. [DOI] [PubMed] [Google Scholar]
- 71.Steriade M, Contreras D. Relations between cortical and thalamic cellular events during transition from sleep patterns to paroxysmal activity. J Neurosci. 1995;15:23–642. doi: 10.1523/JNEUROSCI.15-01-00623.1995. [DOI] [PMC free article] [PubMed] [Google Scholar]
- 72.Steriade M, Amzica F, Nuñez A. Cholinergic and noradrenergic modulation of the slow (∼0.3 Hz) oscillation in neocortical cells. J Neurophysiol. 1993a;70:1385–1400. doi: 10.1152/jn.1993.70.4.1385. [DOI] [PubMed] [Google Scholar]
- 73.Steriade M, Nuñez A, Amzica F. A novel slow (<1 Hz) oscillation of neocortical neurons in vivo: depolarizing and hyperpolarizing components. J Neurosci. 1993b;13:3252–3265. doi: 10.1523/JNEUROSCI.13-08-03252.1993. [DOI] [PMC free article] [PubMed] [Google Scholar]
- 74.Steriade M, Nuñez A, Amzica F. Intracellular analysis of relations between the slow (<1 Hz) neocortical oscillation and other sleep rhythms of the electroencephalogram. J Neurosci. 1993c;13:3266–3283. doi: 10.1523/JNEUROSCI.13-08-03266.1993. [DOI] [PMC free article] [PubMed] [Google Scholar]
- 75.Steriade M, Amzica F, Contreras D. Synchronization of fast (30–40 Hz) spontaneous cortical rhythms during brain activation. J Neurosci. 1996;16:392–417. doi: 10.1523/JNEUROSCI.16-01-00392.1996. [DOI] [PMC free article] [PubMed] [Google Scholar]
- 76.Steriade M, Amzica F, Neckelmann D, Timofeev I. Spike-wave complexes and fast components of cortically generated seizures. II. Extra- and intracellular patterns. J Neurophysiol. 1998;80:1456–1479. doi: 10.1152/jn.1998.80.3.1456. [DOI] [PubMed] [Google Scholar]
- 77.Steriade M, Timofeev I, Grenier F. Natural waking and sleep states: a view from inside neocortical neurons. J Neurophysiol. 2001;85:1969–1985. doi: 10.1152/jn.2001.85.5.1969. [DOI] [PubMed] [Google Scholar]
- 78.Stickgold R, James L, Hobson JA. Visual discrimination learning requires sleep after training. Nat Neurosci. 2000;3:1237–1238. doi: 10.1038/81756. [DOI] [PubMed] [Google Scholar]
- 79.Sypert GW, Ward AA., Jr Unidentified neuroglia potentials during propagated seizures in neocortex. Exp Neurol. 1971;33:239–255. doi: 10.1016/0014-4886(71)90018-5. [DOI] [PubMed] [Google Scholar]
- 80.Walz W. Role of glial cells in the regulation of the brain ion microenvironment. Prog Neurobiol. 1989;33:309–333. doi: 10.1016/0301-0082(89)90005-1. [DOI] [PubMed] [Google Scholar]
- 81.Zuckermann EC, Glaser GH. Hippocampal epileptic activity induced by localized ventricular perfusion with high-potassium cerebrospinal fluid. Exp Neurol. 1968;20:87–110. doi: 10.1016/0014-4886(68)90126-x. [DOI] [PubMed] [Google Scholar]


