Abstract
We investigated the effects of the central histaminergic system on afferent sensory signals in the retinogeniculocortical pathway in the intact brain. Extracellular physiological recordings in vivo were obtained from neurons in the cat dorsal lateral geniculate nucleus (LGN) in conjunction with electrical activation of the histamine-containing cells in the tuberomammillary nucleus of the hypothalamus. Tuberomammillary activation resulted in a rapid and significant increase in the amplitude of baseline activity and visual responses in LGN neurons. Geniculate X- and Y-cells were affected similarly. LGN cells that exhibited a burst pattern of activity in the control condition switched to a tonic firing pattern during tuberomammillary activation. Effects on visual response properties were assessed using drifting sinusoidal gratings of varied spatial frequency. The resultant spatial tuning curves were elevated by tuberomammillary activation, but there was no change in tuning curve shape. Rather, the effect was proportionate to the control response, with the greatest tuberomammillary effects at spatial frequencies already optimal for the cell. Tuberomammillary activation caused a small phase lag in the visual response that was similar at all spatial frequencies, consistent with the induced shift from burst to tonic firing mode. These results indicate a significant histaminergic effect on LGN thalamocortical cells, with no clear effect on thalamic inhibitory neurons. The histaminergic system appears to strengthen central transmission of afferent information, intensifying but not transforming the retinally derived signals. Promoting sensory input may be one way in which the histaminergic system plays a role in arousal.
Keywords: histamine, lateral geniculate nucleus, tuberomammillary nucleus, visual receptive field, hypothalamus, burst and tonic modes, arousal, spatial tuning
The dorsal lateral geniculate nucleus (LGN) of the thalamus conveys information from retinal ganglion cells to cortex along the primary visual perceptual pathway, and during this process, modification of visual signals can occur. Signal modulation is enabled within the LGN through a variety of extraretinal sources that comprise the majority of the axonal projections to the LGN (Uhlrich and Cucchiaro, 1992; Van Horn et al., 2000; Sherman and Guillery, 2001). Many of the extrinsic projections modulate intrinsic membrane properties of LGN cells through metabotropic receptors to control neural response as a function of physiological or behavioral state (Singer, 1977; Sherman and Koch, 1986; McCormick, 1992; Sherman and Guillery, 2001). Much attention has been directed toward the cholinergic system, but aminergic systems also innervate LGN with pronounced physiological effects on LGN cells (McCormick, 1992).
Least well studied of the aminergic group is the histaminergic system, which arises solely from neurons in the tuberomammillary nucleus in the hypothalamus (Panula et al., 1984, 1989; Uhlrich et al., 1993). This evolutionarily well preserved system projects widely in the brain, including to LGN (Watanabe et al., 1984; Panula et al., 1989; Schwartz et al., 1991; Uhlrich et al., 1993; Manning et al., 1996). Receptor binding studies in LGN reveal a high density of postsynaptic histamine H1 and H2 receptors and presynaptic H3 receptors (Bouthenet et al., 1988; Ruat et al., 1990; Chazot et al., 2001). The histaminergic system is thought to play a primary role in enacting arousal in the brain, with tuberomammillary neurons active during the waking state and quiescent during sleep (Vanni-Mercier et al., 1984; Lin et al., 1988;Sakai et al., 1990; Monti, 1993; Brown et al., 2001). Application of histamine in vitro changes the firing pattern of LGN neurons from the burst mode of firing to the tonic mode (McCormick and Williamson, 1991; McCormick, 1992), mimicking the change in general firing activity recorded in the thalamus as the brain transitions from sleep to waking (Steriade and Deschênes, 1984; Steriade and Llinás, 1988).
The previous work suggests that the histaminergic system is capable of modulating neural responses in visual thalamus. The capacity to influence incoming sensory signals would seem ideal for histamine, given its reputed role in arousal. However, the nature of this influence is unclear, and extrapolation from in vitro data involving other neuromodulators is problematic. For example, application of serotonin in vitro has a small depolarizing effect on LGN cells (McCormick and Pape, 1990), but activation of the serotonergic dorsal raphe nucleus or application of serotonin in vivo usually produces a pronounced inhibition of LGN cells (Funke and Eysel, 1995). In addition, activation of the cholinergic system changes the receptive field tuning of LGN neurons in ways not predicted by the cholinergic in vitro results (Sillito et al., 1983;Uhlrich et al., 1995). No previous work has examined histaminergic effects on neural responses to visual stimuli. To address this, we used electrical activation of the tuberomammillary nucleus to determine the effects of histaminergic activation on visual receptive field response properties in LGN.
MATERIALS AND METHODS
Subjects in these acute recording experiments were five normal adult male and female cats obtained from a licensed supplier (Harlan Sprague Dawley, Indianapolis, IN). All procedures were approved by the University of Wisconsin-Madison Animal Care and Use Committee and met the guidelines of the National Institutes of Health detailed in the Guide for the Care and Use of Laboratory Animals.
Surgical procedure. Animals were anesthetized initially with gaseous halothane delivered via a nose cone, to effect, or injection of ketamine (11 mg/kg, i.m.) plus xylazine (1–2 mg/kg, i.m.). The animal was then cannulated, intubated, placed in a stereotaxic apparatus, and maintained deeply anesthetized, to effect, with 1–2% halothane in a 1:1 mixture of N2O and O2throughout all surgical procedures. Paralysis was initiated with 5 mg of gallamine triethiodide, and the subject was artificially respirated. End-tidal CO2 was maintained at 4 ± 0.2%, and body temperature was maintained at 38°C via a feedback-controlled heating blanket. Heart rate and cortical electroencephalogram (EEG) were recorded continuously to monitor the state and well-being of the animal.
The skull was surgically prepared for craniotomies to enable passage of stimulating and recording electrodes into the brain. EEG electrodes were fine stainless steel screws secured in the skull over frontal cortex. Wound margins and pressure points were infused with 2% lidocaine. Ophthalmic atropine sulfate and phenylephrine hydrochloride were applied to dilate the pupils and retract the nictitating membranes. The corneas were covered with contact lenses chosen by slit retinoscopy to focus the retinas on a cathode ray tube 57 cm in front of the eyes.
During physiological recording, halothane was reduced to 0.4–0.8%, and paralysis was continued with an intravenous infusion of gallamine triethiodide (5 mg · kg−1 · hr−1) and d-turbocurarine (0.35 mg · kg−1 · hr−1). EEG and heart rate measures were monitored continuously to ensure adequate levels of anesthesia.
At the end of the acute recording experiment, the animal was given an intravenous overdose of pentobarbital sodium and perfused through the heart with aldehyde fixatives. The brain was later sectioned to verify stimulation and recording sites in the hypothalamus and LGN, respectively.
Electrical stimulation. One pair of bipolar stimulating electrodes was placed across the optic chiasm at anterior 14 (A14) and lateral 1.0 (L1.0)–L1.5. Electrode depth was determined by maximizing the visually evoked potential recorded through the electrodes, and then they were cemented into place.
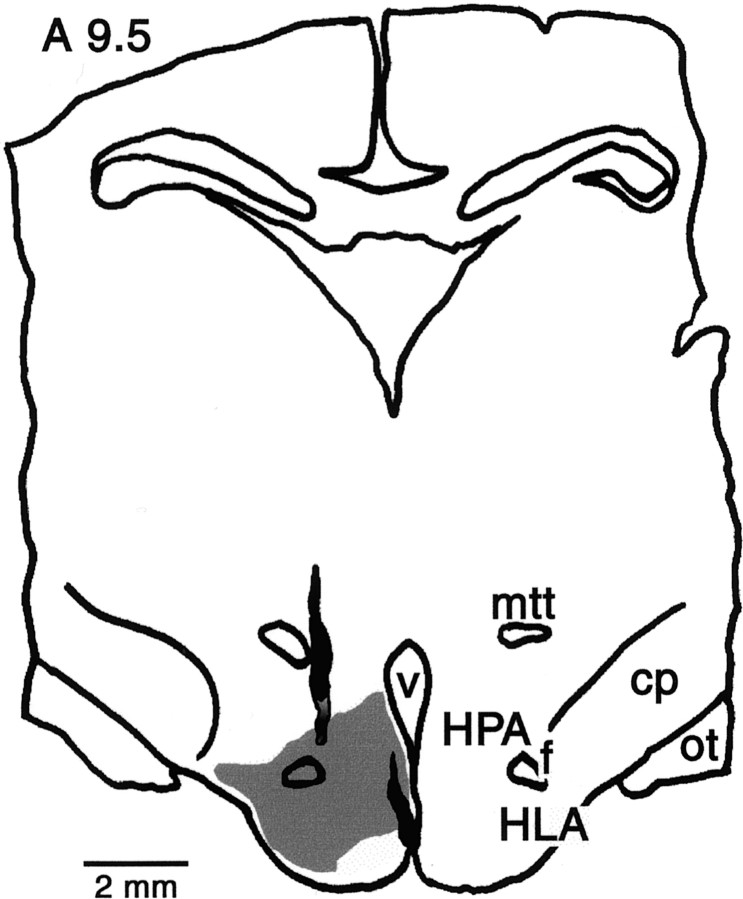
To stimulate the tuberomammillary region of the hypothalamus, a pair of electrodes was placed stereotaxically at L0.5 and height −3.0 (H−3.0) and L3.0 and H−2.25, respectively, from A9.5 to A10.0. We aimed for the region of the hypothalamus with the densest distribution of histaminergic cells as identified by Uhlrich et al. (1993). Care was taken not to place the electrodes too far laterally or rostrally where they might activate optic tract axons, and none of the effects reported here could be replicated by stimulation of optic chiasm electrodes. In all cases, electrode placement was confirmed histologically. Figure 1 illustrates the location of tuberomammillary nucleus-stimulating electrodes. We activated the tuberomammillary nucleus electrically by means of positive current pulses (50–100 μsec duration, 100–600 μA amplitude). Pulses were delivered in trains at 10–40 Hz for 500–2000 msec.
Fig. 1.
Camera lucida reconstruction of a representative stimulation site in the tuberomammillary nucleus of the hypothalamus in coronal section at anterior 9.5. Solid shading, Electrode tracks; variable shading atbottom of the lateral track, location of the track at its full depth in an adjacent section; gray area, region of histaminergic cells in the tuberomammillary nucleus.cp, Cerebral peduncle; f, fornix;HLA, lateral hypothalamic area; HPA, posterior hypothalamic area; mtt, mammilothalamic and mammillotegmental tracts; ot, optic tract;V, third ventricle.
Cell classification. Glass pipettes were filled with 3m KCl and beveled to a final impedance (at 100 Hz) of 5–15 mΩ to record cells in the A laminas of the LGN. The receptive field of each isolated cell was plotted on a tangent screen, and the cell was characterized as an X- or Y-cell using a battery of tests (Sherman, 1985). These included latency to optic chiasm stimulation, linearity of summation to a counterphase-modulated grating stimulus, receptive field center size, response to large, fast-moving disks, phasic or tonic response to standing contrast, and receptive field sign (on and off center). All cells studied exhibited brisk responses. We encountered no cells with “lagged” characteristics (cf. Mastronarde, 1987).
Visual stimulation. The visual stimuli were generated on the screen of a cathode ray tube that was driven by a computer-controlled function generator (Picasso). Gratings were the primary visual stimuli, but spots of light were also used. The contrast of the gratings was 60% as defined by (Lmax −Lmin)/(Lmax+ Lmin), whereLmax is maximum luminance, andLmin is minimum luminance. Space-averaged luminance was 40 cd/m2. Gratings were counterphase-modulated to determine response linearity and were drifted horizontally, primarily at 4 Hz, to obtain spatial tuning curves based on responses to a range of 5–10 different spatial frequencies.
All cells were also tested in the baseline condition in which the visual stimulus was an unpatterned (contrast = 0 cycles/°), unchanging homogeneous field of the same space-averaged luminance. In the full-field condition, the field was unpatterned, and luminance was varied temporally in a sinusoidal manner, typically at 4 Hz, between the high and low luminance values used in the grating stimulus,Lmax andLmin.
Experimental procedure. In initial experiments, we varied trial time parameters and quickly observed that maximal impact occurred during the period of tuberomammillary stimulation. The character of the effect did not change with longer duration stimulation, and the effect declined immediately thereafter. Thus, we adopted trial parameters that allowed us to focus on the most robust and consistent part of the tuberomammillary effect. A typical trial of recording from an LGN neuron consisted of three parts: (1) a 1 sec control period; (2) a 0.5–2.0 sec period of tuberomammillary stimulation; and (3) a 1.0–3.0 sec period after termination of tuberomammillary stimulation to observe recovery of the response. During rare occasions in which the effect continued beyond 3 sec, the period of recording was extended, but these never revealed anything more than a continued return to baseline. In all cases, there was a 5–30 sec pause between individual trials to allow the tuberomammillary effect to dissipate.
Neurons were tested with the same visual stimulus present during all three parts of a trial. The spatial and temporal aspects of the visual stimulus were varied from trial to trial. Thus, we obtained measures of spontaneous activity in the baseline condition and recorded the responses to visual stimulation in which a grating of selected spatial and temporal frequency drifted across the receptive field of a cell before, during, and after tuberomammillary stimulation during each trial.
Spike data were conveyed to the computer for storage during the intertrial pause, and a new spatial or temporal frequency for the visual stimulus was selected, depending on the experimental paradigm. Frequency was chosen in a block random style such that frequencies were chosen randomly without replacement until all frequencies in the set were used. Then the procedure was repeated. The data presented here are from cells in which each data point or histogram was the product of 4–15 trials typically containing four temporal cycles per trial in the control condition and four to six cycles per trial in the stimulation condition.
Action potentials from recorded cells were fed through a window discriminator into the computer, where histograms synchronized to the temporal visual stimulus cycle were generated and stored for both on- and off-line analysis. Data from each visual stimulus delivered at a particular spatial and temporal frequency for a given cell were pooled, and histograms were generated. These data were Fourier-analyzed to obtain measures of the overall average firing rate (F0) for each spatial frequency amplitude and phase of the modulated response at the fundamental temporal frequency (F1) and its second harmonic (F2). F1 values were plotted as a function of spatial frequency to generate the spatial tuning curve of the cell. The points on the tuning curves were then approximated by functions representing the difference of two Gaussian functions, which represent responses from the center and surround of the receptive field (Rodieck, 1965; Linsenmeier et al., 1982; Shapley and Lennie, 1985).
RESULTS
Effect of tuberomammillary activation on baseline activity: increases in responsivity
Extracellular recording data sets were collected from 33 visually responsive cells in the geniculate A laminas. We recorded baseline physiological activity from cells when the visual stimulus was an unmodulated homogeneous field of the same space-averaged luminance as the grating stimuli. Under these visual conditions, activation of the tuberomammillary nucleus of the hypothalamus resulted in an increase in firing rate in most LGN cells (86% of X-cells and 83% of Y-cells) over prestimulation control levels (Figs.2, 3; see Figs. 6-8). The increase in baseline activity, quantified as F0, the average spike firing rate, during activation of the tuberomammillary nucleus was statistically significant for both the X- and Y-cell populations (Wilcoxon signed rank test, X-cells, p = 0.0012; Y-cells, p = 0.0137). Although the increase appeared greater for X-cells than Y-cells, the difference between X- and Y-cells was not statistically significant.
Fig. 2.
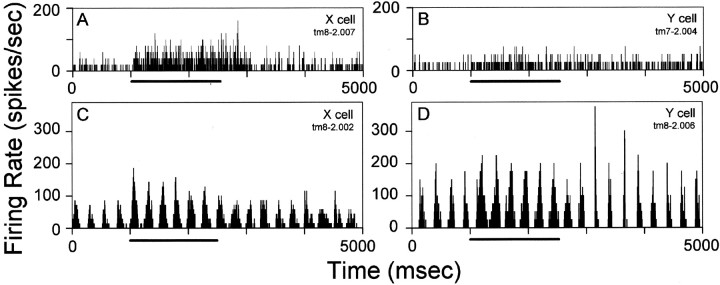
Effect of tuberomammillary nucleus activation on spontaneous activity (A, B) and visual responses (C, D) of two representative LGN X-cells (A, C) and Y-cells (B, D). The visual stimulus inC and D, used most often in these experiments, was a sinusoidal grating drifting at 4 Hz. Thebar below each histogram indicates the period of tuberomammillary (tm) stimulation.
Fig. 3.
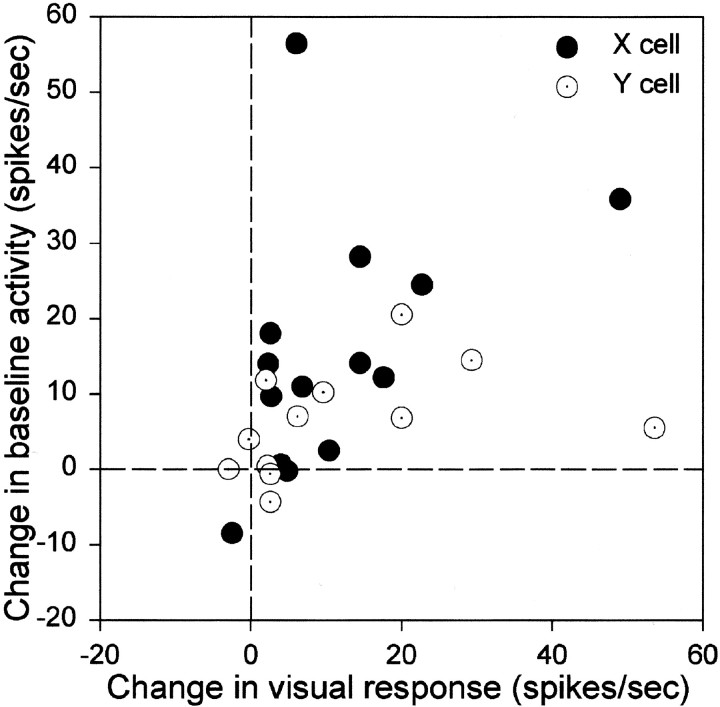
Comparison of the effect of tuberomammillary activation on the baseline response and the response to a grating stimulus in LGN X-cells (filled circles) and Y-cells (open circles). Each axisrepresents the change in the average number of spikes (F0) induced by tuberomammillary activation in the different conditions. The optimal grating spatial frequency, that which yielded the largest modulated response, was used for the visually driven response measure for each cell. An unmodulated homogeneous field was presented during the baseline condition.
Fig. 6.
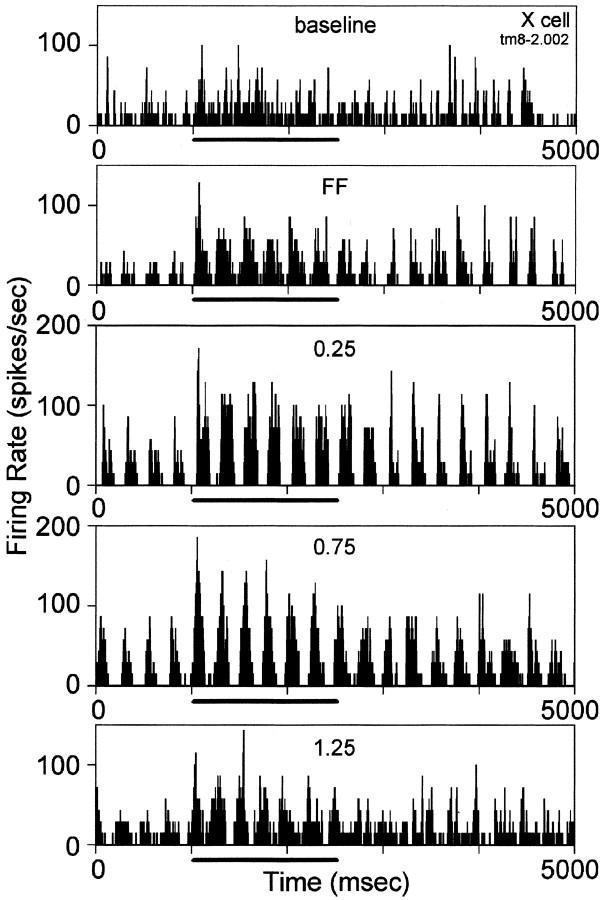
Responses of an LGN X-cell to a set of visual stimuli before, during, and after tuberomammillary (tm) stimulation. From top to bottom, the histograms show responses during baseline activity and to the modulated full-field (FF) and grating stimuli of 0.25, 0.75, and 1.25 cycles/° delivered at 4 Hz. The cell was tested with a total of eight grating stimuli of varied spatial frequency.
Fig. 7.
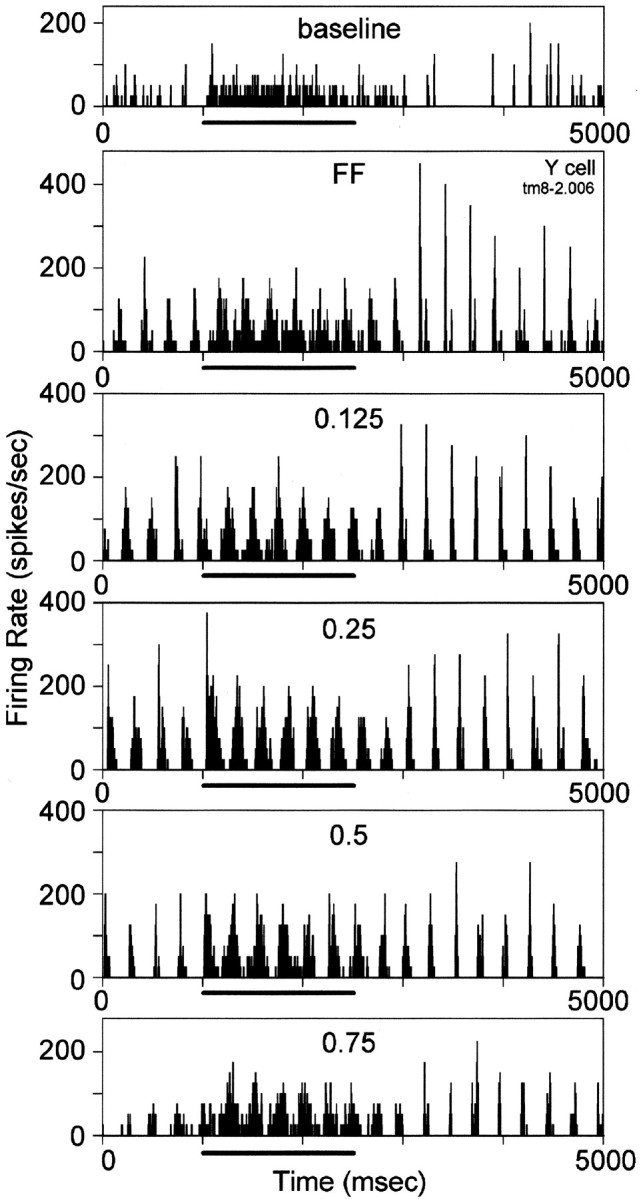
Responses of an LGN Y-cell to a set of visual stimuli. The cell was tested with a total of seven grating stimuli of varied spatial frequency in addition to the full-field (FF) and baseline conditions. Conventions are as in Figure 6.
Fig. 8.
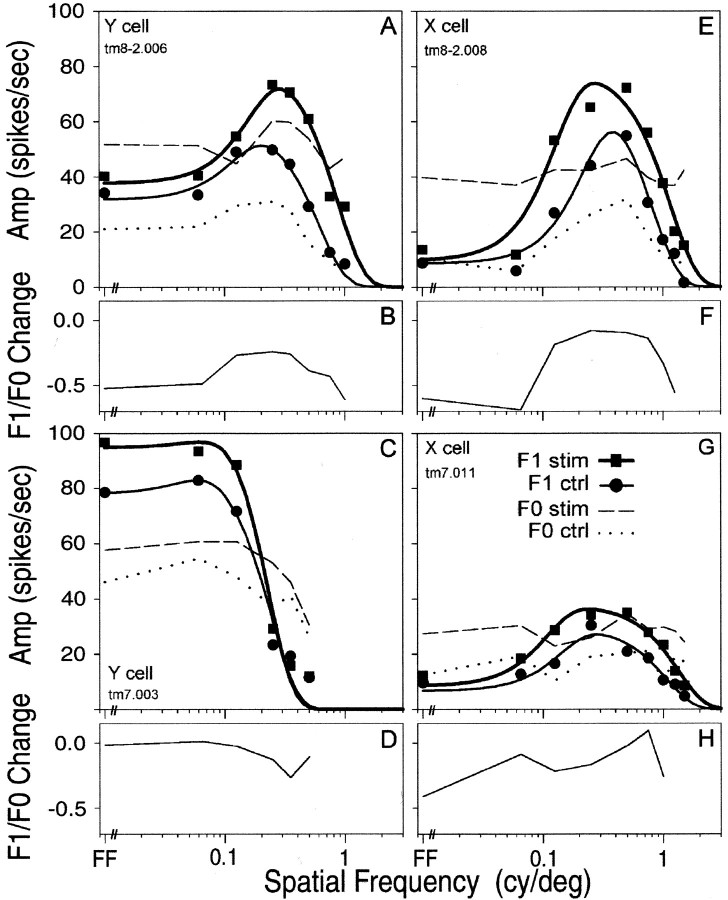
Effects on spatial tuning of LGN Y-cells (A–D) and X-cells (E–H).A, C, E, G, Amplitude of visual response plotted as a function of spatial frequency of the 4 Hz grating visual stimulus for four geniculate cells. Measures of F1 amplitude were obtained before (ctrl, circles) and during (stim, squares) tuberomammillary (tm) activation.Solid curves drawn through the F1 data points represent best-fit difference-of-Gaussians functions for control (thin curves) and tuberomammillary stimulation (thick curves) conditions. The average number of spikes in the response (F0) obtained before (dotted curves) and during (dashed curves) stimulation is also shown.Key in G applies to A, C, E, and G. B, D, F, H, Stimulation-induced change in F1:F0 ratio as a function of stimulus spatial frequency for the four illustrated cells. B is derived from the data in A, D fromC, F from E, andH from G. The value [(F1 stim/F0 stim) − (F1 ctrl/F0 ctrl)]/(F1 ctrl/F0 ctrl) is plotted on theordinate.
The time course of the effect consisted generally of an immediate increase in baseline activity on onset of tuberomammillary stimulation, a maximal effect occurring during the period of tuberomammillary stimulation, and a more gradual return to prestimulation levels after stimulation terminated. In cells tested multiple times, including one cell seven times in conjunction with a variety of visual conditions, the pattern of results remained the same.
The poststimulation effects varied across LGN cells. Most cells exhibited a simple return to their prestimulation activity level within 1–1.5 sec after termination of tuberomammillary stimulation (Fig.2A). In contrast, the firing rate in two X-cells and two Y-cells remained elevated for 4 sec after stimulation (Fig.2B). Finally, in a few X- and Y-cells, there was a temporary decrease in poststimulus firing rate in comparison with control levels (see Fig. 7A) or a change in firing pattern that included more bursts of action potentials (see Figs. 6, 7).
A subset of LGN cells appeared little affected by tuberomammillary activation (Fig. 3). Analysis of receptive field and other response properties revealed no differences between affected and unaffected cells, which were encountered in the same electrode penetrations.
Effect of tuberomammillary activation on responses to visual stimulation
Significant increases in visual responses
Figure 2, C and D, illustrates the responses of X- and Y-cells to visual stimuli presented before, during, and after a 1500 msec period of tuberomammillary activation. A drifting sinusoidal grating produced a modulation in physiological activity as the light and dark bars of the grating passed across the receptive field of the cell. Both cells in Figure 2, C andD, exhibited an increase in the depth of the modulated response during tuberomammillary activation when compared with the prestimulation control condition. The depth of modulation was quantified as the amplitude of the Fourier component of the response of a cell at the temporal drift rate of the grating (F1). The increase in the visually modulated response with tuberomammillary activation was statistically significant for X-cells (median F1 increase from 21.05 spikes/sec before stimulation to 32.15 spikes/sec during stimulation; Wilcoxon signed rank test, p = 0.004) and Y-cells (30.25 to 39.25 spikes/sec; Wilcoxon signed rank test,p = 0.0093).
The increase in visual response developed rapidly within the first visual stimulus cycle and persisted for the duration of tuberomammillary activation. Consistent with the poststimulus changes in baseline activity, some cells exhibited a temporary change in firing pattern during the period immediately after cessation of tuberomammillary stimulation (see Figs. 2D, 6, 7) during which the physiological response was narrower in width and of higher spike frequency. This pattern is consistent with change to the burst mode of response (see below).
Effect on baseline activity versus visually modulated activity
Figure 3 summarizes the baseline and visual effects of tuberomammillary activation in the same cells. Tuberomammillary activation produced a consistent change in both baseline activity and visually driven activity for the majority of cells. There was a significant correlation between the effects on baseline and visually driven activity for X-cells (r = +0.5193; Spearman correlation coefficient, p = 0.0285) and for Y-cells (r = +0.4912; Spearman correlation coefficient,p = 0.0524). The increase in response level of X- and Y-cells, as a whole, attributable to tuberomammillary stimulation appeared greater in the visual condition than in the baseline condition, but this was not statistically significant, nor was there a significant difference between X- and Y-cells in the change in response in the baseline condition or in the visual condition.
Effect of tuberomammillary activation on response mode: burst-to-tonic change
The state of LGN neurons varies between two well documented modes of response, the burst mode and the tonic mode (Jahnsen and Llinás, 1984; Steriade and McCarley, 1990; Sherman, 1996). Previous work has demonstrated that several neuromodulatory systems can enable the change in firing mode in thalamic cells, acting through a low-threshold calcium conductance within the cell membrane (McCormick, 1992; Sherman, 1996). We now extend these findings to the tuberomammillary system in vivo.
Tuberomammillary activation can switch an LGN neuron from the burst mode of firing to the tonic firing mode. The initial visual response of the cell seen in the raster plot in Figure4A, top half, consisted of short, high-frequency (>250 Hz) bursts of 2–10 action potentials, preceded by at least 100 msec of no activity. This pattern of response fits the extracellular criterion for burst firing defined by Lu et al. (1992) and Guido et al. (1992). The visual responses converted quickly to the tonic firing mode with tuberomammillary activation, exhibiting longer trains of action potentials firing at a markedly lower frequency.
Fig. 4.
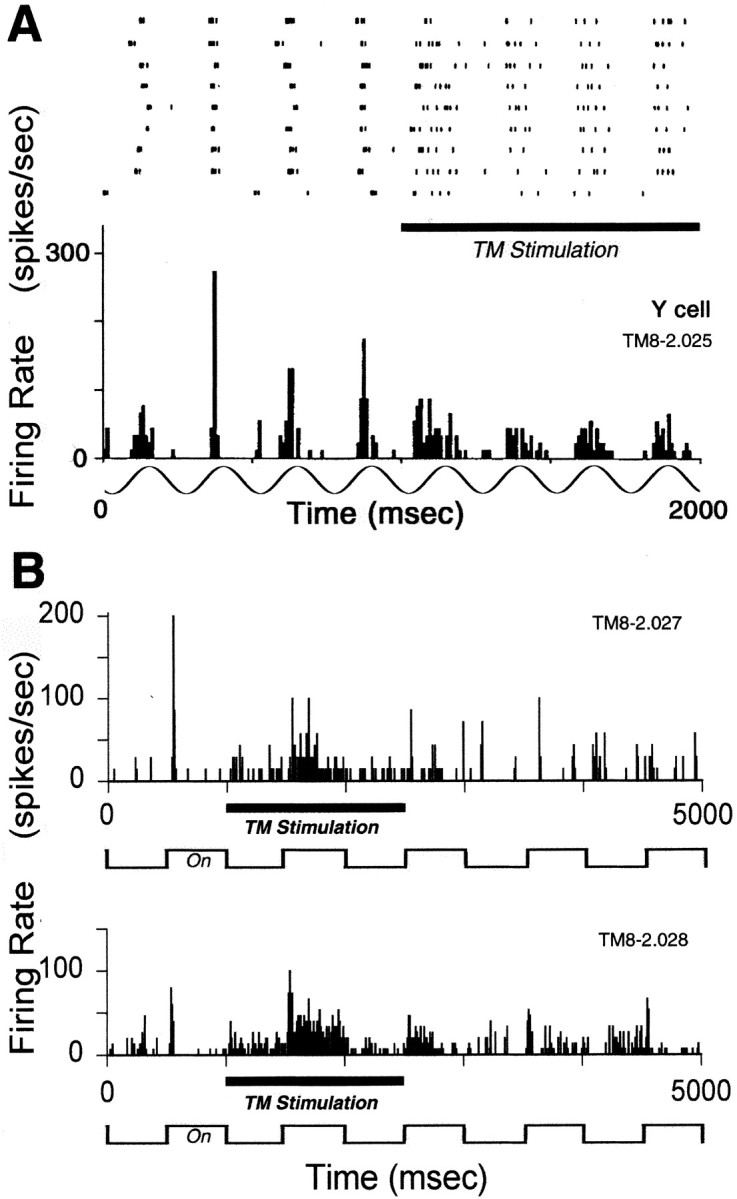
Raster plot and histograms of LGN cell mode change during tuberomammillary stimulation. A, The raster plot in the top half displays action potential activity of a Y-cell in response to a drifting grating stimulus during nine successive 2 sec trials from which the adjacent histogram was constructed. The horizontal bar indicates the period of tuberomammillary stimulation during which the cell switched from the burst-firing mode to the tonic mode. The sinusoid indicates the periodicity but not the absolute phase of the 4 Hz grating stimulus. A phase lag of 0.25 radians developed during the mode shift, corresponding to a response shift of 10 msec. B, Histograms obtained from the same Y-cell as in A in response to a spot of light slightly smaller (top histogram; n = 7 trials) and slightly larger (bottom histogram; n = 15 trials) than the receptive field center of the cell, which was 1.1° in diameter. The spot was flashed on and off at 1 Hz as indicated below each histogram. As in A, the transient burst responses of the cell became more tonic as a result of tuberomammillary (TM) stimulation.
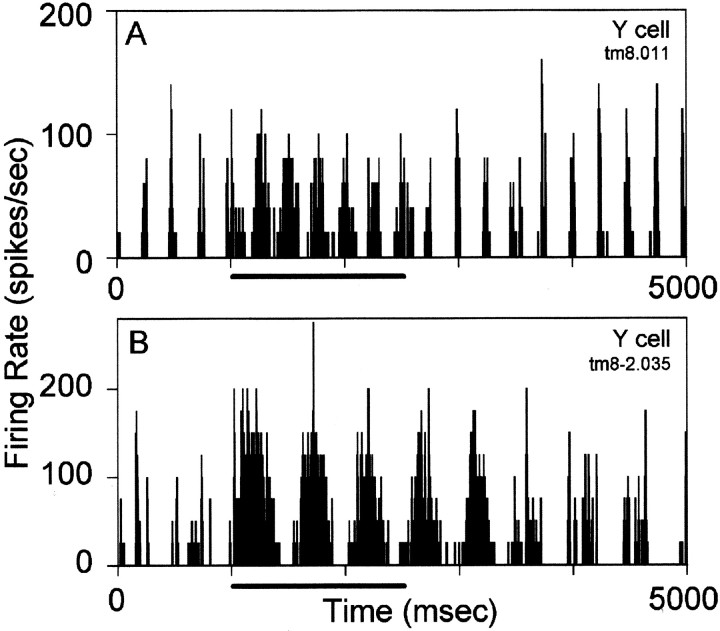
The change in response mode was also evident in the resulting peristimulus time histogram (Figs. 4A,5). Initially, the histogram contained long pauses in the response of each cell, often punctuated by brief periods of high firing rate that reflect the bursts. In contrast, the visual responses of the cell assumed a broader and more sinusoidal shape during the period of tuberomammillary activation, more closely resembling the time course of the visual stimulus. F1 values increased and F2 values decreased during this period, consistent with an increase in linearity of response during tuberomammillary activation (Uhlrich et al., 1995). The mode change reverted promptly back to burst mode in some cells once tuberomammillary stimulation ceased, as shown in Figure5A, and changed more slowly in others, as seen in Figure5B. The responses of a cell were sometimes more transient than apparent in the histogram because of variation in the latency of the burst responses. This is illustrated in the clearly transient raster responses in Figure 4A, left half. Those in the first visual cycle of the trial vary in latency and yield a broader averaged response than those of the second visual cycle of more constant latency.
Fig. 5.
Change in response mode in two representative geniculate Y-cells during tuberomammillary activation.Horizontal bars in this and subsequent figures indicate the period of tuberomammillary (tm) stimulation. A grating visual stimulus drifted at 4 and 2 Hz in A andB, respectively. Tuberomammillary activation produced a phase lag of 0.65 radians, corresponding to a response shift of 26 msec for the cell in A, and a phase lag of 0.67 radians, corresponding to a response shift of 53 msec for the cell inB.
By virtue of shifting from the burst to tonic firing mode, the histogram shape changed, and the weight of the response shifted later in time. The sinusoidal waveform showing the drift frequency of the grating stimulus is indicated below the histogram in Figure4A. When the waveform is centered on the three cycles of tonic response on the right side, it is evident that the weight of the burst responses on the left occurs slightly earlier in the stimulus cycle.
The burst-to-tonic change in the visual response with tuberomammillary stimulation was not dependent on the presence of grating stimuli. The transformation was similar when the visual stimulus was a spot of light on the receptive field of the cell (Fig.4B).
Most cells we recorded were in the tonic mode of firing before onset of tuberomammillary stimulation, presumably reflecting the low level of anesthesia used during the recording phase of these experiments. Cells initially in the tonic mode stayed in the tonic mode during stimulation and never reverted back to the burst mode after stimulation. These findings are consistent with in vitro histamine studies on LGN cells (McCormick and Williamson, 1991). A switch to or an enhancement of the burst mode pattern of firing was observed in a few cells only during the brief period after termination of the tuberomammillary stimulation (Figs. 6,7).
Effect of tuberomammillary activation on spatial tuning
The visual responses of individual LGN cells to grating stimuli were recorded across a range of spatial frequency values in conjunction with tuberomammillary activation, and examples of results for two representative cells are illustrated in Figures 6 and 7. In both cases, tuberomammillary activation resulted in an increase in the visual response at all spatial frequencies. These effects held for cells whose responses were primarily tonic under both control and tuberomammillary conditions (Fig. 6) as well as for cells whose firing mode was changed from burst to tonic by tuberomammillary activation (Fig. 7).
It is evident from the sets of histograms in Figures 6 and 7 that both the amplitude of the visual response and the effect of tuberomammillary activation depend on the spatial frequency of the grating visual stimulus. We quantified these effects by performing a Fourier analysis of data such as those shown in Figures 6 and 7. Data from 14 X-cells and 12 Y-cells from four cats were incorporated into the analysis from which we derived measures of F0 (average number of spikes) and F1 (depth of modulated response at the temporal drift rate of the grating) for the control and tuberomammillary stimulation conditions at each spatial frequency. The F1 amplitudes from the complete data set of the cell depicted in Figure 7 and from three additional cells are plotted as a function of spatial frequency of the grating stimulus in Figure8, A, C,E, and G. The curves have the inverted U shape that has been reported previously for LGN X- and Y-cells (So and Shapley, 1981), with Y-cells showing less of a decline at low spatial frequencies and a lower spatial resolution than X-cells.
Analysis using difference of Gaussians model
The thick unbroken curves fit through the F1 data points in Figure8 represent the best-fit curves obtained using the difference of Gaussians model of center–surround receptive field organization (So and Shapley, 1981; Linsenmeier et al., 1982). The difference of Gaussians fits provide measures of the amplitude and radius of the receptive field center and receptive field surround from each spatial tuning curve. Although more complex receptive field models incorporate phase parameters (Kaplan, 1991), those models were not used, because tuberomammillary activation had little effect on the phase of the response (see below). We found expected differences between X- and Y-cells per se in the difference of Gaussians values (cf. So and Shapley, 1981) but no difference between cell types in the effect of tuberomammillary activation on the difference of Gaussians values.
For X- and Y-cells combined, tuberomammillary activation produced a significant increase in the amplitude of the receptive field center (control, mean = 72.9; tuberomammillary stimulation, mean = 121.4; Wilcoxon signed rank test, p = 0.0005), reflecting an increase in the height of the spatial tuning curves. We also found a slight decrease in the radius of receptive field center (control, mean = 0.61°; tuberomammillary stimulation, mean = 0.55°; Wilcoxon signed rank test,p = 0.0075). Changes in the receptive field surround amplitude and radius parameters were not significant. Finally, there was no significant change in the ratio of the strength of the receptive field surround (proportional to the product of the amplitude of the surround and the square of its radius) to the strength of the center (control, 0.66; tuberomammillary, 0.68; Wilcoxon signed rank test, not significant). The lack of change in the measure of surround strength relative to center strength indicates that the increase in the height of the spatial tuning curve with tuberomammillary activation was not accompanied by a significant change in tuning curve shape, because proportionate increases at all spatial frequencies lead to a proportionate increase in the amplitude of center and surround responses.
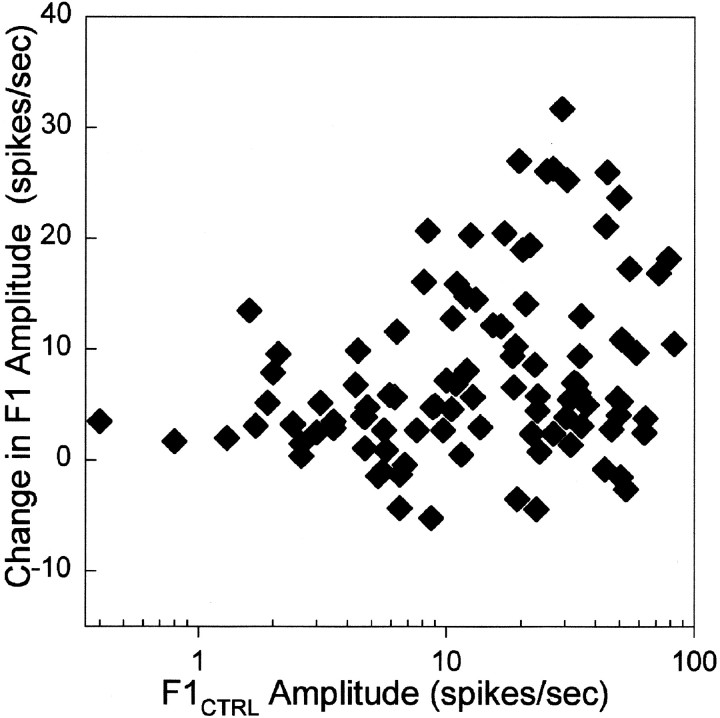
The difference of Gaussians analysis suggests that the increase in firing rate during tuberomammillary activation was greatest at spatial frequencies that elicited the largest responses under the control condition. This trend was confirmed and summarized in Figure 9, which shows the change in modulated response, F1, as a function of the F1 response in the control condition. Data from 13 X- and Y-cells across the effective range of spatial frequencies are plotted. The graph shows again that the general effect of tuberomammillary activation is to increase the visual response of the cell. In addition, there is a significant correlation between the size of the visual response in the control condition and the magnitude of the tuberomammillary effect (r = +0.2724; Spearman correlation coefficient, p = 0.0029). Thus, the greatest effects of tuberomammillary activation are seen under conditions in which the cell already has a well developed visual response.
Fig. 9.
Tuberomammillary-induced change in F1 values (F1STIM − F1CTRL) plotted as a function of prestimulation F1 values (F1CTRL). Pooled data from seven Y- and four X-cells tested across a range of gratings of varied spatial frequency presented at 4 Hz are shown.
Tuberomammillary enhancement of responses with high F1 content
Figure 8 also shows curves indicating the F0 values for each cell under the control and tuberomammillary stimulation conditions. Similar to the increase in F1 values, the F0 values increased with tuberomammillary activation. This was expected because in most cases the visual response was rectified, and increases in visual response would be accompanied by an increase in the average spike firing rate. However, there are cases in which the F0 increase was proportionally greater than F1, primarily when the visual response was relatively low, such as with the lowest and highest spatial frequency stimuli (Fig.8A,E). We quantified this observation by computing the F1:F0 ratio for the control and tuberomammillary stimulation conditions, and the difference in this ratio was plotted (Fig.8B,D,F,G). A value of 0 indicated no difference in the ratio. Negative values occurred when tuberomammillary activation resulted in a proportionally greater increase in F0 than in F1. Note that a rectified response precluded positive values for which F1 increased more than F0. The F1:F0 ratio was generally well maintained under visual conditions that elicited a large modulated response, and the ratio declined at spatial frequencies that produced smaller responses.
The relationship between the change in F1:F0 ratio and the size of the control F1 amplitude was highly significant (r = 0.6464; Spearman correlation coefficient, p < 0.0001). This result indicates that tuberomammillary stimulation differentially enhances signals with high F1 content. This is consistent with our other finding that tuberomammillary activation results in a greater increase in well modulated visual responses than in poorly modulated visual responses.
Effects of tuberomammillary activation on phase
Tuberomammillary activation had a small effect on the phase of the visual responses of geniculate cells. When measured across responses to all spatial frequencies, a phase lag was found for X-cells (average = 0.09 radians; Mann–Whitney U test,p = 0.043) and for Y-cells (0.08 radians; Mann–WhitneyU test, p = 0.048). These phase lags were small for the population, corresponding to response shifts of <4 msec on average for gratings drifting at 4 Hz. The delayed visual response is consistent with, and moreover explained by, the shift in time to peak response that accompanies the burst-to-tonic mode change produced in LGN cells. When there is a burst-to-tonic mode change, as is clearly evident in Figures 4, 5, and 7, there is a visible delay in reaching the peak of the response as it transitions from a narrow, sharp burst to a broader shape, more sinusoidal in form. It was in these cells that the greatest phase lags occurred. For other geniculate cells with less dramatic changes in histogram shape, a phase shift may occur if the proportion of burst firing in the response is reduced even minimally. Regardless of whether this small shift represents a simple increase in latency or a true phase lag, both are consistent with a delayed time to peak associated with a burst-to-tonic change in firing mode. Finally, there was no significant difference in phase effects between X- and Y-cells or between the size of the effect for low spatial frequency visual stimuli compared with high spatial frequency stimuli.
DISCUSSION
Primary effects and mechanisms
We found that activation of the tuberomammillary nucleus can produce significant and straightforward effects on LGN neurons in the intact brain. These effects include an increase in baseline neuronal activity and a change to the tonic mode of firing by cells whose firing pattern was previously in the burst mode. We also found that visual responses were enhanced by tuberomammillary activation. The excitatory effects occurred across the range of visual spatial frequencies to which the cell would respond but were greatest at spatial frequencies that were already optimal for the neuron. The spatial tuning curve of LGN cells was elevated by tuberomammillary activation, but there was no significant change in tuning curve shape.
These results are consistent with the effects of histamine reported previously in vitro. Application of histamine in a slice preparation produced a depolarization because of a decrease in a potassium conductance, IK leak, and a depolarizing shift in the activation curve of a hyperpolarization-activated cation conductance,Ih (McCormick and Williamson, 1991). Such depolarizing effects are consistent with the significantly increased firing rates we observed in vivo. LGN thalamocortical cells generally have a lower firing rate than their retinal ganglion cell inputs, reflecting transmission failure at the retinogeniculate synapse (Cleland et al., 1971; Cleland and Lee, 1985;Mastronarde, 1987). The depolarization resulting from histaminergic activation appears to act to restore the efficiency of the retinal→geniculate synapse, thereby improving transmission along the retinogeniculocortical pathway.
The second major finding is that tuberomammillary activation can change the firing pattern of LGN neurons. When the response of a cell initially consisted of short, high-frequency bursts of action potentials, tuberomammillary stimulation altered the firing pattern to a longer, lower-frequency train of action potentials. The firing rate can be altered through many mechanisms, and it is likely that the aforementioned histamine-mediated decrease in potassium conductance and resulting increases in membrane resistance and time constant contribute. The most likely reason for the change in firing pattern is the well documented change from burst to tonic mode that thalamic neurons can undergo. The depolarization that accompanies histamine application inactivates a low-threshold calcium conductance,It (McCormick and Williamson, 1991). The It current is the basis for the burst pattern of activity in thalamic neurons; its inactivation by depolarization elevated the LGN cell from the burst mode of firing to the tonic mode. This is consistent with our in vivoobservations of histamine activation switching cells to, or maintaining cells in, the tonic firing mode. Although the burst mode is characteristic of sleep, the tonic mode predominates overwhelmingly in the awake brain state and is associated with an enhancement of linear signal processing in LGN. Thus, histamine shifted the cell toward the tonic mode, the response mode that more faithfully transmits retinal signals to cerebral cortex (Sherman, 1996).
The direct tuberomammillary-to-LGN anatomical connection (Uhlrich et al., 1993) and the similarity of our in vivo findings to thein vitro results (McCormick and Williamson, 1991) suggest that these effects occurred through the direct histaminergic pathway. Nevertheless, it remains possible that histaminergic pathways could also affect LGN neurons indirectly through other brain regions that project to LGN such as cortex. For example, the poststimulation response of the cell in Figure 7 was more transient than the control response preceding stimulation. Such a result is not readily explained by a direct depolarizing histaminergic effect and may instead reflect indirect effects on LGN circuitry. It is not clear what combination of direct and indirect histaminergic effects contributed to the modified responses reported here, and further study is required to establish this. The present results demonstrate the impact of the activated histaminergic system on the intact geniculate circuitry.
No effect on inhibitory cells
An important finding is that histaminergic activation impacts most on visual responses at those spatial frequencies to which an LGN cell already has a robust response, in essence producing a multiplicative effect on cell response. This translates into no significant change in the shape of the spatial tuning curve of a cell with tuberomammillary stimulation and, moreover, indicates no change in the spatial receptive field organization of the cell. These findings suggest that the underlying histaminergic effects on thalamic neural circuitry reflect direct actions on thalamocortical cells with little or no involvement of thalamic GABAergic neurons.
Retinal ganglion cells provide the primary visual drive to LGN cells, and LGN cell receptive fields reflect, in large part, their retinal input (Cleland and Lee, 1985; Sherman and Guillery, 2001). It therefore follows that enhancing the response to retinal input would result in an increase in firing rate without change in receptive field organization. Retinal ganglion cells have a receptive field center and surround; therefore, an enhancement of retinogeniculate drive should lead to an increase in the strength of both. This, in fact, is the result we observed.
Although LGN cells derive their primary receptive field features from retinal input, elaboration can occur in the form of an enhanced receptive field surround. The additional surround effect is thought to arise from inhibitory inputs from GABAergic thalamic cells, in particular, from interneurons within the LGN and cells of the dorsally adjacent perigeniculate nucleus or thalamic reticular nucleus. Significant histaminergic effects on thalamic inhibitory cells would have altered the strength of the receptive field surround of LGN cells relative to the center. However, this was not observed. Instead, the receptive field center and surround were affected proportionally, suggesting that histaminergic activation had little or no effect on thalamic inhibitory neurons. This is consistent with the in vitro report of no direct effect of histamine on LGN interneurons (Pape and McCormick, 1995) and stands in contrast to the significant tuning curve effects observed after cholinergic activation of the LGN (Uhlrich et al., 1995).
Analysis of phase change in the visual responses in our data yields the same conclusion as that derived from the spatial tuning curve data; they imply no additional impact on the geniculate cell receptive field surround from tuberomammillary activation. We found no difference in the size of the phase shift, a small phase lag, at high versus low spatial frequencies. Because receptive field center and surround mechanisms contribute differentially to responses at low and high spatial frequencies, an interaction between the effect on phase and spatial frequency would suggest differential effects on the geniculate receptive field surround relative to the center. However, this was not observed. Instead, the change in firing mode can account fully for the small phase lag observed across all spatial frequencies.
Histaminergic activation in vivo
The histaminergic system is understood to act nonsynaptically (Takagi et al., 1986; Uhlrich et al., 1993; Brown et al., 2001), without need for histamine release sites and histamine receptors to be apposed directly, and this likely explains the efficacy of the histaminergic effect in the LGN despite the presence of only moderately dense tuberomammillary axons (Uhlrich et al., 1993). Histamine also uses enzymatic catabolism instead of a fast high-affinity uptake mechanism. Histamine, in effect, seems to act as a local hormone, diffusely impacting cells (Wada et al., 1991a,b). Thus, a high density of histaminergic fibers is not required to produce significant histaminergic effects (Schwartz et al., 1991), particularly given the high density of histaminergic receptors in the LGN (Bouthenet et al., 1988; Ruat et al., 1990) and the consistent depolarization in thalamocortical cells in the LGN with histamine application in vitro (McCormick and Williamson, 1991).
Given the density of histaminergic receptors in the LGN and the strong depolarizing effects of histamine application in vitro(McCormick and Williamson, 1991), it warrants comment that some cells in the present experiments showed little or no effect from tuberomammillary activation. It is possible that these cells might have been LGN interneurons, which are not distinguishable from thalamocortical cells in our extracellular recordings and are not affected directly by histamine (Pape and McCormick, 1995). Although it is likely that most of our recordings were from thalamocortical cells, given that they comprise ∼75% of the neurons in the LGN (Sherman and Koch, 1986) and the electrode sampling biases favor encountering thalamocortical cells, a lack of histaminergic effect in some LGN cells would be consistent with recording from LGN interneurons.
Another possibility is that some cells were unaffected because of the inability to activate the entire population of histaminergic cells in the hypothalamus. Stimulation electrodes could activate only a portion of the tuberomammillary nucleus, the whole of which is wide-ranging and irregularly shaped (Uhlrich et al., 1993) and for which there is no clear mapping of tuberomammillary neurons onto brain target regions. Furthermore, we deliberately avoided placing stimulating electrodes in the lateral- and rostral-most portions of the nucleus because of their proximity to the optic tract. Thus, some LGN cells were likely unaffected because we did not activate the entirety of the tuberomammillary nucleus.
Functional considerations
Tuberomammillary stimulation strengthened and produced higher-fidelity sensory signals in the retinogeniculocortical pathway. We found this in the ascending visual pathway, but histaminergic axons are also present in other thalamic relay nuclei (Watanabe et al., 1984;Panula et al., 1989), and it is likely that histamine similarly affects other sensory modalities. Promoting transmission of afferent signals centrally may be one way in which the histaminergic system contributes to arousal in the mammalian brain.
The histaminergic system appears to use the same intrinsic membrane currents as the cholinergic and other aminergic systems to directly depolarize LGN thalamocortical cells (McCormick and Pape, 1990;McCormick and Williamson, 1991; McCormick, 1992; Zhu and Uhlrich, 1998). The other neuromodulatory systems additionally appear to act directly on thalamic inhibitory neurons. The cholinergic system affects both thalamic reticular cells and intrinsic interneurons; the serotonergic and noradrenergic influence on LGN interneurons is less clear, but they robustly affect thalamic reticular cells (Kayama et al., 1982; McCormick and Prince, 1988; McCormick and Wang, 1991). These other systems may alter visual receptive field tuning through their actions on inhibitory neurons, as has been demonstrated for the cholinergic system (Sillito et al., 1983; Uhlrich et al., 1995). The histaminergic system differs in producing more pure enhancement of the retinally derived afferent signal, with little or no direct effect on inhibitory neurons, thus boosting but not transforming visual signals.
Footnotes
This work was supported by the National Institutes of Health National Eye Institute and the University of Wisconsin Medical School under the Howard Hughes Medical Institute Research Resources Program for Medical Schools.
Correspondence should be addressed to Dr. Daniel Uhlrich, Department of Anatomy, University of Wisconsin Medical School, 1300 University Avenue, Madison, WI 53706-1532. E-mail: duhlrich@facstaff.wisc.edu.
REFERENCES
- 1.Bouthenet ML, Ruat M, Sales N, Garbarg M, Schwartz JC. A detailed mapping of histamine H1-receptors in guinea-pig central nervous system established by autoradiography with [125I]iodobolpyramine. Neuroscience. 1988;26:553–600. doi: 10.1016/0306-4522(88)90167-4. [DOI] [PubMed] [Google Scholar]
- 2.Brown RE, Stevens DR, Haas H. The physiology of brain histamine. Prog Neurobiol. 2001;63:637–672. doi: 10.1016/s0301-0082(00)00039-3. [DOI] [PubMed] [Google Scholar]
- 3.Chazot PL, Hann V, Wilson C, Lees G, Thompson CL. Immunological identification of the mammalian H3 histamine receptor in the mouse brain. NeuroReport. 2001;12:259–262. doi: 10.1097/00001756-200102120-00016. [DOI] [PubMed] [Google Scholar]
- 4.Cleland BG, Lee BB. A comparison of visual responses of cat lateral geniculate nucleus neurones with those of ganglion cells afferent to them. J Physiol (Lond) 1985;369:249–268. doi: 10.1113/jphysiol.1985.sp015899. [DOI] [PMC free article] [PubMed] [Google Scholar]
- 5.Cleland BG, Dubin MW, Sevick WR. Simultaneous recording of input and output of lateral geniculate neurons. Nature. 1971;231:191–192. doi: 10.1038/newbio231191a0. [DOI] [PubMed] [Google Scholar]
- 6.Funke K, Eysel UT. Possible enhancement of GABAergic inputs to cat dorsal lateral geniculate relay cells by serotonin. NeuroReport. 1995;6:474–476. doi: 10.1097/00001756-199502000-00017. [DOI] [PubMed] [Google Scholar]
- 7.Guido W, Lu S-M, Sherman SM. Relative contributions of burst and tonic responses to the receptive field properties of lateral geniculate neurons in the cat. J Neurophysiol. 1992;68:2199–2211. doi: 10.1152/jn.1992.68.6.2199. [DOI] [PubMed] [Google Scholar]
- 8.Jahnsen H, Llinás R. Electrophysiological properties of guinea-pig thalamic neurons: an in vitro study. J Physiol (Lond) 1984;349:205–226. doi: 10.1113/jphysiol.1984.sp015153. [DOI] [PMC free article] [PubMed] [Google Scholar]
- 9.Kaplan E. The receptive field structure of retinal ganglion cells in cat and monkey. In: Leventhal AG, editor. The neural basis of visual function, vision and visual dysfunction. Macmillan; London: 1991. pp. 10–40. [Google Scholar]
- 10.Kayama Y, Negi T, Sugitani M, Iwama K. Effects of locus coeruleus stimulation on neuronal activities of dorsal lateral geniculate nucleus and perigeniculate reticular nucleus of the rat. Neuroscience. 1982;7:655–666. doi: 10.1016/0306-4522(82)90071-9. [DOI] [PubMed] [Google Scholar]
- 11.Lin J-S, Sakai K, Jouvet M. Evidence for histaminergic arousal mechanisms in the hypothalamus of cat. Neuropharmacology. 1988;27:111–122. doi: 10.1016/0028-3908(88)90159-1. [DOI] [PubMed] [Google Scholar]
- 12.Linsenmeier RA, Frishman LJ, Jakiela HG, Enroth-Cugell C. Receptive field properties of X and Y cells in the cat retina derived from contrast sensitivity measurements. Vision Res. 1982;22:1173–1183. doi: 10.1016/0042-6989(82)90082-7. [DOI] [PubMed] [Google Scholar]
- 13.Lu S-M, Guido W, Sherman SM. Effects of membrane voltage on receptive field properties of lateral geniculate neurons in the cat: contributions of the low-threshold Ca2+ conductance. J Neurophysiol. 1992;68:2185–2198. doi: 10.1152/jn.1992.68.6.2185. [DOI] [PubMed] [Google Scholar]
- 14.Manning KA, Wilson JR, Uhlrich DJ. Histamine-immunoreactive neurons and their innervation of visual regions in the cortex, tectum, and thalamus in the primate Macaca mulatta. J Comp Neurol. 1996;373:271–282. doi: 10.1002/(SICI)1096-9861(19960916)373:2<271::AID-CNE9>3.0.CO;2-0. [DOI] [PubMed] [Google Scholar]
- 15.Mastronarde DN. Two classes of single-input X-cells in cat lateral geniculate nucleus. II. Retinal inputs and the generation of receptive field properties. J Neurophysiol. 1987;57:381–413. doi: 10.1152/jn.1987.57.2.381. [DOI] [PubMed] [Google Scholar]
- 16.McCormick DA. Neurotransmitter actions in the thalamus and cerebral cortex and their role in neuromodulation of thalamocortical activity. Prog Neurobiol. 1992;39:337–388. doi: 10.1016/0301-0082(92)90012-4. [DOI] [PubMed] [Google Scholar]
- 17.McCormick DA, Pape H-C. Noradrenergic and serotonergic modulation of a hyperpolarization-activated cation current in thalamic relay neurons. J Physiol (Lond) 1990;431:319–342. doi: 10.1113/jphysiol.1990.sp018332. [DOI] [PMC free article] [PubMed] [Google Scholar]
- 18.McCormick DA, Prince DA. Noradrenergic modulation of firing pattern in guinea pig and cat thalamic neurons, in vitro. J Neurophysiol. 1988;59:978–996. doi: 10.1152/jn.1988.59.3.978. [DOI] [PubMed] [Google Scholar]
- 19.McCormick DA, Wang Z. Serotonin and noradrenaline excite GABAergic neurons of the guinea-pig and cat nucleus reticularis thalami. J Physiol (Lond) 1991;442:235–255. doi: 10.1113/jphysiol.1991.sp018791. [DOI] [PMC free article] [PubMed] [Google Scholar]
- 20.McCormick DA, Williamson A. Modulation of neuronal firing mode in cat and guinea pig LGNd by histamine: possible cellular mechanisms of histaminergic control of arousal. J Neurosci. 1991;11:3188–3199. doi: 10.1523/JNEUROSCI.11-10-03188.1991. [DOI] [PMC free article] [PubMed] [Google Scholar]
- 21.Monti JM. Involvement of histamine in the control of the waking state. Life Sci. 1993;53:1331–1338. doi: 10.1016/0024-3205(93)90592-q. [DOI] [PubMed] [Google Scholar]
- 22.Panula P, Yang HY, Costa E. Histamine-containing neurons in the rat hypothalamus. Proc Natl Acad Sci USA. 1984;81:2572–2576. doi: 10.1073/pnas.81.8.2572. [DOI] [PMC free article] [PubMed] [Google Scholar]
- 23.Panula P, Pirvola U, Auvinen S, Airaksinen MS. Histamine-immunoreactive nerve fibers in the rat brain. Neuroscience. 1989;28:585–610. doi: 10.1016/0306-4522(89)90007-9. [DOI] [PubMed] [Google Scholar]
- 24.Pape H-C, McCormick DA. Electrophysiological and pharmacological properties of interneurons in the cat dorsal lateral geniculate nucleus. Neuroscience. 1995;68:1105–1125. doi: 10.1016/0306-4522(95)00205-w. [DOI] [PubMed] [Google Scholar]
- 25.Rodieck RW. Quantitative analysis of cat retinal ganglion cell response to visual stimuli. Vision Res. 1965;5:583–601. doi: 10.1016/0042-6989(65)90033-7. [DOI] [PubMed] [Google Scholar]
- 26.Ruat M, Traiffort E, Bouthenet ML, Schwartz JC, Hirschfeld J, Buschauer A, Schunack W. Reversible and irreversible labeling and autoradiographic localization of the cerebral histamine H2 receptor using [125]iodinated probes. Proc Natl Acad Sci USA. 1990;87:1658–1662. doi: 10.1073/pnas.87.5.1658. [DOI] [PMC free article] [PubMed] [Google Scholar]
- 27.Sakai K, El Mansari M, Lin JX, Shang JG, Vanni-Mercier G. The posterior hypothalamus in the regulation of wakefulness and paradoxical sleep. In: Mancia M, Marini G, editors. The diencephalon and sleep. Raven; New York: 1990. pp. 171–198. [Google Scholar]
- 28.Schwartz J-C, Arrang J-M, Garbarg M, Pollard H, Ruat M. Histaminergic transmission in the mammalian brain. Physiol Rev. 1991;71:1–51. doi: 10.1152/physrev.1991.71.1.1. [DOI] [PubMed] [Google Scholar]
- 29.Shapley R, Lennie P. Spatial frequency analysis in the visual system. Annu Rev Neurosci. 1985;8:547–583. doi: 10.1146/annurev.ne.08.030185.002555. [DOI] [PubMed] [Google Scholar]
- 30.Sherman SM. Functional organization of the W-, X-, and Y-cell pathways in the cat: a review and hypothesis. In: Sprague JM, Epstein AN, editors. Progress in psychobiology and physiological psychology. Academic; New York: 1985. pp. 233–314. [Google Scholar]
- 31.Sherman SM. Dual response modes in lateral geniculate neurons: mechanisms and functions. Vis Neurosci. 1996;13:205–213. doi: 10.1017/s0952523800007446. [DOI] [PubMed] [Google Scholar]
- 32.Sherman SM, Guillery RW. Exploring the thalamus. Academic; San Diego: 2001. [Google Scholar]
- 33.Sherman SM, Koch C. The control of retinogeniculate transmission in the mammalian lateral geniculate nucleus. Exp Brain Res. 1986;63:1–20. doi: 10.1007/BF00235642. [DOI] [PubMed] [Google Scholar]
- 34.Sillito AM, Kemp JA, Berardi N. The cholinergic influence on the function of the cat dorsal lateral geniculate nucleus (dLGN). Brain Res. 1983;280:299–307. doi: 10.1016/0006-8993(83)90059-8. [DOI] [PubMed] [Google Scholar]
- 35.Singer W. Control of thalamic transmission by corticofugal and ascending reticular pathways in the visual system. Physiol Rev. 1977;57:386–420. doi: 10.1152/physrev.1977.57.3.386. [DOI] [PubMed] [Google Scholar]
- 36.So YT, Shapley RM. Spatial tuning of cells in and around lateral geniculate nucleus of the cat: X and Y relay cells and perigeniculate interneurons. J Neurophysiol. 1981;45:107–120. doi: 10.1152/jn.1981.45.1.107. [DOI] [PubMed] [Google Scholar]
- 37.Steriade M, Deschênes M. The thalamus as a neuronal oscillator. Brain Res. 1984;320:1–63. doi: 10.1016/0165-0173(84)90017-1. [DOI] [PubMed] [Google Scholar]
- 38.Steriade M, Llinás R. The functional states of the thalamus and the associated neuronal interplay. Physiol Rev. 1988;68:649–742. doi: 10.1152/physrev.1988.68.3.649. [DOI] [PubMed] [Google Scholar]
- 39.Steriade M, McCarley RW. Brainstem control of wakefulness and sleep. Plenum; New York: 1990. [Google Scholar]
- 40.Takagi H, Morishima Y, Matsuyama T, Hayashi H, Watanabe T, Wada H. Histaminergic axons in the neostriatum and cerebral cortex of the rat: a correlated light and electron microscopic immunocytochemical study using histidine decarboxylase as a marker. Brain Res. 1986;364:114–123. doi: 10.1016/0006-8993(86)90992-3. [DOI] [PubMed] [Google Scholar]
- 41.Uhlrich DJ, Cucchiaro JB. GABAergic circuits in the lateral geniculate nucleus of the cat. Prog Brain Res. 1992;90:171–192. doi: 10.1016/s0079-6123(08)63614-6. [DOI] [PubMed] [Google Scholar]
- 42.Uhlrich DJ, Manning KA, Pienkowski TP. The histaminergic innervation of the lateral geniculate complex in the cat. Vis Neurosci. 1993;10:225–235. doi: 10.1017/s0952523800003631. [DOI] [PubMed] [Google Scholar]
- 43.Uhlrich DJ, Tamamaki N, Murphy PC, Sherman SM. The effects of brain stem parabrachial activation on receptive field properties of cells in the cat's lateral geniculate nucleus. J Neurophysiol. 1995;73:2428–2447. doi: 10.1152/jn.1995.73.6.2428. [DOI] [PubMed] [Google Scholar]
- 44.Van Horn SC, Erisir A, Sherman SM. Relative distribution of synapses in the A-laminae of the lateral geniculate nucleus of the cat. J Comp Neurol. 2000;416:509–520. [PubMed] [Google Scholar]
- 45.Vanni-Mercier G, Sakai K, Jouvet M. Neurones spécifiques de l'éveil dans l'hyphothalamus postérieur du chat. Comptes Rendu Acad Sci Paris Série III. 1984;298:195–200. [PubMed] [Google Scholar]
- 46.Wada H, Inagaki N, Itowi N, Yamatodani A. Histaminergic neuron system: morphological features and possible functions. Agents Actions [Suppl] 1991a;33:11–27. doi: 10.1007/978-3-0348-7309-3_1. [DOI] [PubMed] [Google Scholar]
- 47.Wada H, Inagaki N, Yamatodani A, Watanabe T. Is the histaminergic neuron system a regulatory center for whole-brain activity? Trends Neurosci. 1991b;14:415–418. doi: 10.1016/0166-2236(91)90034-r. [DOI] [PubMed] [Google Scholar]
- 48.Watanabe T, Taguchi Y, Shiosaka S, Tanaka J, Kubota H, Terano Y, Tohyama M, Wada H. Distribution of the histaminergic neuron system in the central nervous system of rats: a fluorescent immunohistochemical analysis with histidine decarboxylase as a marker. Brain Res. 1984;295:13–25. doi: 10.1016/0006-8993(84)90811-4. [DOI] [PubMed] [Google Scholar]
- 49.Zhu JJ, Uhlrich DJ. Cellular mechanisms underlying two muscarinic receptor-mediated depolarizing responses in relay cells of the rat lateral geniculate nucleus. Neuroscience. 1998;87:767–781. doi: 10.1016/s0306-4522(98)00209-7. [DOI] [PubMed] [Google Scholar]


