

ABSTRACT
Health-care-associated infections (HAIs) are considered a serious public health issues that contribute substantially to the global burden of mortality and morbidity with respect to infectious diseases. The aim is to assess the burden of health-care-associated infections by collation of available data from published point prevalence surveys (PPS) on HAIs to give future guidance. Study protocol and methodology were designed according to preferred reporting items for systematic reviews and meta-analysis (PRISMA) guidelines. Published research papers that conducted a point prevalence survey of HAIs in hospital settings by following the structured survey methodology employed by European Centre of Disease Prevention and Control (ECDC) were included. Of 1212 articles, 67 studies were included in the final analysis conducted across different countries. Overall, 35 studies were conducted in Europe, 21 in Asia, 9 in America, and 2 in Africa. The highest prevalence of HAIs was recorded in a study conducted in adult ICU settings of 75 regions of Europe (51.3%). The majority of the studies included HAI data on urinary tract infections, respiratory tract infections, and bloodstream infections. Klebsiella pneumonia, Pseudomonas aeruginosa and E. coli were the most frequent pathogens responsible for HAIs. PPS is an useful tool to quantify HAIs and provides a robust baseline data for policymakers. However, a standardize surveillance method is required. In order to minimize the burden of HAIs, infection prevention and control programs and antibiotic stewardship may be effective strategies to minimize the risk of HAIs.
KEYWORDS: Point prevalence surveys, healthcare associated infections, hospital, infection presentation and control
1. Introduction
Globally, healthcare-associated infections (HAIs) are considered as a major health and economic burden, with a resultant increase in the length of hospitalization, morbidity, and mortality amongst hospitalized patients [1–4]. Overall, HAIs are considered as the most adverse event in healthcare delivery [5]. Surveillance of HAIs is an integral component of any comprehensive infection prevention and control (IPC) program, which provides information that are necessary to highlight and address challenging areas [6–9]. Point-prevalence surveys (PPS) have been used for the surveillance of HAI for many years [10]. The pioneering project started in the 1970s by the US Centers for Disease Control and Prevention (CDC) who used repeated PPS to investigate the advantage of establishing IPC teams in US hospitals [6]. In Europe, HAI surveillance and infection prevention and control programs are coordinated by the European Centre for Disease Prevention and Control (ECDC). PPS is a time and cost-effective method which estimates the burden of HAIs and related risk factors, especially in hospitals with limited resources [11–14]. However, going forward, a more resource demanding and cumbersome program, i.e., prospective incidence surveillance may be needed especially in high-risk specialties to help prevent HAIs [15,16].
Whilst the exact global burden of HAI is unknown, estimated prevalence rates are between 5.7%-19.1% among low and middle-income countries (LMICs) and 5.7–7.5% in high-income countries [17,18]. However, rates up to 28% to 45.8% have been reported in sub-Saharan African countries depending on the country and the ward surveyed [19,20]. In 2002, the Centers for Disease Control and Prevention (CDC) reported approximately 1.7 million cases of HAIs in US hospitals [21]. In 2012, a literature review performed by ECDC documented that over 3.2 million patients acquire at least one HAI in Europe every year with 16 million extra days of hospitalization and 37,000 attributable deaths [22]. The revised European Annual Epidemiological Report (AER) published in 2008 reported that the overall annual burden of direct annual financial losses due to HAIs were estimated at approximately €7 billion [22–24]. IPC strategies provide cost-effective solutions as 20–30% of HAI are avoidable [25,26]. However, as mentioned, the risks of HAIs appear considerably higher in LMICs including sub-Sahara Africa, and the impact on patients, and health-care systems is considerable and typically greatly underestimated [19,20,27–29]. This is a concern as HAIs increase the costs of patient care including additional diagnostic tests and therapies, prolonged hospitalization and post-discharge complications [30,31]. Higher rates of HAIs in LMICs are enhanced by issues such as poor hand hygiene due for instance to heavy workloads, issues with infrastructure including a lack of water and blocked and leaking sinks, as well as poorly positioned facilities [32].
Overall HAIs have an appreciable impact on patients, health-care workers, health-care practitioner, and national health-care systems. Descriptive surveys remained a useful tool for assessing health-care settings and might be helpful in interpreting major issues associated with patient care [33]. Despite recent systematic and other reviews concerning HAIs among LMICs including sub-Sahara African countries [4,19,20,29,34], we believe there is still an epidemiological gap because few resource-limited settings have accurate surveillance systems for monitoring HAIs, although this is improving [9]. This is important given the high rate of infectious diseases in LMICs including sub-Sahara Africa with its high rate of HIV, TB, and malaria, misuse of antibiotics in hospitals and variable prevention strategies [32,35–38]. Consequently, in order to provide a current summary on the prevalence of HAIs, we undertook an updated systematic review to assess the prevalence of HAIs based on PPS, and to identify the type of infections and microorganisms responsible for HAIs to improve future care. This builds on our recent publication that reports high rates of HAIs in Pakistan [39]. This systematic review gathers evidence concerning the burden of HAI in both LMIC and HIC, which we hope will help decision-makers and officials to develop a robust system to cope up with HAIs by investigating constraints linked to the surveillance of HAIs in health-care settings as well as identify opportunities for improvement.
2. Methods
A systematic review was conducted to explore point prevalence surveys for HAIs. The study protocol and methodology were designed according to preferred reporting items for systematic and meta-analysis (PRISMA) guidelines [40]. We aimed to detect point prevalence surveys worldwide focusing on the types of infections as well as microorganisms responsible for these various infections.
2.1. Data sources
We retrieved relevant articles using PubMed, EBSCO, ProQuest, CINHAL and Scopus databases and published in English from 1995 to the present year (2019). A comprehensive grey literature review was also performed using Google Scholar, the World Health Organization, and the website of the European Centre for Disease Prevention and Control in case we missed important references. The selected reference lists were subsequently analyzed. References of the selected articles were also retrieved and reviewed to again see if we had missed relevant articles from our initial search.
2.2. Search strategy
Data were searched using the keywords ‘health-care associated infection’, ‘hospital-acquired infections’, ‘point prevalence’, ‘repeated prevalence’, ‘period prevalence’, ‘survey’, ‘hospital(s)’, ‘intensive care units’ by using truncations and Boolean operators (‘OR’ ‘AND’) from 1995 until April 2018. The corresponding Medical Subject Heading (MeSH) terms for the above keywords were also tried. Abstracts and full-text articles were screened for eligibility by applying the PICO (population, interventions, comparison, and outcomes) approach [40].
2.3. Inclusion and exclusion criteria
In this systematic review, there was no restriction on the age or gender of the patients in the studies. We included English language abstracts and full-text articles on HAIs reporting three types of infections as well as three most frequent microorganisms responsible for HAIs. We excluded articles, not in English. Review articles, editorials, case reports, qualitative studies, dissertations, as well as articles reporting the same information in a different format or Journal were also excluded. Studies lacking information about the types of infections were also excluded.
2.4. Quality assessment
The methodological quality of included articles was assessed independently by two investigators (ZS and FA). For quality assessment of included articles, Newcastle–Ottawa scale (NOS) was used [41–43]. This scale stratifies the methodological quality of papers into three subscales, i.e. selection, comparability, and outcomes. Differences in assessments were debated and agreed following a discussion with the review authors (MAH and IR).
2.5. Data extraction
A data extraction form was developed. The items on the data extraction form were finalized after discussion amongst members of the research team. Extracted data included the authors, region, world bank ranking, settings, PPS methodology and protocol, population type, study duration, infected patients, most frequent types of infections and most frequent three types of microorganisms. Retrieved publications were subsequently filtered using the study inclusion and exclusion criteria by two independent reviewers. Data were extracted from eligible articles by assessing titles, abstracts, and full-text articles.
2.6. Outcomes
The primary outcomes of this review were to assess the worldwide prevalence of HAIs and to identify the types of infections and microorganism isolated responsible for HAIs. Such knowledge can be used to initiate pertinent activities in hospitals to improve the future management of patients in hospitals to reduce the prevalence of HAIs. The HAI case definitions were adopted from ECDC protocol [13]. As a result, HAI was defined as ‘an infection occurring in a patient during the process of care in a hospital or other health-care facility which was not present or incubating at the time of admission’. For the purposes of this protocol, an infection was defined as active on the day of the survey when: signs and symptoms were present on the date of the survey; OR signs and symptoms were no longer present, but the patient was still receiving treatment for that infection on the date of the survey. An active infection was defined as healthcare-associated when: the onset of the signs and symptoms was on Day 3 of the current admission or later; OR the signs and symptoms of an active surgical site infection were present at admission or started before Day 3, and the surgical site infection occurred within 30 days of a surgical intervention.
3. Results
3.1. Literature research
The flow chart of the search and selection strategies of articles is illustrated in Figure 1. Through scientific and grey literature searches, after removal of duplicates (N = 87), a total of 1212 articles were screened for eligibility. After screening, 290 articles were eligible for detailed assessment and the remaining articles not fulfilling the inclusion criteria (N = 922) were excluded. Abstracts and full-text articles of 59 articles were not screened due to language restrictions; 87 articles did not provide sufficient data; 13 review articles were excluded and 64 articles did not mention the infection of interest. As a result, a total of 67 studies were subsequently included in the final analysis.
Figure 1.
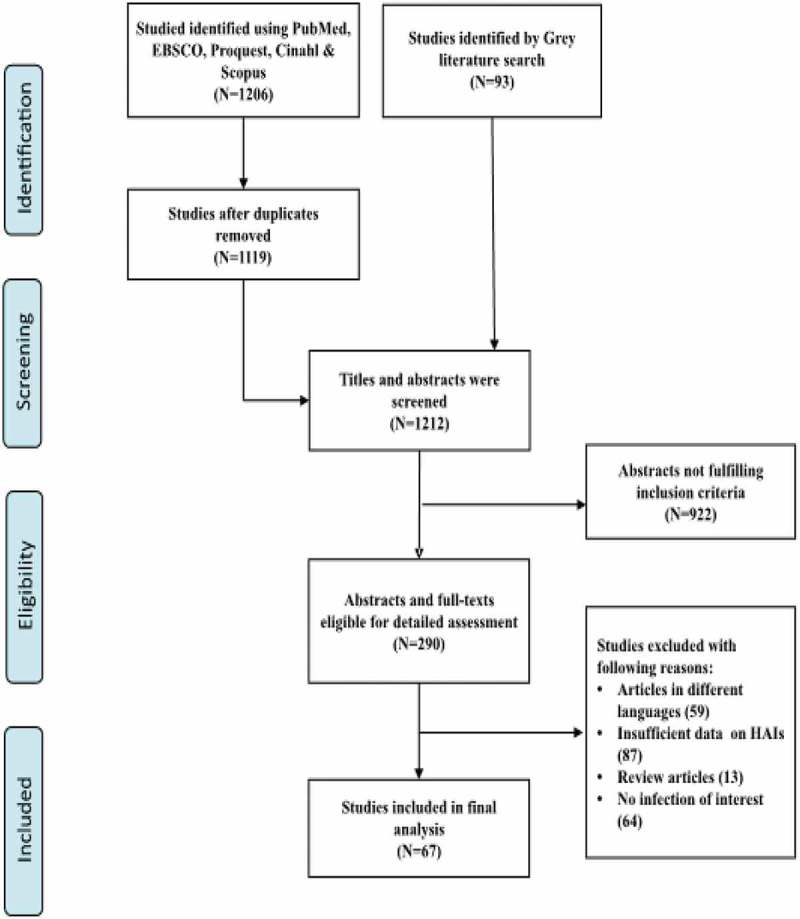
Flow chart and selection strategies of studies.
The abstracts of these 67 studies, as well as full-text articles of point prevalence surveys of HAIs in adults and mixed populations are summarized in Table 1, providing updated information on the type of infections and microorganisms. Table 2 summarizes the data on the pediatric population. Overall, 35 studies were conducted in Europe (33 studies on adults and 2 on pediatrics), 21 in Asia (19 studies on adults and 2 on pediatrics), 9 in America (5 studies on adults and 4 on pediatrics) and 2 in Africa (adults), all reporting the proportion of overall HAIs in a mixed population of patients [11–14,44–106]. The majority of point prevalence surveys were conducted in more than one hospital following the European Centre for Disease Control and Prevention (ECDC) protocol. Out of 21 studies conducted in Asia, six studies were undertaken in China [12,76,79,80,84,85].
Table 1.
Point prevalence surveys in mixed population.
| Continent and Countries | World Bank Classification | Author Name and Date | Settings | PPS Method | PPS Protocol | Study Duration | HAIs (%)* | Top Three Types of Infections (%)* | Top Three types of microorganisms (%) | ||||
|---|---|---|---|---|---|---|---|---|---|---|---|---|---|
| EUROPE | |||||||||||||
| Poland [44] | HI | Deptula et al., 2017 | 160 ICUs | Period | ECDC, EU-PPS & AU | 2012–2014 | 370/945 (39.1%) | Respiratory tract infections (45%) | Bloodstream infections (14%) | Surgical site infections (13%) | Acinetobacter baumannii (15.2%) | Pseudomonas aeruginosa (14.1%) | Klebsiella pneumoniae (14.1%) |
| Italy [45] | HI | Sticchi et al., 2017 | 18 hospitals | Period | ECDC | 22 March-22 April 2016 | 376/3647 (10.3%) | Respiratory tract infections (21.7%) | Urinary tract infections (20.1%) | Bloodstream infections (16.8%) | E. coli (18.2%) | Klebseilla pneumonia (13.4%) | Coagulase negative staphylococcus (12.5%) |
| Switzerland [46] | HI | Swissnoso, 2017 | 96 hospitals | Period | ECDC | April-May 2017 | 763/12931 (5.9%) | Surgical site infections (29.0%) | Lower respiratory tract infections (18.0%) | Urinary tract infections (15.0%) | Enterobacteriaceae (45.7%) | Gram positive cocci (36.6%) | Gram negative bacteria (5.5%) |
| Slovenia [47] | HI | Klavs et al., 2016 | 21 hospitals | One day | ECDC | October 2011 | 358/5628 (6.3%) | Upper respiratory tract infections (21.5%) | Pneumonia (21.0%) | Surgical site infection (18.4%) | - | - | - |
| Austria [48] | HI | Lusignani et al., 2016 | 9 hospitals | Period | ECDC | May- June 2012 | 268/4321 (6.2%) | Urinary tract infections (21.3%) | Pneumonia (20.6%) | Surgical site infections (17.4%) | E.coli (10.5%) | Enterococcus species (13.1%) | Pseudomonas aeroginosa (11.4%) |
| Ireland [49] | HI | Roche et al., 2016 | 24 LTCFs | Period | ECDC & HPSC | May 2013 | 46/1060 (4.3%) | Respiratory tract infections (35.0%) | Skin infections (35.0%) | Urinary tract infections (12.0%) | - | - | - |
| Slovakia [50] | HI | Stefkovicova et al., 2015 | 40 hospital | Period | ECDC | June 2012 | 298/8397 (3.5%) | Urinary tract infections (26.2%) | Surgical site infections (15.7%) | Blood stream infections (9.9%) | E.coli. (15.0%) | Klebsiella species (12.5%) | Pseudomonas aeroginosa (10.8%) |
| France [51] | HI | Milliani et al., 2015 | 4 HCS | Period | France National PPS | 14 May- 21 June 2012 | 403/5954 (6.8%) | Urinary tract infections (26.6%) | Skin and soft tissue infections (17.6%) | Surgical site infections (15.0%) | Enterobacteiaceae (41.0%) | Gram positive cocci (40.0%) | Stapgylococcus aureus (21.0%) |
| 19 Countries [53] | HI | Katrien et al., 2014 | 1181 LTCFs | Period | ECDC | April-May 2013 | 2626/77264 (3.4%) | Respiratory tract infections (31.2%) | Urinary tract infections (31.2%) | Skin infections (22.8%) | E. coli (34.4%) | Staphylococcus aureus (10.2%) | Proteus Mirabilis (8.1%) |
| 28 Countries [52] | HI | Katrien et al., 2014 | 722 LCTF | Period | ECDC | May- September 2010 | 2495/61932 (4.0%) | Respiratory tract infections (33.6%) | Urinary tract infections (22.3%) | Skin infections (21.4%) | E.coli (38.3%) | Staphylococcus aureus (13.5%) | Proteus mirabilis (9.9%) |
| 12 Countries [54] | HI | Erdam et al., 2014 | 88 ICUs | One day | CDC | Between June- July 2012/one day | 305/749 (40.7%) | Pneumonia (53.4%) | Bloodstream infections (18.3%) | Urinary tract infections (30.7%) | Gram negative bacilli (20.3%) | Acinetobacter species (15.4%) | Pseudomonas aeruginosa (9.5%) |
| Italy [55] | HI | Sinatra et al., 2013 | 3 departments | One day | ECDC | September 2011 | 12/328 (3.6%) | Blood stream infections (50.0%) | Urinary tract infections (28.5%) | - | - | - | - |
| Ireland [56] | HI | Smiddy et al., 2013 | 8 units | Period | Own | 2006–2009 | 23/754 (3.0%) | Bloodstream infections (25.0%) | Surgical site infections (25.0%) | Urinary tract infections (20.8%) | - | - | - |
| Germany [57] | HI | Behnke et al., 2013 | 132 hospitals | Period | ECDC | September- October 2011 | 2109/41539 (5.1%) | Surgical site infections (24.3%) | Urinary tract infections (23.2%) | Respiratory tract infections (21.7%) | E.coli (18.0%) | Enterococci (13.2%) | Staphylococcus aureus (13.1%) |
| 33 Countries [58] | HI | Carl Suetens et al., 2013 | 947 hospitals | Period | ECDC | 2011–2012 | 13829/231459 (5.9%) | Respiratory tract infections (23.5%) | Surgical site infections (19.6%) | Urinary tract infections (19.0%) | E. coli (15.9%) | Staphylococcus aureus (12.3%) | Enterococcus species (9.6%) |
| 23 Countries [13] | HI | Zarb et al., 2012 | 66 hospitals | Period | ECDC | May 2010- October 2010 | 1408/19888 (7.0%) | Pneumonia (25.7%) | Surgical site infections (18.9%) | Urinary tract infections (17.2%) | E. coli (15.2%) | Staphylococcus aureus (12.1%) | Pseudomonas aeroginosa (11.2%) |
| Germany [59] | HI | Heudorf et al., 2012 | 40 nursing homes | Period | HALT | January 5,- Mach 9, 2011 | 161/3732 (4.3%) | Urinary tract infections (28.0%) | Respiratory tract infections (25.5%) | Skin infections (15.5%) | - | - | - |
| London [60] | HI | Coello et al., 2011 | 5 hospitals | Period | ESAC | July 2009 | 104/1354 (7.7%) | Surgical site infections (18.2%) | Urinary tract infections (18.2%) | Bloodstream infections (14.0%) | - | - | - |
| France [61] | HI | Lietard et al., 2011 | 2337 healthcare facilities | One day | CDC | 2006 | 12182/199716 (6.1%) | Urinary tract infections (2.4%) | Pneumonia (2.4%) | Surgical site infections (0.8%) | E.coli (28%) | Staphylococcus aureus (18.2%) | Pseudomonas aeruginosa (9.5%) |
| Greece [62] | HI | Alexopoulos et al., 2011 | 6 hospitals | One day | CDC | December 2005- February 2006 | 64/2180 (2.9%) | Urinary tract infections (34.2%) | Lower respiratory tract infections (14.3%) | Bloodstream infections (14.3%) | E. coli (14.3%) | Pseudomonas areuginosa (10%) | Enterococcus species (8.6%) |
| England [63] | HI | Hopkins et al., 2011 | 103 organization | Period | ECDC | September-November 2011 | 3360/52443 (6.4%) | Respiratory tract infections (22.8%) | Urinary tract infections (17.2%) | Surgical site infections (15.7%) | Enterobacteriaciae (14.1%) | Staphylococcus aureus (6.7%) | Closridium difficile (5.4%) |
| Scotland [64] | HI | Cairns et al., 2011 | 45 hospital | Period | CDC | 2005–2006 | 1094/11090 (9.8%) | Urinary tract infections (17.9%) | Surgical site infections (15.7%) | Gastrointestinal infections (15.5%) | - | - | - |
| Scotland [65] | HI | Cairns et al., 2010 | 29 ICUs | Period | Own | October 2005-September 2006 | 35/129 (27.1%) | Lower respiratory tract infections (23.9%) | Surgical site infections (23.9%) | Pneumonia (19.5%) | - | - | - |
| Belgium [66] | HI | Gordts et al., 2010 | 63 hospitals | Period | CDC | October – November 2007 | 1037/17343 (5.9%) | Urinary tract infections (23.9%) | Lower respiratory tract infections (20.0%) | Surgical site infections (14.6%) | - | - | - |
| Italy [67] | HI | Lanini et al., 2009 | 51 hospitals | Period | CDC | 2002–2004 | 589/9609 (6.1%) | Lower respiratory tract infections (35.8%) | Urinary tract infections (23.6%) | Bloodstream infections (14.0%) | Gram negative bacteria (52.7%) | Gram positive bacteria (38.8%) | Fungi (5.0%) |
| 75 Countries [68] | HI | Vincet et al., 2009 | 1265 ICUs | One day | CDC | 2006–2007 | 7087/13796 (51.3%) | Respiratory tract infections (63.5%) | Abdominal infections (19.6%) | Bloodstream infections (15.0%) | Staphylococcus aureus (20.5%) | E .coli (16.0%) | Pseudomonas species (19.9%) |
| France [69] | HI | Patte et al., 2005 | Homecare Setting (HCS) | One day | Own | 5 June 2000 | 23/376 (6.1%) | Urinary Tract Infections (50.0%) | Skin Infections (37.9%) | - | E. coli (29.4%) | Staphylococcus aureus (29.4%) | Enterococcus species (17.6%) |
| Italy [70] | HI | Lizioli et al., 2003 | 88 hospitals | Period | Own | February-March 2000 | 916/18667 (4.9%) | Urinary tract infections (33.6%) | Pneumonia (22.6%) | Surgical site infections (15.0%) | E.coli (16.8%) | Staphylococcus aureus (15.0%) | Pseudomonas aeruginosa (13.2%) |
| Greece [71] | HI | Starakis et al., 2002 | 19 units | Period | CDC | 1998 and 1999 | 97/997 (9.7%) | Lower respiratory tract infections (36.0%) | Urinary tract infections (25.8%) | Bloodstream infections (19.6%) | Pseudomonas aeroginosa (20.6%) | Kelbsiella pneumonia (8.2%) | Staphylococcus (7.2%) |
| Greece [72] | HI | Gikas et al., 2002 | 14 hospitals | One day | CDC | 16 November 1999 | 337/3925 (8.6%) | Lower respiratory tract infections (30.3%) | Urinary tract infections (22.7%) | Bloodstream infections (15.8%) | Pseudomonas aeroginosa (16.6%) | E. coli (10.8%) | Klebsiella pneumoniae (10.3%) |
| France [73] | HI | Group et al., 2000 | 830 hospitals | Period | Own | May 20 – June 21 1996 | 15798/236334 (6.7%) | Urinary tract infections (0.19%) | Lower respiratory tract infections (0.07%) | Surgical site infections (0.06%) | E. coli (20%) | Staphylococcus aureus (16%) | Pseudomonas aeroginosa (11%) |
| Switzerland [74] | HI | Pittet et al., 1999 | 4 hospitals | One week | CDC | May 1996 | 156/1349 (11.6%) | Surgical site infections (30.0%) | Urinary tract infections (22.0%) | Respiratory tract infections (15.0%) | Enterobacteriaceae (28.0%) | Staphylococcus aureus (13.0%) | Pseudomonas aeruginosa (11.0%) |
| 17 Countries [75] | HI | Vincent et al., 1995 | 1417 ICUs | One day | Own | April 28–29 April 1992 | 4501/10038 (44.8%) | Pneumonia (46.9%) | Lower respiratory tract infections (17.8%) | Urinary tract infections (17.6%) | Enterobacteriaceae (34.4%) | Staphylococcus aureus (30.1%) | Pseudomonas aeroginosa (28.7%) |
| ASIA | |||||||||||||
| China [76] | UMI | Chen et al., 2017 | 52 hospitals | One day | NHFPC | October 2014-March 2015 | 1998/53939 (3.7%) | Lower respiratory tract infections (47.2%) | Urinary tract infections (12.3%) | Upper respiratory tract infections (11.0%) | Pseudomonas aeroginosa (9.4%) | AcinetobacterBaumanni (7.9%) | Klebsiellapnuemoniae (7.3%) |
| India [77] | LMI | Nair et al., 2017 | 1 hospital | Period | CDC | March 2014-August 2014 | 71/1886 (3.7%) | Surgical site infections (23.9%) | Pneumonia (18.3%) | Upper respiratory tract infections (16.9%) | - | - | - |
| Singapore [78] | HI | Cai et al., 2017 | 13 hospitals | Period | ECDC | July 2015- February 2016 | 646/5415 (11.9%) | Clinical sepsis (25.5%) | Pneumonia (24.8%) | - | Staphylococcus aureus (12.9%) | Pseudomonas aeroginosa (11.5%) | - |
| China [79] | UMI | Liu et al., 2016 | 124 hospitals | One day | BNICC | May 2014 | 1294/61990 (2.0%) | Urinary tract infections (15.0%) | Gastrointestinal infections (7.7%) | Surgical site infections (6.3%) | Pseudomonas aeruginosa (13.8%) | Acinetobacterbaumannii (12.9%) | E.Coli (12.6%) |
| China [80] | UMI | Zhang et al., 2016 | 43 clinical departments | Period | CDC | May 2012-May 2014 | 147/4029 (3.6%) | Respiratory tract infections (54.8%) | Urinary tract infections (21.4%) | Blood stream infections (7.1%) | Gram negative bacteria (67.1%) | Gram positive bacteria (20.3%) | Fungi (10.5%) |
| Vietnam [81] | LMI | Phu et al., 2016 | 14 ICUs | One day each month | ECDC | October 2012- October 2013 | 965/3266 (29.5%) | Lower respiratory tract infections and pneumonia (79.4%) | Bloodstream infections (4.4%) | Surgical site infections (4.2%) | Acinetobacter baumannii (24.4%) | Pseudomonas aeroginosa (13.8%) | Klebsiella pneumoniae (11.6%) |
| Japan [82] | HI | Morioka et al., 2015 | 1 Hospital | One day | ECDC | 3 July 2014 | 85/841 (10.1%) | Pneumonia (20.0%) | Surgical site infections (19.0%) | Blood stream infections (11.1%) | Enterobacteriaceae (27.6%) | Staphylococcus aureus (15.5%) | Enterococcuss (10.3%) |
| India [83] | LMI | Kumar et al., 2014 | 1 Hospital | One day | CDC | 2008 and 2011 | 125/1834 (6.8%) | Surgical site infections (33.0%) | Upper respiratory tract infections (26.0%) | Pneumonia (24.0%) | Klebsiella pneumonia (15.0%) | Pseudomonas aeruginosa (15.0%) | Acinetobactercalcobaumanni (2.4%) |
| China [84] | UMI | Tao et al., 2014 | 48 wards | One day | US CDC | November 13,2013 | 86/2434 (3.5%) | Respiratory tract infections (49.4%) | Surgical Site infections (22.9%) | Gastrointestinal infections (9.2%) | Pseudomonas aeruginosa (24.0%) | Klebseilla pneumonia (14.0%) | E. coli (14.0%) |
| China [85] | UMI | Xie et al., 2013 | 5 departments | Period | NISS | 2007–2011 | 287/9533 (3.0%) | Respiratory tract infections (74.1%) | Urinary tract infections (8.9%) | Surgical site infections (5.9%) | Pseudomonas aeruginosa (10.4%) | E.coli (5.9%) | Acinetobacter baumannii (5.9%) |
| Iran [86] | UMI | Askarian et al., 2012 | 8 hospitals | Period | NNIS | 2008–2009 | 323/3450 (9.4%) | Bloodstream infections (26.6%) | Surgical site infections (25.7%) | Urinary tract infections (14.9%) | - | - | - |
| Vietnam [87] | LMI | Thu et al., 2011 | 36 hospitals | Period | CDC | February 2008- December 2009 | 553/7571 (7.3%) | Pneumonia (41.9%) | Surgical site infections (27.5%) | - | Pseudomonas aeruginosa (31.5%) | Acinetobacterbaumannii (23.3%) | - |
| Mongolia [88] | LMI | Ider et al., 2010 | 2 hospitals | One day | US CDC | September 2008 | 50/933 (5.3%) | Respiratory tract infections (24%) | Urinary tract infections (20%) | Surgical site infections (20%) | - | - | - |
| China [12] | UMI | Xie et al., 2010 | 13 hospitals | Period | CDC | November, 2007-November, 2008 | 790/20350 (3.9%) | Respiratory tract infections (63.1%) | Surgical site infections (9.6%) | Urinary tract infections (8.6%) | Pseudomonas aeruginosa (16.4%) | E.coli (10.5%) | Klebsiella pneumoniae (7.9%) |
| Hong Kong [89] | HI | Lee et al., 2007 | 1 hospital | One day | CDC | September 7,2005 | 41/1021 (4.0%) | Pneumonia (33%) | Surgical site infections (26.2%) | Bloodstream infections (21.4%) | Pseudomonas aeroginosa (N/A) | Staphylococcus aureus (N/A) | - |
| Saudi Arabia [90] | HI | Balkhy et al., 2006 | 7 units | One day | Own | May 2003 | 38/562 (6.7%) | Bloodstream infections (31.1%) | Ventilator acquired pneumonia (28.9%) | Urinary tract infections (24.4%) | Pseudomonas species (20.9%) | Enterococcuss species (18.9%) | Klebsiella pneumoniae (13.7%) |
| Thailand [91] | LMI | Danchaivijitret al., 2005 | 42 hospitals | Two week | Own | March 12- March 25 2001 | 1181/18456 (6.4%) | Lower respiratory tract infections (34.0%) | Urinary tract infections (21.5%) | Surgical site infections (15.0%) | Pseudomonas aeruginosa (19.8%) | Klebsiella pneumonia (13.5%) | Acinetobacter species (13.0%) |
| Malaysia [92] | UMI | Hughes et al., 2005 | 5 clinical departments | Period | CDC | July 16–17, 2001 | 75/538 (13.9%) | Clinical sepsis (22.4%) | Pneumonia (21.4%) | Urinary tract infections (12.2%) | Pseudomonas aeruginosa (17.4%) | MRSA (15.5%) | MSSA (8.7%) |
| Turkey [93] | UMI | Esen et al., 2004 | 56 ICUs | One day | CDC | 19 September 2001 | 115/236 (48.7%) | Pneumonia (28.0%) | Blood stream infections (23.3%) | Urinary tract infections (15.7%) | Pseudomonas aeroginosa (20.8%) | Staphylococcus aureus (18.2%) | Acinetobacter species (18.2%) |
| AMERICAs | |||||||||||||
| Canada [106] | HI | Taylor et al., 2016 | 49 hospitals | One day | NHSN | February 2009 | 1173/9953 (11.7%) | Urinary tract infections (34.8%) | Pneumonia (21.8%) | Surgical site Infections (17.4%) | - | - | - |
| Florida [95] | HI | Magill et al., 2012 | 9 hospitals | One day | NHSN | August 2009 | 51/851 (6.0%) | Surgical site infections (31.0%) | Pneumonia (15.5%) | Urinary tract infections (15.5%) | Staphylococcus aureus (15.5%) | Candida species (10.3%) | Pseudomonas aeruginosa (8.6%) |
| USA [96] | HI | Magill et al., 2014 | 183 hospitals | One day | NHSN | May-September 2011 | 452/11282 (4.0%) | Pneumonia (21.8%) | Surgical site infections (21.8%) | Gastrointestinal infections (17.1%) | Clostridium difficile (12.1%) | Staphylococcus aureus (10.7%) | Klebsiella pneumonia (9.9%) |
| Canada [97] | HI | Gravel et al., 2007 | 25 hospitals | Period | CDC | February 5 – February 8 2001 | 601/5750 (10.4%) | Urinary tract infections (3.4%) | Pneumonia (3.0%) | Surgical site infections (2.5%) | Coagulase negative staphylococcus (N/A) | Gram negative bacteria (N/A) | Gram positive bacteria (N/A) |
| Brazil [98] | UMI | Rezende et al., 1998 | 11 hospitals | Period | CDC & NNIS | August – October 1992 | 267/2339 (11.4%) | Pneumonia (19.5%) | Surgical site infections (19.2%) | Urinary tract infections (13.1%) | Staphylococcus aureus (21.6%) | E.coli (21.6%) | Pseudomonas species (12.5%) |
| AFRICA | |||||||||||||
| Ethiopia [99] | LI | Yallew et al., 2016 | 2 hospitals | Period | CDC | March- July 2015 | 135/908 (14.8%) | Surgical site infections (51.1%) | Pneumonia (25.0%) | Blood stream infections (19.0%) | Klebseilla species (22.4%) | Staphylococcus aureus (20.4%) | Pseudomonas aeruginosa (18.3%) |
| Tunisia [100] | LMI | Kallel et al., 2005 | 15 departments | One day | Own | April 17-april 18 2002 | 50/280 (14.3%) | Pneumonia (32.0%) | Surgical site infections (28.0%) | Urinary tract infections (20.0%) | Klebsiella pneumoniae (23.1%) | Pseudomonas aeroginosa (19.2%) | Acinetobacterbaumannii (15.4%) |
*Percentages of total infections, E.coli = Escherichia coli, N/A = Not Available, LMI = low middle income and low-income country, HI = High-Income country, UMI = Upper middle-income country, CDC = Centre for Disease Prevention and Control, ECDC = European Centre for Disease Prevention and Control, NHSN = National Healthcare Safety Network, HELICS = Hospital in Europe Link for Infection Control through Surveillance, EU-PPS-AU = Europe Union Point Prevalence Surveys and Antibiotic Use Protocol, HPSC = Health Protection Surveillance Centre, HALT = Health-care-associated infections in Long Term care Facilities project, ESAC = European Surveillance of Antibiotic consumption, NHFPC = National Health and Family Planning Commission Centre, BNICC = Beijing Nosocomial infection Surveillance system,
Table 2.
Point prevalence surveys in pediatrics.
| Continent and Countries | World Bank Classification | Author Name and Date | Settings | PPS Method | PPS Protocol | Study Duration | HAIs (%)* | Top Three Types of Infections (%)* | Top Three types of microorganisms (%) | ||||
|---|---|---|---|---|---|---|---|---|---|---|---|---|---|
| EUROPE | |||||||||||||
| 29 Countries [101] | HI | Zingget al., 2017 | 1149 hospitals | Period | ECDC | May 2011-November 2012 | 726/17273 (4.2%) | Bloodstream infections (45%) | Lower respiratory infections (22.0%) | Gastronintestinal infection (8.0%) | Enterobacteriacea (15.0%) | - | - |
| Russia [102] | UMI | Hajdu et al., 2007 | 1 hospital | One day | HELICS | February 2006 | 60/395 (15.1%) | Upper respiratory tract infections (45.0%) | Lower respiratory tract infections (19.0%) | Urinary tract infections (12.0%) | - | - | - |
| ASIA | |||||||||||||
| Vietnam [103] | LMI | Le et al., 2016 | ICUs | One day/once in a month | ECDC | October 2012- September 2013 | 454/1363 (33.3%) | Pneumonia (65.2%) | Blood stream infections (26.1%) | Surgical site infections (2.0%) | Klebseilla pneumonia (19.0%) | Pseudomonas species (18.0%) | Acinetobacter species (15.0%) |
| Turkey [14] | UMI | Kepenekliet al., 2015 | 50 ICUs | One day | CDC | September 2012 | 122/327 (37.3%) | Lower respiratory tract infections (55.3%) | Blood stream infections (27.3%) | Urinary tract infections (7.1%) | Pseudomonas aeruginosa (24.0%) | Acinetobacter species (15.0%) | Candida species (7.0%) |
| AMERICA | |||||||||||||
| Canada [94] | HI | Rutledge-Taylor et al., 2012 | 30 hospitals | One day | CDC | 3 February 2009 | 118/1353 (8.7%) | Bloodstream infections (30.6%) | Pneumonia (16.1%) | Viral gastroenteritis (13.7%) | Coagulase negative staphylococcus (47.4%) | Pseudomonas aeroginosa (35.0%) | Candida species (30.8%) |
| Canada [11] | HI | Gravel et al., 2007 | 25 hospitals | One day | CNISP | February 5 – February 8 2001 | 80/997 (8.0%) | Blood stream infections (37.5%) | Pneumonia (26.2%) | Urinary tract infections (12.5%) | Coagulase negative staphylococcus (NA) | Gram negative bacteria (NA) | Gram positive bacteria (NA) |
| US [104] | HI | Grohskopfet al., 2002 | 31 hospitals | One day | Own | August 1999 | 61/512 (11.9%) | Bloodstream infections (41.3%) | Respiratory tract infections (22.6%) | Urinary tract infections (13.3%) | Coagulase negative staphylococcus (19.5%) | Enterococcus (12.2%) | Staphylococcus aureus (11.0%) |
| US [105] | HI | Sohn et al., 2001 | 29 Neonatal intensive care units | One day | Own | 9 August 2000 | 94/827 (11.3%) | Bloodstream infections (52.6%) | Respiratory tract infections (12.9%) | Urinary tract infections (8.6%) | Coagulase negative staphylococcus (31.6%) | Enterococci (10.3%) | E.coli (8.5%) |
*Percentages of total infections, E.coli = Escherichia coli, N/A = Not Available, LMI = low and low middle-income country, HI = High-Income country, UMI = Upper middle-income country, CDC = Centre for Disease Prevention and Control, ECDC = European Centre for Disease Prevention and Control, HELICS = Hospital in Europe Link for Infection Control through Surveillance, CNISP = Canadian Nosocomial Infection Surveillance Programs
HAIs showed a higher prevalence in intensive care units compared to other wards. The highest prevalence of HAIs was recorded in a study conducted in adult ICU settings among 75 regions of Europe (51.3%) [68]. In Asian countries, a study conducted in Turkey reported the highest prevalence rate of HAIs (48.7%) in ICU patients [93]. Whereas in case of complete hospital survey, the highest burden of HAIs was observed in one pediatric hospital of Russia (15.1%), followed by Ethiopia (14.8%) and Tunisia (14.3%). The HAI prevalence rate was 11.7% in North America [99,106]. Gravel et al. performed a PPS among adult and pediatric patients separately in Canada showing a slightly higher prevalence rate of HAIs (10.4%) among adults in comparison to pediatric patients (8.0%) [11,97]. A point prevalence study conducted in Ireland reported a higher HAI prevalence rate (4.3%) in long-term care facilities [49]. The lowest burden of HAIs was seen in a study conducted in six hospitals in Greece (2.9%).
3.2. Comparison of HAIs in HI and LMICs
Of the 67 selected studies, 46 studies were undertaken in high-income countries (HIs), 12 studies in upper middle-income countries (UMICs), 8 studies were conducted in LMICs and only one study in low-income countries (LICs) [11–14,44–106]. All point prevalence surveys of HAIs in HIs have been published since 1995. 41 of 46 studies reported a prevalence rate of <20. In LMICs, point prevalence surveys of HAIs have been published since 2005. Of eight studies, five studies reported a prevalence rate of <10% and all except one reported prevalence rate of >20%. ICU acquired infections are the most common and leading HAIs hospital-wide. In LMICs, the prevalence rate of HAIs in ICU admitted patients is <35% while in HIs the prevalence of HAIs exceeds 50% [65,68,75,81,103]. In our findings, the frequency of surgical site infections was significantly higher in LMICs when compared with the studies conducted in HIs [44,61,73,83]. Acinetobacter species were responsible for HAIs in LMICs [81,83,87]. In HIs, E. coli appeared to be the major cause of HAIs [13,45,48,52,57].
3.3. Types of infections and microorganisms isolated in among pediatric patients
The majority of published studies emphasized more than one site of infection. Regarding the types of infections, the majority of studies included data on urinary tract infections, respiratory tract infections, bloodstream infections, and surgical site infections. Among European countries, blood-stream infections (52.6%) were one of the commonest types of infections among pediatric patient, followed by upper respiratory tract infections (45.0%) [102,105]. Blood-stream infections (30.6%) in North America and pneumonia (65.2%) in Asia were the most frequent infections among pediatric patients [94,103]. In the United States, coagulase-negative Staphylococcus (31.6% and 19.5%) was the major cause of HAIs, followed by Enterococcus species (10.3% and 12.2%) [104,105]. Klebsiella pneumonia, Pseudomonasaeroginosa,andAcinetobacter species were the most frequent pathogens responsible for HAIs among Asian countries [14,103].
3.4. Types of infections and microorganisms isolated in adults
In Africa, surgical site infections (51.1%) were the most frequent type of infection [99]. In Vietnam, there were high-reported rates of lower respiratory tract infections in adults (79.4%), whereas in Italy reported high rates of bloodstream infections (50.0%) [55,81]. Respiratory tract infections were the most frequent type of infections in patients admitted to ICUs (63.5%) and in patients admitted to long-term care facilities in Ireland (35.0%) [49,68].
More than half of the HAIs infections are caused by gram-negative bacteria. Gram-negative pathogens such as Klebsiella pneumoniae, Pseudomonas aeruginosa, E. coli, and Acinetobacter species were the most frequently reported pathogens. Gram-positive pathogens such as Staphylococcus aureus and clostridium difficile were also included in these studies. Staphylococcus aureus, Pseudomonas aeroginosa, and Klebsiella species were the major cause of HAIs in Africa (20.4%, 18.3%, and 22.4%) and South America the (21.6%, 12.5% and 19.2%) [98,99]. Gram-negative bacteria were responsible for the different types of healthcare-associated infections in European countries (52.7%) as well as in Asian countries (67.1%) [67,80]. In ICUs patients, AcinetobacterBaumannii (24.4%) was the most common pathogen responsible for HAIs [81]. Other publications reporting types of infections as well as types of microorganism are listed in Tables 1 and 2.
3.5. Quality assessment
The maximum of 10 stars is awarded to a study. We considered study a high quality when scored ≥7, a medium quality scored 5–6, and a low quality scored 0–4. The stars that were awarded to studies ranged from six to nine, and the average value was 7.7 (Table 3). Most of the studies used the ECDC protocol as a validated measurement tool to assess the prevalence of HAIs. Independent blind assessment was done in all studies.
Table 3.
Quality assessment of included articles.
| Selection |
Comparability |
Outcomes |
||||||
|---|---|---|---|---|---|---|---|---|
| Studies | Representatives of sampleA | Sample sizeB | Non-respondentsC | Ascertainment of exposureD | Based on design and analysisE | Assessment of outcomesF | Statistical testG | Quality score |
| Deptula et al., 2017 [44] | * | * | - | * | ** | ** | * | 8 |
| Sticchi et al., 2017 [45] | * | * | - | * | ** | ** | * | 8 |
| Swissnoso, 2017 [46] | * | * | - | * | ** | ** | * | 8 |
| Klavs et al., 2016 [47] | * | * | - | ** | * | ** | * | 8 |
| Lusignani et al., 2016 [48] | * | * | - | * | ** | ** | - | 7 |
| Roche et al., 2016 [49] | * | * | - | * | * | ** | - | 6 |
| Stefkovicova et al., 2015 [50] | * | * | - | * | ** | ** | - | 7 |
| Milliani et al., 2015 [51] | * | * | - | * | ** | ** | * | 8 |
| Katrien et al., 2014 [53] | * | * | - | ** | ** | ** | - | 8 |
| Katrien et al., 2014 [52] | * | * | - | ** | ** | ** | * | 9 |
| Erdam et al., 2014 [54] | * | * | - | * | ** | ** | * | 8 |
| Sinatra et al., 2013 [55] | * | * | - | * | * | ** | * | 7 |
| Smiddy et al., 2013 [56] | * | * | - | * | * | ** | * | 7 |
| Behnke et al., 2013 [57] | * | * | - | ** | ** | ** | * | 9 |
| Carl Suetens et al., 2013 [58] | * | * | - | ** | ** | ** | * | 9 |
| Zarb et al., 2012 [13] | * | * | - | * | ** | ** | * | 8 |
| Heudorf et al., 2012 [59] | * | * | - | * | * | ** | * | 7 |
| Coello et al., 2011 [60] | * | * | - | * | * | ** | - | 6 |
| Lietard et al., 2011 [61] | * | * | - | * | ** | ** | - | 7 |
| Alexopoulos et al., 2011 [62] | * | * | - | * | ** | ** | - | 7 |
| Hopkins et al., 2011 [63] | * | * | - | * | ** | ** | * | 8 |
| Cairns et al., 2011 [64] | * | * | - | * | * | ** | * | 7 |
| Cairns et al., 2010 [65] | * | * | - | * | * | ** | * | 7 |
| Gordts et al., 2010 [66] | * | * | - | ** | * | ** | * | 8 |
| Lanini et al., 2009 [67] | * | * | - | * | ** | ** | * | 8 |
| Vincet et al., 2009 [68] | * | * | - | * | ** | ** | * | 8 |
| Patte et al., 2005 [69] | * | * | - | * | * | ** | * | 7 |
| Lizioli et al., 2003 [70] | * | * | - | * | ** | ** | - | 7 |
| Starakis et al., 2002 [71] | * | * | - | * | ** | ** | - | 7 |
| Gikas et al., 2002 [72] | * | * | - | ** | * | ** | * | 9 |
| Group et al., 2000 [73] | * | * | - | ** | ** | ** | * | 9 |
| Pittet et al., 1999 [74] | * | * | - | ** | ** | ** | * | 9 |
| Vincent et al., 1995 [75] | * | * | - | ** | ** | ** | - | 8 |
| Chen et al., 2017 [76] | * | * | - | * | ** | ** | * | 8 |
| Nair et al., 2017 [77] | * | * | - | ** | * | ** | * | 8 |
| Cai et al., 2017 [78] | * | * | - | * | * | ** | * | 7 |
| Liu et al., 2016 [79] | * | * | - | ** | ** | ** | * | 9 |
| Zhang et al., 2016 [80] | * | * | - | * | ** | ** | * | 8 |
| Phu et al., 2016 [81] | * | * | - | * | ** | ** | * | 8 |
| Morioka et al., 2015 [82] | * | * | - | ** | ** | ** | * | 9 |
| Kumar et al., 2014 [83] | * | * | - | * | ** | ** | - | 7 |
| Tao et al., 2014 [84] | * | * | - | ** | ** | ** | * | 9 |
| Xie et al., 2013 [85] | * | * | - | * | ** | ** | * | 8 |
| Askarian et al., 2012 [86] | * | * | - | * | * | ** | * | 7 |
| Thu et al., 2011 [87] | * | * | - | ** | * | ** | * | 8 |
| Ider et al., 2010 [88] | * | * | - | * | * | ** | * | 7 |
| Xie et al., 2010 [12] | * | * | - | * | ** | ** | * | 8 |
| Lee et al., 2007 [89] | * | * | - | * | * | ** | * | 7 |
| Balkhy et al., 2006 [90] | * | * | - | * | ** | ** | * | 8 |
| Danchaivijitret al., 2005 [91] | * | * | - | * | ** | ** | - | 7 |
| Hughes et al., 2005 [92] | * | * | - | ** | ** | ** | * | 9 |
| Esen et al., 2004 [93] | * | * | - | * | ** | ** | * | 8 |
| Taylor et al., 2016 [106] | * | * | - | * | * | ** | * | 7 |
| Magill et al., 2012 [95] | * | * | - | * | ** | ** | * | 8 |
| Magill et al., 2014 [96] | * | * | - | * | ** | ** | * | 8 |
| Gravel et al., 2007 [97] | * | * | - | * | ** | ** | * | 8 |
| Rezende et al., 1998 [98] | * | * | - | * | ** | ** | * | 8 |
| Yallew et al., 2016 [99] | * | * | - | ** | ** | ** | * | 9 |
| Kallel et al., 2005 [100] | * | * | - | * | ** | ** | * | 8 |
| Zingg et al., 2017 [101] | * | * | - | * | * | ** | * | 7 |
| Hajdu et al., 2007 [102] | * | * | - | * | * | ** | * | 7 |
| Le et al., 2016 [103] | * | * | - | * | ** | ** | * | 8 |
| Kepenekli et al., 2015 [14] | * | * | - | * | ** | ** | * | 8 |
| Rutledge-Taylor et al., 2012 [94] | * | * | - | * | ** | ** | * | 8 |
| Gravel et al., 2007 [11] | * | * | - | * | ** | ** | * | 8 |
| Grohskopf et al., 2002 [104] | * | * | - | * | ** | ** | * | 8 |
| Sohn et al., 2001 [105] | * | * | - | * | ** | ** | * | 8 |
A: * = truly representative of average in target population or somewhat representative of average in target population
B: * = justified or satisfactory, – = not justified
C: * = satisfactory response rate, – = unsatisfactory or no description
D: ** = validated measurement tool, * = nonvalidated measurement tool, – = no description of measurement tool
E: ** = confounding factors, *incomplete information, – = no information
F: ** = independent-blinded assessment or record linkage, * = self-report, – = no description
G: * = Yes, – = No
4. Discussion
Healthcare-associated infections are among the most serious public health issues with substantial morbidity, mortality, and costs [3,20,107,108]. We subsequently systematically reviewed 67 studies reporting the proportion of overall HAIs in mixed patient populations. The selected studies conducted in various health-care settings provide baseline information in order to develop future intervention research. Because of multi-factorial features of HAIs, health-care settings are challenging domains in order to identify the various types of infections and microorganisms, especially in LMICs. Most of the studies were conducted in Europe and Asia. Two studies were conducted in Africa, one in Ethiopia and one in Tunisia. Previous literature surveys reported that HAIs remained a public health problem in LMICs compared with developed countries [29]. However, to date, limited studies regarding PPS of HAIs have been performed in LMICs because of lack of national surveillance systems. The main reasons for this may include a lack of human and financial resources, the absence of expertise in the interpretation of the data, the paucity of reliable diagnostic procedures, the scarcity of data obtained from patient records and the absence of software used for surveillance of HAIs [17].
In Canada, Denis et al. conducted prevalence surveys in both adults and pediatric settings with reportedly a high prevalence rate of HAIs in adults than in pediatric patients. One of the studies reported a 3–20 times higher neonatal infection rate in developing countries compared to developed countries [28]. Rezende and colleagues performed a prevalence survey in Brazil and reported 11.4% prevalence of HAIs, requiring inter-institutional efforts so that appropriate measures could be taken. The frequency of endemic HAIs in neonatal ICUs in a few regions, for example Brazil is 9 times higher than in the USA [29]. The higher heterogeneity in the prevalence data may be due to the different study designs and the selection of participants, e.g., study populations, races, and sample sizes, among the reviewed studies. According to the WHO, the pooled prevalence of HAIs in LMICs was 10.1%, while in HIs the pooled prevalence of HAIs was 7.6% [34]. Due to insufficient data or lack of resources in LMICs, the pooled prevalence of HAIs was significantly higher in LMICs than in HIs.
Our findings indicated that lower respiratory tract infections are the leading HAIs followed by urinary tract infections, surgical site infections and bloodstream infections in most of the selected studies. A study performed in Australia reported high rates of illness from acute as well as chronic respiratory tract infections in the indigenous pediatric population [109]. This is important as pneumonia is the most frequent lower respiratory tract infection and a leading cause of death [110]. A study conducted in Ethiopia has reported high rates of surgical site infections. Surgical site infection leads to a prolonged hospital stay and increased costs of therapy [111]. In our findings, surgical site infections were the most frequent type of HAI in LMICs. This is similar to Allegranzi and his colleagues and the WHO who also reported surgical site infection as the most common type of HAI [17,34]. Surgery and invasive procedures were among the significant risk factors responsible for surgical site infections (SSIs) [112]. To address concerns, the WHO have published their guidelines to ensure surgical patient’s safety which includes a safety checklist to reduce mortality from SSIs [113].
The evaluation of microbiological patterns of HAIs was based on isolates of the three most frequent microorganisms. Gram-negative bacteria were reported as the principal causative pathogens in Europe and Asia [48,57,70,80,91,93]. Our results reported that Staphylococcus aureus, Pseudomonas aeroginosa, and Klebsiella species were the most frequent pathogens in Africa and South America [99]. This is similar to a review in Africa where Klebsiella, Staphylococcus aureus, Pseudomonas aeroginosa, and E coli were the most common organisms associated with healthcare-associated infections [114]. Six point prevalence studies conducted in China reported Pseudomonas aeruginosa as the leading cause of healthcare-associated infections [12,76,79,80,84,85].
Overall, we believe our data provides significant information to guide policy makers to identify risk factors of HAIs and to devise prior strategies to reduce HAIs. In order to detect trends of HAIs, additional point prevalence surveys are needed, with the findings directing quality improvement programs in hospitals. As part of this, proper instruction should be given to patients to identify and report signs and symptoms of HAIs. This intervention may help in the identification of HAIs during their hospital stay and after discharge. Moreover, prioritization of resources may help to prevent HAIs and improve patient’s safety once specific activities have been identified [115]. Overall, patient participation is considered as an integral part of reducing medical error and improving patient’s safety [116]. We are aware that there will be different challenges to reduce HAIs between HIs and LMICs in line with the challenges to introduce effective antimicrobial stewardship programs in LMICs and HIs [117]. This is especially given the current lack of AMS programs among a number of LMICs [118,119]. Consequently, quality improvement programs to reduce future HAIs must be tailored to the given country and situation.
Our study has limitations that should be kept in mind when elucidating data from selected studies. The current systematic review utilized five databases with specific emphasis on terms describing point prevalence surveys of healthcare-associated infections and hospital-acquired infections. Limited grey literature searches were also performed using additional search terms that identified relevant articles. As a result, some relevant articles may have been missed. Moreover, only English language studies were retrieved resulting in the exclusion of studies in other languages. In some studies, available information was not explained enough such as lack of information on microorganisms. In other studies, the analysis performed by the authors was a mixture of HAI prevalence data on both intensive and acute care units. Considering higher HAI prevalence rates in intensive care units, it could influence the differences in results. Another limitation is that lower reported HA prevalence does not necessarily or even often mean lower true prevalence rates – overall diagnostic capabilities and reporting culture can play a surprisingly large role between countries and cultures, leading to large differences which can be misinterpreted. The difference in the quality of different countries’ health-care systems and the definitions of infections had also a discernible influence on the systematic review. Lastly, we had divided studies into adults and pediatric population by considering the total hospital population as adults. However, despite these limitations, we believe our findings are robust providing direction to others.
5. Conclusion
The current systematic review provides an updated synthesis of literature concerning the overall burden of HAIs. These findings reported the existence of multiple pathogens responsible for health-care-associated infections in a variety of health-care settings. Based on this literature review, standardized surveillance systems, infection prevention, and control programs, multidisciplinary teams, instigation of antibiotic stewardship programs, as well as the raising of awareness among medical staff and policymakers regarding HAIs and ways to prevent these may be effective strategies to minimize the future risk of HAIs. We recommend that more point prevalence surveys should be conducted in order to identify and target scarce resources for the prevention of future HAIs in all countries especially LMICs building on ongoing activities in these countries.
Funding Statement
This research did not receive any specific grant from funding agencies in the public, commercial, or not-for-profit sectors.
Disclosure statement
No potential conflict of interest was reported by the authors.
References
- [1].Stone PW, Braccia D, Larson E.. Systematic review of economic analyses of health care-associated infections. Am J Infect Control. 2005;33(9):501–509. [DOI] [PubMed] [Google Scholar]
- [2].Burke JP. Infection control–a problem for patient safety. N Engl J Med. 2003;348(7):651. [DOI] [PubMed] [Google Scholar]
- [3].Manoukian S, Stewart S, Dancer S, et al. Estimating excess length of stay due to healthcare-associated infections: a systematic review and meta-analysis of statistical methodology. J Hosp Infect. 2018;100:222–235. [DOI] [PubMed] [Google Scholar]
- [4].Irek EO, Amupitan AA, Obadare TO, et al. A systematic review of healthcare-associated infections in Africa: an antimicrobial resistance perspective. Afr J Lab Med. 2018;7(2):796. [DOI] [PMC free article] [PubMed] [Google Scholar]
- [5].WHO W.H.O., Health Care-associated infections. FACT SHEET. 2014.
- [6].Haley RW, Culver DH, White JW, et al. The efficacy oe infection surveillance and control programs in preventing nosocomial infections in us hospitals. Am J Epidemiol. 1985;121(2):182–205. [DOI] [PubMed] [Google Scholar]
- [7].Morton A. Hospital safety and hospital acquired infection. Healthcare Infect. 2006;11(1):3–5. [Google Scholar]
- [8].Reilly J, Stewart S, Allardice G, et al. Evidence-based infection control planning based on national healthcare-associated infection prevalence data. Infect Control Hosp Epidemiol. 2009;30(2):187–189. [DOI] [PubMed] [Google Scholar]
- [9].Talaat M, El-Shokry M, El-Kholy J, et al. National surveillance of health care–associated infections in Egypt: developing a sustainable program in a resource-limited country. Am J Infect Control. 2016;44(11):1296–1301. [DOI] [PubMed] [Google Scholar]
- [10].Zingg W, Huttner BD, Sax H, et al. Assessing the burden of healthcare-associated infections through prevalence studies: what is the best method? 1. Infect Control Hosp Epidemiol. 2014;35(6):674–684. [DOI] [PubMed] [Google Scholar]
- [11].Gravel D, Matlow A, Ofner-Agostini M, et al. A point prevalence survey of health care–associated infections in pediatric populations in major Canadian acute care hospitals. Am J Infect Control. 2007;35(3):157–162. [DOI] [PubMed] [Google Scholar]
- [12].Xie D-S, Xiong W, Xiang -L-L, et al. Point prevalence surveys of healthcare-associated infection in 13 hospitals in Hubei Province, China, 2007–2008. J Hosp Infect. 2010;76(2):150–155. [DOI] [PubMed] [Google Scholar]
- [13].Zarb P, Coignard B, Griskeviciene J, et al. The European Centre for Disease Prevention and Control (ECDC) pilot point prevalence survey of healthcare-associated infections and antimicrobial use. Euro Surveill. 2012;17(46):20316. [DOI] [PubMed] [Google Scholar]
- [14].Kepenekli E, Soysal A, Yalindag-Ozturk N, et al. A national point-prevalence survey of pediatric intensive care unit-acquired, healthcare-associated infections in Turkey. Jpn J Infect Dis. 2015;68(5):381–386. [DOI] [PubMed] [Google Scholar]
- [15].Glenister H. Sensitivity and specificity of surveillance methods. Baillieres Clin Infect Dis. 1996;3(2):197–210. [Google Scholar]
- [16].Geffers C, Baerwolff S, Schwab F, et al. Incidence of healthcare-associated infections in high-risk neonates: results from the German surveillance system for very-low-birthweight infants. J Hosp Infect. 2008;68(3):214–221. [DOI] [PubMed] [Google Scholar]
- [17].Allegranzi B, Nejad SB, Combesecure C, et al. Report on the burden of endemic health care-associated infection worldwide. Geneva, Switzerland: World Health Organization; 2011. [Google Scholar]
- [18].Prevention, E.C.f.D., et al. Point prevalence survey of healthcare-associated infections and antimicrobial use in European Acute Care Hospitals: 2011–2012. Stockholm: Publications Office of the European Union; 2013. [Google Scholar]
- [19].Nejad SB, Allegranzi B, Syed SB, et al. Health-care-associated infection in Africa: a systematic review. Bull World Health Organ. 2011;89:757–765. [DOI] [PMC free article] [PubMed] [Google Scholar]
- [20].Rothe C, Schlaich C, Thompson S. Healthcare-associated infections in sub-Saharan Africa. J Hosp Infect. 2013;85(4):257–267. [DOI] [PubMed] [Google Scholar]
- [21].Klevens RM, Edwards JR, Richards CL, et al. Estimating health care-associated infections and deaths in US hospitals, 2002. 433021. 2007;122(2):160–166. [DOI] [PMC free article] [PubMed] [Google Scholar]
- [22].ECDC Economic evaluations of interventions to prevent healthcare-associated infections: literature review. Stockholm: ECDC. 2017. [Google Scholar]
- [23].Amato-Gauci A. Annual epidemiological report on communicable diseases in Europe: report on the status of communicable diseases in the EU and EEA/EFTA countries. European Centre for Disease Prevention and Control. Stockholm: ECDC. 2007. [Google Scholar]
- [24].Control, E.C.f.D.P.a. Annual epidemiological report on communicable diseases in Europe. Stockholm: ECDC. 2008. [Google Scholar]
- [25].Umscheid CA, Mitchell MD, Doshi JA, et al. Estimating the proportion of healthcare-associated infections that are reasonably preventable and the related mortality and costs. Infect Control Hosp Epidemiol. 2011;32(2):101–114. [DOI] [PubMed] [Google Scholar]
- [26].Harbarth S, Sax H, Gastmeier P. The preventable proportion of nosocomial infections: an overview of published reports. J Hosp Infect. 2003;54(4):258–266. [DOI] [PubMed] [Google Scholar]
- [27].Rosenthal VD, Maki DG, Graves N. The International Nosocomial Infection Control Consortium (INICC): goals and objectives, description of surveillance methods, and operational activities. Am J Infect Control. 2008;36(9):e1–e12. [DOI] [PubMed] [Google Scholar]
- [28].Zaidi AK, Huskins WC, Thaver D, et al. Hospital-acquired neonatal infections in developing countries. Lancet. 2005;365(9465):1175–1188. [DOI] [PubMed] [Google Scholar]
- [29].Allegranzi B, Nejad SB, Combescure C, et al. Burden of endemic health-care-associated infection in developing countries: systematic review and meta-analysis. Lancet. 2011;377(9761):228–241. [DOI] [PubMed] [Google Scholar]
- [30].De Angelis G, Murthy A, Beyersmann J, et al. Estimating the impact of healthcare-associated infections on length of stay and costs. Clin Microbiol Infect. 2010;16(12):1729–1735. [DOI] [PubMed] [Google Scholar]
- [31].Graves N. Economics and preventing hospital-acquired infection. Emerg Infect Dis. 2004;10(4):561. [DOI] [PMC free article] [PubMed] [Google Scholar]
- [32].Ataiyero Y, Dyson J, Graham M. Barriers to hand hygiene practices among health care workers in sub-Saharan African countries: A narrative review. Am J Infect Control. 2018;47(5):565-573. [DOI] [PubMed] [Google Scholar]
- [33].Charrier L, Argentero PA, Farina EC, et al. Surveillance of healthcare-associated infections in Piemonte, Italy: results from a second regional prevalence study. BMC Public Health. 2014;14(1):558. [DOI] [PMC free article] [PubMed] [Google Scholar]
- [34].Organization, W.H. Report on the burden of endemic health care-associated infection worldwide. Geneva, Switzerland: WHO Document production services. 2011. [Google Scholar]
- [35].Sahiledengle B. Stethoscope disinfection is rarely done in Ethiopia: what are the associated factors? bioRxiv. 2018;474098. [DOI] [PMC free article] [PubMed] [Google Scholar]
- [36].Tiroyakgosi C, Matome M, Summers E, et al. Ongoing initiatives to improve the use of antibiotics in Botswana: University of Botswana symposium meeting report. Expert Rev Anti Infect Ther. 2018;16(5):381–384. [DOI] [PubMed] [Google Scholar]
- [37].Mwita JC, Souda S, Magafu MG, et al. Prophylactic antibiotics to prevent surgical site infections in Botswana: findings and implications. Hosp Pract. 2018;46(3):97-102. [DOI] [PubMed] [Google Scholar]
- [38].Organization, W.H. Use of high burden country lists for TB by WHO in the post-2015 era. Geneva: World Health Organization; 2015. [Google Scholar]
- [39].Saleem Z, Hassali MA, Godman B, et al. A multicenter point prevalence survey of health care–associated infections in Pakistan: findings and implications. Am J Infect Control. 2018 [DOI] [PubMed] [Google Scholar]
- [40].Moher D, Shamseer L, Clarke M, et al. Preferred reporting items for systematic review and meta-analysis protocols (PRISMA-P) 2015 statement. Syst Rev. 2015;4(1):1. [DOI] [PMC free article] [PubMed] [Google Scholar]
- [41].Wells G, Shea B, O'Connell D, et al. Newcastle-Ottawa quality assessment scale. Ottawa, Canada: Ottawa Hospital Research Institute; 2013. [Google Scholar]
- [42].Modesti PA, Reboldi G, Cappuccio FP, et al. Panethnic differences in blood pressure in Europe: a systematic review and meta-analysis. PLoS One. 2016;11(1):e0147601. [DOI] [PMC free article] [PubMed] [Google Scholar]
- [43].Silva TB, Almeida PHRF, Araújo VE, et al. Effectiveness and safety of insulin glargine versus detemir analysis in patients with type 1 diabetes: systematic review and meta-analysis. Ther Adv Endocrinol Metab. 2018;9(8):241–254. [DOI] [PMC free article] [PubMed] [Google Scholar]
- [44].Deptuła A, Trejnowska E, Dubiel G, et al. Prevalence of healthcare-associated infections in Polish adult intensive care units: summary data from the ECDC European Point Prevalence Survey of Hospital-associated Infections and Antimicrobial Use in Poland 2012–2014. J Hosp Infect. 2017;96(2):145–150. [DOI] [PubMed] [Google Scholar]
- [45].Sticchi C, Alberti M, Artioli S, et al. Regional point prevalence study of healthcare-associated infections and antimicrobial use in acute care hospitals in Liguria, Italy. J Hosp Infect. 2017;99(1):8–16. [DOI] [PubMed] [Google Scholar]
- [46].Swissnoso Point Prevalence Survey of healthcare-associated infections and antimicrobial use in Swiss acute care hospital. Geneva, Switzerland 2017. 2017. [DOI] [PMC free article] [PubMed] [Google Scholar]
- [47].Klavs I, Kolman J, Lejko Zupanc T, et al. The prevalence of and risk factors for healthcare-associated infections in Slovenia: results of the second national survey. Slovenian J Public Health. 2016;55(4):239–247. [DOI] [PMC free article] [PubMed] [Google Scholar]
- [48].Lusignani LS, Blacky A, Starzengruber P, et al. A national point prevalence study on healthcare-associated infections and antimicrobial use in Austria. Wien Klin Wochenschr. 2016;128(3–4):89–94. [DOI] [PubMed] [Google Scholar]
- [49].Roche F, Donlon S, Burns K. Point prevalence survey of healthcare-associated infections and use of antimicrobials in Irish intellectual disability long-term care facilities: 2013. J Hosp Infect. 2016;93(4):410–417. [DOI] [PubMed] [Google Scholar]
- [50].Stefkovicova M, Rovny I, Brnova J. Point prevalence survey of healthcare-associated infections in Slovakia: from zero to real data. Antimicrob Resist Infect Control. 2015;4(1):P277. [Google Scholar]
- [51].Miliani K, Migueres B, Verjat-Trannoy D, et al. National point prevalence survey of healthcare-associated infections and antimicrobial use in French home care settings, May to June 2012. Eurosurveillance. 2015;20(27):21182. [DOI] [PubMed] [Google Scholar]
- [52].Katrien Latour BCBJ, Maria L. PPS of healthcare-associated infections and antimicrobial use in European long-term care facilities. Stockholm: ECDC. 2014. [Google Scholar]
- [53].Katrien Latour PK, Luisa M. Point prevalence survey of healthcare-associated infections and antimicrobial use in European long-term care facilities, 2013. Stockholm: ECDC. 2014. [DOI] [PMC free article] [PubMed] [Google Scholar]
- [54].Erdem H, Inan A, Altındis S, et al. Surveillance, control and management of infections in intensive care units in Southern Europe, Turkey and Iran–a prospective multicenter point prevalence study. J Infect. 2014;68(2):131–140. [DOI] [PubMed] [Google Scholar]
- [55].Sinatra I, Carubia L, Marchese V, et al. Prevalence survey of healthcare-associated infections and antimicrobial use at the University Hospital” Paolo Giaccone”, Palermo, Italy. J Prev Med Hyg. 2013;54(4):200. [PMC free article] [PubMed] [Google Scholar]
- [56].Smiddy MP, Murphy OM. The use of point prevalence surveys of healthcare-associated infection to identify risk factors and facilitate infection prevention and control planning. Healthcare Infect. 2013;18(4):162–167. [Google Scholar]
- [57].Behnke M, Hansen S, Leistner R, et al. Nosocomial infection and antibiotic use: a second national prevalence study in Germany. Dtsch Arztebl Int. 2013;110(38):627. [DOI] [PMC free article] [PubMed] [Google Scholar]
- [58].Carl Suetens SH, Kolman J. Point prevalence survey of healthcare-associated infections and antimicrobial use in European acute care hospitals 2011–2012. Stockholm; ECDC. 2013. [Google Scholar]
- [59].Heudorf U, Boehlcke K, Schade M. Healthcare-associated infections in long-term care facilities (HALT) in Frankfurt am Main, Germany, January to March 2011. Euro Surveill. 2012;17(35):5–11. [PubMed] [Google Scholar]
- [60].Coello R, Brannigan E, Lawson W, et al. Prevalence of healthcare device-associated infection using point prevalence surveys of antimicrobial prescribing and existing electronic data. J Hosp Infect. 2011;78(4):264–268. [DOI] [PubMed] [Google Scholar]
- [61].Lietard C, Lejeune B, Metzger MH, et al. National Point Prevalence Survey of healthcare‐associated infections: results for people aged 65 and older, France, 2006. J Am Geriatr Soc. 2011;59(4):763–765. [DOI] [PubMed] [Google Scholar]
- [62].Alexopoulos EC, BATZI E, MESSOLORA F, et al. Wide range of point prevalences of healthcare-associated infections in Western Greece. Epidemiol Infect. 2011;139(11):1734–1739. [DOI] [PubMed] [Google Scholar]
- [63].Hopkins S, Shaw K, Simpson L. English national point prevalence survey on healthcare-associated infections and antimicrobial use. London (United Kingdom): Health ProtectionAgency; 2011. [Google Scholar]
- [64].Cairns S, Reilly J, Stewart S, et al. The prevalence of health care–associated infection in older people in acute care hospitals. Infect Control Hosp Epidemiol. 2011;32(8):763–767. [DOI] [PubMed] [Google Scholar]
- [65].Cairns S, Reilly J, Booth M. Prevalence of healthcare-associated infection in Scottish intensive care units. J Hosp Infect. 2010;76(4):308–310. [DOI] [PubMed] [Google Scholar]
- [66].Gordts B, Vrijens F, Hulstaert F, et al. The 2007 Belgian national prevalence survey for hospital-acquired infections. J Hosp Infect. 2010;75(3):163–167. [DOI] [PubMed] [Google Scholar]
- [67].Lanini S, Jarvis WR, Nicastri E, et al. Healthcare-associated infection in Italy annual point-prevalence surveys, 2002–2004. Infect Control Hosp Epidemiol. 2009;30(7):659–665. [DOI] [PubMed] [Google Scholar]
- [68].Vincent J-L, Rello J, Marshall J, et al. International study of the prevalence and outcomes of infection in intensive care units. Jama. 2009;302(21):2323–2329. [DOI] [PubMed] [Google Scholar]
- [69].Patte R, Drouvot V, Quenon J-L, et al. Prevalence of hospital-acquired infections in a home care setting. J Hosp Infect. 2005;59(2):148–151. [DOI] [PubMed] [Google Scholar]
- [70].Lizioli A, Privitera G, Alliata E, et al. Prevalence of nosocomial infections in Italy: result from the Lombardy survey in 2000. J Hosp Infect. 2003;54(2):141–148. [DOI] [PubMed] [Google Scholar]
- [71].Starakis I, Marangos M, Gikas A, et al. Repeated point prevalence survey of nosocomial infections in a Greek university hospital. J Chemother. 2002;14(3):272–278. [DOI] [PubMed] [Google Scholar]
- [72].Gikas A, Pediaditis J, Papadakis JA, et al. Prevalence study of hospital-acquired infections in 14 Greek hospitals: planning from the local to the national surveillance level. J Hosp Infect. 2002;50(4):269–275. [DOI] [PubMed] [Google Scholar]
- [73].Group, F.P.S.S. Prevalence of nosocomial infections in France: results of the nationwide survey in 1996. J Hosp Infect. 2000;46(3):186–193. [DOI] [PubMed] [Google Scholar]
- [74].Pittet D, Harbarth S, Ruef C, et al. Prevalence and risk factors for nosocomial infections in four university hospitals in Switzerland. Infect Control Hosp Epidemiol. 1999;20(1):37–42. [DOI] [PubMed] [Google Scholar]
- [75].Vincent J-L, Bihari DJ, Suter PM, et al. The prevalence of nosocomial infection in intensive care units in Europe: results of the European Prevalence of Infection in Intensive Care (EPIC) Study. Jama. 1995;274(8):639–644. [PubMed] [Google Scholar]
- [76].Chen Y, Zhao JY, Shan X, et al. A point-prevalence survey of healthcare-associated infection in fifty-two Chinese hospitals. J Hosp Infect. 2017;95(1):105–111. [DOI] [PubMed] [Google Scholar]
- [77].Nair V, Sahni AK, Sharma D, et al. Point prevalence & risk factor assessment for hospital-acquired infections in a tertiary care hospital in Pune, India. Indian J Med Res. 2017;145(6):824. [DOI] [PMC free article] [PubMed] [Google Scholar]
- [78].Cai Y, Venkatachalam I, Tee NW, et al. Prevalence of healthcare-associated infections and antimicrobial use among adult inpatients in Singapore acute-care hospitals: results from the first national point prevalence survey. Clinl Infect Dis. 2017;64(suppl_2):S61–S67. [DOI] [PubMed] [Google Scholar]
- [79].Liu J, Wu YH, Cai M, et al. Point-prevalence survey of healthcare-associated infections in Beijing, China: a survey and analysis in 2014. J Hosp Infect. 2016;93(3):271–279. [DOI] [PubMed] [Google Scholar]
- [80].Zhang Y, Zhang J, Wei D, et al. Annual surveys for point-prevalence of healthcare-associated infection in a tertiary hospital in Beijing, China, 2012–2014. BMC Infect Dis. 2016;16(1):161. [DOI] [PMC free article] [PubMed] [Google Scholar]
- [81].Phu VD, Wertheim HFL, Larsson M, et al. Burden of hospital acquired infections and antimicrobial use in Vietnamese adult intensive care units. PloS One. 2016;11(1):e0147544. [DOI] [PMC free article] [PubMed] [Google Scholar]
- [82].Morioka H, Hirabayashi A, Iguchi M, et al. The first point prevalence survey of health care–associated infection and antimicrobial use in a Japanese university hospital: A pilot study. Am J Infect Control. 2016;44(7):e119–e123. [DOI] [PubMed] [Google Scholar]
- [83].Kumar A, Biswal M, Dhaliwal N, et al. Point prevalence surveys of healthcare-associated infections and use of indwelling devices and antimicrobials over three years in a tertiary care hospital in India. J Hosp Infect. 2014;86(4):272–274. [DOI] [PubMed] [Google Scholar]
- [84].Tao X-B, Qian L-H, Li Y, et al. Hospital-acquired infection rate in a tertiary care teaching hospital in China: a cross-sectional survey involving 2434 inpatients. Inter J Infect Dis. 2014;27:7–9. [DOI] [PubMed] [Google Scholar]
- [85].Xie D-S, Fu X-Y, Wang H-F, et al. Annual point-prevalence of healthcare-associated infection surveys in a university hospital in China, 2007–2011. J Infect Public Health. 2013;6(6):416–422. [DOI] [PubMed] [Google Scholar]
- [86].Askarian M, Yadollahi M, Assadian O. Point prevalence and risk factors of hospital acquired infections in a cluster of university-affiliated hospitals in Shiraz, Iran. J Infect Public Health. 2012;5(2):169–176. [DOI] [PubMed] [Google Scholar]
- [87].Thu TA, Hung NV, Quang NN, et al. A point-prevalence study on healthcare-associated infections in Vietnam: public health implications. Infect Control Hosp Epidemiol. 2011;32(10):1039–1041. [DOI] [PubMed] [Google Scholar]
- [88].Ider B-E, Clements A, Adams J, et al. Prevalence of hospital-acquired infections and antibiotic use in two tertiary Mongolian hospitals. J Hosp Infect. 2010;75(3):214–219. [DOI] [PubMed] [Google Scholar]
- [89].Lee M, Chiu CS, Chow VC, et al. Prevalence of hospital infection and antibiotic use at a university medical center in Hong Kong. J Hosp Infect. 2007;65(4):341–347. [DOI] [PMC free article] [PubMed] [Google Scholar]
- [90].Balkhy HH, Cunningham G, Chew FK, et al. Hospital-and community-acquired infections: a point prevalence and risk factors survey in a tertiary care center in Saudi Arabia. Inter J Infect Dis. 2006;10(4):326–333. [DOI] [PubMed] [Google Scholar]
- [91].Danchaivijitr S, Dhiraputra C, Santiprasitkul S, et al. Prevalence and impacts of nosocomial infection in Thailand 2001. J Med Assoc Thai. 2005;88(Suppl 10):S1–S9. [PubMed] [Google Scholar]
- [92].Hughes AJ, Ariffin N, Huat TL, et al. Prevalence of nosocomial infection and antibiotic use at a university medical center in Malaysia. Infect Control Hosp Epidemiol. 2005;26(1):100–104. [DOI] [PubMed] [Google Scholar]
- [93].Esen S, Leblebicioglu H, Group S. Prevalence of nosocomial infections at intensive care units in Turkey: a multicentre 1-day point prevalence study. Scand J Infect Dis. 2004;36(2):144–148. [DOI] [PubMed] [Google Scholar]
- [94].Rutledge-Taylor K, Matlow A, Gravel D, et al. A point prevalence survey of health care-associated infections in Canadian pediatric inpatients. Am J Infect Control. 2012;40(6):491–496. [DOI] [PubMed] [Google Scholar]
- [95].Magill SS, Hellinger W, Cohen J, et al. Prevalence of healthcare-associated infections in acute care hospitals in Jacksonville, Florida. Infect Control Hosp Epidemiol. 2012;33(3):283–291. [DOI] [PMC free article] [PubMed] [Google Scholar]
- [96].Magill SS, Edwards JR, Bamberg W, et al. Multistate point-prevalence survey of health care–associated infections. N Engl J Med. 2014;370(13):1198–1208. [DOI] [PMC free article] [PubMed] [Google Scholar]
- [97].Gravel D, Taylor G, Ofner M, et al. Point prevalence survey for healthcare-associated infections within Canadian adult acute-care hospitals. J Hosp Infect. 2007;66(3):243–248. [DOI] [PubMed] [Google Scholar]
- [98].Rezende EM, Couto BRGM, Starling CEF, et al. Prevalence of nosocomial infections in general hospitals in Belo Horizonte. Infect Control Hosp Epidemiol. 1998;19(11):872–876. [DOI] [PubMed] [Google Scholar]
- [99].Yallew WW, Kumie A, Yehuala FM. Point prevalence of hospital-acquired infections in two teaching hospitals of Amhara region in Ethiopia. Drug Healthc Patient Saf. 2016;8:71. [DOI] [PMC free article] [PubMed] [Google Scholar]
- [100].Kallel H, Bahoul M, Ksibi H, et al. Prevalence of hospital-acquired infection in a Tunisian hospital. J Hosp Infect. 2005;59(4):343–347. [DOI] [PubMed] [Google Scholar]
- [101].Zingg W, Hopkins S, Gayet-Ageron A, et al. Health-care-associated infections in neonates, children, and adolescents: an analysis of paediatric data from the European Centre for Disease Prevention and Control point-prevalence survey. Lancet Infect Dis. 2017;17(4):381–389. [DOI] [PubMed] [Google Scholar]
- [102].Hajdu A, Samodova OV, Carlsson TR, et al. A point prevalence survey of hospital-acquired infections and antimicrobial use in a paediatric hospital in north-western Russia. J Hosp Infect. 2007;66(4):378–384. [DOI] [PubMed] [Google Scholar]
- [103].Le NK, Wertheim HF, Vu PD, et al. High prevalence of hospital-acquired infections caused by gram-negative carbapenem resistant strains in Vietnamese pediatric ICUs: A multi-centre point prevalence survey. Medicine (Baltimore). 2016;95(27):e4099. [DOI] [PMC free article] [PubMed] [Google Scholar]
- [104].Grohskopf LA, Sinkowitz-Cochran RL, Garrett DO, et al. A national point-prevalence survey of pediatric intensive care unit-acquired infections in the United States. J Pediatr. 2002;140(4):432–438. [DOI] [PubMed] [Google Scholar]
- [105].Sohn AH, Garrett DO, Sinkowitz-Cochran RL, et al. Prevalence of nosocomial infections in neonatal intensive care unit patients: results from the first national point-prevalence survey. J Pediatr. 2001;139(6):821–827. [DOI] [PubMed] [Google Scholar]
- [106].Taylor G, Gravel D, Matlow A, et al. Assessing the magnitude and trends in hospital acquired infections in Canadian hospitals through sequential point prevalence surveys. Antimicrob Resist Infect Control. 2016;5(1):19. [DOI] [PMC free article] [PubMed] [Google Scholar]
- [107].Manosuthi W, Thientong V, Moolasart V, et al. HEALTHCARE-ASSOCIATED INFECTIONS AT SELECTED HOSPITALS IN THAILAND. Southeast Asian J Trop Med Public Health. 2017;48(1):204–212. [PubMed] [Google Scholar]
- [108].Glance LG, Stone PW, Mukamel DB, et al. Increases in mortality, length of stay, and cost associated with hospital-acquired infections in trauma patients. Arch Surg. 2011;146(7):794–801. [DOI] [PMC free article] [PubMed] [Google Scholar]
- [109].Chang AB, Chang CC, O’Grady K, et al. Lower respiratory tract infections. Pediatr Clinics. 2009;56(6):1303–1321. [DOI] [PubMed] [Google Scholar]
- [110].Troeger CE, Blacker BF, Khalil IA, et al. Mortality, morbidity, and hospitalisations due to influenza lower respiratory tract infections, 2017: an analysis for the Global Burden of Disease Study 2017. Lancet Respir Med. 2018;7(1):69-89. [DOI] [PMC free article] [PubMed] [Google Scholar]
- [111].de Lissovoy G, Fraeman K, Hutchins V, et al. Surgical site infection: incidence and impact on hospital utilization and treatment costs. Am J Infect Control. 2009;37(5):387–397. [DOI] [PubMed] [Google Scholar]
- [112].Metintas S, Akgun Y, Durmaz G, et al. Prevalence and characteristics of nosocomial infections in a Turkish university hospital. Am J Infect Control. 2004;32(7):409–413. [DOI] [PubMed] [Google Scholar]
- [113].Haynes AB, Weiser TG, Berry WR, et al. A surgical safety checklist to reduce morbidity and mortality in a global population. N Engl J Med. 2009;360(5):491–499. [DOI] [PubMed] [Google Scholar]
- [114].Irek EO, Amupitan AA, Obadare TO, et al. A systematic review of healthcare-associated infections in Africa: an antimicrobial resistance perspective. Afr J Lab Med. 2018;7(2):1–9. [DOI] [PMC free article] [PubMed] [Google Scholar]
- [115].Durlach R, McIlvenny G, Newcombe RG, et al. Prevalence survey of healthcare-associated infections in Argentina; comparison with England, Wales, Northern Ireland and South Africa. J Hosp Infect. 2012;80(3):217–223. [DOI] [PubMed] [Google Scholar]
- [116].Longtin Y, Sax H, Leape LL, et al. Patient participation: current knowledge and applicability to patient safety. Mayo. 2010;85:53–62 Elsevier. [DOI] [PMC free article] [PubMed] [Google Scholar]
- [117].Cox J, Vlieghe E, Mendelson M, et al. Antibiotic stewardship in low-and middle-income countries: the same but different? Clin Microbiol Infect. 2017;23:812–818. [DOI] [PubMed] [Google Scholar]
- [118].Fadare JO, Ogunleye O, Iliyasu G, et al. Status of antimicrobial stewardship programmes in Nigerian tertiary healthcare facilities: findings and implications. J Glob Antimicrob Resist. 2019;17:132–136. [DOI] [PubMed] [Google Scholar]
- [119].Kalungia AC, Mwambula H, Munkombwe D, et al. Antimicrobial stewardship knowledge and perception among physicians and pharmacists at leading tertiary teaching hospitals in Zambia: implications for future policy and practice. J Chemother. 2019;1–10. [DOI] [PubMed] [Google Scholar]