

Abstract
This study is concerned with the role of impulse activity and synaptic transmission in early thalamocortical development. Disruption of the gene encoding SNAP-25, a component of the solubleN-ethylmaleimide-sensitive factor attachment protein (SNAP) receptor complex required for regulated neuroexocytosis, eliminates evoked but not spontaneous neurotransmitter release (Washbourne et al., 2002). The Snap25 null mutant mouse provides an opportunity to test whether synaptic activity is required for prenatal neural development. We found that evoked release is not needed for at least the gross formation of the embryonic forebrain, because the major features of the diencephalon and telencephalon were normal in the null mutant mouse. However, half of the homozygous mutants showed undulation of the cortical plate, which in the most severely affected brains was accompanied by a marked reduction of calbindin-immunoreactive neurons. Carbocyanine dye tracing of the thalamocortical fiber pathway revealed normal growth kinetics and fasciculation patterns between embryonic days 17.5 and 19. As in normal mice, mutant thalamocortical axons reach the cortex, accumulate below the cortical plate, and then start to extend side-branches in the subplate and deep cortical plate. Multiple carbocyanine dye placements in the cortical convexity revealed normal overall topography of both early thalamocortical and corticofugal projections. Electrophysiological recordings from thalamocortical slices confirmed that thalamic axons were capable of conducting action potentials to the cortex. Thus, our data suggest that axonal growth and early topographic arrangement of these fiber pathways do not rely on activity-dependent mechanisms requiring evoked neurotransmitter release. Intercellular communication mediated by constitutive secretion of transmitters or growth factors, however, might play a part.
Keywords: thalamus, cortex, mouse, carbocyanine dyes, synaptogenesis, synaptic activity, SNAP-25
In the adult nervous system, neural communication is mediated primarily through chemical synapses, where neurotransmitter release is evoked by presynaptic action potentials (APs). Neurotransmitter secretion has also been demonstrated in growing axons before target contact and synapse formation, suggesting that neurotransmitters could play a role in pathway guidance and target selection (Girod et al., 1995; Verderio et al., 1999). Patterns of impulses and regulated transmitter release may guide the precise topography of certain neuronal projections (Katz and Shatz, 1996).
Thalamocortical development in the mammalian brain is a highly ordered process that is well suited for evaluating these mechanisms. Thalamic axons pass among populations of neurons on their way to the intermediate zone of the telencephalon (Molnár et al., 1998a), arrive in the subplate, and extend side branches radially into the developing cortical plate (Naegele et al., 1988; Ghosh and Shatz, 1992a; Catalano et al., 1996). Once thalamic fibers enter layer 4, the topography becomes fairly precisely established (Agmon et al., 1993;Krug et al., 1998). Its final refinement involves activity-dependent strengthening of synaptic interactions (Stryker and Harris, 1986;Molnár and Hannan, 2000; Erzurumlu and Kind, 2001), and synaptic input to cortical neurons can influence their morphological differentiation (Hannan et al., 2001). However, it is less clear whether neurotransmission is involved in the early stages of formation of the thalamocortical projection.
It has been suggested that thalamic fibers form temporary connections on subplate neurons before advancing and forming their ultimate synapses in cortical layer 4 (Friauf and Shatz, 1991). Early neural activity within the subplate or lower cortical layers might stabilize certain side-branches and thereby select the appropriate cortical target area (Ghosh and Shatz 1992a,b; Catalano and Shatz, 1998;Molnár et al., 2000). However, the nature of this neural activity, and whether it involves evoked release of neurotransmitter, has not been resolved.
To address these issues, we examined the development of thalamocortical projections in the absence of evoked neurotransmitter release in SNAP-25-deficient fetal mice. SNAP-25, together with syntaxin-1 and vesicle-associated membrane protein-2, forms the core solubleN-ethylmaleimide-sensitive factor attachment protein (SNAP) receptor (SNARE) complex, which plays an essential role in exocytotic release of neurotransmitter (Südhof, 1995). Mice homozygous for aSnap25 null mutation develop to term, and fetal brain development appears superficially normal, although evoked neurotransmitter release is eliminated entirely (Washbourne et al., 2002). SNAP-25-deficient neurons extend axons that terminate in synapses where spontaneous AP-independent release still occurs, but APs do not trigger neurotransmission. Thus, genetic ablation of SNAP-25 expression appears selectively to disable the vesicular processes responsible for evoked synaptic transmission, leaving intact membrane trafficking for axon outgrowth and exocytosis for spontaneous neurotransmitter secretion.
If activity-dependent neurotransmitter release is necessary for the guidance and targeting of thalamic and cortical projections, the topography of these fibers should be disorganized in theSnap25 null mutant brain. Thalamocortical projections might show aberrant branching at the subplate and fail to enter the correct region of overlying cortical plate. In fact, our results demonstrate that the absence of evoked neurotransmitter release does not grossly disrupt these processes.
MATERIALS AND METHODS
Animals
SNAP-25-deficient mice and littermate controls were obtained by mating mice heterozygous for a null mutation of the Snap25gene, with exons 5a and 5b deleted, which was backcrossed onto a C57BL/6J background for four to five generations, as described previously (Washbourne et al., 2002). Late-stage homozygote null mutants are completely paralyzed, although the heart beats, presumably because of the presence of electrically active nodal cells and electrical cardiac conduction pathways. Embryos usually survive until birth but die immediately after parturition, probably from respiratory failure. This effectively limited our studies to the embryonic period. Mice, which have a gestation period of 19–20 d, were time-mated at the University of New Mexico (Albuquerque, NM), fetuses were collected between embryonic day (E) 17.5 and E19 on the basis of the plug date, which was defined as E0. Littermates were analyzed without previous confirmation of the genotype. The mice were housed in a pathogen-free barrier facility at the Association for Accessment and Accreditation of Laboratory Animal Care International-approved Animal Resource Facility at the University of New Mexico Health Sciences Center campus. All animal procedures were performed in accordance with the guidelines of the University of New Mexico Laboratory Care and Use Committee and the National Institutes of Health.
For routine genotype screening, a semiquantitative PCR assay, based on amplification of the exon 5 region, was conducted on tail DNA, in which comparable primers for the IL-1β gene (proximal to Snap25on mouse chromosome 2) were used as an internal control (Washbourne et al., 2002). Occasionally, genotypes were confirmed by Southern blotting analysis, but in the vast majority of cases the PCR assay proved sufficient to assign the appropriate Snap25 genotype. The genotypes of litters from heterozygote matings exhibited a Mendelian distribution (see Table 1).
Table 1.
Numbers of animals in each study
| Age | Snap25 status | |||
|---|---|---|---|---|
| +/+ | +/− | −/− | ||
| Nissl staining | E18.5 | 2 | 5 | 5 |
| Immunohistochemistry | E18.5 | 6 | 6 | 9 |
| Carbocyanine dye tracing experiments | E17.5 | 4 | 3 | 3 |
| E18.5 | 5 | 5 | 5 | |
| E19 | 2 | 8 | 1 | |
| Electrophysiological recordings | E18.5 | 2 | 3 | 4 |
Histology, immunohistochemistry, and axonal tracing
For experiments conducted on fixed tissue, fetuses were removed by Cesarean section under general anesthesia. The fetuses were then decapitated, and the heads were fixed in 4% paraformaldehyde in 0.1m phosphate buffer (PB), pH 7.4, overnight.
Nissl staining. To study cytoarchitecture, fixed brains were sectioned coronally at 60 μm (Leica VT 1000S Vibroslicer) and stained with 0.5% cresyl violet solution. Nissl-stained sections were examined by light microscopy and photographed with a Leica DC 500 digital camera. Plates were assembled using Photoshop 6.0 (Adobe).
Immunohistochemistry. Brains were studied from E17.5 and E18.5 homozygous Snap25+/+wild-type (WT) mice, heterozygote (HT) mice, and homozygous,Snap25−/−null mutant, “knock-out” (KO) animals (see Table 1). After overnight fixation in 4% paraformaldehyde/0.1 mPB, the brains were embedded in 4% agarose and sectioned coronally at 60 μm. Free-floating sections were incubated in 10% normal goat serum (NGS) diluted in 50 mm Tris buffer (TB), pH 7.4, containing 0.9% NaCl [Tris-buffered saline (TBS)], with or without 0.2% Triton X-100, for 1 hr. Sections were then incubated for 48 hr in affinity-purified polyclonal antibodies in TBS containing 1% NGS: (1) anti-calbindin (Swant; 1:2000), (2) anti-calretinin (Swant; 1:2000), (3) anti-SNAP-25 (a gift from Dr. H. Hirling, University of Lausanne; 1:500), (4) anti-L1 (Chemicon, 1:100), (5) anti-phospho-Histone H3 (Upstate Biotechnology, 1:500), and (6) a monoclonal antibody against reelin clone E4 (de Bergeyck et al., 1998) (gift from Dr. A. Goffinet, University Louvain Medical School, Brussels, Belgium).
After washes in TBS, the sections were incubated for 2 hr in biotinylated goat anti-rabbit or anti-mouse IgG (Vector Laboratories, Burlingame, CA) diluted 1:100 in TBS containing 1% NGS. They were then transferred into avidin–biotin–peroxidase complex (ABC kit, Vector Laboratories) diluted 1:100 for 2 hr at room temperature. Peroxidase enzyme activity was revealed using 3,3′-diaminobenzidine tetrahydrochloride (0.05% in TB, pH 7.4) as chromogen and 0.01% H2O2 as substrate. Sections were rinsed, dehydrated, and mounted in Eukitt mounting media. For control experiments, the primary antibody was replaced by 0.2% Triton X-100 in PBS and then reacted as above. These control sections showed no positive immunoreactivity. Photomicrographs were prepared by light microscopy with a Leica DC 500 digital camera.
Axonal tracing from the thalamus with carbocyanine dyes. Carbocyanine dyes were used to trace axon pathways (Godement et al., 1987) in fixed brains of littermate mice from E17.5 to E19. We examined two litters (14 individuals altogether). For detailed methods seeMolnár et al. (1998a). The brains were removed from the skull under a dissecting microscope, and both hemispheres were used for axon tracing. One or more tiny individual crystals (0.1–0.3 mm diameter) of fluorescent carbocyanine dye were inserted, under an operating microscope, into the diencephalon (after transecting the brainstem rostral to the colliculi to expose the posterior thalamus) or into the surface of the neocortex, using a fine pair of forceps or a fine stainless steel wire, under an operating microscope. The dye used for single-dye tracing was 1,1′-dioctadecyl 3,3,3′3′-tetramethylindocarbocyanine perchlorate (DiI). In some experiments, 4-[4-dihexadecylamino)stryryl]-N-methylpyridinium iodide (DiA) was also used (both dyes from Molecular Probes, Eugene, OR). The depth to which the crystal was inserted into the thalamus or the cortex was ∼0.5–1 mm from the cut surface. After insertion of dye crystals, the brains were stored in PBS, with 0.01% sodium azide to prevent contamination, at room temperature, or at 37°C to facilitate the diffusion of dye along axons. The incubation period ranged from 2 to 4 weeks; shorter periods were used for higher incubation temperatures.
At the end of incubation, the brains were embedded in 4% agarose (made up in 0.9% saline), and coronal sections were cut with a Vibroslicer (Leica VT 1000S). The sections, 50–100 μm thick, were counterstained with bisbenzimide (Riedel-De Haen AG, Seelze-Hanover, Germany; 2.5 μg/ml in PBS) for 10 min to reveal the main cytoarchitectonic features and to confirm the presence of chromatin in back-labeled cells. The sections were coverslipped in 0.1 m PB with glycerol (1:1), or PBS, and then sealed with nail varnish. Each series of sections was examined in a conventional fluorescence microscope, using different filters to reveal either the DiI dye or the bisbenzimide staining. The sections were photographed with a Leica DC500 digital camera. Numerous sections, selected in conventional fluorescence microscopy, were subsequently examined and imaged in a laser scanning confocal microscope (TLSM-Fluovert; Leica, Heidelberg, Germany).
Experiments on topography. In three brains from a single litter at E18.5 (each brain representing a different genotype), we made alternating deposits of DiI and DiA at three points 2–3 mm apart, in either a parasagittal or a coronal row across the cortex of each hemisphere. This was done to study the topography of both corticofugal projections (labeled by anterograde diffusion) and thalamocortical projections (retrogradely labeled). DiI and DiA were selected because they are clearly distinguishable under different wavelengths of fluorescent illumination. DiA needs slightly shorter incubation periods (1–3 weeks at room temperature) for reliable fiber labeling. Therefore, DiI placement was conducted 1 week before that of DiA. After an incubation period of 2 weeks (in PBS, with 0.1% sodium azide at room temperature), the brains were embedded in agarose and sectioned horizontally or coronally. Each series of sections was examined in a conventional fluorescence microscope, and selected sections were subsequently examined and imaged in the laser scanning confocal microscope.
Electrophysiology
Fetal mice at E18.5 were obtained from time-mated females by Cesarean section under general anesthesia, and after decapitation, the whole fetal brain was removed and immersed in chilled oxygenated artificial CSF (ACSF) containing (in mm): NaCl 124, KCl 5, NaH2PO4 1.24, MgSO4 1.3, CaCl2 2.4, NaHCO3 26, d-glucose 10 (saturated with 95% O2 and 5% CO2). The brains were dissected in chilled ACSF and then embedded in low melting point agarose (4%; Invitrogen) made up in ACSF. The agar blocks were chilled and blocked so that vertical oblique sections (45° to coronal and sagittal planes; see Fig. 8) could be cut with aVibratome (Higashi et al., 1996, 2002). Sections of 400 μm thickness were cut in low-Ca2+ ACSF containing (in mm); NaCl 124, KCl 5, NaH2PO4 1.24, MgSO4 10, CaCl2 0.5, NaHCO3 26, d-glucose 10 (saturated with 95% O2 and 5% CO2), maintained at 34°C in low Ca2+ ACSF, and then held at room temperature in normal ACSF for a minimum of 1 hr before recording at 34°C. Of the series of sections from each brain, one or two sections, in which bundles of thalamocortical fibers could be followed all the way from the thalamus through the internal capsule to the cortex were selected under a binocular microscope.
Fig. 8.

Electrophysiological experiments using a whole forebrain slice preparation at E18.5 (Higashi et al., 2002) revealed that thalamic axons conduct APs, but there is no obvious synaptic transmission onto neurons of the cortical plate in WT, HT, or KO brains. A, Diagram to illustrate the plane of vertical section (45° to both coronal and sagittal planes) at which brains were cut at 400 μm to produce slices containing the VB complex of the thalamus, the putative somatosensory cortex, and the entire fiber pathway in between. B, Camera lucida tracing of a thalamocortical slice preparation showing the position of the stimulating electrode in the thalamus (TH).CP, Cortical plate; SP, subplate;IZ, intermediate zone; VZ, ventricular zone; IC, internal capsule. C, Extracellular recordings after thalamic stimulation in slices from HT (+/−, left column) and KO (−/−, right column) brains. In both genotypes, stimulation of the VB produced an initial artifact (the polarity of which depended on the stimulating polarity), followed by a negative-going field potential with a peak at ∼4 msec. This peak was not eliminated by applying ionotropic blockers (40 μm CNQX, 10 μmMK801, 20 μm bicuculline) in the bath. The field potential was eliminated, however, by the subsequent application of 600 nm TTX. The responses are indistinguishable except for a difference in the form of the stimulus artifact.
In some experiments we blocked glutamatergic synaptic transmission with inhibitors of AMPA receptors (40 μm CNQX; Tocris) and NMDA receptors (50 μm APV; Sigma). In some cases we inhibited GABAA-mediated transmission with bicuculline (20 μm; Sigma) or blocked voltage-activated sodium channels with tetrodotoxin (TTX; 600 nm).
Borosilicate glass (A-M Systems) microelectrodes filled with 0.9% NaCl solution (electrical resistance, 1–5 MΩ; tip diameter, ∼3 μm) were used to record field potentials evoked in the putative somatosensory cortex by the stimulation of the ventrobasal (VB) complex of the thalamus. The recording microelectrode was mounted on a three-dimensional motor-driven micromanipulator (MS-314 WPI, World Precision Instruments). Its tip was positioned roughly in the middle of the cortical plate, at the locus of maximum response. Suprathreshold stimulation (duration, 0.1 msec; frequency, 0.05 Hz) was elicited with a concentric bipolar stimulating electrode (tip diameter, 200 μm). The intensity of the stimulus was adjusted to approximately two-thirds of that evoking the maximum response. Toward the end of each experiment, a few previous recording positions were revisited to confirm that there was no change in the response during the recording session.
Field potentials were averaged for five stimulation trials with the stimulus applied every 20 sec. We used this very low rate of stimulation to ensure that synaptic transmission, if present, would not suffer from the exhaustion that is characteristic of immature synapses. The electrical signals were averaged on-line using pCLAMP6 (Axon Instruments) software and a Digidata 1200 A/D converter.
RESULTS
Our description is based on experiments involving approximately equal numbers ofSnap25−/−homozygous null mutant [KO] animals, HTs, and homozygousSnap25+/+ WT specimens from the same litters (Table 1). The appearance of the embryonic brain structures in both WT and HT mice in the present study conformed at every stage to the previous descriptions of brain development in normal mice (Caviness, 1988; Molnár et al., 1998b;Hevner et al., 2001). Moreover, we saw no gross differences in brain morphology between WT and SNAP-25-deficient (Snap25−/−) mice.
Our study was based on Nissl staining, immunohistochemistry, axon tracing, and electrophysiological recording, covering the period from E17.5 to E19. For the sake of clarity, we present the results as follows: general phenotypic characteristics; gross histological appearance, exhibited by Nissl staining; patterns of immunohistochemical staining for SNAP-25, calretinin, and calbindin; outgrowth of thalamocortical fibers and their arrival at the cortex, based on anterograde labeling from DiI crystals implanted in the dorsal thalamus; global topography of corticofugal and thalamocortical projections, examined with anterograde and retrograde tracing from multiple dye crystal placements in the cortical convexity; and electrophysiological recordings in slice preparations.
Phenotypic appearance of the mice
Snap25−/−fetuses develop until term with few overt phenotypic abnormalities (Washbourne et al., 2002). At E17.5–19, the Snap25homozygote null mutant mice can be recognized by their tucked, immobile posture and their failure to respond to physical contact (Washbourne et al., 2002). Interestingly, the heart contracts and is able to pump blood, but homozygotes do not survive after birth, presumably because paralysis prevents them from breathing.
Nissl staining reveals grossly normal brain development, except for a prominent irregularity of the cortical plate in the minority of the mutants
Examination of cresyl violet-stained sections revealed no striking histological abnormalities within the forebrain, brainstem, or cerebellum of heterozygous or homozygous null mutant animals compared with control WT littermates. Importantly there were no areas of widespread degeneration in early developing regions of brain, including brainstem and hypothalamus, as exhibited in Munc 18-1 mutants at later embryonic stages in which both spontaneous AP-independent and evoked AP-dependent neurotransmitter release are totally eliminated (Verhage et al., 2000). We paid particular attention to morphology, cellular structure, and lamination patterns in the neocortex (Fig.1). By E17.5, in both normal and SNAP-25-deficient null mutant mice, the migration of true cortical neurons through the lower part of the preplate and their accumulation below the marginal zone had created sharp boundaries between the regions of different cell density at the upper and lower limits of the thickening cortical plate (Fig. 1). The basic laminar pattern, to the extent that it is evident at this age, seemed normal in the SNAP-25-deficient brain.
Fig. 1.
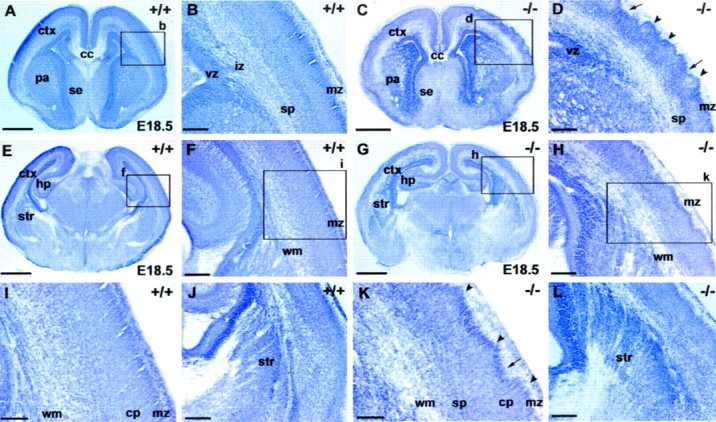
Nissl staining reveals grossly normal development of the telencephalon and diencephalon inSnap25 null mutant mice. Only mild abnormalities in the regularity of the cortical plate were observed in the null mutant. Coronal sections (60 μm) were cut and stained with cresyl violet to reveal major brain structures. The general morphology, cellular distribution, and lamination patterns of WT, heterozygous, and null mutant littermates were compared. A, E, Coronal sections at different rostrocaudal levels of an E18.5 WT brain (+/+). B, F, Higher-magnification views of the boxed areas labeled b andf in A and E, respectively, to demonstrate the normal lamination of the cortex (ctx) at the two levels. I, Detail of theboxed area (i) inF. J, Part of a coronal section from another E18.5 WT brain, showing the patterning of cells of the primordial corpus striatum (str) created by axon bundles of the primitive internal capsule. C, G, Coronal sections at different rostrocaudal levels in theSnap25 null mutant mouse (−/−) at E18.5.D, H, High magnification of the areasboxed in C and G, respectively. Note the abnormal lamination of the cortical plate, particularly in the upper layers and marginal zone (mz), with distinct peaks (arrowheads) and troughs (arrows) along the upper margin of layer 2.K, Detail of the box labeled kin H. Note the abnormal undulation of the upper layers of the cortical plate (arrowheads andarrows). L, View of the cellular patterning created by axonal bundles in the striatum in the null mutant, comparable with that seen in the WT (J). Scale bars: A, C, E,G, 800 μm; B, D,F, J, H, L, 200 μm; I, K, 100 μm.cp, Cortical plate; hp, hippocampus;cc, corpus callosum; se, septal eminence;pa, pallidum; vz, ventricular zone;iz, intermediate zone; sp, subplate;wm, white matter.
Deficit in cortical plate development
The only clearly aberrant feature observed in approximately half of the mutant brains was a curious tangential undulation of the neocortical plate, especially along its upper border with the marginal zone. Although the pial surface was smooth, there were irregular bulges along the top of the cortical plate (Fig.1D,H,K), with reciprocal variations in thickness of the marginal zone. We detected these undulations in 5 of 11 homozygote mutant brains at E18.5, but in none of the heterozygote (five of five) or wild-type (four of four) animals. Of the five mutants exhibiting undulation, two appeared markedly more severe (Fig. 1C,D). These brains also showed significant reduction in calbindin-immunoreactive neurons in neocortex. In the two most extreme cases (Fig. 1D), the undulating pattern extended through the entire thickness of the cortical plate, although it was always more exaggerated along the upper border. The least affected mutants were almost normal in appearance (Figs.2C, 3C,F,I). Moreover, the overall thickness of the cerebral wall and the cortical plate, measured at the convexity of the hemisphere at the mid-hippocampal level, were not affected. For three mutants, one with severe undulations, one moderate, and one without undulations, the measurements were as follows: thickness of cerebral wall 598 ± 25 μm SD; cortical plate 214.6 ± 13 SD. For three HT animals, the values were as follows: cerebral wall: 598 ± 44 μm SD; cortical plate: 221 ± 13.5 μm SD. To compare the levels of cellular proliferation, KO and HT brains were stained with an antibody against phosphorylated histone-H3, which labels cells in metaphase. Similar numbers of immunopositive cells were seen (HT, 21.9 per section; KO, 23.4 per section; n = 2 each genotype; 6–10 sections were counted for each animal), which is consistent with the similarity in cortical thickness.
Fig. 2.

Expression of SNAP-25 (A–F) and L1, marker of early cortical connectivity, is revealed by immunohistochemistry in WT (+/+), HT (+/−), and KO (−/−) brains. A, SNAP-25 immunoreactivity was observed in fiber bundles extending through the corpus striatum and intermediate zone and in the upper segment of the corpus callosum in the WT. D, An enlarged view ofbox d in A. Arrowsindicate labeled fiber bundles in the intermediate zone (iz). B, E, Similar, although less intensive, labeling in the HT brain. C,F, Complete lack of immunoreactivity in these regions in KO littermates. G, H, L1 immunoreactivity is observed in the intermediate zone, striatum, and internal capsule in an E18.5 WT brain. Labeled axon fascicles crossed the striatum (arrows) and turned to the intermediate zone.I, J, No detectable differences were observed in the KO brain. ctx, Cerebral cortex;hp, hippocampus; vz, ventricular zone;iz, intermediate zone. Scale bars:A–C, 200 μm;D–F, 100 μm; G,I, 500 μm; H, J, 200 μm.
Immunohistochemical analysis of cortical neuron populations
SNAP-25 expression
In the normal adult mouse brain, expression of SNAP-25, which is transported by fast axonal transport (Loewy et al., 1991; Hess et al., 1992), is limited primarily to presynaptic terminals. However, during development, SNAP-25 also accumulates in axons (Catsicas et al., 1991; Oyler et al., 1991). To document the expression pattern of SNAP-25 at these early stages of development, we performed immunohistochemistry with a polyclonal antibody anti-SNAP-25 protein in WT, HT, and homozygote null mutant E18.5 embryos. In both WT and HT brains, immunoreactivity was present but generally low, especially in the HT. Within the telencephalon, the strongest labeling was found in fibers in the intermediate zone, at the junction of the cortex and striatum (Fig.2A,B,D,E), which, judged from their position, could correspond to thalamocortical axons. As expected, there was no immunoreactivity for SNAP-25 in the homozygote null mutant brain (Fig. 2C,F). In contrast, immunohistochemical staining for L1, a cell adhesion molecule thought to be expressed specifically on thalamocortical and other diencephalic axons (Godfraind et al., 1988; Fukuda et al., 1997), demonstrated a normal pattern of labeling in the mutant (Fig.2G–J).
Expression of calretinin, reelin, and calbindin
To investigate further for any abnormalities of cortical development, we performed immunohistochemistry for two Ca2+ binding proteins, calretinin and calbindin, which label different, types of interneurons (Hendry and Jones, 1991) as well as early populations of migratory neurons (Parnavelas, 2000). Calretinin is expressed in some cells of the marginal zone (Meyer et al., 1998), and reelin is expressed specifically in Cajal-Retzius cells known to be responsible for the early development of cortical lamination (Ogawa et al., 1995). Calbindin is a useful marker for the majority of tangentially migrating neurons (Parnavelas, 2000).
Similar patterns of immunoreactivity for calretinin were observed in WT, HT, and homozygote null mutant brains at E18.5 in all telencephalic areas (Fig. 3A–F), with no obvious difference in the densities of calretinin cells (WT/HT, 20.9 per section ± 0.5 SD; KO, 19.8 per section ± 0.4 SD). Similarly, there were no significant differences in the numbers of reelin immunoreactive cells (Fig. 3, compare G, Hwith J, K) (WT/HT, 39.2 per section ± 9.6 SD; KO, 27.3 ± 8.6 SD), indicating that the generation of this early cell population was unperturbed. However, in the two null mutants that were strikingly affected morphologically by neocortical undulation, far fewer calbindin-immunoreactive cells were seen in the cortex (Fig. 3M–R), suggesting a selective reduction of tangentially migrating cells. Quantitative analysis comparing these severely affected animals with heterozygote controls in the marginal zone and cortical plate compartments showed that this reduction in fact was significant (marginal zone: KO, 10.5 cells per section ± 0.1 SD compared with HT, 22.6 cells per section ± 1.2 SD, p < 0.001; cortical plate: KO, 14.5 cells per section ± 4.9 SD compared with HT, 50.5 cells per section ± 3.7 SD, p < 0.003).
Fig. 3.

Expression of calretinin (CR) (A–F), reelin (Reln) (G–L), and calbindin (CB) (M–R) revealed by immunohistochemistry in WT (+/+, left column), HT (+/−, middle column), and KO brains (−/−, right column).A–C, Calretinin (CR) is expressed in some cells of the marginal zone (mz), cortical plate (cp), and hippocampus.D–F, Higher-power views of theboxed regions in A–C, respectively, showed no obvious differences in density of calretinin cells. Calretinin immunostaining revealed the undulations at the base of the marginal zone of the null mutant (F,arrows and arrowheads).G–L, Reelin immunostain revealed equal numbers of Cajal-Retzius cells in the cortical marginal zone of the WT and KO (compare G, H withJ, K). Similar density of reelin immunoreactive cells was also detected in the hippocampal fissure (hf) of the hippocampus (compareI, L).M–O, Calbindin (CB) is expressed in several different regions of the telencephalon, including cells of the striatum (str), cortex (ctx), and hippocampus (hp). The general pattern was qualitatively similar in WT (M), HT (N), and KO (O) brains. P–R, Higher-power views of the boxed regions inM–O showing that the density of calbindin-immunoreactive cells is substantially reduced in the KO cortex. wm, White matter; vz, ventricular zone; lv, lateral ventricle; hf, hippocampal fissure. Scale bars: A–C,M–O, 300 μm;D–F, I, L,P–R, 100 μm; G,J, 500 μm; H, K, 50 μm.
Outgrowth of thalamocortical projections
The total gestation period of mice is 19–20 d, compared with 21–22 d in the rat. Hence, although the development of the thalamocortical fiber pathway in the normal mouse is essentially similar to that in rat, each step occurs ∼1–2 d earlier (Molnár et al., 1998a,b). We examined the fine pattern of thalamic axon innervations in brains from normal and null mutant E17.5 and E18.5–E19 embryos from three litters (14 individuals altogether) with carbocyanine dye tracing. Counterstaining with bisbenzimide revealed major anatomical features, such as the pial surface of the cortex, the junction of layers 1 and 2, and the gray matter–white matter boundaries. This, together with the L1 immunostaining, provided further evidence for the grossly normal anatomical appearance of the null mutant brain.
We placed a DiI carbocyanine dye crystal in the dorsolateral aspect of the diencephalon (posterior dorsal thalamus) of both hemispheres to label thalamocortical axons. In WT, HT, and Snap25 null mutant specimens, labeled thalamocortical fibers were present, and their outgrowth had progressed to the same extent, appropriate for the developmental stage. At both E17.5 (Fig.4) and E18.5–E19 (Fig.5), the appearance of afferent axons from the thalamus was essentially indistinguishable among KO, HT, and WT mice. Individual thalamic axons formed an impressively ordered, parallel array throughout their course within the telencephalon. As they passed through the anlage of the corpus striatum, they were organized in parallel, fasciculated bundles, with small groups of axons occasionally crossing from one bundle to another. The fibers defasciculated and turned at the striatocortical boundary, forming a thick band that entered the intermediate zone, running tangentially, without dispersion, toward and into the subplate layer. The axons did not appear to cross each other extensively at any point along their course.
Fig. 4.
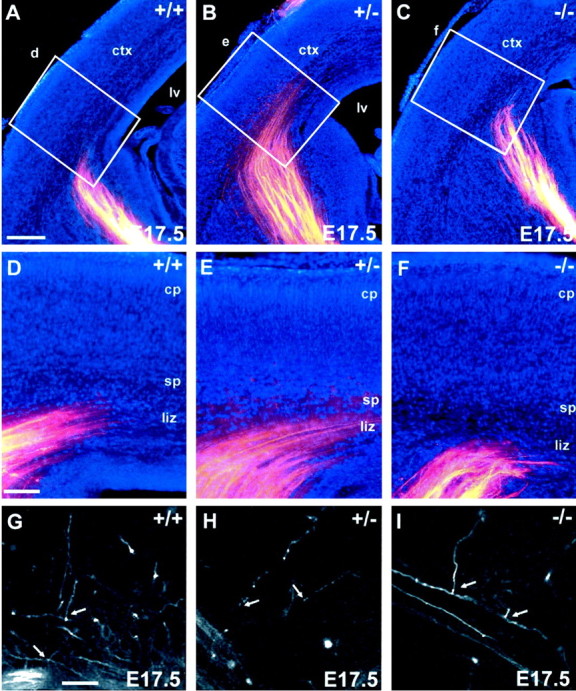
Outgrowth of thalamocortical projections revealed with DiI tracing from the dorsal thalamus in WT (A, D, G), HT (B, E, H), and KO (C, F, I) brains at E17.5. Coronal sections were photographed with two different filters to reveal the DiI label (red) and bisbenzimide counterstain (blue). A–C, In all three genotypes, thalamic axons traversed the primitive internal capsule as an organized array of fiber bundles and then defasciculated and turned dorsally to run through the intermediate zone and into the subplate below the cortex (ctx). Within a single litter, individuals showed slight variation in their maturity, but there was no consistent difference among WT, HT, and Snap25 KO brains in the state of advancement of the thalamocortical fibers.D–F, Higher-power views of theboxes in A–C, showing the indistinguishable patterns of ingrowth of thalamic axons into the cortical plate (cp). Thalamic fibers could also be seen extending through the lower intermediate zone (liz) and into the subplate (sp) layer below the cortical plate. At this stage, axons did not substantially invade the cortical plate: the radial ingrowth of thalamocortical fibers was limited to a few side branches arising in the intermediate zone and subplate.G–I, Confocal microscopic reconstructions revealed side branches of similar form and extent in all three genotypes (arrows). These small side branches of thalamic axons penetrated only the lowest part of the cortical plate. Bisbenzimide counterstaining (blue inA–F) showed major anatomical features, such as the pial surface of the cortex, layer 1, and the gray matter–white matter boundaries. In this particular null mutant brain (C, F), there were no obvious undulations in the cortical plate. Scale bar:A–C, 200 μm;D–F, 100 μm;G–I, 50 μm.
Fig. 5.

Thalamocortical projections, traced with DiI, show similar ingrowth patterns in WT (A, C,E) and KO (B, D,F) brains at E18.5. A–D, Double-exposure photomicrographs of coronal sections showing the DiI-labeled axons (red) and bisbenzimide counterstaining (blue) in the left hemisphere. Thalamic axons exhibited similar fasciculation patterns in the internal capsule (ic) and cortex (ctx) of WT (+/+) and KO (−/−) brains. In both genotypes, axons had started quite substantially to invade the cortical plate (C,D, arrows). E,F, Confocal microscopic reconstructions revealed similar patterns of invasion in the two genotypes. Thalamic projections extended up to the upper third of the cortical plate and began to show branch formation (arrows). Scale bars: A,B, 300 μm; C, D, 200 μm; E, F, 100 μm. dt, Dorsal thalamus; sp, subplate; liz, lower intermediate zone; mz, marginal zone.
At E17.5 (Fig. 4), thalamic axons had traversed the primitive internal capsule and had accumulated within the subplate layer. In the null mutant mice, just as in normals, there was very limited radial ingrowth of thalamocortical fibers into the cortical plate, perhaps because the cortical plate itself is relatively nonpermissive to ingrowth at this age (Götz et al., 1992; Molnár and Blakemore, 1995; Tuttle et al., 1995). Confocal microscopic reconstructions revealed a few short side-branches, with growth cones at their tips, penetrating the lowest part of the plate in the null mutant (Fig.4I), just as in normal mice at this stage (Catalano et al., 1996; Molnár et al. 1998a,b). As described previously (Molnár et al., 1998b), we also saw a small number of axons, some even forming tiny fasciculated bundles, running up obliquely through the entire cortical plate and entering the marginal zone.
At E18.5–E19 in WT, HT, and KO brains, there was substantially more invasion of the cortical plate by thalamic axons and their side branches (Fig. 5), some extending radially through virtually the entire thickness of the plate.
Topography of embryonic corticofugal and thalamocortical connectivity
We used multiple dye placements, in parasagittal or coronal rows across the cortical hemisphere at E18.5, to examine the global topography of fiber pathways (Molnár et al., 1998a,b), and we documented the trajectory and distribution of the labeled fiber bundles and backlabeled thalamic cell groups. Each crystal labeled a group of axons, forming a discrete, fairly tight bundle, and the spatial relationships of the separate labeled bundles was maintained throughout their path (Fig.6G–J). The labeled axons followed straight or slightly curved trajectories as they formed a fan-shaped array, converging on the primitive internal capsule, always maintaining topography correlated with the spatial separation of their sites of origin. As seen in Figure 6, the bundles of axons labeled by the different dyes stayed separate from each other, even as they passed through the constriction of the primitive internal capsule, and they could be traced back within the diencephalon to separate groups of backlabeled thalamic cells (Fig.6A–F).
Fig. 6.

Tracing with DiI and DiA from multiple cortical crystal placement sites revealed the normal topography of thalamocortical and corticofugal projections at E18.5 in both WT (A, C, D,G, I) and Snap25null mutant (B, E, F,H, J). Two crystals of DiI (red) were implanted in a parasagittal row in the cortex (ctx) of the left hemisphere of WT (A) and KO (B) brains, and one crystal of DiA (green) was placed midway between the DiI placements (shown schematically in top left). Horizontal sections were counterstained with bisbenzimide. Triple-exposure pictures were taken on a fluorescence microscope (A, B, G,H) or a confocal microscope (C–F, I,J). The trajectory and distribution of the labeled fiber bundles and backlabeled thalamic cell groups were documented at different horizontal levels. A,B, Low-power images show the fiber bundles in both the cortex (top right) and the dorsal thalamus (dt) (bottom left) in horizontal sections corresponding to the red box in the schematic diagram above (rostral is to the right). Each crystal labeled a discrete group of axons (a, a′ andc, c′ labeled with DiI; b,b′ labeled with DiA). The spatial arrangement of the separate labeled bundles was maintained throughout their path, with a 90° rotation of the array between telencephalon and diencephalon.C, Higher-power confocal image, corresponding to thebox in A. D, Detailed images of the box in C, showing discrete groups of labeled thalamic cells at the tip of the axons (arrows mark individual cells). E,F, Confocal images, comparable in position and scale with C and D, respectively, from other similarly treated null mutant brains. G,H, Low-power views of more ventral sections. The bundles labeled by the different dyes stayed separate from each other, even as they passed through the constriction of the primitive internal capsule (ic). I, Higher-power confocal image of the box in G, showing fiber bundles at the level of the primitive internal capsule. J, Higher-power image of fiber bundles passing through the internal capsule from a null mutant. Scale bars: A,B, G, H, 200 μm;I, J, 100 μm; shown onC: C, E, 100 μm;D, 40 μm. hp, Hippocampus.
A crystal placed in the cortex at E18.5 labels not only thalamocortical axons but also corticothalamic and other corticofugal projections. In Figure 7, corticothalamic fibers can be seen separating from the other descending corticofugal projections, which deviate ventrally on their way toward the cerebral peduncle. The segregation of staining by the different dyes along the entire extent of the fiber pathways provides clear evidence that all fiber projections to and from the cortex maintain their initial order and relationships along their entire course through the telencephalon and diencephalon.
Fig. 7.
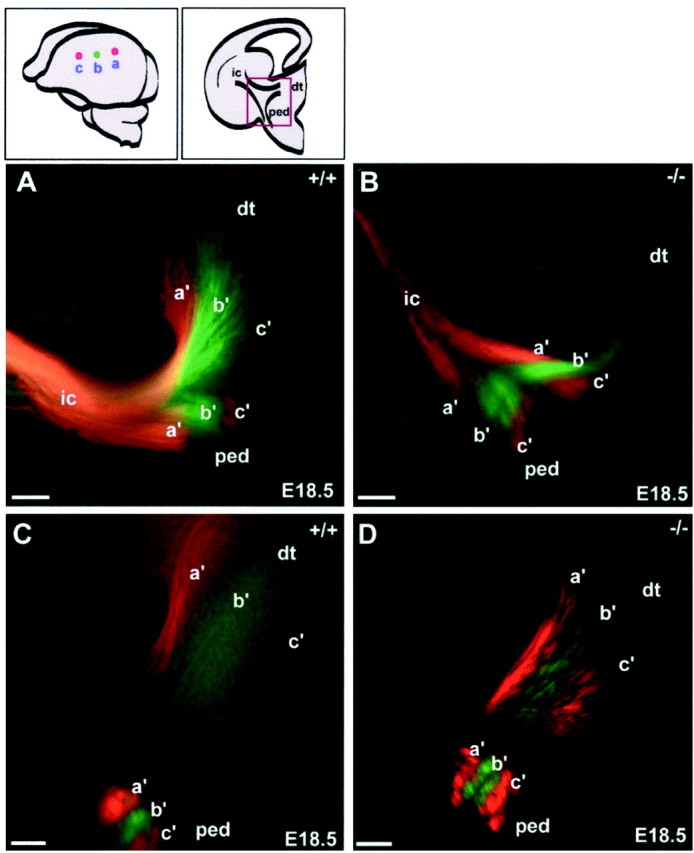
Topography of thalamic and corticofugal connectivity at E18.5. A parasagittal row of crystals (DiI, DiA, DiI) was implanted in the left hemisphere (schematic illustration,top left) of WT (A, C) andSnap25 KO (B, D) brains. At this age, each crystal labeled both thalamocortical axons (retrogradely) and corticofugal fibers (anterogradely).A, B, Confocal micrographs at the level of the primitive internal capsule, as indicated by the red box in the schematic coronal section above (dorsal isup). As the mixed array of corticofugal fibers enters the diencephalon (A, B,right), the descending corticofugal axons diverge from the bundle of corticothalamic and thalamocortical fibers and turn toward the cerebral peduncle (ped). Axons stained from the three crystal placements are labeled a′,b′ (DiA), and c′ (DiI). C,D, At a more caudal level, the labeled bundles entering the cerebral peduncle have separated from those entering the dorsal thalamus (dt). Scale bars:A–D, 100 μm.
Electrophysiology
We used electrophysiological methods to confirm that thalamic axons were not only present in the cortical plate of the mutant mice but were capable of conducting action potentials. In E18.5 whole forebrain slices, we stimulated the VB complex of the thalamus and recorded in the putative somatosensory cortex. These records provided clear evidence for transmission of APs along thalamocortical axons in both null mutant and normal mouse brains. Figure8 shows representative examples of field potentials recorded in the cortex of an HT mouse (in which synaptic transmission is intact) (Washbourne et al., 2002) and a homozygous null mutant mouse. The responses are indistinguishable except for a difference in the form of the stimulus artifact, which was caused simply by a difference in the stimulating polarity. Essentially identical results were obtained in slices from a total of two WT, three HT, and four KO animals. In every case, we were able to record field potentials within the cortical plate after thalamic stimulation, regardless of the stimulation charge polarity. In two of the HT and two of the homozygote mutant slices, we applied 40 μm CNQX, 10 μm MK801, and 20 μm bicuculline to block glutamatergic and GABAA synaptic transmission. In each instance, as in the examples in Figure 8, the field potential was not obviously altered and therefore was caused presumably entirely by presynaptic activity. In one WT, two HT, and three homozygote mutant slices, after recording a stable field potential, we applied 600 nm TTX to block Na+channel-dependent conduction. In every instance, as in the examples in Figure 8, the field potential was eliminated. These results indicate that at this stage of development, thalamic axons are capable of AP propagation, both in null mutant and normal brains, but they have yet to establish detectable, functional synaptic connections within the cortical plate, even in WT mice. Previously, Higashi et al. (2002)showed, using optical recordings with voltage-sensitive dyes, that direct thalamic stimulation can elicit sustained postsynaptic depolarizations in embryonic thalamocortical slices; however, current source density analyses, like our field potential recordings, were unable unequivocally to demonstrate glutamate receptor- mediated postsynaptic responses (Molnár et al., 2002). This suggests that fields generated by extracellular current flow from synaptic potentials are likely to be small and less synchronous and therefore not sufficient to demonstrate the few synaptic connects that may be made at this time.
DISCUSSION
Evoked neurotransmitter release at chemical synapses is mediated by the SNARE core complex, of which SNAP-25 is an essential component. Null mutation of the Snap25 gene results in a complete loss of stimulus-dependent synaptic transmission while sparing the exocytotic mechanisms that support AP-independent spontaneous neurosecretion (Washbourne et al., 2002). Hence, the Snap25null mutant allowed us to examine the extent to which the mouse forebrain develops in the absence of evoked neurotransmitter release. Abolition of evoked neurotransmission eliminates neuromuscular function, hence preventing diaphragm contraction and respiration. This probably accounts for the perinatal morbidity of SNAP-25-deficient fetuses (although other more widespread deficits caused by the lack of regulated secretion might contribute). Our study was limited, then, to prenatal development.
The lack of overt pathology in the formation of most tissues suggests that SNAP-25-deficient fetuses develop fairly normally. The morphological appearance of the null mutant is clearly distinct, however, from that of normal fetuses at E17.5–E19, which may be attributable primarily to abnormal neuromuscular development. Importantly, as shown previously (Washbourne et al., 2002) and demonstrated more extensively here, the loss of evoked synaptic activity does not prevent the grossly normal formation of the brain. As evidenced by Nissl staining, cellular proliferation, migration, differentiation, lamination, and neuronal survival seem mostly normal in the Snap25 null mutant. In particular, the spatial distribution and structural aspects of neurons appear unaltered, and the main features of the diencephalon and telencephalon develop normally. Moreover, we find no evidence of widespread neurodegeneration in the absence of evoked neurotransmission. This contrasts with the significant cell death found in the nsec-1/munc18–1 mutant, which lacks both evoked and AP-independent neurotransmitter release (Verhage et al., 2000). This strongly suggests that stimulus-independent secretion of transmitters or growth factors is sufficient to validate and maintain neuronal populations during development.
The only deficits that we saw in the KO mouse, at the light-microscopic level, were the relative reduction in density of calbindin-positive neurons (but not of calretinin-positive cells) in the cortex and the strange undulations of the cortical plate in some Snap25null mutants.
Analysis of thalamocortical fiber projections with carbocyanine dyes revealed normal growth kinetics, fasciculation patterns, and topography in the E17.5–E19 null mutant brain. Thalamocortical axons reach the cortex by their normal route, accumulate below the cortical plate, and then begin to form side branches in the subplate and the deep cortical plate, just as in the wild-type brain. We detected no abnormality in the pattern or timing of their entry into the cortical plate in the null mutant. Thus, thalamocortical axonal projection and the early steps necessary for proper targeting proceed without evoked neurotransmitter release. It is interesting to compare our results with those of Harris (1984), who found roughly normal retinotopic topography in the tectum of axolotls, which, before retinal axon outgrowth, had been parabiotically joined to TTX-secreting Californian newts. Hence retinal axons in amphibians are also capable of finding the target in the absence of impulse activity, although they often took unusual routes.
The apparently normal growth of thalamocortical fibers might be thought to contradict evidence that inhibition of SNAP-25 by antisense oligonucleotides or clostridial neurotoxins causes growth cone collapse and inhibition of axonal growth, in vitro and in vivo (Osen-Sand et al., 1993, 1996). However, such inhibition of SNAP-25 expression in the chick retina affects primarily the length and terminal differentiation of outgrowing amacrine cell processes and not the direction of their growth or the general morphology of the neurons (Osen-Sand et al., 1993). This may reflect functions of SNAP-25 at late stages of elongation when it appears to be expressed mainly in axonal growth cones (Oyler et al., 1989, 1991, Osen-Sand et al., 1993). SNAP-25-deficient motoneurons are certainly able to successfully innervate neuromuscular targets and generate AP-independent miniature endplate potentials, and spontaneous postsynaptic activity can be recorded from cortical slices and cultured hippocampal neurons. These results demonstrate that, in general, SNAP-25 and hence evoked neurotransmission are not required to assemble the cellular processes for the initial stages in synaptogenesis (Washbourne et al., 2002). The ability of SNAP-25-deficient neurons to locate their targets and establish initial contacts, in the absence of evoked synaptic activity, provides an important insight into decision-making mechanisms during the development of connectivity. The results also provide further evidence that the membrane addition necessary for axonal extension occurs independent of the neurosecretory machinery (Leoni et al., 1999;Schoch et al., 2002; Washbourne et al., 2002).
The observation, in many mammals, that axons from the thalamus temporarily pause or halt when they reach the cortical subplate, before substantially invading the cortical plate, has led to the idea that some recognition process, critical for future ingrowth, occurs during this “waiting period” (Rakic, 1976; Shatz et al., 1990). Catalano and Shatz (1998) have demonstrated that blockade of activity with TTX in neonatal ferrets causes disruption of projections from lateral geniculate nucleus to visual cortex (which develop relatively late in ferrets), and they suggested that the recognition process during the waiting period requires impulse activity. However, we found that in theSnap25 null mutant mouse, thalamic axons not only elongate, with proper spatiotemporal relationships, but also arrive, pause in the subplate, and invade the cortical plate quite normally. This strongly supports the probability that the formation of thalamocortical projections and the initial ingrowth of thalamic axons to the appropriate cortical region do not rely on AP-dependent synaptic transmission, within the subplate or elsewhere.
It is conceivable that the results of Catalano and Shatz (1998)represent a distinct effect of TTX beyond the elimination of APs: possibly the impairment of postsynaptic signaling of subplate neurons in response to spontaneous transmitter release from thalamic axons. On the other hand, the apparent difference in results might be explained simply by the fact that we were able to examine only the initial stages of the targeting process. Because we were limited to observing prenatal brain development, before the formation of functional connections in layer 4, we cannot resolve whether synaptic transmission is needed for thalamocortical axons to innervate their appropriate target neurons precisely. Indeed, a host of evidence suggests that AP-dependent neurotransmitter release is important for the refinement of topography that occurs when these projections reach their final targets (Stryker and Harris, 1986), as well as for the activity-dependent differentiation of cortical architecture (Hannan et al., 2001).
Our electrophysiological observations show that the thalamic axons themselves are functional, in that they are able to transmit sodium channel-dependent, TTX-sensitive APs. The similarity of field potentials in the cortex of normal and null mutant mice also supports the conclusion that thalamic fibers are similarly distributed within the plate. Because glutamate receptor blockers produced no change in cortical field potentials in any genotype, we conclude that, at E18.5, studied with extracellular recording, there is no detectable synaptic transmission within the cortical plate of the mouse. This issue will need to be addressed with intracellular and optical recordings (Higashi et al., 2002).
SNAP-25-deficient neurons are able to generate spontaneous AP-independent neurotransmitter release (Washbourne et al., 2002). This alone may be sufficient to mediate intercellular recognition processes within the subplate or the cortical plate or along the route from the thalamus. Although synaptic contacts formed in the null mutant are unable to evoke postsynaptic APs, they may be able to communicate sufficiently via constitutive secretion of transmitter or possibly neurotrophins.
Recent evidence suggests that the Slit family of chemorepellant proteins plays a major role in axonal guidance of central fiber pathways, including thalamocortical projections (Bagri et al., 2002). Our findings (in the SNAP-25-deficient mutant) are consistent with the notion that the secretion of Slit proteins to form repulsive gradients, which act in conjunction with attractive cues and dictate the trajectory of axon pathways, does not require evoked synaptic activity but is mediated via constitutive, AP-independent mechanisms.
Further work is needed to determine whether the reduction of calbindin-expressing neurons, which coincides with the most severe morphological deficits (undulations) in the upper cortical plate of roughly 20% of the mutants, is caused directly by the absence of evoked transmitter release, as well as the identity of any transmitters involved. It is known that migrating cortical neurons express functional receptors (Métin et al., 2000;López-Bendito et al., 2002), and blockade of these receptors alters cortical migration (Behar et al., 2001). Accordingly, corticofugal projections might provide presynaptic AP-dependent signaling as they make intimate contact with these migrating neurons (Métin et al., 2000; Denaxa et al., 2001). It is possible, then, that the absence of AP-mediated transmitter release interferes somewhat with the radial migration of excitatory cortical neurons (hence generating the irregular lamination) as well as with the tangential migration of calbindin cells.
Neurotransmitter secretion along growing nerve processes is clearly evident in developing neurons (Zakharenko et al., 1999). During development there may be a gradual transition from mechanisms dependent only on constitutive secretion, mediated by exocytotic machinery that does not require the SNARE complex, to later processes in which regulated transmitter release controls the formation of mature synapses and modulates functional synaptic plasticity.
Z.M. and G.L.-B. contributed equally to this work.
This work was supported by the National Institutes of Health (Grant MH 48989; M.C.W.), the Oxford McDonnell Centre for Cognitive Neuroscience (North American Network Grant; Z.M., M.C.W.), the Swiss National Science Foundation (Grant 3100-56032.98; Z.M.), the European Community (Grant QLRT-1999-30158; Z.M.), and The Wellcome Trust (Grant 063974/B/01/Z; Z.M.). We are very grateful to Rosalind Carney and Courtney Voelker for thoughtful comments on this manuscript, James R. Mathews and Lynden Guiver for excellent technical support, and Sayuri Nixon for genotyping. We also thank Dr. Nathalie Garin-Schwaller for help with Figure 3G–I. Inquiries about Snap25null mutant mice should be addressed to M.C.W.
Correspondence should be addressed to Zoltán Molnár, Department of Human Anatomy and Genetics, University of Oxford, South Parks Road, Oxford, OX1 3QX, UK. E-mail:zoltan.molnar@anat.ox.ac.uk.
REFERENCES
- 1.Agmon A, Yang LT, O'Dowd DK, Jones EG. Organized growth of thalamocortical axons from the deep tier of terminations into layer IV of developing mouse barrel cortex. J Neurosci. 1993;13:5365–5382. doi: 10.1523/JNEUROSCI.13-12-05365.1993. [DOI] [PMC free article] [PubMed] [Google Scholar]
- 2.Bagri A, Martin O, Plump AS, Mak J, Pleasure SJ, Rubenstein JL, Tessier-Lavigne M. Slit proteins prevent midline crossing and determine the dorsoventral position of major axonal pathways in the mammalian forebrain. Neuron. 2002;33:233–248. doi: 10.1016/s0896-6273(02)00561-5. [DOI] [PubMed] [Google Scholar]
- 3.Behar TN, Smith SV, Kennedy RT, McKenzie JM, Maric I, Barker JL. GABA(B) receptors mediate motility signals for migrating embryonic cortical cells. Cereb Cortex. 2001;11:744–753. doi: 10.1093/cercor/11.8.744. [DOI] [PubMed] [Google Scholar]
- 4.Catalano SM, Shatz CJ. Activity-dependent cortical target selection by thalamic axons. Science. 1998;281:559–562. doi: 10.1126/science.281.5376.559. [DOI] [PubMed] [Google Scholar]
- 5.Catalano SM, Robertson RT, Killackey HP. Individual axon morphology and thalamocortical topography in developing rat somatosensory cortex. J Comp Neurol. 1996;367:36–53. doi: 10.1002/(SICI)1096-9861(19960325)367:1<36::AID-CNE4>3.0.CO;2-K. [DOI] [PubMed] [Google Scholar]
- 6.Catsicas S, Larhammer A, Blomqvist A, Sanna PP, Milner RJ, Wilson MC. Expression of a conserved cell-type-specific protein in nerve terminals coincides with synaptogenesis. Proc Natl Acad Sci USA. 1991;188:785–789. doi: 10.1073/pnas.88.3.785. [DOI] [PMC free article] [PubMed] [Google Scholar]
- 7.Caviness VS., Jr . Architecture and development of the thalamocortical projection in the mouse. In: Bentivoglio M, Spereafico R, editors. Cellular thalamic mechanisms. Excertpa Medica; New York: 1988. pp. 489–499. [Google Scholar]
- 8.de Bergeyck V, Naerhuyzen B, Goffinet AM, Lambert de Rouvroit C. A panel of monoclonal antibodies against reelin, the extracellular matrix protein defective in reeler mutant mice. J Neurosci Methods. 1998;82:17–24. doi: 10.1016/s0165-0270(98)00024-7. [DOI] [PubMed] [Google Scholar]
- 9.Denaxa M, Chan CH, Schachner M, Parnavelas JG, Karagogeos D. The adhesion molecule TAG-1 mediates the migration of cortical interneurons from the ganglionic eminence along the corticofugal fiber system. Development. 2001;128:4635–4644. doi: 10.1242/dev.128.22.4635. [DOI] [PubMed] [Google Scholar]
- 10.Erzurumlu RS, Kind PC. Neural activity: sculptor of “barrels” in the neocortex. Trends Neurosci. 2001;24:589–595. doi: 10.1016/s0166-2236(00)01958-5. [DOI] [PMC free article] [PubMed] [Google Scholar]
- 11.Friauf E, Shatz CJ. Changing patterns of synaptic input to subplate and cortical plate. J Neurophysiol. 1991;66:2059–2071. doi: 10.1152/jn.1991.66.6.2059. [DOI] [PubMed] [Google Scholar]
- 12.Fukuda T, Kawano H, Ohyama K, Li HP, Takeda Y, Oohira A, Kawamura K. Immunohistochemical localization of neurocan and L1 in the formation of thalamocortical pathway of developing rats. J Comp Neurol. 1997;382:141–152. [PubMed] [Google Scholar]
- 13.Ghosh A, Shatz CJ. Pathfinding and target selection by developing geniculocortical axons. J Neurosci. 1992a;12:39–55. doi: 10.1523/JNEUROSCI.12-01-00039.1992. [DOI] [PMC free article] [PubMed] [Google Scholar]
- 14.Ghosh A, Shatz CJ. Involvement of subplate neurons in the formation of ocular dominance columns. Science. 1992b;255:1441–1443. doi: 10.1126/science.1542795. [DOI] [PubMed] [Google Scholar]
- 15.Girod R, Popov S, Alder J, Zheng JQ, Lohof A, Poo MM. Spontaneous quantal transmitter secretion from myocytes and fibroblasts: comparison with neuronal secretion. J Neurosci. 1995;15:2826–2838. doi: 10.1523/JNEUROSCI.15-04-02826.1995. [DOI] [PMC free article] [PubMed] [Google Scholar]
- 16.Godement P, Vanselow J, Thanos S, Bonhoeffer F. A study in developing visual systems with a new method of staining neurones and their processes in fixed tissue. Development. 1987;101:697–713. doi: 10.1242/dev.101.4.697. [DOI] [PubMed] [Google Scholar]
- 17.Godfraind C, Schachner M, Goffinet AM. Immunohistochemical localization of cell adhesion molecules L1, J1, N-CAM and their common carbohydrate L2 in the embryonic cortex of normal and reeler mice. Dev Brain Res. 1988;42:99–111. doi: 10.1016/0165-3806(88)90205-2. [DOI] [PubMed] [Google Scholar]
- 18.Götz M, Novak N, Bastmeyer M, Bolz J. Membrane-bound molecules in rat cerebral cortex regulate thalamic innervation. Development. 1992;116:507–519. [Google Scholar]
- 19.Hannan AJ, Blakemore C, Katsnelson A, Vitalis T, Huber KM, Bear M, Roder J, Kim MD, Shin H-S, Kind P. PLC-β1, activated via mGluRs, mediates activity-dependent differentiation in cerebral cortex. Nat Neurosci. 2001;4:282–288. doi: 10.1038/85132. [DOI] [PubMed] [Google Scholar]
- 20.Harris WA. Axonal pathfinding in the absence of normal pathways and impulse activity. J Neurosci. 1984;4:1153–1162. doi: 10.1523/JNEUROSCI.04-04-01153.1984. [DOI] [PMC free article] [PubMed] [Google Scholar]
- 21.Hendry SH, Jones EG. GABA neuronal subpopulations in cat primary auditory cortex: co-localization with calcium binding proteins. Brain Res. 1991;8:45–55. doi: 10.1016/0006-8993(91)91046-4. [DOI] [PubMed] [Google Scholar]
- 22.Hess DT, Slater TM, Wilson MC, Skene JHP. The 25 kD synaptosomal-associated protein SNAP-25 is the major methionine-rich peptide in rapid axonal transport and a major substrate for palmitoylation in the adult CNS. J Neurosci. 1992;13:4634–4641. doi: 10.1523/JNEUROSCI.12-12-04634.1992. [DOI] [PMC free article] [PubMed] [Google Scholar]
- 23.Hevner RF, Shi L, Justice N, Hsueh Y, Sheng M, Smiga S, Bulfone A, Goffinet AM, Campagnoni AT, Rubenstein JL. Tbr1 regulates differentiation of the preplate and layer 6. Neuron. 2001;29:353–366. doi: 10.1016/s0896-6273(01)00211-2. [DOI] [PubMed] [Google Scholar]
- 24.Higashi S, Molnár Z, Kurotani T, Inokawa H, Toyama K. Functional thalamocortical connections start to develop during embryonic period in the rat: an optical recording study. Soc Neurosci Abstr. 1996;22:775.2. [Google Scholar]
- 25.Higashi S, Molnár Z, Kurotani T, Inokawa H, Toyama K (2002) Functional thalamocortical connections develop during embryonic period in the rat: an optical recording study. Neuroscience, in press.
- 26.Katz LC, Shatz CJ. Synaptic activity and the construction of cortical circuits. Science. 1996;274:1133–1138. doi: 10.1126/science.274.5290.1133. [DOI] [PubMed] [Google Scholar]
- 27.Krug K, Smith AL, Thompson ID. The development of topography in the hamster geniculo-cortical projection. J Neurosci. 1998;18:5766–5776. doi: 10.1523/JNEUROSCI.18-15-05766.1998. [DOI] [PMC free article] [PubMed] [Google Scholar]
- 28.Leoni C, Menegon A, Benfenati F, Toniolo D, Pennuto M, Valtorta F. Neurite extension occurs in the absence of regulated exocytosis in PC12 subclones. Mol Biol Cell. 1999;10:2919–2931. doi: 10.1091/mbc.10.9.2919. [DOI] [PMC free article] [PubMed] [Google Scholar]
- 29.Loewy A, Liu WS, Baitinger C, Willard MB. The major 35S-methionine-labeled rapidly transported protein (superprotein) is identical to SNAP-25, a protein of synaptic terminals. J Neurosci. 1991;11:3412–3421. doi: 10.1523/JNEUROSCI.11-11-03412.1991. [DOI] [PMC free article] [PubMed] [Google Scholar]
- 30.López-Bendito G, Shigemoto R, Kulik A, Paulsen O, Fairen A, Lujan R. Expression and distribution of metabotropic GABA receptor subtypes GABABR1 and GABABR2 during rat neocortical development. Eur J Neurosci. 2002;15:1766–1778. doi: 10.1046/j.1460-9568.2002.02032.x. [DOI] [PubMed] [Google Scholar]
- 31.Métin C, Denizot JP, Ropert N. Intermediate zone cells express calcium-permeable AMPA receptors and establish close contact with growing axons. J Neurosci. 2000;20:696–708. doi: 10.1523/JNEUROSCI.20-02-00696.2000. [DOI] [PMC free article] [PubMed] [Google Scholar]
- 32.Meyer G, Soria JM, Martinez-Galan JR, Martin-Clemente B, Fairen A. Different origins and developmental histories of transient neurons in the marginal zone of the fetal and neonatal rat cortex. J Comp Neurol. 1998;397:493–518. [PubMed] [Google Scholar]
- 33.Molnár Z, Blakemore C. How do thalamic axons find their way to the cortex? Trends Neurosci. 1995;18:389–397. doi: 10.1016/0166-2236(95)93935-q. [DOI] [PubMed] [Google Scholar]
- 34.Molnár Z, Hannan A. Development of thalamocortical projections in normal and mutant mice. In: Goffinet A, Rakic P, editors. Mouse brain development. Springer; New York: 2000. pp. 293–332. [DOI] [PubMed] [Google Scholar]
- 35.Molnár Z, Adams R, Blakemore C. Mechanisms underlying the establishment of topographically ordered early thalamocortical connections in the rat. J Neurosci. 1998a;18:5723–5745. doi: 10.1523/JNEUROSCI.18-15-05723.1998. [DOI] [PMC free article] [PubMed] [Google Scholar]
- 36.Molnár Z, Adams R, Goffinet AM, Blakemore C. The role of the first postmitotic cells in the development of thalamocortical fiber ordering in the reeler mouse. J Neurosci. 1998b;18:5746–5785. doi: 10.1523/JNEUROSCI.18-15-05746.1998. [DOI] [PMC free article] [PubMed] [Google Scholar]
- 37.Molnár Z, Higashi S, Adams R, Toyama K. Earliest thalamocortical interactions. In: Kossut M, editor. Plasticity of adult barrel cortex. F. P. Graham; Johnson City, TN: 2000. pp. 45–77. [Google Scholar]
- 38.Molnár Z, Kurotani T, Higashi S, Toyama K (2002) Development of functional thalamocortical synapses studied with current source density analysis in whole forebrain slices. Brain Res Bull, in press. [DOI] [PubMed]
- 39.Naegele JR, Jhaveri S, Schneider GE. Sharpening of topographical projections and maturation of geniculocortical axon arbors in the hamster. J Comp Neurol. 1988;277:593–607. doi: 10.1002/cne.902770411. [DOI] [PubMed] [Google Scholar]
- 40.Ogawa M, Miyata T, Nakajima K, Yagyu K, Seike M, Ikenaka K, Yamamoto H, Mikoshiba K. The reeler gene-associated antigen on Cajal-Retzius neurons is a crucial molecule for laminar organization of cortical neurons. Neuron. 1995;14:899–912. doi: 10.1016/0896-6273(95)90329-1. [DOI] [PubMed] [Google Scholar]
- 41.Osen-Sand A, Catsicas M, Staple JK, Jones KA, Ayala G, Knowles J, Grenningloh G, Catsicas C. Inhibition of axonal growth by SNAP-25 antisense oligonucleotides in vitro and in vivo. Nature. 1993;364:445–448. doi: 10.1038/364445a0. [DOI] [PubMed] [Google Scholar]
- 42.Osen-Sand A, Staple JK, Naldi E, Schiavo G, Rossetto O, Petitpierre S, Malgaroli A, Montecucco C, Catsicas S. Common and distinct fusion proteins in axonal growth and transmitter release. J Comp Neurol. 1996;367:222–234. doi: 10.1002/(SICI)1096-9861(19960401)367:2<222::AID-CNE5>3.0.CO;2-7. [DOI] [PubMed] [Google Scholar]
- 43.Oyler GA, Higgins GA, Hart RA, Battenberg E, Billingsley M, Bloom FE, Wilson MC. The identification of a novel synaptosomal-associated protein, SNAP-25, differentially expressed by neuronal subpopulations. J Cell Biol. 1989;109:3039–3052. doi: 10.1083/jcb.109.6.3039. [DOI] [PMC free article] [PubMed] [Google Scholar]
- 44.Oyler GA, Polli JW, Wilson MC, Billingsley ML. Developmental expression of the 25-kDa synaptosomal-associated protein (SNAP-25) in rat brain. Proc Natl Acad Sci USA. 1991;88:5247–5251. doi: 10.1073/pnas.88.12.5247. [DOI] [PMC free article] [PubMed] [Google Scholar]
- 45.Parnavelas JG. The origin and migration of cortical neurones: new vistas. Trends Neurosci. 2000;23:126–131. doi: 10.1016/s0166-2236(00)01553-8. [DOI] [PubMed] [Google Scholar]
- 46.Rakic P. Prenatal genesis of connections subserving ocular dominance in the rhesus monkey. Nature. 1976;261:467–471. doi: 10.1038/261467a0. [DOI] [PubMed] [Google Scholar]
- 47.Schoch S, Castillo PE, Jo T, Mukherjee K, Geppert M, Wang Y, Schmitz F, Malenka RC, Sudof TC. RIM1alpha forms a protein scaffold for regulating neurotransmitter release at the active zone. Nature. 2002;415:321–326. doi: 10.1038/415321a. [DOI] [PubMed] [Google Scholar]
- 48.Shatz CJ, Ghosh A, McConnell SK, Allendoerfer KL, Friauf E, Antonini A. Pioneer neurons and target selection in cerebral cortical development. Cold Spring Harbor Symp Quant Biol. 1990;55:469–480. doi: 10.1101/sqb.1990.055.01.046. [DOI] [PubMed] [Google Scholar]
- 49.Stryker MP, Harris WA. Binocular impulse blockade prevents the formation of ocular dominance columns in cat visual cortex. J Neurosci. 1986;6:2117–2133. doi: 10.1523/JNEUROSCI.06-08-02117.1986. [DOI] [PMC free article] [PubMed] [Google Scholar]
- 50.Südhof TC. The synaptic vesicle cycle: a cascade of protein-protein interactions. Nature. 1995;375:645–653. doi: 10.1038/375645a0. [DOI] [PubMed] [Google Scholar]
- 51.Tuttle R, Schlaggar BL, Braisted JE, O'Leary DDM. Maturation-dependent upregulation of growth-promoting molecules in developing cortical plate controls thalamic and cortical neurite growth. J Neurosci. 1995;15:3039–3052. doi: 10.1523/JNEUROSCI.15-04-03039.1995. [DOI] [PMC free article] [PubMed] [Google Scholar]
- 52.Verderio C, Coco S, Pravettoni E, Bacci A, Matteoli M. Synaptogenesis in hippocampal cultures. Cell Mol Life Sci. 1999;55:1448–1462. doi: 10.1007/s000180050384. [DOI] [PMC free article] [PubMed] [Google Scholar]
- 53.Verhage M, Maia AS, Plomp JJ, Brussaard AB, Heeroma JH, Vermeer H, Toonen RF, Hammer RE, van den Berg TK, Missler M, Geuze HJ, Sudhof TC. Synaptic assembly of the brain in the absence of neurotransmitter secretion. Science. 2000;287:864–869. doi: 10.1126/science.287.5454.864. [DOI] [PubMed] [Google Scholar]
- 54.Washbourne P, Thompson PM, Carta M, Costa ET, Mathews JR, López-Bendito G, Molnár Z, Becher MW, Valenzuela CF, Partridge LD, Wilson MC. Genetic ablation of the t-SNARE SNAP-25 distinguishes mechanisms of neuroexocytosis. Nat Neurosci. 2002;5:19–26. doi: 10.1038/nn783. [DOI] [PubMed] [Google Scholar]
- 55.Zakharenko S, Chang S, O'Donoghue M, Popov SV. Neurotransmitter secretion along growing nerve processes: comparison with synaptic vesicle exocytosis. J Cell Biol. 1999;144:507–518. doi: 10.1083/jcb.144.3.507. [DOI] [PMC free article] [PubMed] [Google Scholar]