

Abstract
This report describes a projection from the amygdala, a forebrain center mediating emotional expression, to the inferior colliculus (IC), the midbrain integration center of the ascending auditory system. In the IC of mustached bats (Pteronotus parnellii) and pallid bats (Antrozous pallidus), we placed deposits of retrograde tracers at physiologically defined sites and then searched for retrogradely labeled somata in the forebrain. Labeling was most sensitive in experiments using cholera toxin B-subunit as tracer.
We consistently observed retrograde labeling in a single amygdalar subdivision, the magnocellular subdivision of the basal nucleus (Bmg). The Bmg is distinctive across mammals, containing the largest cells in the amygdala and the most intense acetylcholinesterase staining. Labeled amygdalar cells occurred ipsilateral and contralateral to IC deposits, but ipsilateral labeling was greater, averaging 72%. Amygdalar labeling was observed after tracer deposits throughout the IC, including its central nucleus (ICC). In comparison, labeling in the auditory cortex (layer V) was heavily ipsilateral (averaging 92%). Cortical labeling depended on the location of IC deposits: dorsomedial deposits resulted in the most labeled cells, whereas ventrolateral deposits labeled few or no cortical cells. Cortical labeling occurred after several deposits in the ICC. Across experiments, the average number of labeled cells in the amygdala was similar to that in the auditory cortex, indicating that the amygdalocollicular projection is significant.
The results demonstrate a direct, widespread projection from the basal amygdala to the IC. They also suggest the presence of a rapid thalamoamygdalocollicular feedback circuit that may impose emotional content onto processing of sensory stimuli at a relatively low level of an ascending sensory pathway.
Keywords: amygdala, auditory pathways, auditory cortex, bat, chiroptera, cholera toxin, emotion, inferior colliculus
The amygdala is a collection of diverse, interconnected nuclei (Johnston, 1923; Pitkänen et al., 1997; Swanson and Petrovich, 1998) that impart appropriate emotional import to biologically relevant sensory stimuli. Its functions include learning the emotional significance of sensory input, attentional and motivational processing, and mediating autonomic responses to emotion-laden stimuli (Gloor, 1972; Kaada, 1972; Cahill and McGaugh, 1998; LeDoux, 2000). To support these functions, the amygdaloid nuclei receive extensive sensory input from unimodal and polymodal sensory cerebral cortices (Price et al., 1987; McDonald, 1998; Stefanacci and Amaral, 2000) and from some subcortical sensory structures (LeDoux et al., 1985; Yasui et al., 1987; Linke et al., 1999). In turn, amygdaloid nuclei project to sensory association cortices (Krettek and Price, 1977a; Amaral and Price, 1984; Iwai and Yukie, 1987), to forebrain areas associated with emotions and memory (Krettek and Price, 1977a,b;McDonald, 1996; Swanson and Petrovich, 1998), and to the hypothalamus and lower centers mediating autonomic output (LeDoux et al., 1988;Feldman et al., 1995; Pitkänen et al., 2000). The present study provides the first evidence of a direct and widespread projection from the basal amygdala to the inferior colliculus (IC), obtained in two species of bats. The results suggest the presence of an auditory–amygdalar feedback circuit to the IC that may impose emotional content onto processing of sensory stimuli at a low level of an ascending sensory pathway.
The IC occupies a crucial position in the primary auditory pathway, integrating input from a broad range of auditory brainstem nuclei and relaying information to the auditory thalamus and to nuclei at the sensorimotor interface. The IC creates selectivity for various dimensions of behaviorally relevant sounds, including selectivity for location (Faingold et al., 1991; Park and Pollak, 1994), duration (Casseday et al., 1994; Fuzessery, 1994; Fuzessery and Hall, 1999), direction of frequency-modulated sweeps (Fuzessery, 1994; Fuzessery and Hall, 1996), and combinations of acoustic elements in vocalizations (Mittmann and Wenstrup, 1995; Portfors and Wenstrup, 1999; Leroy and Wenstrup, 2000; Wenstrup and Leroy, 2001). The IC also receives extensive auditory corticofugal input (Saldaña et al., 1996;Winer et al., 1998) and monoaminergic (Klepper and Herbert, 1991) projections capable of modulating this response selectivity (Yan and Suga, 1996, 1999; Hurley and Pollak, 1999). The IC thus functions as an integration center mediating interactions between higher and lower auditory centers and nonauditory inputs. A projection from the amygdala to the IC indicates a major addition to the factors affecting information processing in the IC, imparting emotional context onto processing in the primary auditory pathway.
The results presented here were observed unexpectedly during the course of tract-tracing studies designed to identify the origin of inputs to functionally specialized neurons in the IC. These experiments demonstrate a significant projection from the basal nucleus of the amygdala that is distributed widely throughout the IC, including most of the central nucleus (ICC), the major recipient of ascending auditory brainstem input.
Parts of this paper have been published previously in abstract form (Marsh et al., 1999).
MATERIALS AND METHODS
We deposited retrograde tracers in the IC in two species of bats and examined the pattern of labeling in the forebrain. Mustached bats (Pteronotus parnellii) were captured in Jamaica or Trinidad and Tobago, West Indies. Pallid bats (Antrozous pallidus) were captured in Arizona. Brainstem or thalamic labeling in some experiments on mustached bats has been reported previously (Wenstrup and Grose, 1995; Wenstrup et al., 1999). All procedures were approved by the Institutional Animal Care and Use Committee of the Northeastern Ohio Universities College of Medicine.
Surgical procedures. Surgical and recording procedures were similar to those reported previously for mustached bats (Wenstrup et al., 1999) and pallid bats (Fuzessery and Hall, 1996). Two to 3 d before surgery, tetracycline was placed in the drinking water to reduce postsurgical infection. To surgically expose the IC, animals were anesthetized with methoxyflurane (Metofane; Schering-Plough Animal Health, Omaha, NE) in combination with sodium pentobarbital (Nembutal, 5 mg/kg, i.p.; Abbot Laboratories, North Chicago, IL) and acepromazine (2 mg/kg, i.p.; Med-Tech, Buffalo, NY). A midline incision was made over the dorsal surface of the skull; then, the skin and muscles were reflected laterally. In mustached bats, a tungsten ground electrode was cemented into the skull overlying the right cerebral hemisphere. In pallid bats, a ground electrode was placed in contact with the temporal muscles on the left side. A metal pin was glued to the skull to position the head in the stereotaxic apparatus, and a small hole (<0.5 mm in diameter) was placed in the skull over the IC. Lidocaine (Elkins-Sinns, Cherry Hill, NJ) was applied to the surgical wound. After surgery, mustached bats were placed in a holding cage for at least 24 hr, whereas pallid bats were used in experiments on the day of the surgery.
Acoustic stimulation and recording. Physiological recordings were obtained from bats placed in a Plexiglas restraining apparatus and housed in a humidified, soundproof chamber lined with anechoic foam. Computer-controlled acoustic signals (3–50 msec duration, 0.5 msec rise–fall times, three to four per second) consisted of tone bursts, noise bursts, frequency-modulated sweeps, or combinations of these. The signals were generated separately [model 8904A (Hewlett-Packard, Palo Alto, CA) or model 395 (Wavetek)], switched (model SW2; Tucker-Davis Technologies, Gainesville, FL), and attenuated (model PA4; Tucker-Davis Technologies). Signals from the separate channels were summed (model SM3; Tucker-Davis Technologies), amplified (model HCA-800II; Parasound, San Francisco, CA), and then sent to a speaker (leaf tweeter; Technics). The speaker was placed 10 or 30 cm away from the bat and 25° into the sound field contralateral to the IC under study. Acoustic properties of the entire system were tested with a calibrated microphone (model 4135; Brüel and Kjær, Norcross, GA) placed in the position normally occupied by the bat's head. Distortion components in the speaker were not detectable 60 dB below the signal level, as measured by an application performing a fast Fourier transform of the digitized microphone signal (model NB-A2000; National Instruments, Austin, TX).
Mustached bats were lightly anesthetized with Metofane and placed in a Plexiglas restraining apparatus; all animals recovered before recording started. If signs of distress or discomfort were evident, mustached bats received subdermal injections of acepromazine (2 mg/kg), or they were removed from the experimental apparatus. Pallid bats were kept lightly anesthetized during the experiments by sodium pentobarbital booster injections (2.5 mg/kg, i.p.) as necessary.
The evoked activity of single and/or multiunit responses was recorded from the IC of the bats. Recordings were obtained with micropipette electrodes filled with saline (0.9% NaCl) or PBS, pH 7.4, and one of the following tracers: 1–2% cholera toxin B-subunit (CTb) (List Biologic, Campbell, CA), 2% Fluoro-Gold (FG) (Fluorochrome, Englewood, CO), 2% dextran-conjugated rhodamine [Fluororuby (FR); Molecular Probes, Eugene, OR], or 2% wheat germ agglutinin conjugated to horseradish peroxidase (WGA-HRP) (Sigma, St. Louis, MO). Electrodes were broken to tip diameters of 5–10 μm, with resistances of 3–20 MΩ. Electrodes were placed visually over the IC and advanced by a hydraulic micropositioner (model 650; David Kopf Instruments, Tujunga, CA). Extracellular action potentials were amplified, filtered (bandpass, 500–6000 Hz), and sent to a window discriminator (model 74-60-3; Fredrick Haer Company, Bowdoinham, ME). The pulse output of the window discriminator was digitized at 10 kHz (model NB-MIO-16X; National Instruments) for analysis of peristimulus time histograms, raster displays, and statistics on the neural responses. The neural responses analyzed consisted of isolated single-unit responses with a high signal-to-noise ratio or multiunit activity of stimulus-locked clusters of clearly defined spikes.
By use of tonal stimulation, recording sites were characterized by their best frequency (the frequency that elicited a response at the lowest sound level) and threshold at best frequency (lowest sound level at best frequency that elicited stimulus-locked spikes). Best frequencies were measured with a resolution of 0.01 or 0.1 kHz but are expressed in kilohertz. Depending on the experiment, we also assessed rate-level functions, latency of response, and sensitivity to frequency-modulated sweeps, noise, and combinations of tones. When recording multiunit responses, sites were sampled at 100–200 μm intervals through dorsoventral penetrations of the ICC. Single units were tested as they were isolated. At the end of a penetration, the tracer-filled recording electrode was returned to the location receiving the iontophoretic deposit. Responses were again characterized and then a deposit was made using pulsed current (+1–5 μA; 3.5–10 min duration; 50% duty cycle). After the deposit, the electrode was maintained in position for 5 min and then removed from the brain.
Histology and tracer techniques. After tracer deposits, the bats were returned to their holding cages for an appropriate survival time (see below). For perfusion, the animals were deeply anesthetized with Nembutal (>60 mg/kg, i.p.). When nociceptive reflexes were eliminated, the chest cavity was opened, and the animal was perfused through the heart with PBS and an aldehyde fixative. After the brain case was opened, the brain was blocked in a consistent plane (the plane of most electrode penetrations). For the mustached bats, this was inclined ∼15% from dorsocaudal to ventrorostral (Wenstrup et al., 1994, 1999). For pallid bats, brains were blocked in the frontal plane, perpendicular to the dorsal surface. Each brain was refrigerated overnight in a 30% sucrose–PBS solution, pH 7.4, before sectioning. The brain was sectioned transversely on a freezing microtome at a thickness of 30 or 40 μm. All sections from the cochlear nucleus to the frontal cortex were collected in cold 0.1 mphosphate buffer or PBS. Three alternating series were collected and processed by different protocols; one series was stained with cresyl violet.
The results are based primarily on experiments using CTb as tracer. In these, animals were perfused with a 4% paraformaldehyde fixative 3–5 d after the tracer was deposited. Tracer was visualized using immunohistochemistry and an avidin–biotin–peroxidase procedure (Vector Laboratories, Burlingame, CA). After blocking in 3% normal rabbit serum plus 0.2% Triton X-100, free-floating sections were incubated in goat anti-CTb (1:20,000 or 1:40,000; List Biologic) for 60–65 hr at 4°C. Heavy metal-intensified diaminobenzidine was used as a chromogen.
We also examined labeling patterns from experiments in which FG, FR, and WGA-HRP were used (Wenstrup et al., 1999). Animals were perfused 5–10 d after FG or FR deposits with a 4% paraformaldehyde fixative; subsequently, sections were mounted, cleared, and coverslipped with DPX. Animals were perfused 24–48 hr after WGA-HRP deposits with a mixed aldehyde fixative and a sucrose phosphate buffer solution. Tetramethylbenzidine was used as chromogen.
Acetylcholinesterase (AChE) staining in the forebrain was examined using methods outlined by Hardy et al. (1976). Animals were perfused with 4% paraformaldehyde fixative, and then the brains were removed and placed in 30% sucrose overnight. After sectioning, brains were rinsed in 0.1 m acetate buffer, and free-floating sections were processed using the thiocholine method for AChE visualization.
Data analysis. Cell bodies were considered to be labeled by CTb only when immunohistochemical reaction product at least partially filled a somatic profile. Labeled cells were thus distinct from peroxidase labeling of red blood cells, some endothelial cells, or extracellular debris. Similar criteria were used for other tracers. Retrogradely labeled cells in the amygdala, auditory cortex, and brainstem were plotted using a drawing tube under bright-field illumination for CTb, fluorescence for FG or FR, and dark-field illumination for WGA-HRP [268–468×; numerical aperture (NA), 0.7; plan apochromat]. Plots of subdivisions and labeled cells were drawn separately and scanned at 300 dots per inch and then imported into a graphics application [Canvas (Deneba Systems, Miami, FL) or Corel Draw (Corel, Ottawa, Ontario, Canada)]. Counts of labeled cells were made from every section in one series. In statistical tests, the null hypothesis was rejected when its probability was <5%.
Potential sources of artifact were examined. We studied whether immunohistochemical processing for CTb artifactually labeled cells in the amygdala. The labeling pattern in the amygdala was compared with material from previous experiments in our laboratory in which CTb was deposited in the medial geniculate body (MGB) (Wenstrup and Grose, 1995). Using processing methods identical to those used here, that material had no labeled somata in the amygdala. We also found no evidence of transsynaptic transport of CTb in either anterograde or retrograde directions after IC deposits. For instance, we observed no somatic labeling in the medial nucleus of the trapezoid body, which projects indirectly to the IC. Transsynaptic anterograde labeling of amygdalar neurons after IC deposits requires both somatic labeling in or near the MGB and terminal labeling in the amygdala. We observed neither of these.
Photomicrographs were taken under bright-field illumination using anOlympus Provis microscope (model AX70; Olympus Optical, Tokyo, Japan) with a Spot digital camera (model 1.4.0; Diagnostic Instruments, Sterling Heights, MI) and associated software. Gray-scale images were imported into Photoshop (Adobe Systems, San Jose, CA), in which global adjustments in brightness and contrast were made. Individual images were imported into Canvas (Deneba Systems), in which composite plates were constructed.
Subdivisions of the amygdala were identified from Nissl-stained and cholinesterase-stained sections, based on previous work in rats, cats, and monkeys (Ben-Ari et al., 1977; Krettek and Price, 1978b; Price et al., 1987; Alheid et al., 1995). Nomenclature for amygdalar nuclei follows that described by Price et al. (1987).
RESULTS
These results are based on deposits of retrograde tracers within tonotopically organized regions of the IC in 11 mustached bats and 12 pallid bats. Tracer deposits in most parts of the IC resulted in labeling of the basal nucleus of the amygdala. We first outline the architectonic subdivisions of the amygdala in these animals and then describe features of IC tracer deposits and retrograde labeling in the amygdala.
Anatomic organization of the amygdala
In mustached and pallid bats, the general location and cellular architecture of the amygdala conforms to that described previously in other bats (Johnston, 1923; Humphrey, 1936) and in rats and cats (Krettek and Price, 1978b; Price et al., 1987; Alheid et al., 1995). Briefly, the amygdala lies in the forebrain, bounded dorsally by the hippocampus, caudate–putamen, or lateral ventricle (Fig.1). Laterally, it is bounded by the external capsule and piriform cortex. Medially, it is limited by the edge of the cerebral hemisphere or by the internal capsule. Subdivisions described here are based primarily on Nissl- and cholinesterase-stained (AChE) sections. Figure 1, A andC, shows major nuclei in mustached and pallid bats using Nissl-stained transverse sections. Nuclear groups were delineated by cell size, intensity of Nissl stain, nuclear location and shape, and association with fiber tracts.
Fig. 1.
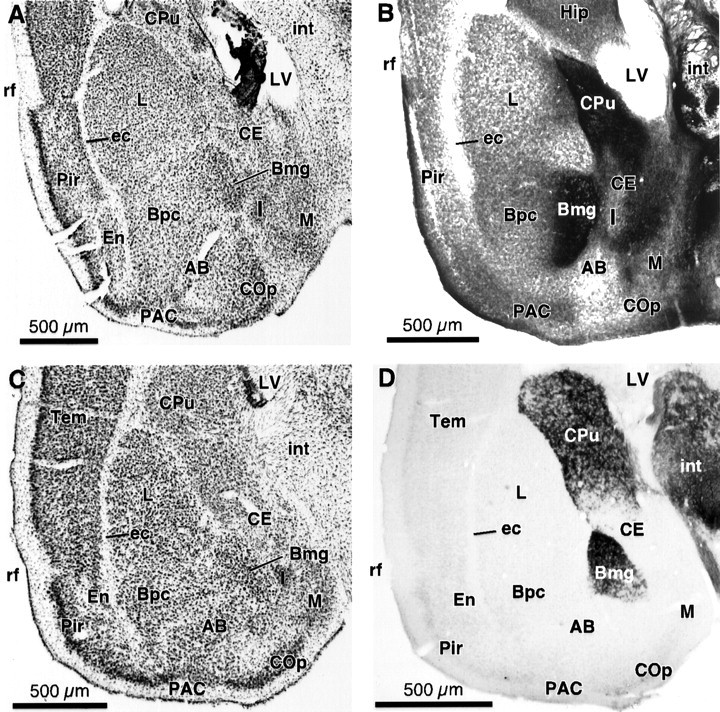
Views of the amygdala and other forebrain structures in mustached and pallid bats. A, Nissl-stained coronal section in the mustached bat shows large lateral nucleus (L) and darkly stained magnocellular division of the basal nucleus (Bmg). B, Cholinesterase-stained section in mustached bat shows staining of Bmg and caudate–putamen. Section is from a different animal than the section in A. C, Nissl-stained coronal section in the pallid bat. D, Cholinesterase-stained section in the pallid bat shows staining of Bmg and caudate–putamen. Sections in C and D are from the same animal. Protocol for photomicrographs is as follows (plan apochromat):A, C, NA 0.08; B,D, NA 0.16. The following anatomic abbreviations are used throughout figure legends: AB, accessory basal nucleus of the amygdala; ALD, anterolateral division of the central nucleus of the inferior colliculus; Bmg, magnocellular subdivision of the basal nucleus of the amygdala;Bpc, parvicellular subdivision of the basal nucleus of the amygdala; CE, central nucleus of the amygdala;COp, posterior cortical nucleus of the amygdala;CPu, caudate–putamen; DC, dorsal cortex of the inferior colliculus; DPD, dorsoposterior division of the central nucleus of the inferior colliculus; ec, external capsule; En, endopiriform nucleus;Ex, external nucleus of the inferior colliculus;Hip, hippocampal formation; Hyp, hypothalamus; I, intercalated nuclei of the amygdala; IC, inferior colliculus; ICC, central nucleus of the inferior colliculus; int, internal capsule; L, lateral nucleus of the amygdala;ll, lateral lemniscus; LV, lateral ventricle; M, medial nucleus of the amygdala;MD, medial division of the central nucleus of the inferior colliculus; MGB, medial geniculate body;opt, optic tract; PAC, periamygdaloid cortex; PAG, periaqueductal gray; Pir, piriform cortex; rf, rhinal fissure; Tem, temporal cortex; wm, white matter underlying cerebral cortex.
Deposits of tracer placed in the IC resulted in retrograde labeling of cells in the basal nucleus of the amygdala. We recognize two subdivisions, magnocellular (Bmg) and parvicellular (Bpc). Cell bodies in the Bmg were the largest in the amygdaloid complex and had characteristically intense Nissl staining (Fig.1A,C). Cells in the Bpc were smaller but still larger than most neurons in the amygdala. The basal nucleus, and in particular the Bmg, can be additionally differentiated from other amygdaloid nuclei by intense staining for AChE (Ben-Ari et al., 1977; Price et al., 1987), the result of cholinergic input from nucleus basalis in the substantia innominata (Nagai et al., 1982; Woolf and Butcher, 1982). Despite differences in background staining, the most intense AChE staining in both mustached and pallid bats occurred in the Bmg (Fig.1B,D). The Nissl and AChE stainings of the amygdala provide the primary bases for identifying the Bmg as the site of retrograde labeling after tracer deposits in the IC.
The large neurons of the Bmg occurred in the medial part of the basal nucleus, similar to rats (Price et al., 1987). However, it was limited approximately to the central one-half of the basal nucleus, more similar to the caudorostral position reported in monkeys (Price et al., 1987). Cells in the rostral part of the basal nucleus are similar in size, density, and intensity of Nissl staining to those in the caudolateral part of the nucleus, which we called Bpc. The Bmg corresponds to the anterior subdivision of the basolateral nucleus in other parcellation schemes (Krettek and Price, 1978b; Alheid et al., 1995).
Retrograde tracer deposits in the IC
In most experiments, a single deposit of the tracer CTb was placed in a physiologically defined region of the IC (Fig.2, Table1). The physiological recording established the location of the deposit sites within the tonotopic organization of the IC (Fig. 2A,C).
Fig. 2.

Location of tracer deposits and tonotopic organization in the IC of mustached bats (A,B) and pallid bats (C, D).A, Schematic view of the tonotopic organization in mustached bat's IC, with location of CTb tracer deposits indicated. Frequencies in lower part of audible range (10–59 kHz) are represented systematically in the anterolateral division (ALD) of ICC. The dorsoposterior division (DPD) disproportionately represents frequencies in the 59–63 kHz range, whereas frequencies >63 kHz are represented in the medial division (MD). B, Deposit of CTb in a mustached bat's ICC at site tuned to 86.1 kHz (case 5).C, Schematic view of the tonotopic organization of the pallid bat's IC, with the location of CTb tracer deposits indicated.D, Deposit of CTb in a pallid bat's ICC at site tuned to 41.9 kHz (case 20). In A andC, gray lines and textindicate isofrequency lines in the IC. Protocol for all photomicrographs is as follows (plan apochromat): NA 0.16.
Table 1.
Summary of physiological responses and retrograde labeling after tracer deposits in the IC
| Case number | Best frequency | Additional information | Tracer | Bmg-labeled cells | Total cells | Percentage of total cells | |||
|---|---|---|---|---|---|---|---|---|---|
| Ipsi | Contra | Bmg | Cortex | Brainstem | |||||
| Mustached bats | |||||||||
| 1 | 23 kHz | CTb | 42 | 3 | 540 | 8 | 20 | 71 | |
| 2 | 59 kHz | Dorsal | CTb | 46 | 4 | 487 | 10 | 57 | 33 |
| 3 | 89 kHz | Second deposit
∼60 kHz |
CTb | 130 | 36 | 689 | 24 | 13 | 63 |
| 4 | 81 kHz | 26 kHz (f)* | CTb | 87 | 13 | 496 | 20 | 19 | 61 |
| 5 | 86 kHz | 27 kHz (f) | CTb | 158 | 65 | 820 | 27 | 10 | 62 |
| 6 | 88 kHz | 26 kHz (i) | CTb | 106 | 31 | 1718 | 8 | 25 | 67 |
| 7 | 83 kHz | 27 kHz (f) | CTb | 79 | 6 | 1078 | 8 | 8 | 85 |
| 8 | 26 kHz | FG | 0 | 0 | 1171 | 0 | 9 | 91 | |
| 7 | 26 kHz | FG | 25 | 7 | 857 | 4 | 3 | 93 | |
| 9 | 53 kHz | 27 kHz (f) | FG | 9 | 5 | 1441 | 1 | 2 | 97 |
| 10 | 75–79 kHz | 3 deposits | FR | 45 | 6 | 1606 | 3 | 6 | 90 |
| 11 | 28–31 kHz | 3 deposits | WGA-HRP | 19 | 0 | 6415 | 0.3 | 17 | 83 |
| Pallid bats | |||||||||
| 12 | 16 kHz | Medial | CTb | 1 | 2 | 88 | 3 | 80 | 16 |
| 13 | 15 kHz | Medial/central, 4 deposits | CTb | 123 | 76 | 2148 | 9 | 40 | 51 |
| 14 | 17 kHz | Lateral | CTb | 38 | 16 | 498 | 11 | 5 | 84 |
| 15 | 25 kHz | Lateral | CTb | 65 | 44 | 1113 | 10 | 1 | 89 |
| 16 | 21 kHz | Lateral | CTb | 124 | 82 | 641 | 32 | 14 | 54 |
| 17 | 21 kHz | Far lateral | CTb | 73 | 48 | 475 | 25 | 5 | 69 |
| 18 | 41 kHz | Medial | CTb | 105 | 70 | 774 | 23 | 45 | 32 |
| 19 | 41 kHz | Medial | CTb | 48 | 26 | 245 | 30 | 12 | 58 |
| 20 | 42 kHz | Central | CTb | 166 | 141 | 1251 | 25 | 8 | 68 |
| 21 | 40 kHz | Lateral | CTb | 5 | 0 | 287 | 2 | 2 | 96 |
| 22 | 39 kHz | Lateral | CTb | 5 | 2 | 785 | 1 | 2 | 97 |
| 23 | 13–65 kHz | Lateral 2/3,
12 deposits |
WGA-HRP | 0 | 0 | >2000 | 0 | 0 | 100 |
(f) and (i) indicate that a tone at the specified frequency facilitates or inhibits, respectively, the best frequency tone. These responses are combination-sensitive (Mittmann and Wenstrup, 1995). Ipsi, Ipsilateral; Contra, contralateral.
In the mustached bats, deposits were made across a broad frequency range, from 23 to 89 kHz, encompassing much of this bat's audible range of ∼10–120 kHz. In this species, the tonotopic organization of the ICC is present in modified form because of the disproportionate representation of frequencies near 60 kHz (Zook et al., 1985; O'Neill et al., 1989). All tracer deposits were associated with frequencies used in both the bat's multiharmonic sonar signal and its repertoire of social communication signals (Novick, 1963; Kanwal et al., 1994). CTb deposits in five experiments were placed at sites tuned to 80–89 kHz. All of these sites showed combinatorial response properties, in which the response to the 80–89 kHz signal was modulated by a signal in the 25–30 kHz frequency range (Mittmann and Wenstrup, 1995; Portfors and Wenstrup, 1999). Figure2B shows one of these deposits, placed at a combination-sensitive recording site that was tuned to 86 kHz and facilitated by a 27 kHz signal. Other CTb deposits were placed at 23 and 59 kHz, frequencies used in the first and second harmonics of the sonar call. In addition to these CTb experiments, we also describe results from three experiments using FG as the tracer and one experiment each using FR and WGA-HRP.
Deposits of CTb were made in 11 pallid bats. Compared with the mustached bat, the tonotopic organization of the IC in this species is generally more conventional, with frequency increasing from dorsal to ventral and isofrequency contours extending from dorsomedial to ventrolateral (Fuzessery, 1994). CTb deposits were distributed throughout the mediolateral extent of two frequency band representations (Fig. 2C, Table 1). In five animals, CTb deposits were placed in the 39–42 kHz representation, a region dominated by selective responses to downward frequency-modulated sweeps used in the animal's sonar signal (Fuzessery, 1994). Figure2D shows a CTb deposit site responsive to 42 kHz, located approximately midway between the medial and lateral edges of the IC. In the six other CTb experiments, deposits were placed at recording sites in the 15–25 kHz range. These frequencies are used in prey detection and social communication but not in sonar (Brown, 1976;Bell, 1982; Fuzessery et al., 1993). The most lateral part of this frequency representation (Fig. 2C, deposits 16and 17) is physiologically distinct (Fuzessery, 1997) and has unusual anatomic features (Wenstrup et al., 1996). We also report data from one experiment in which 12 deposits of WGA-HRP were made in the lateral two-thirds of the IC at recording sites with best frequencies ranging from 13 to 65 kHz.
Retrograde labeling in the amygdala
After deposits of CTb in the IC, retrograde labeling was observed in the amygdala. Amygdalar labeling resulting from the deposits in Figure 2, B and D, is illustrated in photomicrographs (Fig. 3) and as plots of labeled cells in a series of coronal sections (Fig.4). These figures document the major qualitative features of the labeling: it was bilateral, it was found exclusively in the Bmg, and it was similar for both mustached and pallid bats.
Fig. 3.
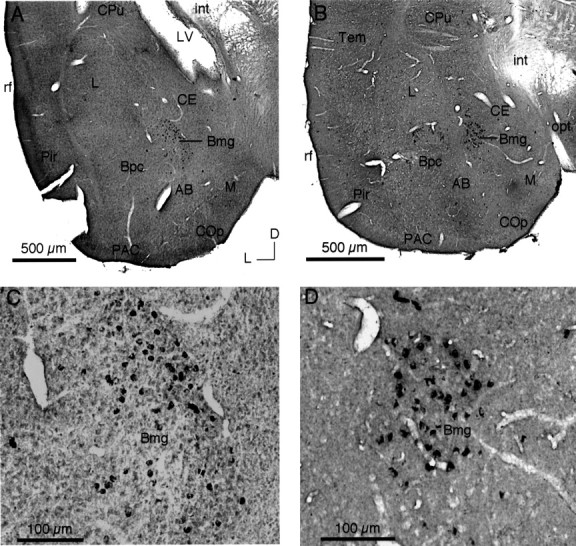
Retrograde labeling in Bmg after tracer deposits in the IC. A, C, Lower-power (A) and higher-power (C) views of retrograde labeling in the ipsilateral Bmg of the mustached bat after the CTb deposit illustrated in Figure2B. B, D, Lower-power (B) and higher-power (D) views of retrograde labeling in the ipsilateral Bmg of the pallid bat after the CTb deposit illustrated in Figure 2D. Retrograde neuronal labeling is restricted to the Bmg. Examples of artifactual label are evident in C (far left) and D (top). Protocol was as follows (plan apochromat): A, B, NA 0.08; C, D, NA 0.40.
Fig. 4.
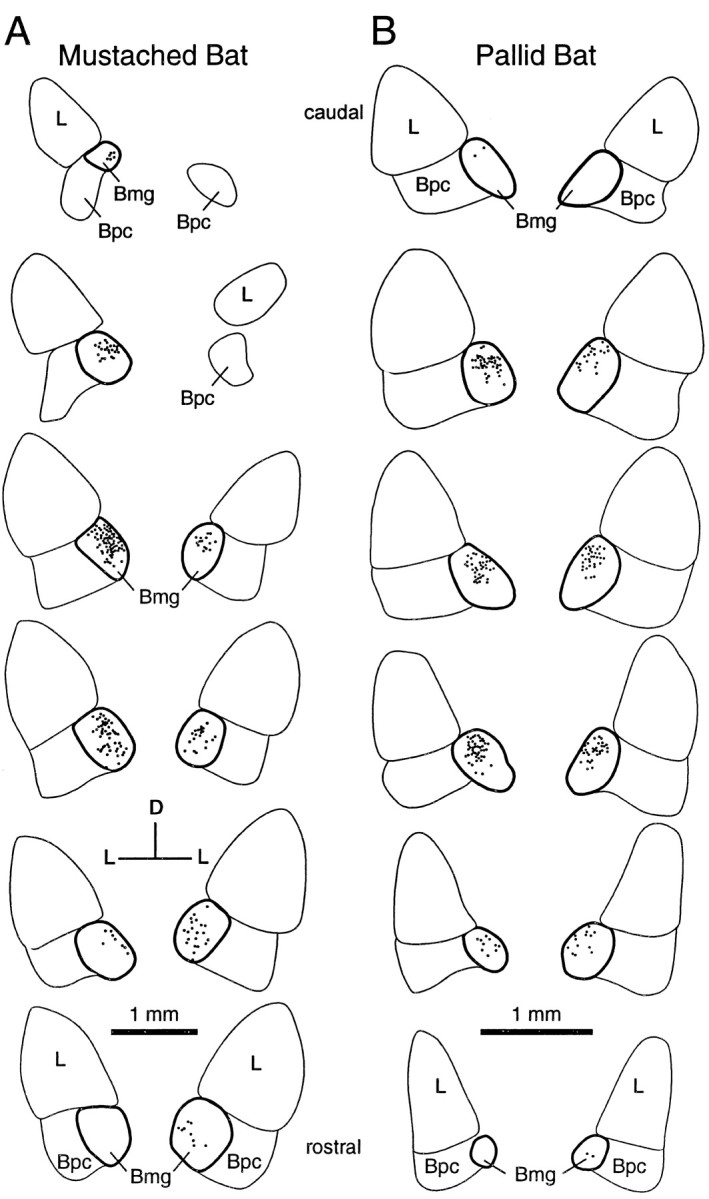
Distribution of retrograde label in the amygdala after tracer deposits in the IC. A, Labeling in a mustached bat after tracer deposit shown in Figure2B. B, Labeling in a pallid bat after tracer deposit shown in Figure 2D. Sections are arranged from caudal (top) to rostral (bottom), and the labeling on the side ipsilateral to the deposit is presented on the left. In both experiments, labeling was bilateral with an ipsilateral predominance. Outline of the Bmg is in bold.
Quantitative analyses described below are based only on CTb experiments, because there were many fewer labeled cells in the amygdala after FG, FR, or WGA-HRP deposits (see below). Labeling of the Bmg was bilateral but with an ipsilateral dominance (Fig. 4, Table 1). Across all CTb experiments in which at least 40 amygdalar cells were labeled, 72% of the amygdalar label was ipsilateral. However, there was a clear species difference. In mustached bats, ipsilateral labeling accounted for 84% (range, 71–93%) of labeled cells in the amygdala. In pallid bats, ipsilateral labeling was less dominant, averaging 61% of amygdalar labeling (range, 54–70%). This difference is highly significant (p < 0.0002; ttest).
Labeling in the basal nucleus was restricted to its caudal two-thirds, in which the magnocellular subdivision is located. Figure5 shows the caudorostral distribution of label across the entire basal nucleus for each experiment in which at least 40 amygdalar cells were labeled. The label extends from ∼20–65% of the caudal-to-rostral dimension of the basal nucleus, corresponding closely to the location of Bmg. This was true for the mustached and pallid bats on both the ipsilateral and contralateral sides.
Fig. 5.

Caudal-to-rostral pattern of retrograde labeling in Bmg. Retrograde labeling is expressed as the percentage of total labeling in increments of the caudal-to-rostral extent of the entire basal nucleus. A, Labeling in the mustached bat on the ipsilateral (IPSI) and contralateral (CONTRA) sides. B, Labeling in the pallid bat. Black arrowheads indicate the caudal and rostral borders of the Bmg as discussed in Results (lower tip indicates average border across animals; top, lateral tips indicate range of borders).
Most CTb deposits resulted in significant labeling of the amygdala (≥8% of all labeling), including deposits clearly centered within the ICC (Fig. 2; Table 1, animals 1, 3–7, 14, 15, 20), as well as others in the dorsal or dorsomedial IC that may have extended into the dorsal cortex (Table 1, animals 2, 13, 18, 19). The ICC was identified both by architecture (Zook et al., 1985) and by brainstem inputs from the medial and lateral superior olivary nuclei (Wenstrup et al., 1996,1999). Amygdalar labeling was observed after deposits placed in different frequency representations and across the mediolateral extent of the IC. Weak labeling was observed only in the dorsomedial extreme of the IC (3%, animal 12), in which the low number of total labeled cells in that experiment suggests poor sensitivity, and in the ventrolateral extreme (1–2%, animals 21 and 22), in which the result appears more reliable. However, within the area of IC in which deposits significantly labeled the amygdala, there was variability in the numbers of retrogradely labeled cells and in the percentage of total labeling. We found no clear trend to explain this variability.
Comparison with cortical and brainstem labeling
To provide a reference for the efficacy of retrograde transport to the amygdala, it was compared with brainstem and auditory cortical inputs to the IC. Retrograde labeling was observed in layer V of auditory cortex in all CTb cases (Table 1, Fig.6). Nearly all labeled cells were located ipsilaterally. Across all CTb experiments in which at least 40 cortical cells were labeled (seven mustached bats and five pallid bats), the auditory cortical label was on average 92% ipsilateral (range, 85–96%). There was no species difference in the predominance of ipsilateral labeling. Cortical labeling varied with location of the IC deposit site (Fig. 2, Table 1). Dorsomedial deposits resulted in the most labeled cells, whereas ventrolateral deposits generally resulted in few or no labeled cortical cells. However, cortical labeling occurred after deposits restricted to the ICC (animals 1, 3–7, 14, 20).
Fig. 6.

Retrograde labeling in ipsilateral auditory cortex after CTb tracer deposits in the IC. Roman numeralsindicate cortical layers. A, Labeling in a mustached bat (Fig. 2A,B, case 5). Retrograde transport to the amygdala after the ICC deposit is shown in Figures 3A and 4A.B, Labeling in a mustached bat (Fig.2A, case 2). C, Labeling in a pallid bat (Fig. 2C,D,case 20). Retrograde transport to the amygdala after the ICC deposit is shown in Figures 3B and 4B. D, Labeling in a pallid bat (Fig. 2C, case 13) after four CTb deposits in regions tuned near 15 kHz. Protocol for all photomicrographs was as follows (plan apochromat): NA 0.16.
Labeling in the amygdala often constituted a significant fraction of the total number of retrogradely labeled cells after IC deposits. Figure 7 and Table 1 compare the percentage of total retrograde labeling found in the auditory brainstem, amygdala, and auditory cortex (excluding labeling in the IC). Amygdalar labeling ranged from 1 to 32% of total labeling, averaging ∼15%. In comparison, auditory cortical labeling averaged 20%, whereas labeling in the auditory brainstem averaged 64%. The number of labeled cells in the amygdala was not significantly different from the number in the auditory cortex for either mustached bats or pallid bats (paired t tests; p > 0.4), but both were significantly less than labeled cells in the auditory brainstem (paired t tests; p < 0.001 for each test). The mean value of percentages for each anatomic region was nearly identical between the mustached bat and pallid bat experiments (Fig. 7).
Fig. 7.

Comparison of retrograde labeling in brainstem, auditory cortex, and amygdala after CTb deposits in the IC of mustached bats and pallid bats. The relative distribution of label in the two species is nearly identical, despite wide variation among individual cases. Columns indicate average percentage of labeling in the three brain regions; vertical lines indicate the range of values.
Comparison of retrograde tracers
We analyzed experiments using FG, FR, and WGA-HRP to compare the sensitivity of retrograde labeling with CTb (Table 1). In two of the FG cases, the FR case, and one WGA-HRP case, retrograde labeling in the amygdala was confirmed. However, the FG deposits labeled few or no cells in the amygdala, even when retrograde labeling in the auditory brainstem was robust. In addition, labeling in the auditory cortex was also weak. In one experiment using WGA-HRP, three tracer deposits were made at sites tuned to 28–31 kHz. Despite the large deposit zone, strong anterograde labeling in the MGB (Wenstrup and Grose, 1995, their Fig. 3), and robust retrograde labeling in the brainstem (Table1), only 19 cells (0.3%) were labeled in the amygdala. No other experiment involving WGA-HRP deposits in any frequency representation of the IC (of 12 mustached bats and eight pallid bats examined) revealed labeling of the amygdala. Particularly noteworthy was one experiment in the pallid bat in which 12 tracer deposits were placed in the lateral two-thirds of the IC (Table 1). Although retrograde labeling of the auditory brainstem was robust, no cells were labeled in either the amygdala or auditory cortex.
DISCUSSION
Retrograde tracers placed in the IC of two bat species labeled cells in the Bmg of the amygdala. This surprising result indicates a significant, direct projection from Bmg to IC, one that could modify the processing of sound early in the ascending auditory pathway on the basis of an animal's emotional or motivational state.
Reliability of the finding
Because an amygdalocollicular projection has not been described previously, alternative interpretations of retrograde amygdalar labeling were considered. Artifactual immunohistochemical labeling was ruled out by comparison with experiments depositing CTb into the MGB (Wenstrup and Grose, 1995). We also found no evidence of transsynaptic transport of CTb in either the anterograde or retrograde direction, consistent with previous studies in other species (Robertson and Grant, 1985; Luppi et al., 1990). Finally, although CTb labeling can result from uptake by fibers of passage (Chen and Aston-Jones, 1995), it is highly unlikely to explain the present results. Here, uptake by amygdalar fibers of passage could not occur unless bundles of axons originating from the ipsilateral and contralateral Bmg invaded nearly every part of the IC, without termination, en route to other targets. No known Bmg projection can account for this unlikely scenario (Price et al., 1987; Swanson and Petrovich, 1998; Pitkänen et al., 2000). In addition, the central amygdaloid nucleus, with demonstrated amygdalar projections to midbrain and brainstem autonomic centers near IC (Krettek and Price, 1978a; Rizvi et al., 1991), was unlabeled.
Two observations strengthen our interpretation of the result. First, we found retrograde labeling in Bmg after IC injections of other tracers, although fewer amygdalar cells were labeled. The greater sensitivity of retrograde labeling in CTb experiments agrees closely with previous studies (Luppi et al., 1990, 1995; Peyron et al., 1998; Wenstrup et al., 1999). Second, the superior sensitivity of retrograde labeling by CTb was similarly evident in the auditory corticocollicular projection to the ICC. We therefore conclude that retrograde labeling in the Bmg after CTb deposits in the IC demonstrates a direct projection of Bmg neurons onto neurons of the IC, including the ICC.
Forebrain projections to the IC
In both species, these experiments revealed two forebrain projections to the IC: from Bmg and auditory cortex (Fig.8). Because corticocollicular projections have been described previously [in the mustached bat (Fitzpatrick et al., 1998)] [in other species (Huffman and Henson, 1990; Herbert et al., 1991; Winer et al., 1998)], we compare the expected corticocollicular projection with the unexpected amygdalocollicular projection.
Fig. 8.

Summary of the neural connections demonstrated in this article. Both the auditory cortex and basal nucleus of the amygdala project to the IC bilaterally. The strongest projection, in terms of the number of projection neurons, is the ipsilateral auditory cortex, followed in descending order by the ipsilateral Bmg, contralateral Bmg, and contralateral auditory cortex.
Auditory cortical projections from layer V pyramidal cells were strongest to dorsomedial regions of the IC and weakest to ventrolateral regions nearest the lateral lemniscus. The corticocollicular projection includes the ICC, thus supporting results by Saldaña et al. (1996) showing a significant cortico-ICC projection in rats. These results support the existence of a direct, excitatory (glutamatergic) projection to the ICC that may have excitatory or, via interneurons, inhibitory effects. Indeed, auditory cortical stimulation can evoke either inhibitory or excitatory interactions among IC neurons (Mitani et al., 1983; Syka and Popelar, 1984; Sun et al., 1989), and the sign of the interaction is critically dependent on the match between cortical and collicular response properties (Yan and Suga, 1996, 1999;Ma and Suga, 2001; Yan and Ehret, 2001). The specificity of these physiological effects may reflect the topographic specificity of the corticocollicular projection (Saldaña et al., 1996).
The amygdalocollicular projection is mediated by cells in one subdivision, the Bmg. Because of the size and large numbers of labeled cells, it is probable that principal cells are the main contributor to this projection. Like the cortical projection neurons, Bmg principal neurons are pyramidal cells (McDonald, 1982; Millhouse and de Olmos, 1983), immunopositive for excitatory amino acids (McDonald, 1996), and likely to provide direct, excitatory effects, as well as inhibitory effects, mediated through collicular interneurons.
Bmg neurons throughout its caudorostral extent project to the IC. Furthermore, these neurons may terminate throughout much of the IC, because Bmg seems to be similarly labeled by IC deposits in lower- and higher-frequency representations and in medial and lateral locations. This contrasts with the corticocollicular projection, which terminates in more restricted regions of IC (Saldaña et al., 1996). Thus, the amygdalocollicular pathway may be composed of a more limited population of neurons than the cortical projection, with each amygdalar neuron projecting to more widespread parts of the IC. Anterograde tracing experiments are needed to confirm this view. Its functional consequence is that the effects of amygdalar activation on the IC may be more global than corticocollicular effects.
Functional implications
Amygdaloid nuclei play major roles in establishing the emotional significance of sensory stimuli, in memory storage of emotion-laden sensory events, and in orchestrating emotional responses to sensory input (Gloor, 1972; Kaada, 1972; Cahill and McGaugh, 1998; LeDoux, 2000). The association of amygdaloid nuclei with auditory processing takes many forms. For instance, the lateral amygdala receives direct projections from both the MGB and auditory cortex (Aggleton et al., 1980; LeDoux et al., 1985; Price et al., 1987). Inputs from the MGB, when matched to aversive stimuli, generate long-term changes in the responsiveness of lateral nucleus neurons to auditory stimuli (Clugnet and LeDoux, 1990; Rogan and LeDoux, 1995). These response changes in turn produce conditioned autonomic responses, such as increased heart rate and dilated pupils, in response to sounds matched to aversive stimuli (LeDoux et al., 1984; Campeau and Davis, 1995; Amorapanth et al., 2000).
The output of the amygdala also affects information processing and plasticity in auditory cortex (Armony et al., 1998; Cahill and McGaugh, 1998; Weinberger, 1998), mediated by either direct amygdaloauditory cortical projections, including from Bmg (Amaral and Price, 1984;McDonald and Jackson, 1987; Yukie, 2002), or indirect projections through the cholinergic basal forebrain or hippocampal formation (Price et al., 1987; Pitkänen et al., 2000). This modulation extends to targets of auditory cortical projections. For example, chemical inactivation of the basal amygdala reduces certain types of conditioned auditory responses in the MGB (Maren et al., 2001; Poremba and Gabriel, 2001). These influences may be mediated by the amygdalocortical projection from the basal nucleus and in turn through descending corticothalamic projections (Poremba and Gabriel, 2001). However, our results provide an alternative pathway to underlie these observations. Specifically, modification of auditory responses in thalamus or cortex may result from projections of Bmg onto collicular cells, which in turn project onto thalamic cells. Interestingly, amygdalar modification of cortical responses would also influence the IC via the corticocollicular pathway. Amygdalar modulation may therefore interact with several levels of the auditory system (Fig.9).
Fig. 9.

Paths by which auditory information is processed in the amygdala and projected back to the IC. Solid lines indicate feedforward projection of auditory information.Dotted lines indicate feedback connections that can include results of amygdalar processing. Sources are as follows: projections from auditory cortex and amygdala to IC (present study); projections from MGB to amygdala in rats (LeDoux et al., 1985); projections from auditory cortex to amygdala in the mustached bat (Fitzpatrick et al., 1998) and in monkeys (Aggleton et al., 1980;Stefanacci and Amaral, 2000); projections from the amygdala, including Bmg, to auditory cortex in other species (Amaral and Price, 1984;McDonald and Jackson, 1987); many additional connections exist between amygdaloid nuclei and auditory cortex.
The role of the amygdalocollicular projection is speculative at this point; several possibilities are suggested. The first would be generally applicable if this pathway were present in other species: that emotional memories, applied to the processing of incoming signals at the IC, could shift the focus of processing on the basis of previous experience with these signals. The present results suggest that directed attention to attractive or aversive signals could be initiated at the midbrain level.
Other possibilities, although perhaps best documented in bats, may apply to other species with specialized IC processing. For example, the amygdalocollicular projection may modulate the relative activity among several parallel pathways with dedicated functions. Pallid bats use high-frequency echolocation channels for general orientation and low-frequency passive listening for prey detection and localization (Bell, 1982; Fuzessery et al., 1993). Different regions of the IC exhibit specializations for processing signals associated with these two functions (Fuzessery, 1994, 1997). Both receive projections from the amygdala, and their activity may be modulated in a context-dependent manner.
Input from the amygdala may also bias auditory responses within a single processing channel that serves more than one function. In the mustached bat, the frequency range of biosonar signals overlaps extensively with the frequency range of social vocalizations (Kanwal et al., 1994). The same specialized IC neurons may analyze both types of vocal signals (Portfors and Wenstrup, 2001b), and this is clearly the case in auditory cortex (Ohlemiller et al., 1996). Similarly, in the pallid bat, pathways serving echolocation and passive listening merge in a population of cortical neurons, with each channel imposing its response properties onto single cortical neurons (Razak et al., 1999). These neurons can thus participate in either function. Perhaps the amygdala alters the responsiveness of collicular neurons, and consequently cortical neurons, to one or the other of these types of stimuli on the basis of an animal's behavioral–emotional state. Both forms of the modulation by the amygdalocollicular projection could function in a wide range of mammalian species, particularly those that depend on multiple, highly developed acoustic behaviors, including vocal signaling in social communication or sonar, sound localization, and prey detection.
Why the amygdala intervenes in auditory processing at the midbrain level remains unclear, given that the auditory cortex is capable of modulating its own input and is in turn modulated by the amygdala. However, it may be significant that many forms of response selectivity for species-specific sounds originate in the IC (Fuzessery and Hall, 1996, 1999; Portfors and Wenstrup, 2001a; Wenstrup and Leroy, 2001). Perhaps the associative emotional–appetitive content from the amygdala plays a role in their creation.
Footnotes
This work was supported by research grants R01 DC 00937 (J.J.W.) and RO1 DC 00054 (Z.M.F.) from the National Institute on Deafness and Other Communication Disorders, National Institutes of Health and IBN-9828599 (Z.M.F.) from the National Science Foundation. We thank D. Gans, S. Leroy, D. Mittmann, and C. Portfors for help on some experiments, C. Block for discussions about the amygdala, F.-M. Chen and D. Gans for software, and the Wildlife Section of the Ministry of Agriculture, Land and Marine Resources of Trinidad and Tobago for permission to export mustached bats.
Correspondence should be addressed to Dr. Jeffrey J. Wenstrup, Department of Neurobiology and Pharmacology, Northeastern Ohio Universities College of Medicine, 4209 State Route 44, Rootstown, OH 44272-0095. E-mail: jjw@neoucom.edu.
REFERENCES
- 1.Aggleton JP, Burton MJ, Passingham RE. Cortical and subcortical afferents to the amygdala of the rhesus monkey (Macaca mulatta). Brain Res. 1980;190:347–368. doi: 10.1016/0006-8993(80)90279-6. [DOI] [PubMed] [Google Scholar]
- 2.Alheid GF, de Olmos JS, Beltramino CA. Amygdala and extended amygdala. In: Paxinos G, editor. The rat nervous system. Academic; San Diego: 1995. pp. 495–578. [Google Scholar]
- 3.Amaral DG, Price JL. Amygdalo-cortical projections in the monkey (Macaca fascicularis). J Comp Neurol. 1984;230:465–496. doi: 10.1002/cne.902300402. [DOI] [PubMed] [Google Scholar]
- 4.Amorapanth P, LeDoux JE, Nader K. Different lateral amygdala outputs mediate reactions and actions elicited by a fear-arousing stimulus. Nat Neurosci. 2000;3:74–79. doi: 10.1038/71145. [DOI] [PubMed] [Google Scholar]
- 5.Armony JL, Quirk GJ, LeDoux JE. Differential effects of amygdala lesions on early and late plastic components of auditory cortex spike trains during fear conditioning. J Neurosci. 1998;18:2592–2601. doi: 10.1523/JNEUROSCI.18-07-02592.1998. [DOI] [PMC free article] [PubMed] [Google Scholar]
- 6.Bell GP. Behavioral and ecological aspects of gleaning by the desert insectivorous bat, Antrozous pallidus (Chiroptera: Vespertilionidae). Behav Ecol Sociobiol. 1982;10:217–223. [Google Scholar]
- 7.Ben-Ari Y, Zigmond RE, Shute CD, Lewis PR. Regional distribution of choline acetyltransferase and acetylcholinesterase within the amygdaloid complex and stria terminalis system. Brain Res. 1977;120:435–445. doi: 10.1016/0006-8993(77)90397-3. [DOI] [PubMed] [Google Scholar]
- 8.Brown P. Vocal communication in the pallid bat, Antrozous pallidus. Z Tierpsychol. 1976;41:34–54. doi: 10.1111/j.1439-0310.1976.tb00469.x. [DOI] [PubMed] [Google Scholar]
- 9.Cahill L, McGaugh JL. Mechanisms of emotional arousal and lasting declarative memory. Trends Neurosci. 1998;21:294–299. doi: 10.1016/s0166-2236(97)01214-9. [DOI] [PubMed] [Google Scholar]
- 10.Campeau S, Davis M. Involvement of subcortical and cortical afferents to the lateral nucleus of the amygdala in fear conditioning measured with fear-potentiated startle in rats trained concurrently with auditory and visual conditioned stimuli. J Neurosci. 1995;15:2312–2327. doi: 10.1523/JNEUROSCI.15-03-02312.1995. [DOI] [PMC free article] [PubMed] [Google Scholar]
- 11.Casseday JH, Erlich D, Covey DE. Neural tuning for sound duration: role of inhibitory mechanisms in the inferior colliculus. Science. 1994;264:847–850. doi: 10.1126/science.8171341. [DOI] [PubMed] [Google Scholar]
- 12.Chen S, Aston-Jones G. Evidence that cholera toxin B subunit (CTb) can be avidly taken up and transported by fibers of passage. Brain Res. 1995;674:107–111. doi: 10.1016/0006-8993(95)00020-q. [DOI] [PubMed] [Google Scholar]
- 13.Clugnet MC, LeDoux JE. Synaptic plasticity in fear conditioning circuits: induction of LTP in the lateral nucleus of the amygdala by stimulation of the medial geniculate body. J Neurosci. 1990;10:2818–2824. doi: 10.1523/JNEUROSCI.10-08-02818.1990. [DOI] [PMC free article] [PubMed] [Google Scholar]
- 14.Faingold CL, Boersma-Anderson CA, Caspary DM. Involvement of GABA in acoustically-evoked inhibition in inferior colliculus neurons. Hear Res. 1991;52:201–216. doi: 10.1016/0378-5955(91)90200-s. [DOI] [PubMed] [Google Scholar]
- 15.Feldman S, Conforti N, Weidenfeld J. Limbic pathways and hypothalamic neurotransmitters mediating adrenocortical responses to neural stimuli. Neurosci Biobehav Rev. 1995;19:235–240. doi: 10.1016/0149-7634(94)00062-6. [DOI] [PubMed] [Google Scholar]
- 16.Fitzpatrick DC, Olsen JF, Suga N. Connections among functional areas in the mustached bat auditory cortex. J Comp Neurol. 1998;391:366–396. [PubMed] [Google Scholar]
- 17.Fuzessery ZM. Response selectivity for multiple dimensions of frequency sweeps in the pallid bat inferior colliculus. J Neurophysiol. 1994;72:1061–1079. doi: 10.1152/jn.1994.72.3.1061. [DOI] [PubMed] [Google Scholar]
- 18.Fuzessery ZM. Acute sensitivity to interaural time differences in the inferior colliculus of a bat that relies on passive sound localization. Hear Res. 1997;109:46–62. doi: 10.1016/s0378-5955(97)00053-1. [DOI] [PubMed] [Google Scholar]
- 19.Fuzessery ZM, Hall JC. Role of GABA in shaping frequency tuning and creating FM sweep selectivity in the inferior colliculus. J Neurophysiol. 1996;76:1059–1073. doi: 10.1152/jn.1996.76.2.1059. [DOI] [PubMed] [Google Scholar]
- 20.Fuzessery ZM, Hall JC. Sound duration selectivity in the pallid bat inferior colliculus. Hear Res. 1999;137:137–154. doi: 10.1016/s0378-5955(99)00133-1. [DOI] [PubMed] [Google Scholar]
- 21.Fuzessery ZM, Buttenhoff P, Andrews B, Kennedy JM. Passive sound localization of prey by the pallid bat (Antrozous p. pallidus). J Comp Physiol [A] 1993;171:767–777. doi: 10.1007/BF00213073. [DOI] [PubMed] [Google Scholar]
- 22.Gloor P. Temporal lobe epilepsy: its possible contribution to the understanding of the functional significance of the amygdala and of its interaction with neocortical-temporal mechanisms. In: Eleftheriou BE, editor. The neurobiology of the amygdala. Plenum; New York: 1972. pp. 423–457. [Google Scholar]
- 23.Hardy H, Heimer L, Switzer R, Watkins D. Simultaneous demonstration of horseradish peroxidase and acetylcholinesterase. Neurosci Lett. 1976;3:1–5. doi: 10.1016/0304-3940(76)90090-2. [DOI] [PubMed] [Google Scholar]
- 24.Herbert H, Aschoff A, Ostwald J. Topography of projections from the auditory cortex to the inferior colliculus in the rat. J Comp Neurol. 1991;304:103–122. doi: 10.1002/cne.903040108. [DOI] [PubMed] [Google Scholar]
- 25.Huffman RF, Henson OW., Jr The descending auditory pathway and acousticomotor systems: connections with the inferior colliculus. Brain Res Rev. 1990;15:295–323. doi: 10.1016/0165-0173(90)90005-9. [DOI] [PubMed] [Google Scholar]
- 26.Humphrey T. The telencephalon of the bat. I. The non-cortical nuclear masses and certain pertinent fiber connections. J Comp Neurol. 1936;65:603–711. [Google Scholar]
- 27.Hurley LM, Pollak GD. Serotonin differentially modulates responses to tones and frequency-modulated sweeps in the inferior colliculus. J Neurosci. 1999;19:8071–8082. doi: 10.1523/JNEUROSCI.19-18-08071.1999. [DOI] [PMC free article] [PubMed] [Google Scholar]
- 28.Iwai E, Yukie M. Amygdalofugal and amygdalopetal connections with modality-specific visual cortical areas in macaques (Macaca fuscata, M. mulatta, and M. fascicularis). J Comp Neurol. 1987;261:362–387. doi: 10.1002/cne.902610304. [DOI] [PubMed] [Google Scholar]
- 29.Johnston JB. Further contributions to the study of the evolution of the forebrain. J Comp Neurol. 1923;35:337–481. [Google Scholar]
- 30.Kaada BR. Stimulation and regional ablation of the amygdaloid complex with reference to functional representations. In: Eleftheriou BE, editor. The neurobiology of the amygdala. Plenum; New York: 1972. pp. 205–281. [Google Scholar]
- 31.Kanwal JS, Matsumura S, Ohlemiller K, Suga N. Analysis of acoustic elements and syntax in communication sounds emitted by mustached bats. J Acoust Soc Am. 1994;96:1229–1254. doi: 10.1121/1.410273. [DOI] [PubMed] [Google Scholar]
- 32.Klepper A, Herbert H. Distribution and origin of noradrenergic and serotonergic fibers in the cochlear nucleus and inferior colliculus of the rat. Brain Res. 1991;557:190–201. doi: 10.1016/0006-8993(91)90134-h. [DOI] [PubMed] [Google Scholar]
- 33.Krettek JE, Price JL. Projections from the amygdaloid complex to the cerebral cortex and thalamus in the rat and cat. J Comp Neurol. 1977a;172:687–722. doi: 10.1002/cne.901720408. [DOI] [PubMed] [Google Scholar]
- 34.Krettek JE, Price JL. Projections from the amygdaloid complex and adjacent olfactory structures to the entorhinal cortex and to the subiculum in the rat and cat. J Comp Neurol. 1977b;172:723–752. doi: 10.1002/cne.901720409. [DOI] [PubMed] [Google Scholar]
- 35.Krettek JE, Price JL. Amygdaloid projections to subcortical structures within the basal forebrain and brainstem in the rat and cat. J Comp Neurol. 1978a;178:225–254. doi: 10.1002/cne.901780204. [DOI] [PubMed] [Google Scholar]
- 36.Krettek JE, Price JL. A description of the amygdaloid complex in the rat and cat with observations on intra-amygdaloid axonal connections. J Comp Neurol. 1978b;178:255–280. doi: 10.1002/cne.901780205. [DOI] [PubMed] [Google Scholar]
- 37.LeDoux JE. Emotion circuits in the brain. Annu Rev Neurosci. 2000;23:155–184. doi: 10.1146/annurev.neuro.23.1.155. [DOI] [PubMed] [Google Scholar]
- 38.LeDoux JE, Sakaguchi A, Reis DJ. Subcortical efferent projections of the medial geniculate nucleus mediate emotional responses conditioned to acoustic stimuli. J Neurosci. 1984;4:683–698. doi: 10.1523/JNEUROSCI.04-03-00683.1984. [DOI] [PMC free article] [PubMed] [Google Scholar]
- 39.LeDoux JE, Ruggiero DA, Reis DJ. Projections to the subcortical forebrain from anatomically defined regions of the medial geniculate body in the rat. J Comp Neurol. 1985;242:182–213. doi: 10.1002/cne.902420204. [DOI] [PubMed] [Google Scholar]
- 40.LeDoux JE, Iwata J, Cicchetti P, Reis DJ. Different projections of the central amygdaloid nucleus mediate autonomic and behavioral correlates of conditioned fear. J Neurosci. 1988;8:2517–2529. doi: 10.1523/JNEUROSCI.08-07-02517.1988. [DOI] [PMC free article] [PubMed] [Google Scholar]
- 41.Leroy SA, Wenstrup JJ. Spectral integration in the inferior colliculus of the mustached bat. J Neurosci. 2000;20:8533–8541. doi: 10.1523/JNEUROSCI.20-22-08533.2000. [DOI] [PMC free article] [PubMed] [Google Scholar]
- 42.Linke R, De Lima AD, Schwegler H, Pape HC. Direct synaptic connections of axons from superior colliculus with identified thalamo-amygdaloid projection neurons in the rat: possible substrates of a subcortical visual pathway to the amygdala. J Comp Neurol. 1999;403:158–170. [PubMed] [Google Scholar]
- 43.Luppi PH, Fort P, Jouvet M. Iontophoretic application of unconjugated cholera toxin B subunit (CTb) combined with immunohistochemistry of neurochemical substances: a method for transmitter identification of retrogradely labeled neurons. Brain Res. 1990;534:209–224. doi: 10.1016/0006-8993(90)90131-t. [DOI] [PubMed] [Google Scholar]
- 44.Luppi PH, Aston-Jones G, Akaoka H, Chouvet G, Jouvet M. Afferent projections to the rat locus coeruleus demonstrated by retrograde and anterograde tracing with cholera-toxin B subunit and Phaseolus vulgaris leucoagglutinin. Neuroscience. 1995;65:119–160. doi: 10.1016/0306-4522(94)00481-j. [DOI] [PubMed] [Google Scholar]
- 45.Ma X, Suga N. Corticofugal modulation of duration-tuned neurons in the midbrain auditory nucleus in bats. Proc Natl Acad Sci USA. 2001;98:14060–14065. doi: 10.1073/pnas.241517098. [DOI] [PMC free article] [PubMed] [Google Scholar]
- 46. Maren S, Yap SA, Goosens KA. The amygdala is essential for the development of neuronal plasticity in the medial geniculate nucleus during auditory fear conditioning in rats. J Neurosci 21 2001. RC135(1–6). [DOI] [PMC free article] [PubMed] [Google Scholar]
- 47.Marsh RA, Grose CD, Wenstrup JJ, Fuzessery ZM. A novel projection from the basolateral nucleus of the amygdala to the inferior colliculus in bats. Soc Neurosci Abstr. 1999;25:1417. [Google Scholar]
- 48.McDonald AJ. Neurons of the lateral and basolateral amygdaloid nuclei: a Golgi study in the rat. J Comp Neurol. 1982;212:293–312. doi: 10.1002/cne.902120307. [DOI] [PubMed] [Google Scholar]
- 49.McDonald AJ. Glutamate and aspartate immunoreactive neurons of the rat basolateral amygdala: colocalization of excitatory amino acids and projections to the limbic circuit. J Comp Neurol. 1996;365:367–379. doi: 10.1002/(SICI)1096-9861(19960212)365:3<367::AID-CNE3>3.0.CO;2-2. [DOI] [PubMed] [Google Scholar]
- 50.McDonald AJ. Cortical pathways to the mammalian amygdala. Prog Neurobiol. 1998;55:257–332. doi: 10.1016/s0301-0082(98)00003-3. [DOI] [PubMed] [Google Scholar]
- 51.McDonald AJ, Jackson TR. Amygdaloid connections with posterior insular and temporal cortical areas in the rat. J Comp Neurol. 1987;262:59–77. doi: 10.1002/cne.902620106. [DOI] [PubMed] [Google Scholar]
- 52.Millhouse OE, de Olmos J. Neuronal configurations in lateral and basolateral amygdala. Neuroscience. 1983;10:1269–1300. doi: 10.1016/0306-4522(83)90112-4. [DOI] [PubMed] [Google Scholar]
- 53.Mitani A, Shimokouchi M, Nomura S. Effects of stimulation of the primary auditory cortex upon colliculogeniculate neurons in the inferior colliculus of the cat. Neurosci Lett. 1983;42:185–189. doi: 10.1016/0304-3940(83)90404-4. [DOI] [PubMed] [Google Scholar]
- 54.Mittmann DH, Wenstrup JJ. Combination-sensitive neurons in the inferior colliculus. Hear Res. 1995;90:185–191. doi: 10.1016/0378-5955(95)00164-x. [DOI] [PubMed] [Google Scholar]
- 55.Nagai T, Kimura H, Maeda T, McGeer PL, Peng F, McGeer EG. Cholinergic projections from the basal forebrain of rat to the amygdala. J Neurosci. 1982;2:513–520. doi: 10.1523/JNEUROSCI.02-04-00513.1982. [DOI] [PMC free article] [PubMed] [Google Scholar]
- 56.Novick A. Orientation in neotropical bats. II. Phyllostomatidae and Desmondontidae. J Mammal. 1963;44:44–56. [Google Scholar]
- 57.Ohlemiller KK, Kanwal JS, Suga N. Facilitative responses to species-specific calls in cortical FM-FM neurons of the mustached bat. NeuroReport. 1996;7:1749–1755. doi: 10.1097/00001756-199607290-00011. [DOI] [PubMed] [Google Scholar]
- 58.O'Neill WE, Frisina RD, Gooler DM. Functional organization of mustached bat inferior colliculus. I. Representation of FM frequency bands important for target ranging revealed by 14C-2-deoxyglucose autoradiography and single unit mapping. J Comp Neurol. 1989;284:60–84. doi: 10.1002/cne.902840106. [DOI] [PubMed] [Google Scholar]
- 59.Park TJ, Pollak GD. Azimuthal receptive fields are shaped by GABAergic inhibition in the inferior colliculus of the mustache bat. J Neurophysiol. 1994;72:1080–1102. doi: 10.1152/jn.1994.72.3.1080. [DOI] [PubMed] [Google Scholar]
- 60.Peyron C, Petit JM, Jouvet M, Luppi P. Forebrain afferents to the rat dorsal raphe nucleus demonstrated by retrograde and anterograde methods. Neuroscience. 1998;82:443–468. doi: 10.1016/s0306-4522(97)00268-6. [DOI] [PubMed] [Google Scholar]
- 61.Pitkänen A, Savander V, LeDoux JE. Organization of intra-amygdaloid circuitries in the rat: an emerging framework for understanding functions of the amygdala. Trends Neurosci. 1997;20:517–523. doi: 10.1016/s0166-2236(97)01125-9. [DOI] [PubMed] [Google Scholar]
- 62.Pitkänen A, Jolkkonen E, Kemppainen S. Anatomic heterogeneity of the rat amygdaloid complex. Folia Morphol. 2000;59:1–23. [PubMed] [Google Scholar]
- 63.Poremba A, Gabriel M. Amygdalar efferents initiate auditory thalamic discriminative training-induced neuronal activity. J Neurosci. 2001;21:270–278. doi: 10.1523/JNEUROSCI.21-01-00270.2001. [DOI] [PMC free article] [PubMed] [Google Scholar]
- 64.Portfors CV, Wenstrup JJ. Delay-tuned neurons in the inferior colliculus of the mustached bat: implications for analyses of target distance. J Neurophysiol. 1999;82:1326–1338. doi: 10.1152/jn.1999.82.3.1326. [DOI] [PubMed] [Google Scholar]
- 65.Portfors CV, Wenstrup JJ. Responses to combinations of tones in the nuclei of the lateral lemniscus. J Assoc Res Otolaryngol. 2001a;2:104–117. doi: 10.1007/s101620010057. [DOI] [PMC free article] [PubMed] [Google Scholar]
- 66.Portfors CV, Wenstrup JJ (2001b) Neurons in the IC of the mustached bat show multiple facilitatory and inhibitory frequency response areas. Paper presented at the 24th Midwinter Meeting of the Association for Research in Otolaryngology, St. Petersburg Beach, FL, February.
- 67.Price JL, Russchen FT, Amaral DG. The limbic region. II. The amygdaloid complex. In: Björkllund A, Höfelt T, Swanson LW, editors. Handbook of chemical neuroanatomy, Vol 5, Integrated systems of the CNS, Pt I. Elsevier; Amsterdam: 1987. pp. 279–388. [Google Scholar]
- 68.Razak KA, Fuzessery ZM, Lohuis TD. Single cortical neurons serve both echolocation and passive sound localization. J Neurophysiol. 1999;81:1438–1442. doi: 10.1152/jn.1999.81.3.1438. [DOI] [PubMed] [Google Scholar]
- 69.Rizvi TA, Ennis M, Behbehani MM, Shipley MT. Connections between the central nucleus of the amygdala and the midbrain periaqueductal gray: topography and reciprocity. J Comp Neurol. 1991;303:121–131. doi: 10.1002/cne.903030111. [DOI] [PubMed] [Google Scholar]
- 70.Robertson B, Grant G. A comparison between wheat germ agglutinin- and choleragenoid-horseradish peroxidase as anterogradely transported markers in central branches of primary sensory neurons in the rat with some observations in the cat. Neuroscience. 1985;14:895–905. doi: 10.1016/0306-4522(85)90152-6. [DOI] [PubMed] [Google Scholar]
- 71.Rogan MT, LeDoux JE. LTP is accompanied by commensurate enhancement of auditory-evoked responses in a fear conditioning circuit. Neuron. 1995;15:127–136. doi: 10.1016/0896-6273(95)90070-5. [DOI] [PubMed] [Google Scholar]
- 72.Saldaña E, Feliciano M, Mugnaini E. Distribution of descending projections from primary auditory neocortex to inferior colliculus mimics the topography of intracollicular projections. J Comp Neurol. 1996;371:15–40. doi: 10.1002/(SICI)1096-9861(19960715)371:1<15::AID-CNE2>3.0.CO;2-O. [DOI] [PubMed] [Google Scholar]
- 73.Stefanacci L, Amaral DG. Topographic organization of cortical inputs to the lateral nucleus of the macaque monkey amygdala: a retrograde tracing study. J Comp Neurol. 2000;421:52–79. doi: 10.1002/(sici)1096-9861(20000522)421:1<52::aid-cne4>3.0.co;2-o. [DOI] [PubMed] [Google Scholar]
- 74.Sun XD, Jen PH, Sun DX, Zhang SF. Corticofugal influences on the responses of bat inferior collicular neurons to sound stimulation. Brain Res. 1989;495:1–8. doi: 10.1016/0006-8993(89)91212-2. [DOI] [PubMed] [Google Scholar]
- 75.Swanson LW, Petrovich GD. What is the amygdala? Trends Neurosci. 1998;21:323–331. doi: 10.1016/s0166-2236(98)01265-x. [DOI] [PubMed] [Google Scholar]
- 76.Syka J, Popelar J. Inferior colliculus in the rat: neuronal responses to stimulation of the auditory cortex. Neurosci Lett. 1984;51:235–240. doi: 10.1016/0304-3940(84)90557-3. [DOI] [PubMed] [Google Scholar]
- 77.Weinberger NM. Physiological memory in primary auditory cortex: characteristics and mechanisms. Neurobiol Learn Mem. 1998;70:226–251. doi: 10.1006/nlme.1998.3850. [DOI] [PubMed] [Google Scholar]
- 78.Wenstrup JJ, Grose CD. Inputs to combination-sensitive neurons in the medial geniculate body of the mustached bat: the missing fundamental. J Neurosci. 1995;15:4693–4711. doi: 10.1523/JNEUROSCI.15-06-04693.1995. [DOI] [PMC free article] [PubMed] [Google Scholar]
- 79. Wenstrup JJ, Leroy SA. Spectral integration in the inferior colliculus: role of glycinergic inhibition in response facilitation. J Neurosci 21 2001. RC124(1–6). [DOI] [PMC free article] [PubMed] [Google Scholar]
- 80.Wenstrup JJ, Larue DT, Winer JA. Projections of physiologically defined subdivisions of the inferior colliculus in the mustached bat: targets in the medial geniculate body and extrathalamic nuclei. J Comp Neurol. 1994;346:207–236. doi: 10.1002/cne.903460204. [DOI] [PubMed] [Google Scholar]
- 81.Wenstrup JJ, Fuzessery ZM, Grose CD (1996) Inputs to the inferior colliculus underlying low frequency hearing in the pallid bat: substrates of functionally distinct responses. Paper presented at the 19th Midwinter Meeting of the Association for Research in Otolaryngology, St. Petersburg Beach, FL, February.
- 82.Wenstrup JJ, Mittmann DH, Grose CD. Inputs to combination-sensitive neurons of the inferior colliculus. J Comp Neurol. 1999;409:509–528. doi: 10.1002/(sici)1096-9861(19990712)409:4<509::aid-cne1>3.0.co;2-s. [DOI] [PubMed] [Google Scholar]
- 83.Winer JA, Larue DT, Diehl JJ, Hefti BJ. Auditory cortical projections to the cat inferior colliculus. J Comp Neurol. 1998;400:147–174. [PubMed] [Google Scholar]
- 84.Woolf NJ, Butcher LL. Cholinergic projections to the basolateral amygdala: a combined Evans blue and acetylcholinesterase analysis. Brain Res Bull. 1982;8:751–763. doi: 10.1016/0361-9230(82)90102-2. [DOI] [PubMed] [Google Scholar]
- 85.Yan J, Ehret G. Corticofugal reorganization of the midbrain tonotopic map in mice. NeuroReport. 2001;12:3313–3316. doi: 10.1097/00001756-200110290-00033. [DOI] [PubMed] [Google Scholar]
- 86.Yan J, Suga N. Corticofugal modulation of time-domain processing of biosonar information in bats. Science. 1996;273:1100–1103. doi: 10.1126/science.273.5278.1100. [DOI] [PubMed] [Google Scholar]
- 87.Yan J, Suga N. Corticofugal amplification of facilitative auditory responses of subcortical combination-sensitive neurons in the mustached bat. J Neurophysiol. 1999;81:817–824. doi: 10.1152/jn.1999.81.2.817. [DOI] [PubMed] [Google Scholar]
- 88.Yasui Y, Itoh K, Sugimoto T, Kaneko T, Mizuno N. Thalamocortical and thalamo-amygdaloid projections from the parvicellular division of the posteromedial ventral nucleus in the cat. J Comp Neurol. 1987;257:253–268. doi: 10.1002/cne.902570210. [DOI] [PubMed] [Google Scholar]
- 89.Yukie M. Connections between the amygdala and auditory cortical areas in the macaque monkey. Neurosci Res. 2002;42:219–229. doi: 10.1016/s0168-0102(01)00325-x. [DOI] [PubMed] [Google Scholar]
- 90.Zook JM, Winer JA, Pollak GD, Bodenhamer RD. Topology of the central nucleus of the mustache bat's inferior colliculus: correlation of single unit response properties and neuronal architecture. J Comp Neurol. 1985;231:530–546. doi: 10.1002/cne.902310410. [DOI] [PubMed] [Google Scholar]