

Abstract
Primary motor cortex (MI) neurons discharge vigorously during voluntary movement. A cardinal symptom of Parkinson's disease (PD) is poverty of movement (akinesia). Current models of PD thus hypothesize that increased inhibitory pallidal output reduces firing rates in frontal cortex, including MI, resulting in akinesia and muscle rigidity. We recorded the simultaneous spontaneous discharge of several neurons in the arm-related area of MI of two monkeys and in the globus pallidus (GP) of one of the two. Accelerometers were fastened to the forelimbs to detect movement, and surface electromyograms were recorded from the contralateral arm of one monkey. The recordings were conducted before and after systemic treatment with 1-methyl-4-phenyl-1,2,3,6-tetrahydropyridine (MPTP), rendering the animals severely akinetic and rigid with little or no tremor. The mean spontaneous MI rates during periods of immobility (four to five spikes/sec) did not change after MPTP; however, in this parkinsonian state, MI neurons discharged in long bursts (sometimes >2 sec long). These bursts were synchronized across many cells but failed to elicit detectable movement, indicating that even robust synchronous MI discharge need not result in movement. These synchronized population bursts were absent from the GP and were on a larger timescale than oscillatory synchrony found in the GP of tremulous MPTP primates, suggesting that MI parkinsonian synchrony arises independently of basal ganglia dynamics. After MPTP, MI neurons responded more vigorously and with less specificity to passive limb movement. Abnormal MI firing patterns and synchronization, rather than reduced firing rates, may underlie PD akinesia and persistent muscle rigidity.
Keywords: correlations, neuronal synchronization, EMG, firing patterns, intracortical microstimulation, monkey, striatum, globus pallidus, kinesthetic, oscillations
The normal execution of voluntary movement is correlated with an increase in the synchronous discharge of primary motor cortex (MI) neurons (Evarts, 1965; Porter and Lemon, 1993; Ohara et al., 2001). Many Parkinson's disease (PD) patients suffer from a deficit of voluntary movement, termed akinesia, as well as increased muscle rigidity. These facts have been incorporated succinctly into current physiological models of PD (Albin et al., 1989;DeLong, 1990). They hypothesize that the loss of midbrain dopaminergic cells leads to changes in firing rates throughout the basal ganglia (BG) that ultimately decrease motor cortical output, resulting in akinesia and rigidity. It follows that the predicted suppression of motor cortical discharge should be evident in MI, because it is the area of frontal cortex that is most closely related to spinal cord output and to the final execution of movement (Asanuma, 1989; Porter and Lemon, 1993).
Evidence from various human studies, including regional cerebral blood flow (Playford et al., 1992; Rascol et al., 1994), functional magnetic resonance imaging (fMRI) (Sabatini et al., 2000; Haslinger et al., 2001), and transcranial magnetic stimulation (Ridding et al., 1995;Kleine et al., 2001), fails to support the notion that MI activation or excitability is decreased in PD. Similarly, direct measurement of single-unit discharge (Doudet et al., 1990; Watts and Mandir, 1992) and cerebral metabolic studies (Porrino et al., 1987; Schwartzman et al., 1988) in primates rendered parkinsonian by 1-methyl-4-phenyl-1,2,3,6-tetrahydropyridine (MPTP) lesions have shown no evidence of a lasting decrease in MI activity. However, most of these studies focused on task- or movement-related discharge, and the animal studies were conducted on mildly affected or recovered animals. The enduring symptoms of severe akinesia and rigidity suggest that the presumed suppression of firing rates should be present in the spontaneous activity of MI neurons (i.e., during periods of immobility).
Physiological studies in tremulous parkinsonian subjects have found prominent changes in neuronal discharge patterns and in synchronization between neurons throughout the BG (Nini et al., 1995; Levy et al., 2000; Raz et al., 2000). This increased synchronization in the BG is accompanied by a loss of neuronal specificity in the globus pallidus (GP) in response to passive joint manipulation (Filion et al., 1988;Boraud et al., 2000) and striatal microstimulation (Tremblay et al., 1989). Because BG circuits are closely tied to the cortex (Gerfen and Wilson, 1996; Hoover and Strick, 1999; Bolam et al., 2000), it is likely that changes in neuronal synchronization and specificity will arise in the cortex as well.
The aims of this study were (1) to directly test the hypothesis that the mean spontaneous discharge in MI is reduced after MPTP treatment; (2) to characterize the population activity of MI neurons as revealed by the multiple electrode recording technique and compare it with the population activity of BG neurons; (3) to test whether MPTP treatment induces changes in the specificity of joint representation in MI; and (4) to determine whether MI micro-excitability is altered by MPTP treatment, as reflected in the responses to intracortical microstimulation (ICMS).
MATERIALS AND METHODS
Experimental design. Two monkeys (monkey S:Cercopithecus aethiops aethiops, female, weight 3.5 kg; monkey Z: Macaca fascicularis, female, 2 kg) were trained to perform a self-initiated button-pressing task with their dominant hand. With each monkey we used a slightly different design to address the issue of spontaneous MI activity. Monkey S performed the task throughout the whole recording session in the normal state. In this monkey, the spontaneous activity was defined as the neuronal activity during periods of the monkey's immobility determined by use of accelerometry (see below). The average duration of the periods of immobility was on the order of a few seconds long. In contrast, monkey Z was trained to sit quietly until given a liquid reward that signaled it to commence the motor task. Thus, in this monkey we were able to record spontaneous activity for several (∼15) minutes while the monkey was at rest. Nevertheless, we again used accelerometry to exclude segments of data that included movements. Both monkeys were rendered parkinsonian by systemic treatment with the MPTP neurotoxin (see below). In the MPTP-treated state, the monkeys were akinetic and did not perform the task. Throughout the whole recording sessions in both states, the examiners verified regularly that the monkeys were awake. An additional monkey (monkey G: Macaca mulatta, female, 3.5 kg) that participated in another study and was not treated with MPTP was used as control for the histology.
The monkeys' health was monitored by a veterinarian, and their fluid consumption, diet, and weight were monitored daily. The monkeys' care and surgical procedures were in accordance with the NIH Guide for the Care and Use of Laboratory Animals (1996) and the Hebrew University guidelines for the use and care of laboratory animals in research, supervised by the institutional committee for animal care and use.
Surgical and neuronal recording procedures. After training, a square recording chamber with a 27 mm (inner) side was attached to the skull under deep ketamine–xylazine anesthesia in aseptic conditions. Location of the chamber was determined with the aid of MRI (Biospec Bruker 4.7 tesla animal system; fast-spin echo sequence; effective echo time = 80 msec and repetition time = 2.5 sec; 13 coronal slices, 2 mm wide). The sides of the chamber were aligned with the coronal and sagittal planes. The chamber was placed such that its center lay in the stereotactic A10 plane. Thus the central and arcuate sulci were within the chamber, and, in monkey S, good access to striatum and GP was available in the anterior part of the chamber. In this monkey, the recording chamber was tilted 45° laterally in the coronal plane to optimize access to GP. In each recording day, eight glass-coated tungsten (0.2–1.2 MΩ at 1 kHz) electrodes, confined to a 1.65 mm inner diameter guide tube, were inserted into the brain in the following manner. For cortical penetrations (Fig.1), the electrodes were first lowered manually to ∼3 mm above the dura mater. Then a mechanical micro-drive (EPS 1.28, Alpha-Omega Engineering, Nazareth, Israel) was used to lower each electrode individually through the dura to the cortex while tracking its depth. All recording sites were within a 6 mm (mediolateral) by 5 mm (anteroposterior) region of the precentral gyrus in both monkeys. For GP penetrations, the guide tube with the eight electrodes was advanced ∼9 mm into the brain, and then each electrode was individually driven through the striatum to the vicinity of GP cells. Striatal neurons were often encountered during the GP sessions and were recorded as well. The output of the electrodes was amplified ×104, bandpass filtered (0.3–6 kHz, four-pole Butterworth filter), and fed to a template-matching device to isolate the extracellular activity of 1–3 units per electrode. The timing of the detected spikes was sampled at 12 kHz (MCP+, MSD2.1, AlphaMap 4.8, Alpha-Omega Engineering). Neurons were selected by isolation quality and recording stability only. The number of recording sessions (and days) used for the analysis is listed in Table1.
Fig. 1.

Experimental setup: simultaneous recording of multiple electrodes, accelerometers, and surface EMGs. Monkeys were trained to execute a self-initiated button-pressing task. Eight electrodes were lowered to the brain (cortical penetrations depicted). Accelerometers were fastened to both wrists (contralateral working hand depicted) to detect movement. In monkey Z, surface EMG was recorded from the biceps and triceps of the working arm.
Table 1.
The neuronal database
| Monkey S | Monkey Z | |||||
|---|---|---|---|---|---|---|
| GP and striatum | MI | MI | ||||
| Normal | MPTP | Normal | MPTP | Normal | MPTP | |
| Number of recording sessions (days)1-a | 16 (9) | 22 (6) | 10 (7) | 19 (7) | 7 (3) | 11 (5) |
| Median number of units recorded per session | 9.5 | 9.5 | 17.5 | 18 | 18 | 18 |
| Duration of recording sessions (minutes) (mean ± SD) | 55 ± 17 | 26.7 ± 3.7 | 80 ± 26 | 51.8 ± 2.3 | 32.3 ± 3.4 | 31.8 ± 3.3 |
| Median number of well-isolated and stable units per session | 6.5 | 5 | 11 | 11 | 12 | 14 |
| Duration of recording from the stable and well-isolated units (minutes)1-b (mean ± SD) | 21 ± 12 | 22 ± 8 | 31 ± 16 | 25 ± 13 | 13.5 ± 6.5 | 24 ± 8 |
Multiple sessions per day were conducted at progressively deeper depths of the same penetration.
In the normal state the duration includes only the periods of immobility.
Somatosensory examination and intracortical microstimulation. Somatosensory examination and ICMS were used to verify the location of the electrodes within the arm area of MI. At the end of every recording day we assessed the responsiveness of each recording site to passive manipulation of six joints in the contralateral limbs (shoulder, elbow, wrist, hip, knee, and ankle). The strength of responsiveness of a site was graded according to the multiunit activity it elicited: 0 = no response; ? = questionable response; 1 = background/hash response; 2 = response of cells at foreground. In cortical sessions, after somatosensory examination, we injected 100 msec, 300 Hz trains of 0.2 msec cathodic current pulses with amplitudes ranging from 5 to 40 μA through each of the recording electrodes. Two to three examiners visually monitored the monkeys and determined the threshold current for eliciting movement of the contralateral arm. This protocol (using one to two electrodes) was used also during standard mapping sessions conducted before the commencement of the recording sessions to determine the location of the arm area of MI within the recording chamber. In monkey S, mapping sessions (including somatosensory examination) were conducted to localize GP within the chamber as well.
MPTP treatment. MPTP-HCl (Sigma, St. Louis, MO) was injected systemically five times over a period of 4 d (0.4 mg/kg per injection, i.m.) under mild ketamine anesthesia. After the first MPTP injection, both monkeys were clinically assessed on a regular basis using the Hoehn and Yahr (1967) clinical staging scale (0–5). Monkey Z was also clinically rated using a primate rating scale (Benazzouz et al., 1995) with the following items: tremor (0–3), body posture (0–3), general activity (0–3), vocalization (0–2), freezing (0–2) rigidity (0–3 for each side), and frequency of arm movement (0–3 for each upper limb). The maximum disability score is 25. The threshold for severe parkinsonism is defined at 15 (Imbert et al., 2000).
Accelerometer and Electromyogram data collection and analysis. Two uni-axial accelerometers (8630C5, Kistler, Amherst, NY) were fastened to the wrists of each of the monkeys (Fig. 1). In monkey S, two additional accelerometers were attached to the ankles. The output of the accelerometers was sampled at 0.8 kHz. During the recording sessions in the MPTP state, the monkeys were generally immobile and did not perform the task. Therefore, to make a valid comparison between the normal and MPTP states, it was necessary to discriminate between periods of limb movements (“active periods”) and periods of immobility (“immobile periods”) in the normal state. We used the accelerometer on the contralateral (working) arm to make this classification. The output of the accelerometers was zero-phase bandpass filtered (1–30 Hz) and a root mean square (rms) version of the signal was calculated (averages were estimated over running windows of 0.8 sec). When a segment of the rms signal from the contralateral wrist exceeded a predetermined threshold of 0.05g (=25 cm × sec−2) it was defined as an active period. Visual inspection of the other accelerometer traces proved that the output of this single accelerometer was a reliable measure of whether the monkey was active. The comparison between the normal and the MPTP states was conducted only for the periods of immobility.
In monkey Z, surface EMG electrodes were attached to the bellies of the triceps and biceps of the contralateral arm (Fig. 1). The electromyogram (EMG) was amplified and rectified, and its rms was sampled at 0.8 kHz.
Neuronal data analysis. Only spike trains judged during the real-time sorting to be emitted by a single cell were subjected to rate stability analysis. In the rate stability analysis, a smoothed estimate of the instantaneous rate of a neuron as a function of time was displayed for the whole period of recording. Then the largest segment of data for which the following criteria were met was kept for further analysis: (1) the statistics of the rate of the unit within the segment were judged visually to be stationary (e.g., no abrupt changes or trends in instantaneous rate), and (2) the interspike interval (ISI) histogram of the unit calculated over this segment was judged visually to increase monotonically from zero at bin zero [indicating that the unit displays a refractory period and hence is well isolated (Fee et al., 1996)]. Table 1 lists the median number of units per session that were originally detected, followed by those that met the above criteria. It also indicates the duration of recording from these stable and well isolated units.
After stability analysis, the firing rates, autocorrelograms (ACs), and pairwise cross-correlograms (CCs) of the cells were calculated. The CCs were calculated only for pairs of cells recorded by different electrodes to avoid artifacts caused by sorting shading (Bar-Gad et al., 2001). The correlograms were calculated as follows: coincidence histograms at 1 msec resolution were estimated over periods of immobility that were at least 2 sec long (twice the maximum lag-shift). A smoothed coincidence histogram (SCH) was created using aK = 81 bin (msec) moving average and was then normalized to units of rate (spikes per second) to generate the correlograms (the zero lag of the ACs was set to zero before smoothing). The ACs were calculated only for cells with segments of stable recording and isolation that contained at least 400 spikes. Similarly, CCs were calculated only for pairs in which each cell fired at least 400 spikes during their joint period of stable recording and isolation. We estimated the SD of the SCH at lag shift tby:
where HSCH is a heavily smoothed version of the coincidence histogram (using a 251 bin moving average). SD(·) thus accounts for the local variability of the SCH(·). Confidence intervals for the correlograms were set to 4.5 SDs normalized to units of rate around the expected value of the CC(·) estimated at the flanks (absolute lag shift >900 msec). This conservative threshold was used because it efficiently removed what were visually judged to be spurious excursions of the correlograms. However, performing the analysis with less conservative confidence intervals did not change the results.
To quantify the strength of the association between neurons, we defined for each pair an association index (AI) as the relative increase in the number of spikes fired as a result of the association between the cells. The AI is defined as follows:
where CC(t) is the cross-correlogram value at lag shift t in spikes per second, [t1,t2] is the range of lag shifts where the CC exceeds its upper confidence level, and R is the expected value of CC(·) estimated at the flanks of the CCs. Thus AI is the percentage of additional spikes (relative to the expected number) fired by one cell because of its association with the other and is independent of which of the two cells is tagged as the reference cell [this is essentially the same as the “mean percent increase” used by Murthy and Fetz (1996)]. The auto-association index (AAI) of a single neuron was defined in the same manner with CC(·) replaced by AC(·). When a correlogram did not exceed the upper confidence level at any lag shift, the AI or AAI was set to zero percent. When the AI value exceeded 50% we defined the pair of cells as “strongly synchronized.”
To further quantify the degree of “burstiness” at the single-unit level in the MPTP versus the normal state, we used a test motivated by the Kaneoke–Vitek algorithm (Kaneoke and Vitek, 1996). For a given spike train we first calculated the duration of its mean ISI and then rebinned the spike train into segments of this duration. We thus create a stochastic process of the number of spikes per bin, denoted byPt. The mean of this process is unity, by construction. We used the following statistic L to quantify the degree of burstiness of a spike train: L is the number of distinct values taken on by the rebinned processPt. If a cell is bursty itsPt will attain large values (many spikes per mean ISI). To test whether there is a change in burstiness in MI after MPTP we compared the distribution of L between the normal immobile and the MPTP states. We preferred to use theL statistic rather than the range of values taken on byPt, because the former is insensitive to outliers. However, using the range statistic gave the same statistical results. Obviously, the value of both these statistics depends on the duration of the recording. However, in monkey S the mean duration was longer in the normal state, and in monkey Z the mean duration was longer in the MPTP state (see Table 1), so a consistent result across monkeys regarding these statistics would indicate that it is not an artifact caused by the duration of recordings.
Histology. After the last recording session (days 57 and 22 from last injection to monkeys S and Z, respectively), the monkeys were deeply anesthetized with a lethal dose of pentobarbital and killed by perfusion through the heart with saline followed by a 4% paraformaldehyde solution in 0.1 m phosphate buffer, pH 7.4. The brains were removed and cryoprotected in increasing gradients of sucrose (10, 20, and finally 30%). Serial sections of 50 μm were cut on a freezing microtome, and every eighth section was processed for either immunocytochemistry for tyrosine hydroxylase (TH) or a Nissl stain.
Tissue processed for TH immunocytochemistry was incubated with antisera to TH (1:20,000; Eugene Tech, Inc.) in 0.1 m phosphate buffer with 0.3% Triton X-100 and 10% normal goat serum (Incstar) for four nights at 4°C and further processed using the avidin–biotin method (rabbit Elite Vectastain ABC Kit, Vector Labs). Sections were rinsed first in PBS and then in Tris buffer (0.05 m, pH 7.6) and preincubated in a filtered 0.05% 3,3′-diaminobenzidine tetra-hydrochloride solution in Tris buffer for 10 min, before adding 0.01% H2O2.
RESULTS
Clinical and histological effects of the MPTP treatment
Systemic MPTP treatment rendered the monkeys severely akinetic and rigid with abnormal flexed posture. The parkinsonian symptoms stabilized in both monkeys 8 d after the first MPTP injection and remained stable up to the conclusion of the experiment. Examination of the output of the accelerometers showed that the monkeys displayed no (monkey S) or very infrequent (monkey Z) episodes of tremor after MPTP treatment. Both monkeys rated stage 5 on the Hoehn and Yahr Scale (Hoehn and Yahr, 1967). Monkey Z rated 17.3 ± 1.0 (mean ± SD; n = 7 d) on the primate rating scale (Benazzouz et al., 1995; Imbert et al., 2000).
In the control animal, there was dense TH immunoreactivity throughout the striatum (Fig. 2, rows 1and 2). The intensity of staining for TH immunoreactivity was heterogeneous, with a patchy and uneven pattern. Consistent with the behavioral deficits, both MPTP-treated animals showed an almost complete loss of TH staining throughout the caudate nucleus and the putamen. In contrast to the lack of staining in the dorsal striatum, there were patches of TH immunoreactivity in the ventral striatum. In particular, the shell of the nucleus accumbens remained TH positive (Fig. 2, row 1). There are two groups of midbrain dopamine cells, a dorsal tier (ventral tegmental area and the retrorubral group) and a ventral tier (substantia nigra, pars compacta), that have different vulnerabilities to the toxic effects of MPTP (Lavoie and Parent, 1991; Song and Haber, 2000) and different projection patterns (Lynd and Haber, 1994). The dorsal tier is less vulnerable to toxic insult and projects to the ventral striatum, whereas the ventral tier is more vulnerable to toxic insult and projects to the dorsal striatum. The pattern of striatal loss of TH immunoreactivity in monkeys S and Z is consistent with these characteristics of the dorsal and ventral tier midbrain dopamine cells. The TH cell loss was concentrated in the ventral tier, whereas in the dorsal tier the cells were selectively spared (Fig. 2, rows 3 and 4). The Nissl-stained sections further demonstrate the loss of neurons in the ventral tier, compared with control. Instead, a massive microglia reaction infiltrates the area previously occupied by neurons (Fig. 2, row 5).
Fig. 2.
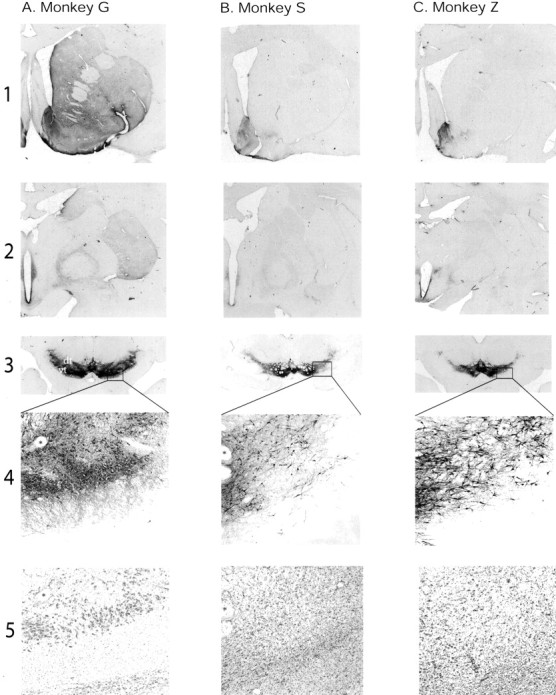
Photomicrographs of tyrosine hydroxylase (TH) (rows 1-4) and Nissl staining (row 5) through the striatum and midbrain of a normal control (A) and the two MPTP-treated animals (B–C); rostral striatum (row 1); central striatum (row 2); and midbrain (rows3 and 4). Row 5depicts the adjacent sections stained for Nissl. Theasterisks in rows 4 and 5mark corresponding blood vessels. Note the lack of TH-positive staining throughout most of the striatum in the MPTP-treated animals. The shell region of the ventral striatum, however, is selectively spared (rows1 and 2). TH-positive cells are selectively lost in the ventral tier (vt,3A, in white). In contrast, cells in the dorsal tier (dt) are selectively spared (row3). Row 4 depicts the magnified views of the boxed areas in row 3. Each region is taken at the border between TH-positive cells and the lack of cells. The photomicrographs from the MPTP-treated animals are taken at a more dorsal level, at the junction between the dorsal and ventral tier cells. The photomicrograph from the normal control animal was taken at the junction between the ventral tier cells and the pars reticulata. The Nissl-stained sections (row 5) demonstrate the lack of neurons in the ventral tier of the MPTP-treated animals. Although in the control animal Nissl-stained neurons are clearly evident, in the MPTP-treated animals a massive glial infiltration has largely replaced the compacta cells.
Effects of MPTP as reflected in the EMG and accelerometer traces
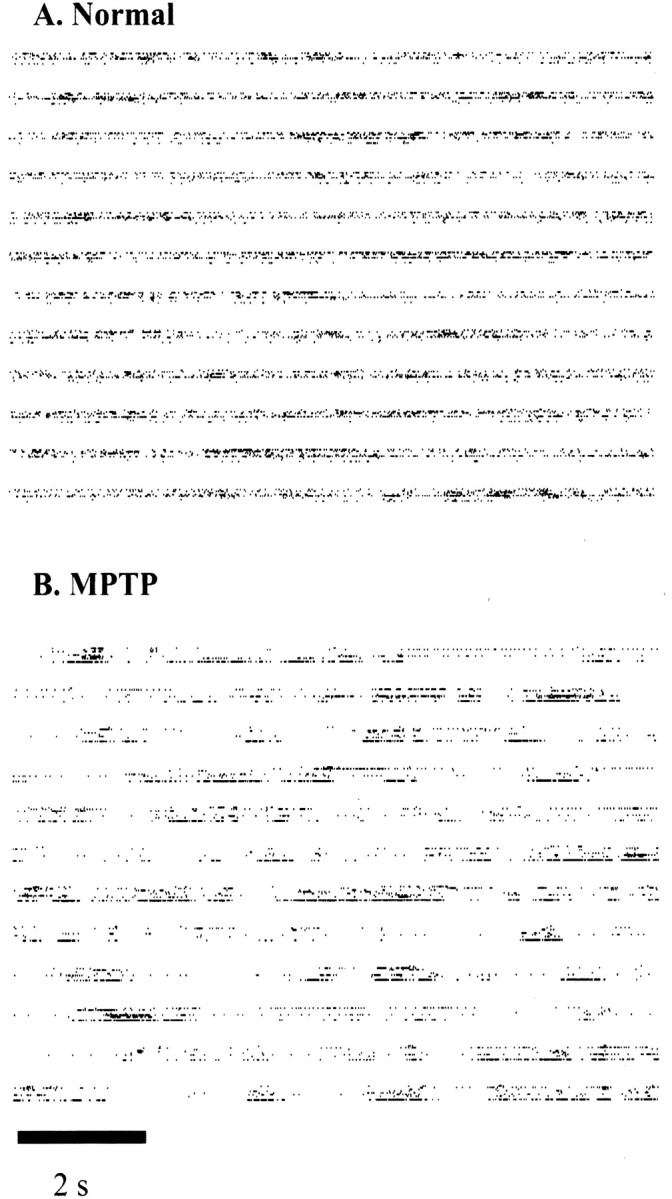
In monkey Z, the EMG recordings in the normal state often exhibited the characteristic tri-phasic pattern of muscle activation (agonist–antagonist–agonist) (Basmajian and De Luca, 1985) during movement (Fig. 3A). In contrast, the accelerometer and EMG traces showed very little modulation throughout the MPTP sessions and failed to show any obvious temporal relationship to the neuronal bursts (Fig.4B). On the rare occasions when sporadic movements were detected in the MPTP state, the EMG revealed coactivation of the antagonistic muscles (Fig.3B) (Doudet et al., 1990; Benazzouz et al., 1992).
Fig. 3.

Activation patterns of antagonistic muscles in the normal and MPTP states of Monkey Z. A,Normal; B, MPTP.Top, Output of accelerometer attached to the wrist of the working arm. Bottom, EMG recording from biceps and triceps of the working arm. Calibration: horizontal, 1 sec; vertical (accelerometer traces), 0.5 g (=490 cm × sec−2). Scale of EMG is arbitrary. Note the tri-phasic pattern of muscle activation (biceps leading) in the normal voluntary movement, in contrast to the completely overlapping co-contraction in the MPTP movements.
Fig. 4.

Neuronal discharge in the arm area of MI and contralateral arm movements in the normal and MPTP states of Monkey S.A, Normal; B,MPTP. A, B, Top traces, Extracellular activity recorded from eight electrodes simultaneously.Bottom, Output of accelerometer attached to the contralateral wrist. Bars below the accelerometer trace in A represent active periods of the monkey. Calibration: horizontal, 1 sec; vertical (accelerometer traces), 1g.
To quantify the paucity of movement, we calculated the percentage of time that the accelerometers spent above the 0.05g threshold during the MI recording sessions (Table1). The total duration of these active periods decreased significantly after MPTP. In monkey S it decreased from 40.0 ± 5.2% (mean ± SEM) in the normal state to 5.4 ± 1.6% (p < 10−4) after MPTP, and in monkey Z it decreased from 12.7 ± 2.3% to 2.5 ± 0.8% (p < 10−3; two-sided two-sample t test). The difference between the monkeys in the normal state results from the different experimental designs used in the two animals. In monkey S the periods of immobility were interleaved among the self-initiated movements, whereas in monkey Z they were taken from the ∼15 min period before the animal began the motor task.
Effects of MPTP on firing rates of single MI cells
In the normal state, increases in MI firing rates that covary among neurons were typically confined to periods of movement (Fig.4A). In contrast, in the MPTP state, MI cells exhibited long volleys (sometimes >2 sec long) of synchronized bursts recorded across most electrodes, although no movement could be detected (Fig. 4B, raw data; 5, raster plots).
Parsing the MI data from the normal state into active and immobile periods revealed, as expected, that the firing rates were significantly higher in the active periods than in the immobile ones (Table2A). Comparison of overall mean firing rates between the normal immobile and MPTP states revealed no significant difference (Table 2A, Fig.6). Figure 5 demonstrates how this is possible. Although monkey Z sat restfully in the normal state, the cells had a rather constant firing rate; however, after MPTP treatment, several cells seem to fire in clusters separated by extended periods of silence (see also Fig. 4B).
Table 2.
Firing rates and synchronization of neurons in the arm area of MI in the normal and MPTP states
| Monkey S | Monkey Z | |||
|---|---|---|---|---|
| Normal | MPTP2-a | Normal | MPTP2-a | |
| A. Firing rates (spikes per second) | ||||
| n(cells) | 75 | 145 | 62 | 106 |
| During “active periods”2-b (mean ± SEM) | 5.9 ± 0.8 | 8.5 ± 1.3 | ||
| During “immobile periods”2-c(mean ± SEM) | 3.8 ± 0.5 | 4.3 ± 0.5 | 5.0 ± 0.8 | 4.5 ± 0.5 |
| B. Firing patterns2-d | ||||
| n(cells) | 65 | 124 | 51 | 104 |
| % (n) peaked autocorrelograms2-e | 100% (65) | 96% (119) | 100% (51) | 92% (96)* |
| Auto-association index (%)2-c,2-f(mean ± SEM) | 28 ± 3 | 42 ± 4* | 12 ± 2 | 28 ± 32-160 |
| C. Synchronization2-d | ||||
| n (pairs) | 128 | 435 | 136 | 372 |
| % (n) synchronized2-e | 52% (67) | 57% (246) | 29% (40) | 36% (135) |
| Association index (%)2-c,2-f (mean ± SEM) | 34 ± 2 | 50 ± 22-165 | 36 ± 3 | 50 ± 32-160 |
| % (n) of strongly synchronized pairs2-f,2-g | 12% (8) | 43% (106)2-165 | 10% (4) | 41% (56)2-165 |
All tests compare between the normal immobile and the MPTP states. p values:
<0.05;
F2-160: <0.01;
F2-165: <0.001.
Mean firing rates were significantly higher in the active periods relative to the immobile ones in the normal state (p < 0.001; one-sided pairedt test).
Two-sided two-sample ttest.
The threshold to determine whether the autocorrelograms or cross-correlograms were significantly peaked was set to the upper confidence level of the estimated correlogram. Shifting the threshold did not qualitatively change the results concerning the differences between the normal immobile and MPTP states vis-à-vis the percentage of peaked autocorrelograms and cross-correlograms or the distribution of their indices.
Two-sided Fisher exact test/χ2 test.
Only pairs with significant peaks (AI or AAI larger than 0%) were included.
Pairs with AI >50% were considered strongly synchronized.
Fig. 6.

Frequency distributions of the mean spontaneous firing rates of MI neurons in the normal immobile (A, C) and the MPTP (B, D) states. A,B, Monkey S; C,D, Monkey Z. Abscissa, spikes per second; ordinate, percentage;n, number of neurons; mean, mean ± SEM of firing rates in spikes per second. There is no significant difference in the population mean spontaneous rate between the normal immobile and the MPTP states (two-sided two-sample ttest; p > 0.45, monkey S; p > 0.5, monkey Z).
Fig. 5.
Raster plots of simultaneous spontaneous discharge of 9 units in the normal (A) and MPTP (B) states of monkey Z. In each panel 2 contiguous minutes of data (12 rows of 10 sec each) are depicted. Eachtick is a spike of one cell. Nine cells are depicted in each row. In A, the 2 min are from a period at the beginning of the session wherein the normal monkey sat restfully before the commencement of the behavioral task. In B, data are shown from the akinetic MPTP-treated monkey. Long population bursts (sometimes >2 sec long) separated by relatively quiescent periods are evident in the MPTP state. Calibration: 2 sec.
Effects of MPTP on firing patterns of MI cells
The appearance of bursts in the MPTP state is reflected in the autocorrelograms of the cells. As illustrated in Figure7, the autocorrelograms in the MPTP state tend to have larger and wider peaks, indicative of the increase in bursting discharge in this state compared with the immobile periods in the normal state. To quantify this increase, we calculated the AAI of each cell. There was a significant shift in the distribution of AAIs toward larger values in the MPTP state relative to the normal immobile state (Fig.8A,B). Similarly, the mean value of the AAI was significantly larger in the MPTP state (Table 2B). The L statistic [based on the Kaneoke–Vitek algorithm (Kaneoke and Vitek, 1996)] was also shifted significantly toward larger values, indicating a stronger tendency to burst after MPTP (Fig. 8C,D). This tendency was evident throughout all recording sessions and was not confined to certain penetration depths. Finally, no periodicities (in the 2–500 Hz range) were observed in any of the MI auto-coincidence histograms after MPTP.
Fig. 7.

Autocorrelograms of spontaneous discharge of MI neurons in the normal immobile and MPTP states. Solid line, Estimate of the auto-intensity function; dashed line, confidence intervals. Abscissa, Lag shift in milliseconds; range, ±1000 msec; ordinate, conditional discharge rate in spikes per second. The absence of the typical refractory period around time 0 is attributable to the smoothing used.
Fig. 8.

Spontaneous neuronal bursting in MI in the normal immobile and MPTP states. A, C,Monkey S; B, D,Monkey Z. A, B, Cumulative frequency distribution of the auto-association index (AAI) of neurons with significant peaks in their autocorrelograms. Dashed line, Normal; solid line, MPTP (abscissa, AAI;ordinate: percentage). The distribution in the MPTP state is shifted to the right, indicating that the AAIs are stochastically greater in this state than in the normal immobile one (two-sided Wilcoxon rank-sum test; monkey S, normal:n = 65, MPTP: n = 119,p < 0.02; monkey Z, normal: n= 51, MPTP: n = 96, p < 10−4). C,D, Cumulative frequency distribution of theL statistic. L is the size of the set of distinct values attained by the process of rebinning the spike train at its mean ISI. Dashed line, normal; solid line, MPTP (abscissa, L;ordinate, percentage). The distribution in the MPTP state is shifted to the right, indicating that the Lvalues are stochastically greater in this state than in the normal immobile one (two-sided Wilcoxon rank-sum test; monkey S, normal:n = 71, MPTP: n = 125, p < 10−4; monkey Z, normal:n = 57, MPTP: n = 106, p < 2 × 10⁻³).
Effects of MPTP on the synchronization of MI cells
The level of synchrony in MI is reflected in the cross-correlograms of simultaneously recorded neurons (Fig.9, monkey S; Fig.10, monkey Z). Although the cross-correlograms were relatively flat in the normal immobile state (Murthy and Fetz, 1996), they had broad (on the order of 1 sec long) pronounced peaks in the MPTP state. These peaks were centered on time 0 and were rather symmetrical. An enhancement of synchronization on such a broad timescale is more aptly described as a covariation of firing rates among neurons. The noisy character of the cross-coincidence histograms calculated between MI pairs with low firing rates precluded detection of a finer form of synchrony on the timescale of tens of milliseconds. The increase in the percentage of cross-correlograms with significant peaks in the MPTP state was not significant (Table 2C), indicating that pairs of neurons in the normal immobile state were as likely to be coupled as in the MPTP state. However, there was a significant shift in the distribution of AIs toward larger values (Fig.11) in the MPTP state. Similarly, there was a significant increase in the mean AI and in the percentage of strongly synchronized pairs in this state (Table 2C). This implies that the association between pairs is larger in the MPTP state and that there is a significantly larger subset of neuronal pairs that are abnormally coupled in this state. The enhancement of synchronization was evident in all recording sessions. As with the auto-coincidence histograms, no periodicities were observed in the MI cross-coincidence histograms after MPTP.
Fig. 9.

Cross-correlograms of spontaneous discharge of five simultaneously recorded MI neurons in the normal immobile and MPTP states of monkey S. Above diagonal, Normal; below diagonal, MPTP. Solid line, Estimate of conditional rate of the reference cell; dashed line, confidence intervals. Numbers at top of each column, reference cell; numbers to the right of each row, trigger cell.Abscissa, Lag shift in milliseconds; range, ±1000 msec;ordinate, conditional discharge rate in spikes per second.
Fig. 10.

Cross-correlograms of the spontaneous discharge of five simultaneously recorded MI neurons in the normal immobile and MPTP states of monkey Z. Format same as in Figure 9.
Fig. 11.

Synchronization in arm area of MI in the normal immobile and MPTP states. A, Monkey S.B, Monkey Z. Shown is the cumulative frequency distribution of the association index (AI) of pairs of neurons with significant peaks in their cross-correlograms. Dashed line, Normal;solid line, MPTP (abscissa,AI; ordinate, percentage). The distribution in the MPTP state is shifted to the right, indicating that the AIs are stochastically greater in this state than in the normal immobile one (two-sided Wilcoxon rank-sum test; monkey S, normal:n = 67, MPTP: n = 246, p < 10−4; monkey Z, normal:n = 40, MPTP: n = 135, p < 0.02).
Effects of MPTP on the discharge of pallidal and striatal cells
All pallidal cells recorded were encountered within a 2 mm depth from the border between striatum and GP. This along with the typical firing patterns of the cells (DeLong, 1971) indicates that our pallidal sample was composed only of neurons from the external segment of the globus pallidus (GPe). The mean firing rates of GPe (n= 80) and striatal (n = 17) neurons in the normal state of monkey S were not augmented during the monkeys' active periods relative to the immobile periods (p > 0.15; one-sided paired t test). There was no significant difference between the mean spontaneous GPe firing rates before (36.1 ± 2.6 spikes/sec; mean ± SEM; n = 80) and after (32.5 ± 1.6 spikes/sec; n = 105) MPTP treatment, or between the mean spontaneous firing rates of striatal neurons before (5.2 ± 0.9 spikes/sec; n = 17) and after (6.8 ± 0.9 spikes/sec; n = 18) treatment (p > 0.2; two-sided two-sample ttest). Interestingly, the cross-correlograms of GPe pairs were completely flat in both states (Fig.12A). The AIs were identically zero for all pairs both before (n = 185) and after (n = 233) treatment. In contrast, 94% of cross-correlograms (15 of 16) among striatal neurons showed 10 Hz oscillatory synchronization after MPTP (Fig. 12B). Judging by their electrophysiological properties, most striatal neurons we recorded both before and after MPTP treatment were probably tonically active neurons, although we did not verify their responsiveness to reward (Kimura et al., 1984; Graybiel et al., 1994;Raz et al., 1996).
Fig. 12.

Synchronization in the BG of monkey S in the normal immobile and MPTP states. Format same as in Figure 9.A, Examples of cross-correlograms from the GPe. All cross-correlograms, both before and after MPTP, are flat.B, Examples of cross-correlograms from the striatum. Note the 10 Hz oscillatory associations after MPTP (the oscillatory coincidence histograms were smoothed by a 21 msec moving average).
Somatosensory examination and intracortical microstimulation
The results of somatosensory examination and ICMS are summarized in Table 3. There was no significant difference between the normal and the MPTP state in the percentage of MI penetration sites whose stimulation elicited movement of the contralateral arm. The mean threshold for eliciting movement did not differ significantly after MPTP treatment in monkey S but did significantly increase in monkey Z (Table 3A). However, even in monkey Z after MPTP, ICMS often elicited strong responses and the threshold current sometimes reached as low as 5 μA, which is in the lower range of normal MI micro-excitability (Murthy and Fetz, 1996; Tokuno and Nambu, 2000).
Table 3.
Excitability and responsiveness to passive movement of the arm area of MI in the normal and MPTP states
| Monkey S | Monkey Z | |||
|---|---|---|---|---|
| Normal | MPTP3-a | Normal | MPTP3-a | |
| A. Intracortical microstimulation | ||||
| n (stimulation sites) | 71 | 55 | 74 | 61 |
| % (n) eliciting movement of the contralateral arm3-b | 94% (67) | 100% (55) | 74% (55) | 59% (36) |
| Threshold (μA)3-c (mean ± SEM) | 19.5 ± 1.2 | 18.4 ± 0.7 | 23 ± 2 | 31 ± 23-160 |
| B. Somatosensory examination: responsiveness | ||||
| n (pooled responses to three arm joints) | 180 | 147 | 200 | 174 |
| % (n) positive responses3-b | 69% (124) | 82% (121)3-160 | 56% (112) | 70% (122)3-160 |
| C. Somatosensory examination: specificity | ||||
| n (recording sites) | 72 | 56 | 80 | 64 |
| Median number of contralateral arm joints eliciting multiunit responses3-d | 2 | 33-150 | 1 | 23-150 |
| Median number of contralateral arm and leg joints eliciting multiunit responses3-d | 2 | 33-150 | 1.5 | 3.53-165 |
All tests compare between the normal and the MPTP states. p values:
F3-150: <0.05;
F3-160: <0.01;
F3-165: <0.001.
Two-sided χ2 test. “Questionable” responses removed.
Two-sided two-sample ttest.
Two-sided Wilcoxon rank-sum test.
Analysis of the responses from MI recording sites to the passive manipulation of the three contralateral arm joints reveals that the specificity of motor representation in MI significantly decreased after MPTP. The number of positive responses increased (Table 3B), and there was a shift toward stronger responses, i.e., relatively more responses included cells in the foreground and relatively less were composed of hash only (Fig. 13). The median number of joints whose passive manipulation elicited multiunit activity in MI recording sites increased significantly after MPTP treatment (Table3C). In GPe we discerned no significant difference in neuronal specificity between the normal and the MPTP states.
Fig. 13.

Frequency distribution of the pooled responses to passive manipulation of the contralateral shoulder, elbow, or wrist as recorded at all cortical penetration sites. A,Monkey S. B, Monkey Z.White bars, Normal. Black bars, MPTP. Neuronal responses were graded as follows: 0 = no response; ? = questionable response;1 = background/hash response; 2= response of cells at foreground. There is a significant shift of the frequency histograms to the right, indicating an increase in the positive responses to passive manipulation and that more responses involved strongly activated single units (χ2; monkey S, normal: n = 213, MPTP: n = 168, p < 10−4; monkey Z, normal:n = 222, MPTP: n = 183,p < 0.01).
DISCUSSION
We recorded the spontaneous discharge of several neurons in the arm area of the primate MI before and after systemic MPTP treatment. We chose to first study the effects of MPTP on MI, because it is the cortical structure whose activity is classically considered to be most closely related to muscle activation and the final execution of movement (Evarts, 1965; Porter and Lemon, 1993). After MPTP treatment the monkeys became severely akinetic, with enhanced muscle rigidity. Tremor was either absent or minimal. Our results show that these clinical effects were not accompanied by a change in the mean spontaneous firing rates of the MI neurons, which remained in the normal range of four to five spikes per second. However, there were marked changes in firing patterns of single cells and in synchronization among cells. Typically, the neurons discharged in long volleys of spikes (bursts, sometimes >2 sec long). Moreover, the bursts of different neurons occurred in synchrony. The synchronous bursts were observed at all depths along the recording tracts. Interestingly, these MI population bursts in the MPTP state failed to elicit transient muscle activation or arm movement.
Comparison with physiological and imaging studies of the parkinsonian MI
Previous single-electrode studies in parkinsonian primates have demonstrated that mean task- or movement-related MI firing rates do not change after electrolytic or MPTP nigral lesions (Gross et al., 1983; Doudet et al., 1990; Watts and Mandir, 1992). Doudet et al. (1990) also reported no significant change in the spontaneous (non-task-related) mean firing rate of MI neurons. However, their monkeys underwent a rapid and almost complete behavioral recovery after MPTP and were able to perform trained and self-initiated movements. In contrast, our monkeys were severely affected during the period of recordings. Previous studies of MPTP-recovered cats have shown that all electrophysiological measures of neuronal discharge in BG returned to levels resembling those seen in normal animals (Rothblat and Schneider, 1993; Rothblat and Schneider, 1995). Thus, our study that focused on spontaneous MI discharge (in the absence of movement) demonstrates that the mean spontaneous firing rates remain unchanged even in severely akinetic primates.
Experimental methods that indirectly measure MI activity in the parkinsonian state have yielded contradictory results. Brown and collaborators (Brown et al., 1998; Brown and Marsden, 1999; Wang et al., 1999; Brown, 2000) have studied the spectra of macroscopic cortical signals and EMG to demonstrate differences between PD patients and healthy controls during the execution of voluntary movements. Studies of 2-[14C]deoxyglucose metabolism in MPTP primates have found transient changes in glucose utilization in MI (Porrino et al., 1987; Schwartzman et al., 1988). Emission tomography studies of MI in PD patients have shown that the metabolic activity remains mostly unchanged relative to controls during both rest and movement (Playford et al., 1992; Rascol et al., 1994;Jahanshahi et al., 1995; Samuel et al., 1997a). There is no consensus regarding the effect on MI activity of (1) pallidal inactivation during rest (Eidelberg et al., 1996; Henselmans et al., 2000; Fukuda et al., 2001) or movement (Ceballos-Baumann et al., 1994; Grafton et al., 1995;Samuel et al., 1997b), (2) subthalamic nucleus stimulation (Limousin et al., 1997; Ceballos-Baumann et al., 1999), or (3) levodopa therapy (Rascol et al., 1994). In contrast, fMRI studies have consistently shown increased task-related blood–oxygen-level-dependent (BOLD) responses in MI relative to controls (Sabatini et al., 2000; Haslinger et al., 2001) and return to normal levels after levodopa (Haslinger et al., 2001).
What aspects of neuronal activity are reflected in these indirect measures of cortical metabolism is still under debate (Jueptner and Weiller, 1995; Heeger et al., 2000; Logothetis et al., 2001). Some of these studies may be more sensitive to mean firing rates, whereas others may reflect the level of population synchrony. For example, it has been proposed that the fMRI BOLD signal may reflect changes in neuronal firing patterns and synchrony (Arthurs and Boniface, 2002). Our demonstration of an enhanced bursting synchrony in MI may explain why the fMRI studies of PD patients show an enhanced BOLD signal.
Changes in mean firing rates in the cortical–BG circuits
The above-mentioned studies alongside our results fail to demonstrate that MI is deactivated in PD as hypothesized by the current model of the BG. How can these data be reconciled with the observed changes in pallidal firing rates in parkinsonism (Miller and DeLong, 1987; Filion and Tremblay, 1991; Boraud et al., 1998) that presumably inhibit frontal cortex? Perhaps the pallidal receiving areas in the ventrolateral thalamus or frontal cortex possess compensatory mechanisms that regulate the overall mean firing rates in MI (Sabatini et al., 2000; Thobois et al., 2000). Alternatively, this inhibition may differentially affect different subclasses of cortical neurons (Bauswein et al., 1989; Gur et al., 1999; Turner and DeLong, 2000). However, the changes in MI firing patterns and synchronization at various depths along the penetration tracts indicate that these changes are not confined to any specific cortical layer. Finally, we found no change in the mean firing rate of GPe neurons after MPTP. This result joins growing evidence that pallidal firing rates do not change in all monkeys as described in the current model of PD (Bergman et al., 1994; Bezard et al., 1999; Wichmann et al., 1999; Raz et al., 2000;Boraud et al., 2001). It thus appears that what underlies parkinsonian akinesia is not necessarily the hypothesized changes in firing rates in the cortical–BG circuits (Boraud et al., 2002).
Changes in synchrony in the cortical–BG circuits
Studies of the cortico–BG circuitry have shown its propensity to oscillate synchronously (Plenz and Kitai, 1999; Magill et al., 2000). Several studies of parkinsonism have shown an increase in synchronization within the cortico–BG circuitry (Bergman et al., 1998;Hurtado et al., 1999; Levy et al., 2000; Raz et al., 2000; Brown et al., 2001; Marsden et al., 2001). Collectively, these studies suggest a loss of functional segregation among parallel corticobasal ganglia circuits (Alexander et al., 1986; DeLong, 1990), leading to loss of neuronal specificity in response to passive joint manipulation (Filion et al., 1988; Boraud et al., 2000). We too found a decrease in MI specificity after MPTP in both the number and strength of the responses to passive arm manipulation; however, we failed to reveal a loss of specificity in GPe. Our ability to detect the changes only in MI but not in GPe probably had to do with the weaker modulation of pallidal activity in response to passive limb movements relative to MI.
Previous multiple-electrode primate studies found abnormal oscillatory synchronization among the tonically active neurons of the striatum (Raz et al., 1996) and among pallidal neurons (Nini et al., 1995; Raz et al., 2000). The temporal width of this pathological synchronization is on the order of tens to hundreds of milliseconds, similar to what we observed among the striatal neurons of monkey S (Fig.12B); however, we did not find such synchronous oscillations in our pallidal recording. The salient difference between the animals of the previous studies and monkey S is that the latter exhibited no tremor. Thus, it is possible that oscillatory correlation in GP appears only in tremulous primates. This suggestion is in line with a recent study of the subthalamic nucleus in PD patients that found oscillatory activity and high-frequency synchronization only among neurons of tremulous patients and not among those of nontremulous ones (Levy et al., 2000). Still, we see that even in akinetic monkey S striatal neurons display oscillatory synchronization after MPTP, indicating that enhanced synchrony and loss of neuronal specificity in cortico–BG circuits is not only a property of tremulous subjects (Brown et al., 2001; Marsden et al., 2001). In summary, our findings that (1) the pathological MI synchrony is on a larger timescale than that found in the BG and that (2) GPe neurons in monkey S remain uncorrelated after MPTP indicate that cortical synchrony cannot result simply from BG dynamics. It therefore seems that parkinsonian MI synchrony represents an intrinsic reorganization of cortical dynamics in response to the MPTP insult. The depletion of dopamine in frontal cortex or in the thalamus (Freeman et al., 2001) in response to this insult may play a role in this reorganization.
The relationship between MI activity and movement
Surface EMG detects transient changes in muscle activation; however, during the MI bursts in the MPTP state, we found no such transients in the EMG recording from monkey Z. Similarly, the accelerometer traces from both monkeys indicated that these bursts elicited no movement. This is surprising because similar population bursts in the normal monkeys usually appeared with movement (Fig. 4). A faulty corticospinal transmission, as may be indicated by the increased mean ICMS threshold current in monkey Z, could resolve this paradox. However, because ICMS threshold currents were often quite low (well below 50 μA) (Murthy and Fetz, 1996; Tokuno and Nambu, 2000) in the MPTP state of monkey Z and because in monkey S there was no change in ICMS threshold currents, our opinion is that cortical micro-excitability was not dramatically affected by the MPTP. This is in line with human studies showing that the corticospinal motor pathway remains intact in parkinsonism (Dick et al., 1984; Ridding et al., 1995; Rothwell, 1999; Kleine et al., 2001). The ability of EMG to detect changes in “baseline” muscle tone (in contrast to transient activations) is questionable. Still, we hypothesize that the excessive MI synchronization may underlie muscle rigidity by causing a persistent co-contraction of antagonistic muscles that may result in the observed rigidity (Goldberg et al., 2002). Alternatively, changes in BG activity in parkinsonism may induce changes in the activity of descending pathway structures, such as the pedunculopontine nucleus (Munro-Davies et al., 1999; Pahapill and Lozano, 2000), whose influence on the spinal cord may shunt the cortical bursts.
A possible decoupling of MI discharge and movement has been described in previous single-unit studies (Evarts, 1964; Muir and Lemon, 1983;Carpenter et al., 1999). It was suggested that this decoupling may result from insufficient synchronous activity in MI (Phillips and Porter, 1977). Our multiple electrode results demonstrate that even robust synchronous activation of MI need not result in movement.
Clinical implications
Although the current physiological model of the basal ganglia circuitry has been invaluable for the development of neurosurgical therapies of PD (Gross et al., 1999), it has become the target of much criticism (Marsden and Obeso, 1994; Obeso et al., 2000; Vitek and Giroux, 2000). Our findings reveal yet another oversight of the model regarding motor cortical involvement in parkinsonism. However, they raise the possibility that noninvasive transcranial therapies aimed at the disruption of pathological synchronization in MI could some day ameliorate PD symptoms.
Footnotes
This research was supported in part by the Israel Science Foundation, which was founded by the Israel Academy of Sciences and Humanities, and by the United States–Israel Binational Science Foundation. J.A.G. is supported by the Yeshaya Horowitz Association. T.B. is supported by the European Community Marie Curie fellowship. V. Sharkansky provided technical support. We thank G. Goelman for conducting the MRI, M. Abeles and T. Wichmann for their critical reading of a previous version of this manuscript, and D. Jaeger for his helpful suggestions.
Correspondence should be addressed to Joshua A. Goldberg, Department of Physiology, The Hebrew University–Hadassah Medical School, P.O. 12272, Jerusalem 91120, Israel. E-mail:joshg@md.huji.ac.il.
REFERENCES
- 1.Albin RL, Young AB, Penney JB. The functional anatomy of basal ganglia disorders. Trends Neurosci. 1989;12:366–375. doi: 10.1016/0166-2236(89)90074-x. [DOI] [PubMed] [Google Scholar]
- 2.Alexander GE, DeLong MR, Strick PL. Parallel organization of functionally segregated circuits linking basal ganglia and cortex. Annu Rev Neurosci. 1986;9:357–381. doi: 10.1146/annurev.ne.09.030186.002041. [DOI] [PubMed] [Google Scholar]
- 3.Arthurs OJ, Boniface S. How well do we understand the neural origins of the fMRI BOLD signal? Trends Neurosci. 2002;25:27–31. doi: 10.1016/s0166-2236(00)01995-0. [DOI] [PubMed] [Google Scholar]
- 4.Asanuma H. The motor cortex. Raven; New York: 1989. [Google Scholar]
- 5.Bar-Gad I, Ritov Y, Vaadia E, Bergman H. Failure in identification of overlapping spikes from multiple neuron activity causes artificial correlations. J Neurosci Methods. 2001;107:1–13. doi: 10.1016/s0165-0270(01)00339-9. [DOI] [PubMed] [Google Scholar]
- 6.Basmajian JV, De Luca CJ. Muscles alive: their function revealed by electromyography. Williams & Wilkins; Baltimore: 1985. [Google Scholar]
- 7.Bauswein E, Fromm C, Preuss A. Corticostriatal cells in comparison with pyramidal tract neurons: contrasting properties in the behaving monkey. Brain Res. 1989;493:198–203. doi: 10.1016/0006-8993(89)91018-4. [DOI] [PubMed] [Google Scholar]
- 8.Benazzouz A, Gross C, Dupont J, Bioulac B. MPTP induced hemiparkinsonism in monkeys: behavioral, mechanographic, electromyographic and immunohistochemical studies. Exp Brain Res. 1992;90:116–120. doi: 10.1007/BF00229262. [DOI] [PubMed] [Google Scholar]
- 9.Benazzouz A, Boraud T, Dubedat P, Boireau A, Stutzmann JM, Gross C. Riluzole prevents MPTP-induced parkinsonism in the rhesus monkey: a pilot study. Eur J Pharmacol. 1995;284:299–307. doi: 10.1016/0014-2999(95)00362-o. [DOI] [PubMed] [Google Scholar]
- 10.Bergman H, Wichmann T, Karmon B, DeLong MR. The primate subthalamic nucleus. II. Neuronal activity in the MPTP model of parkinsonism. J Neurophysiol. 1994;72:507–520. doi: 10.1152/jn.1994.72.2.507. [DOI] [PubMed] [Google Scholar]
- 11.Bergman H, Feingold A, Nini A, Raz A, Slovin H, Abeles M, Vaadia E. Physiological aspects of information processing in the basal ganglia of normal and parkinsonian primates. Trends Neurosci. 1998;21:32–38. doi: 10.1016/s0166-2236(97)01151-x. [DOI] [PubMed] [Google Scholar]
- 12.Bezard E, Boraud T, Bioulac B, Gross CE. Involvement of the subthalamic nucleus in glutamatergic compensatory mechanisms. Eur J Neurosci. 1999;11:2167–2170. doi: 10.1046/j.1460-9568.1999.00627.x. [DOI] [PubMed] [Google Scholar]
- 13.Bolam JP, Hanley JJ, Booth PA, Bevan MD. Synaptic organisation of the basal ganglia. J Anat. 2000;196:527–542. doi: 10.1046/j.1469-7580.2000.19640527.x. [DOI] [PMC free article] [PubMed] [Google Scholar]
- 14.Boraud T, Bezard E, Guehl D, Bioulac B, Gross C. Effects of l-DOPA on neuronal activity of the globus pallidus externalis (GPe) and globus pallidus internalis (GPi) in the MPTP-treated monkey. Brain Res. 1998;787:157–160. doi: 10.1016/s0006-8993(97)01563-1. [DOI] [PubMed] [Google Scholar]
- 15.Boraud T, Bezard E, Bioulac B, Gross CE. Ratio of inhibited-to-activated pallidal neurons decreases dramatically during passive limb movement in the MPTP-treated monkey. J Neurophysiol. 2000;83:1760–1763. doi: 10.1152/jn.2000.83.3.1760. [DOI] [PubMed] [Google Scholar]
- 16.Boraud T, Bezard E, Bioulac B, Gross CE. Dopamine agonist-induced dyskinesias are correlated to both firing pattern and frequency alterations of pallidal neurones in the MPTP-treated monkey. Brain. 2001;124:546–557. doi: 10.1093/brain/124.3.546. [DOI] [PubMed] [Google Scholar]
- 17.Boraud T, Bezard E, Bioulac B, Gross CE. From single extracellular unit recording in experimental and human parkinsonism to the development of a functional concept of the role played by the basal ganglia in motor control. Prog Neurobiol. 2002;66:265–283. doi: 10.1016/s0301-0082(01)00033-8. [DOI] [PubMed] [Google Scholar]
- 18.Brown P. Cortical drives to human muscle: the Piper and related rhythms. Prog Neurobiol. 2000;60:97–108. doi: 10.1016/s0301-0082(99)00029-5. [DOI] [PubMed] [Google Scholar]
- 19.Brown P, Marsden CD. Bradykinesia and impairment of EEG desynchronization in Parkinson's disease. Mov Disord. 1999;14:423–429. doi: 10.1002/1531-8257(199905)14:3<423::aid-mds1006>3.0.co;2-v. [DOI] [PubMed] [Google Scholar]
- 20.Brown P, Salenius S, Rothwell JC, Hari R. Cortical correlate of the Piper rhythm in humans. J Neurophysiol. 1998;80:2911–2917. doi: 10.1152/jn.1998.80.6.2911. [DOI] [PubMed] [Google Scholar]
- 21.Brown P, Oliviero A, Mazzone P, Insola A, Tonali P, Di Lazzaro V. Dopamine dependency of oscillations between subthalamic nucleus and pallidum in Parkinson's disease. J Neurosci. 2001;21:1033–1038. doi: 10.1523/JNEUROSCI.21-03-01033.2001. [DOI] [PMC free article] [PubMed] [Google Scholar]
- 22.Carpenter AF, Georgopoulos AP, Pellizzer G. Motor cortical encoding of serial order in a context-recall task. Science. 1999;283:1752–1757. doi: 10.1126/science.283.5408.1752. [DOI] [PubMed] [Google Scholar]
- 23.Ceballos-Baumann AO, Obeso JA, Vitek JL, DeLong MR, Bakay R, Linazasoro G, Brooks DJ. Restoration of thalamocortical activity after posteroventral pallidotomy in Parkinson's disease. Lancet. 1994;344:814. doi: 10.1016/s0140-6736(94)92369-8. [DOI] [PubMed] [Google Scholar]
- 24.Ceballos-Baumann AO, Boecker H, Bartenstein P, von Falkenhayn I, Riescher H, Conrad B, Moringlane JR, Alesch F. A positron emission tomographic study of subthalamic nucleus stimulation in Parkinson disease: enhanced movement-related activity of motor-association cortex and decreased motor cortex resting activity. Arch Neurol. 1999;56:997–1003. doi: 10.1001/archneur.56.8.997. [DOI] [PubMed] [Google Scholar]
- 25.DeLong MR. Activity of pallidal neurons during movement. J Neurophysiol. 1971;34:414–427. doi: 10.1152/jn.1971.34.3.414. [DOI] [PubMed] [Google Scholar]
- 26.DeLong MR. Primate models of movement disorders of basal ganglia origin. Trends Neurosci. 1990;13:281–285. doi: 10.1016/0166-2236(90)90110-v. [DOI] [PubMed] [Google Scholar]
- 27.Dick JP, Cowan JM, Day BL, Berardelli A, Kachi T, Rothwell JC, Marsden CD. The corticomotoneurone connection is normal in Parkinson's disease. Nature. 1984;310:407–409. doi: 10.1038/310407a0. [DOI] [PubMed] [Google Scholar]
- 28.Doudet DJ, Gross C, Arluison M, Bioulac B. Modifications of precentral cortex discharge and EMG activity in monkeys with MPTP-induced lesions of DA nigral neurons. Exp Brain Res. 1990;80:177–188. doi: 10.1007/BF00228859. [DOI] [PubMed] [Google Scholar]
- 29.Eidelberg D, Moeller JR, Ishikawa T, Dhawan V, Spetsieris P, Silbersweig D, Stern E, Woods RP, Fazzini E, Dogali M, Beric A. Regional metabolic correlates of surgical outcome following unilateral pallidotomy for Parkinson's disease. Ann Neurol. 1996;39:450–459. doi: 10.1002/ana.410390407. [DOI] [PubMed] [Google Scholar]
- 30.Evarts EV. Temporal patterns of discharge of pyramidal tract neurons during sleep and waking in the monkey. J Neurophysiol. 1964;27:152–171. doi: 10.1152/jn.1964.27.2.152. [DOI] [PubMed] [Google Scholar]
- 31.Evarts EV. Relation of discharge frequency to conduction velocity in pyramidal tract neurons. J Neurophysiol. 1965;28:216–228. doi: 10.1152/jn.1965.28.2.216. [DOI] [PubMed] [Google Scholar]
- 32.Fee MS, Mitra PP, Kleinfeld D. Variability of extracellular spike waveforms of cortical neurons. J Neurophysiol. 1996;76:3823–3833. doi: 10.1152/jn.1996.76.6.3823. [DOI] [PubMed] [Google Scholar]
- 33.Filion M, Tremblay L. Abnormal spontaneous activity of globus pallidus neurons in monkeys with MPTP-induced parkinsonism. Brain Res. 1991;547:142–151. [PubMed] [Google Scholar]
- 34.Filion M, Tremblay L, Bedard PJ. Abnormal influences of passive limb movement on the activity of globus pallidus neurons in parkinsonian monkeys. Brain Res. 1988;444:165–176. doi: 10.1016/0006-8993(88)90924-9. [DOI] [PubMed] [Google Scholar]
- 35.Freeman A, Ciliax B, Bakay R, Daley J, Miller RD, Keating G, Levey A, Rye D. Nigrostriatal collaterals to thalamus degenerate in parkinsonian animal models. Ann Neurol. 2001;50:321–329. doi: 10.1002/ana.1119. [DOI] [PubMed] [Google Scholar]
- 36.Fukuda M, Mentis M, Ghilardi MF, Dhawan V, Antonini A, Hammerstad J, Lozano AM, Lang A, Lyons K, Koller W, Ghez C, Eidelberg D. Functional correlates of pallidal stimulation for Parkinson's disease. Ann Neurol. 2001;49:155–164. doi: 10.1002/1531-8249(20010201)49:2<155::aid-ana35>3.0.co;2-9. [DOI] [PubMed] [Google Scholar]
- 37.Gerfen CR, Wilson CJ. The basal ganglia. In: Swanson LW, Bjorklund A, Hokfelt T, editors. Handbook of chemical neuroanatomy, Vol 12: Integrated systems of the CNS, Part III. Elsevier Science; New York: 1996. pp. 371–468. [Google Scholar]
- 38. Goldberg JA, Boraud T, Maraton S, Vaadia E, Bergman H. Enhanced synchrony in the primary motor cortex of MPTP primates may underlie muscle cocontraction and rigidity. The basal ganglia VII Nicholson LFB, Faull RLM. 2002. Plenum; New York, in press. [Google Scholar]
- 39.Grafton ST, Waters C, Sutton J, Lew MF, Couldwell W. Pallidotomy increases activity of motor association cortex in Parkinson's disease: a positron emission tomographic study. Ann Neurol. 1995;37:776–783. doi: 10.1002/ana.410370611. [DOI] [PubMed] [Google Scholar]
- 40.Graybiel AM, Aosaki T, Flaherty AW, Kimura M. The basal ganglia and adaptive motor control. Science. 1994;265:1826–1831. doi: 10.1126/science.8091209. [DOI] [PubMed] [Google Scholar]
- 41.Gross C, Feger J, Seal J, Haramburu P, Bioulac B. Neuronal activity in area 4 and movement parameters recorded in trained monkeys after unilateral lesion of the substantia nigra. Exp Brain Res [Suppl] 1983;7:181–193. [Google Scholar]
- 42.Gross CE, Boraud T, Guehl D, Bioulac B, Bezard E. From experimentation to the surgical treatment of Parkinson's disease: prelude or suite in basal ganglia research? Prog Neurobiol. 1999;59:509–532. doi: 10.1016/s0301-0082(99)00015-5. [DOI] [PubMed] [Google Scholar]
- 43.Gur M, Beylin A, Snodderly DM. Physiological properties of macaque V1 neurons are correlated with extracellular spike amplitude, duration, and polarity. J Neurophysiol. 1999;82:1451–1464. doi: 10.1152/jn.1999.82.3.1451. [DOI] [PubMed] [Google Scholar]
- 44.Haslinger B, Erhard P, Kampfe N, Boecker H, Rummeny E, Schwaiger M, Conrad B, Ceballos-Baumann AO. Event-related functional magnetic resonance imaging in Parkinson's disease before and after levodopa. Brain. 2001;124:558–570. doi: 10.1093/brain/124.3.558. [DOI] [PubMed] [Google Scholar]
- 45.Heeger DJ, Huk AC, Geisler WS, Albrecht DG. Spikes versus BOLD: what does neuroimaging tell us about neuronal activity? Nat Neurosci. 2000;3:631–633. doi: 10.1038/76572. [DOI] [PubMed] [Google Scholar]
- 46.Henselmans JM, de Jong BM, Pruim J, Staal MJ, Rutgers AW, Haaxma R. Acute effects of thalamotomy and pallidotomy on regional cerebral metabolism, evaluated by PET. Clin Neurol Neurosurg. 2000;102:84–90. doi: 10.1016/s0303-8467(00)00070-6. [DOI] [PubMed] [Google Scholar]
- 47.Hoehn MM, Yahr MD. Parkinsonism: onset, progression and mortality. Neurology. 1967;17:427–442. doi: 10.1212/wnl.17.5.427. [DOI] [PubMed] [Google Scholar]
- 48.Hoover JE, Strick PL. The organization of cerebellar and basal ganglia outputs to primary motor cortex as revealed by retrograde transneuronal transport of herpes simplex virus type 1. J Neurosci. 1999;19:1446–1463. doi: 10.1523/JNEUROSCI.19-04-01446.1999. [DOI] [PMC free article] [PubMed] [Google Scholar]
- 49.Hurtado JM, Gray CM, Tamas LB, Sigvardt KA. Dynamics of tremor-related oscillations in the human globus pallidus: a single case study. Proc Natl Acad Sci USA. 1999;96:1674–1679. doi: 10.1073/pnas.96.4.1674. [DOI] [PMC free article] [PubMed] [Google Scholar]
- 50.Imbert C, Bezard E, Guitraud S, Boraud T, Gross CE. Comparison of eight clinical rating scales used for the assessment of MPTP-induced parkinsonism in the Macaque monkey. J Neurosci Methods. 2000;96:71–76. doi: 10.1016/s0165-0270(99)00184-3. [DOI] [PubMed] [Google Scholar]
- 51.Jahanshahi M, Jenkins IH, Brown RG, Marsden CD, Passingham RE, Brooks DJ. Self-initiated versus externally triggered movements. I. An investigation using measurement of regional cerebral blood flow with PET and movement-related potentials in normal and Parkinson's disease subjects. Brain. 1995;118:913–933. doi: 10.1093/brain/118.4.913. [DOI] [PubMed] [Google Scholar]
- 52.Jueptner M, Weiller C. Review: does measurement of regional cerebral blood flow reflect synaptic activity? Implications for PET and fMRI. NeuroImage. 1995;2:148–156. doi: 10.1006/nimg.1995.1017. [DOI] [PubMed] [Google Scholar]
- 53.Kaneoke Y, Vitek JL. Burst and oscillation as disparate neuronal properties. J Neurosci Methods. 1996;68:211–223. doi: 10.1016/0165-0270(96)00081-7. [DOI] [PubMed] [Google Scholar]
- 54.Kimura M, Rajkowski J, Evarts E. Tonically discharging putamen neurons exhibit set-dependent responses. Proc Natl Acad Sci USA. 1984;81:4998–5001. doi: 10.1073/pnas.81.15.4998. [DOI] [PMC free article] [PubMed] [Google Scholar]
- 55.Kleine BU, Praamstra P, Stegeman DF, Zwarts MJ. Impaired motor cortical inhibition in Parkinson's disease: motor unit responses to transcranial magnetic stimulation. Exp Brain Res. 2001;138:477–483. doi: 10.1007/s002210100731. [DOI] [PubMed] [Google Scholar]
- 56.Lavoie B, Parent A. Dopaminergic neurons expressing calbindin in normal and parkinsonian monkeys. NeuroReport. 1991;2:601–604. doi: 10.1097/00001756-199110000-00012. [DOI] [PubMed] [Google Scholar]
- 57.Levy R, Hutchison WD, Lozano AM, Dostrovsky JO. High-frequency synchronization of neuronal activity in the subthalamic nucleus of parkinsonian patients with limb tremor. J Neurosci. 2000;20:7766–7775. doi: 10.1523/JNEUROSCI.20-20-07766.2000. [DOI] [PMC free article] [PubMed] [Google Scholar]
- 58.Limousin P, Greene J, Pollak P, Rothwell J, Benabid AL, Frackowiak R. Changes in cerebral activity pattern due to subthalamic nucleus or internal pallidum stimulation in Parkinson's disease. Ann Neurol. 1997;42:283–291. doi: 10.1002/ana.410420303. [DOI] [PubMed] [Google Scholar]
- 59.Logothetis NK, Pauls J, Augath M, Trinath T, Oeltermann A. Neurophysiological investigation of the basis of the fMRI signal. Nature. 2001;412:150–157. doi: 10.1038/35084005. [DOI] [PubMed] [Google Scholar]
- 60.Lynd BE, Haber SN. The organization of midbrain projections to the striatum in the primate: sensorimotor-related striatum versus ventral striatum. Neuroscience. 1994;59:625–640. doi: 10.1016/0306-4522(94)90182-1. [DOI] [PubMed] [Google Scholar]
- 61.Magill PJ, Bolam JP, Bevan MD. Relationship of activity in the subthalamic nucleus–globus pallidus network to cortical electroencephalogram. J Neurosci. 2000;20:820–833. doi: 10.1523/JNEUROSCI.20-02-00820.2000. [DOI] [PMC free article] [PubMed] [Google Scholar]
- 62.Marsden CD, Obeso JA. The functions of the basal ganglia and the paradox of stereotaxic surgery in Parkinson's disease. Brain. 1994;117:877–897. doi: 10.1093/brain/117.4.877. [DOI] [PubMed] [Google Scholar]
- 63.Marsden JF, Limousin-Dowsey P, Ashby P, Pollak P, Brown P. Subthalamic nucleus, sensorimotor cortex and muscle interrelationship in Parkinson's disease. Brain. 2001;124:378–388. doi: 10.1093/brain/124.2.378. [DOI] [PubMed] [Google Scholar]
- 64.Miller WC, DeLong MR. Altered tonic activity of neurons in the globus pallidus and subthalamic nucleus in the primate MPTP model of parkinsonism. In: Carpenter MB, Jayaraman A, editors. The basal ganglia II. Plenum; New York: 1987. pp. 415–427. [Google Scholar]
- 65.Muir RB, Lemon RN. Corticospinal neurons with a special role in precision grip. Brain Res. 1983;261:312–316. doi: 10.1016/0006-8993(83)90635-2. [DOI] [PubMed] [Google Scholar]
- 66.Munro-Davies LE, Winter J, Aziz TZ, Stein JF. The role of the pedunculopontine region in basal-ganglia mechanisms of akinesia. Exp Brain Res. 1999;129:511–517. doi: 10.1007/s002210050921. [DOI] [PubMed] [Google Scholar]
- 67.Murthy VN, Fetz EE. Synchronization of neurons during local field potential oscillations in sensorimotor cortex of awake monkeys. J Neurophysiol. 1996;76:3968–3982. doi: 10.1152/jn.1996.76.6.3968. [DOI] [PubMed] [Google Scholar]
- 68.Nini A, Feingold A, Slovin H, Bergman H. Neurons in the globus pallidus do not show correlated activity in the normal monkey, but phase-locked oscillations appear in the MPTP model of parkinsonism. J Neurophysiol. 1995;74:1800–1805. doi: 10.1152/jn.1995.74.4.1800. [DOI] [PubMed] [Google Scholar]
- 69.Obeso JA, Rodriguez-Oroz MC, Rodriguez M, DeLong MR, Olanow CW. Pathophysiology of levodopa-induced dyskinesias in Parkinson's disease: problems with the current model. Ann Neurol. 2000;47:S22–S32. [PubMed] [Google Scholar]
- 70.Ohara S, Mima T, Baba K, Ikeda A, Kuneida T, Matsumo R, Yamamoto J, Matsuhashi M, Nagamine T, Hirasawa K, Hori T, Mihara T, Hashimoto N, Salenius S, Shibasaki H. Increased synchronization of cortical oscillatory activities between human supplementary motor and primary sensorimotor areas during voluntary movements. J Neurosci. 2001;21:9377–9386. doi: 10.1523/JNEUROSCI.21-23-09377.2001. [DOI] [PMC free article] [PubMed] [Google Scholar]
- 71.Pahapill PA, Lozano AM. The pedunculopontine nucleus and Parkinson's disease. Brain. 2000;123:1767–1783. doi: 10.1093/brain/123.9.1767. [DOI] [PubMed] [Google Scholar]
- 72.Phillips CJ, Porter R. Corticospinal neurones: their role in movement. Academic; London: 1977. [PubMed] [Google Scholar]
- 73.Playford ED, Jenkins IH, Passingham RE, Nutt J, Frackowiak RS, Brooks DJ. Impaired mesial frontal and putamen activation in Parkinson's disease: a positron emission tomography study. Ann Neurol. 1992;32:151–161. doi: 10.1002/ana.410320206. [DOI] [PubMed] [Google Scholar]
- 74.Plenz D, Kitai ST. A basal ganglia pacemaker formed by the subthalamic nucleus and external globus pallidus. Nature. 1999;400:677–682. doi: 10.1038/23281. [DOI] [PubMed] [Google Scholar]
- 75.Porrino LJ, Burns RS, Crane AM, Palombo E, Kopin IJ, Sokoloff L. Changes in local cerebral glucose utilization associated with Parkinson's syndrome induced by 1-methyl-4-phenyl-1,2,3,6-tetrahydropyridine (MPTP) in the primate. Life Sci. 1987;40:1657–1664. doi: 10.1016/0024-3205(87)90014-2. [DOI] [PubMed] [Google Scholar]
- 76.Porter R, Lemon RN. Corticospinal function and voluntary movement. Oxford UP; New York: 1993. [Google Scholar]
- 77.Rascol O, Sabatini U, Chollet F, Fabre N, Senard JM, Montastruc JL, Celsis P, Marc-Vergnes JP, Rascol A. Normal activation of the supplementary motor area in patients with Parkinson's disease undergoing long-term treatment with levodopa. J Neurol Neurosurg Psychiatry. 1994;57:567–571. doi: 10.1136/jnnp.57.5.567. [DOI] [PMC free article] [PubMed] [Google Scholar]
- 78.Raz A, Feingold A, Zelanskaya V, Vaadia E, Bergman H. Neuronal synchronization of tonically active neurons in the striatum of normal and parkinsonian primates. J Neurophysiol. 1996;76:2083–2088. doi: 10.1152/jn.1996.76.3.2083. [DOI] [PubMed] [Google Scholar]
- 79.Raz A, Vaadia E, Bergman H. Firing patterns and correlations of spontaneous discharge of pallidal neurons in the normal and the tremulous 1-methyl-4-phenyl-1,2,3,6-tetrahydropyridine vervet model of parkinsonism. J Neurosci. 2000;20:8559–8571. doi: 10.1523/JNEUROSCI.20-22-08559.2000. [DOI] [PMC free article] [PubMed] [Google Scholar]
- 80.Ridding MC, Inzelberg R, Rothwell JC. Changes in excitability of motor cortical circuitry in patients with Parkinson's disease. Ann Neurol. 1995;37:181–188. doi: 10.1002/ana.410370208. [DOI] [PubMed] [Google Scholar]
- 81.Rothblat DS, Schneider JS. Response of caudate neurons to stimulation of intrinsic and peripheral afferents in normal, symptomatic, and recovered MPTP-treated cats. J Neurosci. 1993;13:4372–4378. doi: 10.1523/JNEUROSCI.13-10-04372.1993. [DOI] [PMC free article] [PubMed] [Google Scholar]
- 82.Rothblat DS, Schneider JS. Alterations in pallidal neuronal responses to peripheral sensory and striatal stimulation in symptomatic and recovered parkinsonian cats. Brain Res. 1995;705:1–14. doi: 10.1016/0006-8993(95)00892-6. [DOI] [PubMed] [Google Scholar]
- 83.Rothwell JC. Pathophysiology of the motor cortex in patients with Parkinson's disease. Adv Neurol. 1999;80:27–29. [PubMed] [Google Scholar]
- 84.Sabatini U, Boulanouar K, Fabre N, Martin F, Carel C, Colonnese C, Bozzao L, Berry I, Montastruc JL, Chollet F, Rascol O. Cortical motor reorganization in akinetic patients with Parkinson's disease: a functional MRI study. Brain. 2000;123:394–403. doi: 10.1093/brain/123.2.394. [DOI] [PubMed] [Google Scholar]
- 85.Samuel M, Ceballos BA, Blin J, Uema T, Boecker H, Passingham RE, Brooks DJ. Evidence for lateral premotor and parietal overactivity in Parkinson's disease during sequential and bimanual movements. A PET study. Brain. 1997a;120:963–976. doi: 10.1093/brain/120.6.963. [DOI] [PubMed] [Google Scholar]
- 86.Samuel M, Ceballos BA, Turjanski N, Boecker H, Gorospe A, Linazasoro G, Holmes AP, DeLong MR, Vitek JL, Thomas DG, Quinn NP, Obeso JA, Brooks DJ. Pallidotomy in Parkinson's disease increases supplementary motor area and prefrontal activation during performance of volitional movements: an H2(15)O PET study. Brain. 1997b;120:1301–1313. doi: 10.1093/brain/120.8.1301. [DOI] [PubMed] [Google Scholar]
- 87.Schwartzman RJ, Alexander GM, Ferraro TN, Grothusen JR, Stahl SM. Cerebral metabolism of parkinsonian primates 21 days after MPTP. Exp Neurol. 1988;102:307–313. doi: 10.1016/0014-4886(88)90224-5. [DOI] [PubMed] [Google Scholar]
- 88.Song DD, Haber SN. Striatal responses to partial dopaminergic lesion: evidence for compensatory sprouting. J Neurosci. 2000;20:5102–5114. doi: 10.1523/JNEUROSCI.20-13-05102.2000. [DOI] [PMC free article] [PubMed] [Google Scholar]
- 89.Thobois S, Dominey P, Decety J, Pollak P, Gregoire MC, Broussolle E. Overactivation of primary motor cortex is asymmetrical in hemiparkinsonian patients. NeuroReport. 2000;11:785–789. doi: 10.1097/00001756-200003200-00026. [DOI] [PubMed] [Google Scholar]
- 90.Tokuno H, Nambu A. Organization of nonprimary motor cortical inputs on pyramidal and nonpyramidal tract neurons of primary motor cortex: an electrophysiological study in the macaque monkey. Cereb Cortex. 2000;10:58–68. doi: 10.1093/cercor/10.1.58. [DOI] [PubMed] [Google Scholar]
- 91.Tremblay L, Filion M, Bedard PJ. Responses of pallidal neurons to striatal stimulation in monkeys with MPTP-induced parkinsonism. Brain Res. 1989;498:17–33. doi: 10.1016/0006-8993(89)90395-8. [DOI] [PubMed] [Google Scholar]
- 92.Turner RS, DeLong MR. Corticostriatal activity in primary motor cortex of the macaque. J Neurosci. 2000;20:7096–7108. doi: 10.1523/JNEUROSCI.20-18-07096.2000. [DOI] [PMC free article] [PubMed] [Google Scholar]
- 93.Vitek JL, Giroux M. Physiology of hypokinetic and hyperkinetic movement disorders: model for dyskinesia. Ann Neurol. 2000;47:S131–S140. [PubMed] [Google Scholar]
- 94.Wang HC, Lees AJ, Brown P. Impairment of EEG desynchronization before and during movement and its relation to bradykinesia in Parkinson's disease. J Neurol Neurosurg Psychiatry. 1999;66:442–446. doi: 10.1136/jnnp.66.4.442. [DOI] [PMC free article] [PubMed] [Google Scholar]
- 95.Watts RL, Mandir AS. The role of motor cortex in the pathophysiology of voluntary movement deficits associated with parkinsonism. Neurol Clin. 1992;10:451–469. [PubMed] [Google Scholar]
- 96.Wichmann T, Bergman H, Starr PA, Subramanian T, Watts RL, DeLong MR. Comparison of MPTP-induced changes in spontaneous neuronal discharge in the internal pallidal segment and in the substantia nigra pars reticulata in primates. Exp Brain Res. 1999;125:397–409. doi: 10.1007/s002210050696. [DOI] [PubMed] [Google Scholar]