

Abstract
In the ascending auditory pathway, the context in which a particular stimulus occurs can influence the character of the responses that encode it. Here we demonstrate that the cortical representation of a binaural cue to sound source location is profoundly context-dependent: spike rates elicited by a 0° interaural phase disparity (IPD) were very different when preceded by 90° versus −90° IPD. The changes in firing rate associated with equivalent stimuli occurring in different contexts are comparable to changes in discharge rate that establish cortical tuning to the cue itself. Single-unit responses to trapezoidally modulated IPD stimuli were recorded in the auditory cortices of awake rhesus monkeys. Each trapezoidal stimulus consisted of linear modulations of IPD between two steady-state IPDs differing by 90°. The stimulus set was constructed so that identical IPDs and sweeps through identical IPD ranges recurred as elements of disparate sequences. We routinely observed orderly context-induced shifts in IPD tuning. These shifts reflected an underlying enhancement of the contrast in the discharge rate representation of different IPDs. This process is subserved by sensitivity to stimulus events in the recent past, involving multiple adaptive mechanisms operating on timescales ranging from tens of milliseconds to seconds. These findings suggest that the cortical processing of dynamic acoustic signals is dominated by an adaptive coding strategy that prioritizes the representation of stimulus changes over actual stimulus values. We show how cortical selectivity for motion direction in real space could emerge as a consequence of this general coding principle.
Keywords: binaural, rhesus, adaptation, interaural delay, sound localization, auditory motion, context
Sounds originating from locations to the left or right of the head reach the ears at slightly different times, resulting in interaural phase disparity (IPD) cues to their localization in the horizontal plane. Motion of sound sources relative to the head, produced by motion of either the listener or the source, results in dynamic variations in IPD. Although relative head motion also impacts other cues for sound localization, such as interaural intensity differences and monaural spectral cues, human psychophysical studies suggest that IPD cues dominate sound localization judgments for broadband sounds when low frequencies are present (Wightman and Kistler, 1992). Numerous studies suggest that cortical neurons in a range of mammalian species, including monkeys, are sensitive to auditory motion (Sovijärvi and Hyvärinen, 1974; Ahissar et al., 1992; Stumpf et al., 1992; Toronchuk et al., 1992; Poirier et al., 1997). Ablation studies have also implicated auditory cortex in both sound localization (Neff and Casseday, 1977; Heffner, 1978; Kelly, 1980; Jenkins and Merzenich, 1984; Kelly and Kavanagh, 1986; Heffner and Heffner, 1990; Heffner, 1997) and auditory motion detection (Altman and Kalmykova, 1986). Although the pioneering studies of Brugge and Merzenich (1973) revealed the sensitivity of macaque auditory cortical neurons to static interaural time and level disparities (ITD and ILD), cortical responses to dynamic IPDs (Reale and Brugge, 1990) have not yet been characterized in a primate model.
Not only is the nature of the cortical representation of time-varying IPD signals an important question in its own right, such signals are particularly convenient for analyzing the fidelity of the mapping of cortical responses to particular IPDs. Advantages include the robustness of IPD tuning to changes in sound pressure level (SPL) and the circumscribed range (360°) of the IPD axis itself. The use of periodic, trapezoidal IPD stimuli, which is unique to this study, permits detailed analysis of the temporal evolution of contextual influences both across stimulus periods and across epochs of steady-state IPDs of relatively long (1 sec) duration.
It is of particular interest whether context dependence is a prominent feature of cortical representation of IPD, because this coding property appears to emerge hierarchically in the ascending auditory pathway (Spitzer and Semple, 1998). Dynamic interaural disparities in phase (Spitzer and Semple, 1991, 1993, 1995, 1998; McAlpine et al., 2000) and level (Sanes et al., 1998), and simulated motion in the free field (Wilson and O'Neill, 1998), have revealed a novel form of sensitivity to stimulus context in the mammalian inferior colliculus (IC). It has been demonstrated that a particular value of binaural disparity in phase or level can be consistently associated with widely varying response rates when the same stimulus occurs in different contexts. “Conditioned” responses of this sort are not evident in the medial superior olive.
Monaural stimuli that contain frequency steps or sweeps, which do not generate a percept of motion, have also been shown to condition the responses of IC neurons (Malone and Semple, 2001), suggesting that conditioning is a general property of the way central auditory neurons process acoustic signals that “move” along any of the parameter axes to which they are tuned. Although the current study focuses on dynamic IPD signals for the reasons described above, the generality of conditioning effects demonstrated in the midbrain suggests that the dramatic impact of stimulus history on cortical processing reported here is not limited to IPD (McKenna et al., 1989) and reflects the operation of general synaptic and cellular mechanisms.
MATERIALS AND METHODS
Subjects, surgical preparation, and physiological recording. Two adult male monkeys (Macaca mulatta, designated X and Z) participated in these experiments. All procedures pertaining to animal use and welfare in this study were reviewed and approved by the New York University Institutional Animal Care and Use Committee. Anesthesia was induced with ketamine and sodium thiopental and maintained with isoflurane (1–4%) while a head-holder that mated to a specially designed primate chair (Crist) was implanted. A recording chamber (CalTech) was implanted above the auditory cortex in the left hemisphere of each animal. The initial placement of the recording chamber on monkey Z was slightly rostral to allow recordings across the rostral (R) and rostrotemporal (RT) fields (Hackett et al., 1998). The back of the initial chamber and the front of the chamber in its second placement straddled the low-frequency portion of primary auditory cortex (AI). The implant for animal X was centered over AI and provided access to caudal R, resulting in a larger sample of low-frequency IPD-tuned units. All penetrations were made vertically with respect to the cylinder implants and thus were roughly parallel to the stereotaxic vertical plane. Both animals are still involved in experiments, so assignment of recording locations to cortical fields is based on physiological criteria, such as the tonotopic progression in AI, and the distribution of response latencies (Scott et al., 2000).
Both animals had been extensively trained on binaural lateralization tasks involving both static and dynamic IPD and ILD cues. During recordings, blocks of psychophysical trials alternated with passive listening, when the trapezoidal IPD stimuli described in this report were presented. Behavioral and recording sessions were all conducted in a double-walled sound-attenuated chamber (Industrial Acoustics Company), and the animals were monitored continuously via closed-circuit television. Single-unit activity was recorded with tungsten microelectrodes (FHC) advanced into the brain via a stepping motor microdrive (CalTech). Recording location was referenced to a stereotaxic positioning system that mounted directly on the implant. Depths of all recordings were referenced to entry into the brain. Entry into the superior temporal plane was typically marked by a sudden increase in activity after a long silent interval and the first appearance of auditory responsiveness.
Stimulus generation and data acquisition. Stimulus waveforms were generated by digital synthesizers and custom hardware (MALab, Kaiser Instruments). Stimulus characteristics were specified in software running on the host computer (Macintosh), which communicated with a dedicated microprocessor (MALab) via an IEEE-488 interface. After digital attenuation and digital to analog conversion, the signal was transduced by electrostatic earphones (STAX Lambda) in custom housings (Custom Sound Systems) fitted to ear inserts. Before each experiment, the sound pressure level (SPL) expressed in decibels (dB re: 20 μPa) at each ear was calibrated under computer control for level and phase from 40 Hz to 30 kHz, using a previously calibrated probe tube and condenser microphone (4134, Brüel and Kjær).
Electrical signals from the brain were amplified (variable gain), filtered (typically from 0.25 to 10 kHz), and passed to oscilloscopes, an audio speaker, and an event timer (MALab, Kaiser Instruments). The occurrence of discriminated action potentials and stimulus synchronization events were logged with a resolution of 1 μsec. Event times were then retrieved from a “first in, first out” (FIFO) buffer and stored by the host computer for analysis and display.
Stimulus protocols. IPD sensitivity revealed by responses to binaural beat search stimuli (see below) was limited to cells with best frequencies below 2.5 kHz, which was near the behavioral limit of IPD-based lateralization performance for these subjects (Malone and Semple, 2000). Cortical neurons that clearly exhibited a periodic modulation of their responses to binaural beats were tested with trapezoidal IPD stimuli (Fig. 1). Unlike binaural beats, which derive from the presentation of two slightly different frequencies to each ear, the trapezoidal IPD stimulus is created by presenting the same frequency to both ears and modulating the phase at one ear (in these experiments, the left ear). A previous study confirmed that modulating the phase in tandem in both ears did not modulate the responses of cat IC neurons (Spitzer and Semple, 1993). Thus, entrainment to interaural phase modulation depends on the actual IPD cue, rather than the slight frequency change (e.g., 1 Hz for 360°/sec modulation) that necessarily occurs during monaural phase modulation (i.e., because frequency is the time derivative of phase). More directly, we have never encountered sensitivity to 1 Hz depth frequency modulation despite extensive testing with such stimuli as part of a larger physiological survey of primate auditory cortex.
Fig. 1.
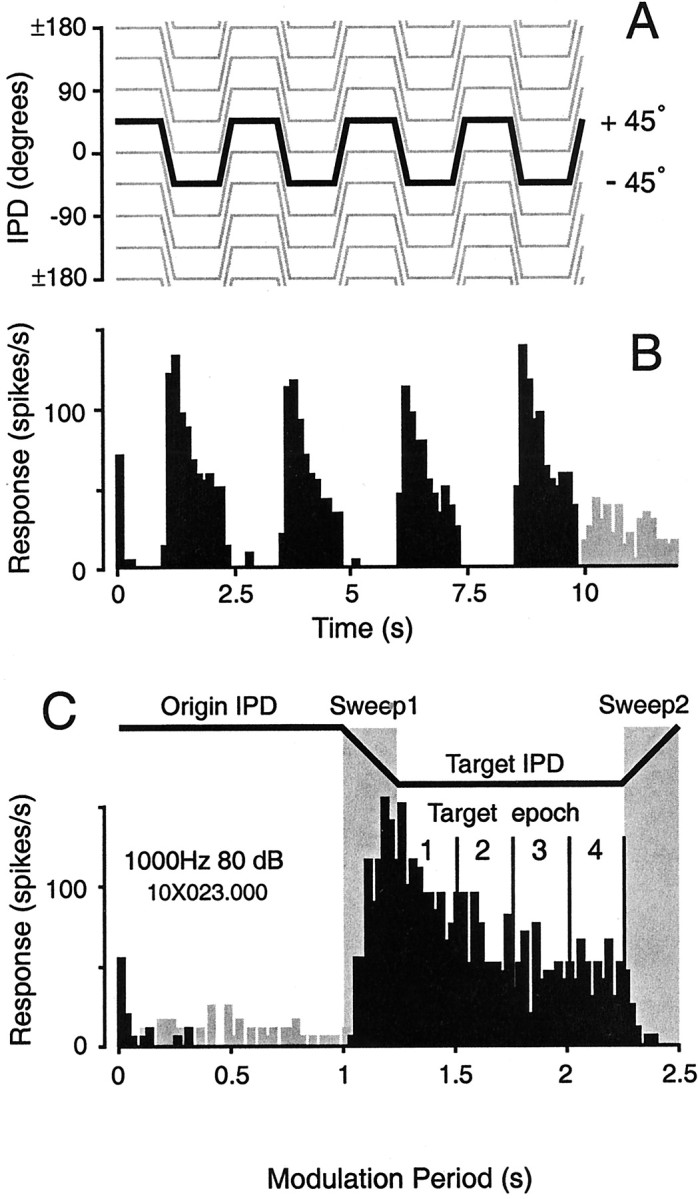
Description of the stimuli used in this study.A, The periodic trapezoidal IPD stimulus set. The 360° IPD axis is spanned by a set of eight origin-target IPD pairs whose origins are staggered by 45°; ±180° at the top andbottom of the IPD axis represents identical values, because the IPD axis is circular. Each individual stimulus (10 sec) consists of four periods, and each (2.5 sec) period is composed of two 1 sec duration steady-state IPDs (the origin and target) linked by linear (250 msec) modulations of IPD. The depth of modulation was 90° at 360°/sec in all cases. The initial modulation depth is negative for the stimulus set shown. Note that each sampled IPD point occurs twice: once as an origin and once as a target. The “partner” IPDs differ by 180° (e.g., for an initial negative modulation depth, 90° appearing as the OriginIPD is partnered with 0°, but 90° appearing as the Target IPD is partnered with 180°). Thus, the context in which a particular IPD value occurs varies as much as the 360° IPD axis allows. The responses during the first origin period were used to estimate the static IPD tuning function of each neuron (Fig.2B,C). The interstimulus interval was always 2 sec. B, Histogram depicting responses to two presentations of the highlighted stimulus inA (45° origin, −45° target). Responses during the interstimulus intervals are shown in gray.C, Modulation period histogram of the trial-based responses shown in B. The duration of the origin-to-target (Sweep1) and target-to-origin (Sweep2) sweeps was 250 msec. Firing rates were sometimes calculated separately for each 250 msec epoch of the steady-state intervals. These four epochs are indicated for the target IPD (−45°).
The carrier frequency and level that elicited the best combination of discharge rate and synchrony to the period of the binaural beat search stimuli were selected for the trapezoidal IPD stimuli. The carrier was nearly always the best frequency of the cell, as determined by responses to short tone pips with 0° IPD. Sound pressure levels for physiology (60–80 dB) were comparable to the level (80 dB) at which the animals performed IPD discriminations.
Each period of each trapezoidal IPD stimulus consisted of an initial steady-state IPD (origin), a linear phase sweep (90°) to the second steady-state IPD (target), and a return sweep to the origin IPD (Fig.1C). The IPD stimulus ensemble was created so that each steady-state IPD value occurred twice in the sequence, partnered with maximally different IPDs (Fig. 1A). For example, an IPD of 45° occurs as the origin in the stimulus modulating repetitively from 45° to −45°, and then again as the target in the stimulus modulating from 135 to 45°. The difference in stimulus “partners” (e.g., −45 and 135°) creates the change in stimulus context for the representation of a particular IPD (e.g., 45°). The IPD axis is circular rather than linear (i.e., 0 and 360° represent equivalent phases at both ears), and eight origin IPD values, sampled at 45° intervals, span this axis (Fig. 1A). Thus, an origin IPD tuning function was constructed from the responses to each of the eight IPD values occurring as origins; similarly, the target IPD function was constructed from responses to the same IPD values appearing as targets (see Fig. 2C).
Fig. 2.
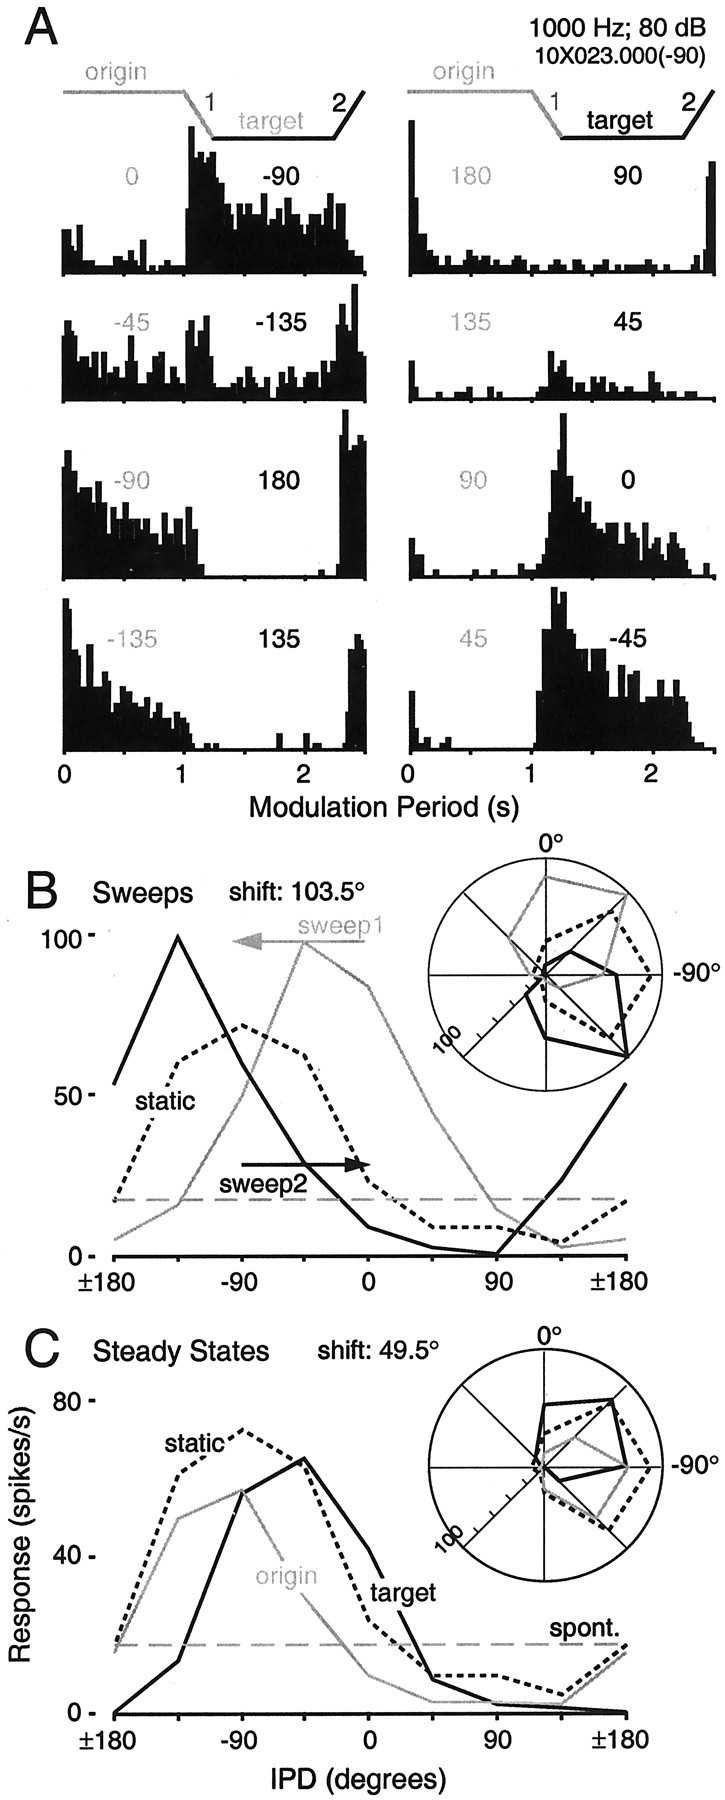
Cortical responses to identical IPD values and ranges are profoundly context dependent. A, Modulation period histograms corresponding to each stimulus shown in Figure1A. Numbers above each histogram indicate the origin and target IPDs. The bottom right histogram (45 to −45°) is the same as that shown in Figure1C, and all data derive from the cell featured in Figure 1. The response to −45° differs substantially when it is paired with −135 and 45°, for example. B, Responses during the sweeps inA are replotted as IPD tuning functions. The response rate averaged over each sweep is plotted at the IPD midpoint (e.g., the pair of responses to 45° IPD are based on the sweeps from 0 to 90° and 90 to 0°, indicated by arrows). The static IPD tuning function, based on responses during only the first origin period, is shown as a dotted line. The dashed line in gray indicates the discharge rate averaged over all interstimulus intervals. Polar representations of the same data appear as insets. If cortical neurons were indifferent to context, the curves in each panel would be identical. Best IPDs for sweep1 (gray) andsweep2 (black) differ by 103.5°.C, Responses during the steady states inA are replotted as IPD tuning functions, using similar conventions. Best IPDs for the origin and target functions differ by 49.5°. Discharge rates elicited by a particular IPD (e.g., −45°) typically differ most for IPDs on the slopes of the static tuning function.
The sweeps in each stimulus of the ensemble involved IPD modulations in opposite directions over an identical range (e.g., from 45 to −45° and then back from −45 to 45°). The sweeps followed the presentation of steady-state IPDs differing by 90°. The responses averaged over the origin-to-target sweep (see Fig. 2B, Sweep1) were used to construct one IPD tuning function, and the responses from the target-to-origin sweep were used to construct the other (see Fig.2B, Sweep 2). The values shown for the sweeps represent the midpoint of the IPD excursion (i.e., the response to the sweeps from 45 to −45° and −45 to 45° are shown at 0°). To monitor response variability over the duration of the recording, the 0° origin stimulus was presented twice (first and last) in each sequence. If the responses to the repeated stimulus were consistent, the data were retained for analysis, and those responses were averaged before the calculation of the best IPD and tuning sharpness (described below).
One period of the stimulus is comparable to the modulations of IPD experienced during listening to a stationary sound source (1 sec), turning the head (250 msec), listening again (1 sec), and returning to the original head position (250 msec). In these subjects, a 40° head rotation produces a 90° IPD for a 1 kHz sound source. By presenting IPD stimuli dichotically, however, we can produce modulations between pairs of IPDs positioned at regular intervals throughout the entire IPD axis, including and beyond the subset of IPDs experienced in the free field. IPD was linearly modulated by 90° at 360°/sec. The direction of the initial modulation could be either positive or negative; a negative initial direction (Fig. 1A) implies a phase lag at the left ear for the origin-to-target sweep. Each 12 sec trial consisted of four 2.5 sec periods (Fig.1A) followed by a 2 sec silent interval. Each stimulus presentation consisted of two to three trials. Responses during the origin and target intervals were also analyzed in four 250 msec epochs, as indicated for the target in Figure 1C.
If stimulus context affects the responses of cortical neurons, we should expect that both the origin and target tuning functions would differ from the IPD tuning function of the neuron as it is normally measured—with tone pips separated by silence. We determined the static tuning function of each neuron by considering only the responses that occurred during the first period of each origin IPD, which followed 2 sec of silence.
Data analysis. To assess the magnitude of context effects on the representation of IPD, we calculated the response-weighted best IPD of each IPD tuning function. The firing rate associated with a particular IPD value was treated as the length of a vector pointing in the direction of that IPD. For each IPD function, the vectors corresponding to the eight tested IPDs were summed to produce a resultant vector whose direction was the best IPD. The length of this vector was normalized by the sum of firing rates for all points on the function, resulting in a measure of tuning sharpness analogous to vector strength. A tuning sharpness of zero indicates equivalent responses to all IPDs; a value of one results if only one tested IPD elicits a response. Best IPD and tuning sharpness were also calculated separately for different periods, epochs, and intervals (see Results). The magnitude of the context-induced shift in IPD tuning was computed as the absolute value of the difference between the best IPDs of the origin versus target and sweep1 versus sweep2 IPD functions, subject to the constraint that the value be <180°. The shift magnitude is independent of differences in overall firing rates: for example, doubling all firing rates during the target IPDs would not change the measured shift magnitude (i.e., the best IPD of each function reflects only the direction of the resultant vector, not its length).
RESULTS
Summary of the data sample
The data described in this report were obtained as part of an extensive physiological survey of auditory cortex. IPD sensitivity was initially verified with binaural beat search stimuli in 176 neurons (112 in X; 64 in Z) with best frequencies below 2.5 kHz, the approximate upper limit for IPD-based lateralization performance in our animals. The presentation of trapezoidal IPD stimuli was restricted to the most stable recordings so that response changes attributable to fluctuating recording conditions would not be mistaken for context-dependent changes. Complete sets of responses to the full sequence of trapezoidal IPD stimuli were obtained for 46 cells (38 from X; 8 from Z). Some cells (n = 11) were tested at both positive and negative initial modulation depths, resulting in 57 cases (X: 45; Z: 12). The initial modulation direction did not impact the IPD tuning shift magnitude during the sweeps (Wilcoxon, p = 0.39) or steady states (Wilcoxon, p = 0.99). Because robust conditioning effects were evident in nearly all neurons from both animals, we combined the data from the two subjects in the analyses that follow. The trapezoidal IPD carrier frequencies ranged from 100 to 1700 Hz (median: 700 Hz). Because high SPLs generally produced better synchronized and more robust binaural beat responses, trapezoidal IPD data were collected at moderate to high SPLs: the modal SPL was 80 dB (27 of 57 cases), and 48 of 57 cases were obtained with SPLs from 60 to 80 dB. Ignoring the cases in which context effects were not significant (see below), neither the carrier nor the SPL predicted the magnitude of the context-induced IPD shift (Spearman's ρ,p > 0.05).
Changes in stimulus context dramatically impact the cortical representation of identical IPDs
The responses of a single cell to the full IPD stimulus ensemble are shown as a set of modulation period histograms in Figure2A, and again as IPD tuning functions in Figure 2, B and C. Examination of Figure 2 reveals that the firing rate associated with a particular IPD value (e.g., 0°) varies substantially with context. The origin and target IPD curves (Fig. 2C), based on responses averaged over the full duration (1 sec) of identical steady-state IPDs, are markedly out of registry because of changes in the context in which those IPD values occur. Similarly, the sweep functions shown in Figure 2B, which are based on IPDs modulated through exactly the same range, are >90° out of phase with one another. The rightward and leftward shifts of the sweep1 and sweep2 curves, respectively, are opposite the direction of motion, consistent with previous reports of IC responses (Spitzer and Semple, 1993; Wilson and O'Neill, 1998).
If we consider the fidelity of the rate representation of particular IPDs, it is evident that IPDs eliciting robust responses when paired with one IPD could suppress the response below the spontaneous rate when paired with another (Fig. 2C, 0° and −135°). For IPDs associated with the slopes of the static tuning function, the difference in the firing rates elicited by IPD excursions through identical ranges (Fig. 2A, −90 to ± 180° and −45 to 45°) can exceed the range of firing rates used to signal changes in IPD on the static tuning function.
The impact of stimulus context on the cortical representation of IPD can be quantified in two complementary ways—as a change in the firing rate associated with a particular IPD value and as a relative change in the best IPDs (see Materials and Methods) of the origin and target functions. To verify that such changes are genuine, it is necessary to compare them against benchmarks for rate and tuning shifts based purely on response variability. Our method for assessing the magnitude of context-induced shifts in both rate and tuning for the population is shown in Figure 3. Firing rates at each IPD, and the best IPD, were calculated for each of the final three origin and target periods in the trapezoidal stimulus (Fig.3A). The initial stimulus period, because it is preceded by silence, was excluded from this analysis. For each IPD, the absolute differences in firing rates from different periods of the same IPD function (Fig. 3B, bottom left) measure changes in rate attributable to response variability alone. Differences in the firing rates associated with identical IPD values from different (i.e., origin versus target) IPD functions (Fig. 3B, bottom right) were used to generate a complimentary set of six estimates of context-induced rate shifts. The average of each set of six values was then computed for each IPD point.
Fig. 3.

Method for the statistical verification of context-induced shifts in rate and IPD tuning. A, The trapezoidal IPD stimulus set (in the case shown, the initial modulation depth is positive). Labels above the steady-state intervals indicate the responses used for the construction of origin and target IPD functions (O2, O3,T2, etc.) based on individual stimulus periods. The first stimulus period was excluded from this analysis because it is preceded by silence. B, Period-based origin (gray) and target (black) IPD tuning functions derived from real data from a single cell. Context-induced changes in the representation of IPD can be calculated in two complementary ways: as a shift in the response elicited by each IPD (e.g., rate shift at 0°) and as a shift in the best IPD of the entire IPD tuning function (see Materials and Methods). Differences between IPD tuning curves from the same interval (e.g., the origin interval: O2, O3, andO4) reflect period-by-period variability in the response of the cell. Differences between IPD curves from origin and target intervals (e.g., O2 versus T3, etc.) reflect context-dependent changes in the responses to identical IPD values. C, Sets of estimates (6) of variability across periods and context-dependent shifts in rate and tuning used to confirm the validity of putative conditioning effects in individual cells. An ANOVA (p < 0.05) was performed to confirm that context-dependent IPD tuning shifts significantly exceeded shifts in tuning caused by response drift. For the data shown inB, these values are 73.6, 78.5, 79.5, 78.0, 74.4, and 72.9° for the context-induced shifts (e.g., O2 versusT3, etc.), and 1.5, 5.6, 4.1, 4.4, 0.8, and 5.2° for shifts caused by period-by-period variability (e.g., O2versus O3, etc.).
The distribution of average firing rate shifts calculated from origin and target curves normalized to their respective maxima are plotted in Figure 4A. Most points lie below the diagonal because context-induced shifts in the rate representation of IPD generally surpass the changes in rate caused solely by response variability. It is important to note, however, that some of the context-induced shifts are small, because the origin and target curves, although shifted, intersect at two points. Intersections near one of the eight sampled IPDs (Fig. 2C, 90 and −90°) produce small values of rate shifts. For similar reasons, the magnitude of the rate shifts for particular IPDs vary widely across the IPD range. Differences between the origin and target (or sweep1 and sweep2) curves tend to be maximal at or near the most steeply sloping portions of the static tuning function and minimal at the best and worst static IPDs (Fig. 2). Thus, not only are context-induced shifts significantly larger (Wilcoxon, p < 0.0001; mean = 0.44) than the typical period-to-period changes in responsiveness (mean = 0.12), but the context-induced shifts exhibit greater variance across IPD (Wilcoxon, p < 0.0001).
Fig. 4.

Population distributions of shifts in rate (normalized) and IPD tuning (degrees). A, Eachpoint represents the average of the six estimates (Fig.3C) of context-induced and variability-derived rate shifts. Each case (n = 57) contributes eight points to the graph, one for each of the eight IPD values comprising the full stimulus set. To allow for the direct comparison of cells with widely varying overall discharge rates, the origin and target tuning curves were first normalized to their respective maxima. Each of the six estimates represents the absolute value of the normalized difference in firing rate at each IPD. Significance was assessed on a case by case basis by the tuning shift test described in the legend of Figure3C. Points falling below the diagonal represent large context-induced shifts in the discharge rate representation of particular IPDs than would be predicted by period-to-period variability. B, Each point (n = 57) plotted on this graph represents the average of the six estimates of context-induced (abscissa) and variability-derived (ordinate) IPD tuning shifts for the steady-state (origin and target) tuning curves.
Although analysis of context effects in terms of rate shifts bears most directly on the fidelity of the mapping of response rates to particular IPD values, analysis of context effects in terms of IPD tuning shifts better captures the orderliness of the shifts in rate because the signs of rate differences are not discarded. Using the best IPDs calculated for origin and target intervals in the second to fourth stimulus periods, six estimates of tuning “shifts” attributable to variability alone (Fig. 3C, bottom left) were compared (one-way ANOVA) to the six estimates of context-induced shifts (Fig. 3C, bottom right). Of the 57 cases, 53 were significant (p < 0.05), with most cases significant at the p < 0.01 (50 of 57) andp < 0.0001 (41 of 57) levels. The means of each set of estimates are plotted against one another in Figure4B.
The mean tuning shift for significant cases was 59.8°, whereas the mean tuning shift attributable to response variability was 10.9°. In every case in which the response variability was sufficiently low (<25°), the context-induced shift was significant. Nonsignificant cases were not associated with smaller shifts (Wilcoxon,p = 0.34) but rather with greater variability (Wilcoxon, p = 0.0026). On this basis, they were excluded from the remainder of the data analysis, unless noted otherwise. In other words, we never encountered a cortical neuron that maintained an invariant mapping of response rate to IPD as context varied. In fact, the typical range in discharge rate spanned by responses to the same IPD as context varied was nearly half (0.44) the dynamic range available to signal changes in IPD on either function (origin or target).
IPD tuning shifts are independent of the overall strength and sign of the neuronal response
Although cortical neurons were uniform in their sensitivity to context, the character of their responses to trapezoidal IPD varied widely. The responses depicted in Figure 2 were facilitated at favorable IPDs, and suppressed at unfavorable IPDs, relative to the spontaneous rate. We estimated the spontaneous rate by calculating the average firing rate over all 2 sec interstimulus intervals. Although this average provides an adequate estimate of the spontaneous rate, for some cells the firing rate during the interstimulus intervals reflected the history of stimulus-evoked activity and could be more properly termed an afterdischarge because it follows the cessation of stimulus-evoked activity. These relationships are analyzed in detail in a subsequent section.
Suppression below the spontaneous rate (for at least two contiguous IPDs) contributed to the IPD tuning of 31 of 46 neurons, consistent with a prominent role for inhibition in cortical IPD processing. Responses depicted in Figure 5 represent the highest stimulus-driven (A–C) and spontaneous (D–F) firing rates in our sample. The responses shown in Figure 5A–Cexceeded the spontaneous rate for all IPDs, with favorable IPDs producing sustained firing rates in excess of 200 Hz. At the other extreme, reliable static IPD tuning and robust context-induced tuning shifts could also be based entirely on the differential suppression of vigorous spontaneous activity (Fig.5D–F). The mean tuning curve shift for the population, using all periods of the stimulus, was 55° (median: 49.5°) during the steady states and 75.5° (median: 82°) during the sweeps. The magnitudes of IPD tuning shifts did not depend on the firing rate averaged over either the duration of the stimuli in the ensemble (Spearman's ρ = −0.17; p = 0.23) or the interstimulus intervals (ρ = −0.05; p = 0.73). Thus, the redistribution of spikes that accounts for the shifts in IPD tuning (see below) appears to occur independently of the absolute number of spikes being fired, and the sign of the elicited response (i.e., excitatory or suppressive).
Fig. 5.

Dramatic context-sensitivity was apparent in cells with widely varying firing rates and response characteristics. Shown here are the responses of two cells representing the highest driven (A–C) and spontaneous (D–F) firing rates observed in the sample population. Graphing conventions are similar to those in Figure 2. The responses depicted in B and C exceed the average afterdischarge rate (gray dashed line) at all IPDs, whereas the responses in E andF are powerfully suppressed at all IPDs. Nevertheless, both cells are clearly tuned to IPD and sensitive to the context in which particular IPDs occur. Best IPDs for the sweeps are shifted by 82° (B) and 75.7° (E); best IPDs for the steady states shift by 60.6° (C) and 46.3° (F).
Context-induced shifts in rate and tuning reflect increases in temporal rate contrast
The foregoing analysis shows that particular discharge rates do not encode particular IPDs (or any other stimulus parameters defining these stimuli, such as frequency and level) unambiguously across contexts. The cortical IPD representation appears to be optimized to signal changes of IPD with changes in firing rate. Shifts in IPD tuning emerge as a consequence of a process operating at the level of individual stimuli: as the stimulus modulates between the pair of IPDs comprising each stimulus, the change in discharge rate—the temporal rate contrast of the ongoing IPD representation—is enhanced relative to the rate contrast associated with the same IPDs in the static tuning function. Because the stimuli are arranged in an ordered set, the result is an orderly shift of the origin function relative to the target function.
We define the discharge rate contrast as the difference in firing rate that presumably signals a difference between two stimuli, such as a 90° difference in IPD. We estimate the static discharge rate contrast by calculating the absolute value of the rate difference for each pair of points separated by 90° on the normalized static tuning function, i.e., all the points corresponding to origin-target pairs in the stimulus set (e.g., 0 and 90°, 45 and 135°, etc.). We calculate the dynamic discharge rate contrast by taking the absolute value of the difference in firing rate for the same origin-target pairs on the normalized origin and target curves (e.g., 0° on the origin curve and 90° on the target curve). The dynamic rate contrast (population mean: 0.5) is significantly greater (Wilcoxon, p < 0.0001) than the static rate contrast (0.35). The concentration of points below the diagonal on Figure 6 is evidence of the enhanced discharge rate contrast for the dynamic stimuli. This is equivalent to a transient steepening of the tuning function of the neuron between each pair of IPDs as they recur during individual stimuli in the ensemble.
Fig. 6.

Context-induced shifts in IPD tuning reflect enhanced contrast in the discharge rate representation of different IPDs occurring dynamically. The coordinates of all points in the figure reflect firing rate differences for IPDs separated by 90°. Normalized rate contrast at each IPD was computed as the absolute value of the firing rate difference taken from origin and target curves normalized to their respective maxima. Static discharge rate contrast was calculated as the difference in the responses to IPDs separated by 90° on the static tuning function (e.g., 0 and 90°). Dynamic discharge rate contrast was calculated as the difference in the responses to the same IPDs as the stimulus modulated between them: the response to 0° averaged over the second to fourth origin periods and the response to 90° averaged over the second to fourth target periods. Values falling below the diagonal indicate that repetitive modulation enhanced the firing rate difference associated with an IPD difference of 90° relative to the same difference (90°) for the same IPD values on the static tuning function.
The population average of tuning sharpness for the static function (0.37) was also significantly lower (Wilcoxon, p = 0.0101) than the tuning sharpness measured in the remaining origin periods (0.46). Note that both the static tuning sharpness and normalized rate contrast would be reduced if the significant elevation of firing rates during the first origin period (vs first target period: Wilcoxon, p = 0.0108; vs second origin period:p = 0.0002) were independent of IPD. On the other hand, the addition of a constant onset response across IPD would not affect the static rate contrast expressed as raw firing rate differences, which are also significantly (Wilcoxon, p < 0.0001) smaller than the differences for the same IPDs occurring dynamically. This suggests that in the cortex, the cost of further degrading the fidelity of the mapping of instantaneous IPD to discharge rate is outweighed by the benefits of enhancing the discharge rate representation of changes in IPD.
Shifts in the rate representation of particular IPDs can be predicted by stimulus/discharge history
As has been noted (Joris and Yin, 1992), numerous authors have “drawn attention to the significance of adaptation as a ubiquitous sensory mechanism to enhance temporal contrast.” For example, Wilson and O'Neill, (1998) have argued that shifts in the receptive fields of IC neurons in the unanesthetized mustached bat reflect “spatial masking,” whereby responses to previous stimuli decrease the responsiveness of a cell in proportion to the level of prior activity” [see also McAlpine et al. (2000)]. Simply put, the response to a particular IPD preceded by a stimulus eliciting a weak response should exceed the response to the same IPD preceded by a stronger response. In Figure7A, differences in responses during oppositely directed sweeps through the same IPD range are plotted against the differences in the rates for the steady-state intervals preceding them. Because the weaker sweep response generally follows the stronger steady-state response, and vice versa, the slope of the line of fit is negative, as predicted. Similarly, when the firing rates in the origin and target intervals are equivalent, the responses averaged over the sweeps are likewise equivalent, producing an intercept very near zero (0.68 Hz). The strong negative correlation (ρ = −0.78; p < 0.0001) between the steady-state and sweep response differences remains when differences are calculated from the normalized sweep and steady-state tuning functions (ρ = −0.74; p < 0.0001) (Fig. 7,insets). This finding is consistent with the independence of absolute firing rate and tuning shift magnitude exemplified in Figure 5.
Fig. 7.
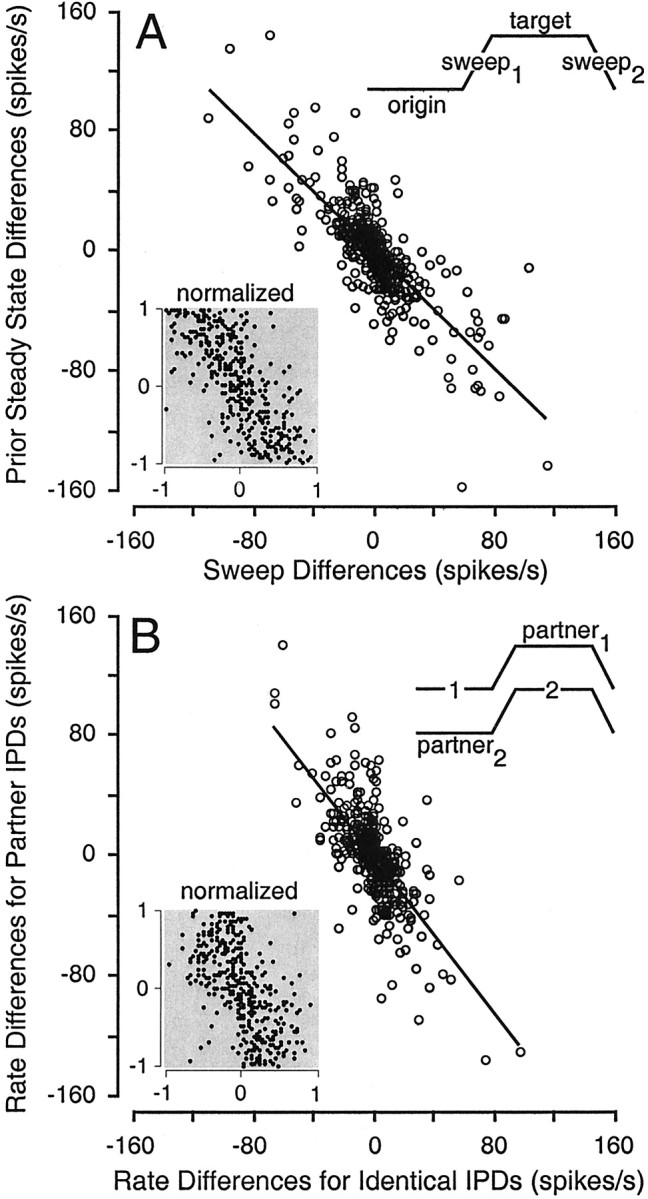
Shifts in the responses to identical IPD values and ranges can be predicted by responses to stimulus events in the recent past. A, The difference in the responses to oppositely directed sweeps traversing equivalent ranges of IPD (sweep1 − sweep2) is inversely correlated with the difference in the responses to the preceding steady state (origin − target), such that responses to the sweep after the less effective steady state are stronger, and vice versa. Results of a similar analysis based on differences calculated for IPD tuning functions (sweep1,sweep2, origin, andtarget) normalized to their respective maxima are shown in the inset. B, Differences in the responses to identical IPDs (1-2 on stimulus icon) in different contexts are inversely correlated with differences in the responses to the modulation “partner” IPDs (partner1–partner2). A similar analysis conducted on normalized firing rates is shown as aninset.
Examination of the histograms in Figure 2 reveals that in cases where the response to a particular IPD (e.g., 0°) varies substantially across contexts, the responses to its partner IPDs (i.e., −90 versus 90°), the “contexts” for that IPD, also tended to vary substantially. In Figure 7B, the difference in the responses to the same IPD (e.g., 0° as an origin vs 0° as a target) is plotted against the difference in the responses to its partners. The correlation in this case (ρ = −0.70; p < 0.0001) is nearly as strong as that relating the sweeps to the preceding steady states, despite the fact that each IPD is separated from its partner by the duration of the interposed sweep. This suggests that the continuously modulated components of the stimulus are not necessary for conditioning to occur [see also Malone and Semple (2001)] and that contextual influences can persist for some time; the strong negative correlation between steady-state IPDs and their partners indicates that at least one of the mechanisms controlling the gain of cortical responses operates on a time scale on the order of the interposed sweeps (250 msec). If this mechanism operated more quickly, then an enhanced sweep response, conditioned by a weak response to the preceding steady-state IPD, would curtail the enhancement of the steady-state response after the enhanced sweep.
Although stimulus events in the recent past shape cortical responses to time-varying IPDs, “recent” events can apparently be integrated over a fairly long interval. Sanes et al. (1998)demonstrated previously that conditioning effects could sometimes affect the “spontaneous” firing rates of IC neurons. In the current study, afterdischarge rates provide an opportunity to examine the length of the windows that define recent history in the cortex. The underlying positive correlation in the raw stimulus-driven and spontaneous firing rates (ρ=0.24; p < 0.0001), which reflects differences in absolute firing rates across cells, was removed by normalizing all firing rates to the peaks of their respective IPD tuning functions. The response during the final target period does not predict (ρ = −0.05; p = 0.28) the afterdischarge rate across IPD, despite the fact that it is separated from the interstimulus interval only by the return sweep. The firing rate averaged over the full duration (10 sec) of each stimulus, however, was inversely and significantly correlated with the afterdischarge rates across IPD (ρ = −0.19; p< 0.0001). This correlation is evidence for a gain control process set by firing rates averaged over intervals on the order of a full modulation period (2.5 sec), because the changes in afterdischarge rate evidently reflect the stimulus-driven rate averaged over both the origin and target periods and the sweeps in between them. Note that this sensitivity to stimulus history over long intervals (i.e., a strong negative correlation between the stimulus-driven rate and the afterdischarge) is not predictive of context effects at timescales relevant to the sweep shift magnitudes (ρ = −0.03;p = 0.82) and is marginally associated (ρ = −0.28; p = 0.0434) with smaller rather than larger steady-state tuning shifts. This suggests that adaptive mechanisms contributing to cortical sensitivity to stimulus history on different timescales may operate independently.
Contextual influences wax across stimulus periods and wane within steady-state intervals
The increase in discharge rate contrast for the modulated stimuli suggests that a dynamic equilibrium in the rate representation of each pair of IPDs is achieved as the stimulus modulates between them. As evident in Figures 1A and 5, A andD, cortical responses to trapezoidal IPD stimuli recur robustly from period to period. Thus, the firing rates (for all cases and all IPDs) are equivalent (Kruskal–Wallis, p = 0.99) for all origin/target periods excluding the first. Nevertheless, progressive changes in IPD tuning reflect the redistribution of spikes across origin and target intervals described in the previous section. Tuning shift magnitudes progressively and significantly (p < 0.01) increase across each period (population means, periods 1–4: 40.6, 55.6, 61.2, and 65.5°). This evolution of tuning properties reflects the progressive enhancement of the discharge rate contrast representing IPD changes of 90° as they recur during each trapezoidal stimulus.
Although changes in IPD regenerate the responses of cortical neurons across stimulus periods, firing rates decay substantially across steady-state epochs (Fig. 8), when the IPD does not change. Thus, the average ratio of the fourth/first period firing rates (0.97) was significantly larger (indicating a lesser decay in firing rate; Wilcoxon, p = 0.0002) than the average ratio of fourth/first epoch rates (0.71; ratios were taken with origin and targets separate and then these two values were averaged). Firing rates averaged over all stimuli and all cases decay significantly (Wilcoxon, p < 0.0001) from the first epoch (25.4 Hz) to the second (19.8 Hz) but do not differ thereafter (Kruskal–Wallis, p = 0.48). This is a measure of adaptation as it is most commonly defined: a progressive decrease in the response elicited by a constant stimulus. Nevertheless, the effects of stimulus history are not simply adaptation, because responses conditioned by changes in stimulus context “adapt” in an IPD-dependent manner.
Fig. 8.

Stimulus-specific adaptation results in the progressive convergence of context-shifted responses on the static best IPD. A, Origin (gray) and target (black) tuning functions calculated for individual epochs (250 msec) become more similar in later epochs. IPD tuning shift magnitudes are shown to the right of each pair of curves. The static best IPD is indicated on each panel by the dashed vertical line.B, The curves shown in Aare replotted separately to help illustrate the more rapid decay of context-shifted responses on the origin and target functions (target: −45 and 0°; origin: −135°) relative to responses to IPDs proximal to the static best IPD. C, Origin and target curves from an additional cell showing a similar progressive convergence on the static best IPD across epochs. D, Responses to the sampled IPD (−45°) nearest the static best IPD remain relatively high, whereas the enhanced responses most responsible for the shift in the best IPDs for the origin (0 and 45°) and target (−90 and −135°) functions exhibit pronounced adaptation.
Shift magnitudes for the population decrease significantly from the first to second epochs (67 to 55.2°; Wilcoxon, p = 0.0025) and again from the second to third epochs (55.2 to 45.9°;p = 0.0220), remaining stable thereafter (45.9 vs 48.2°; p = 0.67). It is noteworthy that the decay in the shift magnitudes from the second to third epochs occurs in the absence of significant firing rate decay. In addition, the decay in firing rate from the first to the fourth epochs, averaged across IPD, is not related to the decay in shift magnitude from the first to fourth epoch (mean: 0.73; ρ = 0.07; p = 0.61) on a cell-by-cell basis.
These apparently paradoxical results are explained by the fact that the largest epoch-by-epoch changes in firing rate occur for those IPDs associated with the largest context-dependent response changes. The epoch-by-epoch evolution of IPD tuning shift magnitudes is depicted for a single cell in Figure 8, A and B. For example, the rate shifts in the representation of −135 and 0° in Figure8A diminish substantially from the first to the fourth epoch because of the accelerated decay in the enhanced responses at those IPDs (i.e., the origin response at −135° and the target response at 0° in Fig. 8A). The progressive convergence of both the origin and target curves on the static best IPD is more clearly evident when the origin and target curves in Figure8A are replotted in Figure 8B. Here, it is apparent that the responses to the sampled IPD nearest the static best IPD decay less than the enhanced responses at the peaks of the first-epoch tuning functions (black line, epoch 1). It was also possible for suppressed responses to recover across epochs, as shown on the target curve (−135°) in Figure 8B. Responses of a different cell showing similar properties are shown in Figure 8, C andD.
These findings suggest that although it is possible for cortical neurons to display profound shifts in their tuning to IPD, the distribution of inputs that give rise to the static tuning function anchor the conditioned changes in rate that may occur at various IPDs. Responses to the static best IPD are never substantially diminished, nor are responses to the static worst IPD substantially enhanced. Responses to IPDs on the slopes of the static tuning function depend critically on recent stimulus history, but with time, they converge on their statically defined norms at a rate at least partially determined by their difference from those norms.
Implications for the processing of auditory motion
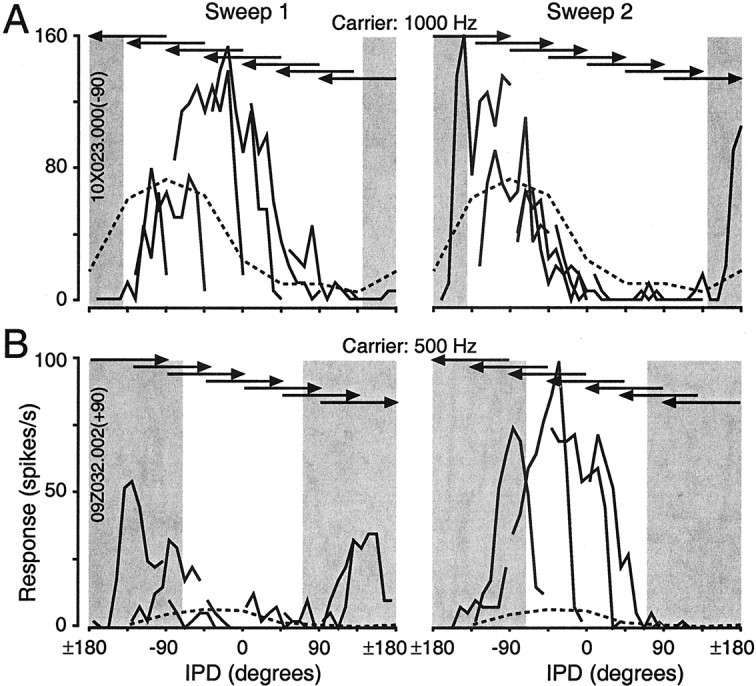
In previous sections, contextual influences on the firing rate representation of IPD were treated as specific instances of a general sensitivity to stimulus history. Below, we examine cortical responses during the modulation of IPD in more detail and emphasize the relationship of IPD processing to the localization of sound sources in azimuth. A polar plot indicating the static best IPD of each neuron (n = 46) in the sample appears in Figure9A. Carrier frequency is indicated by the radial distance of each point from the origin. Theshaded area delineates IPD values that could not occur under normal listening conditions because the ITDs required for their generation exceed the maximum ITD allowed by the separation of the ears. This area was calculated for the head radius of the larger of our animals (monkey Z) using Kuhn's (1987) low-frequency model of ITDs produced by changes in azimuthal angle (θ): ITD = 3(r/c)sin (θ), where r is the head radius and c is the speed of sound. Although this model was developed for humans, it has been shown to provide a good fit to ITDs generated by the azimuthal displacement of free-field sound sources in the rhesus monkey (Spezio et al., 2000).
Fig. 9.
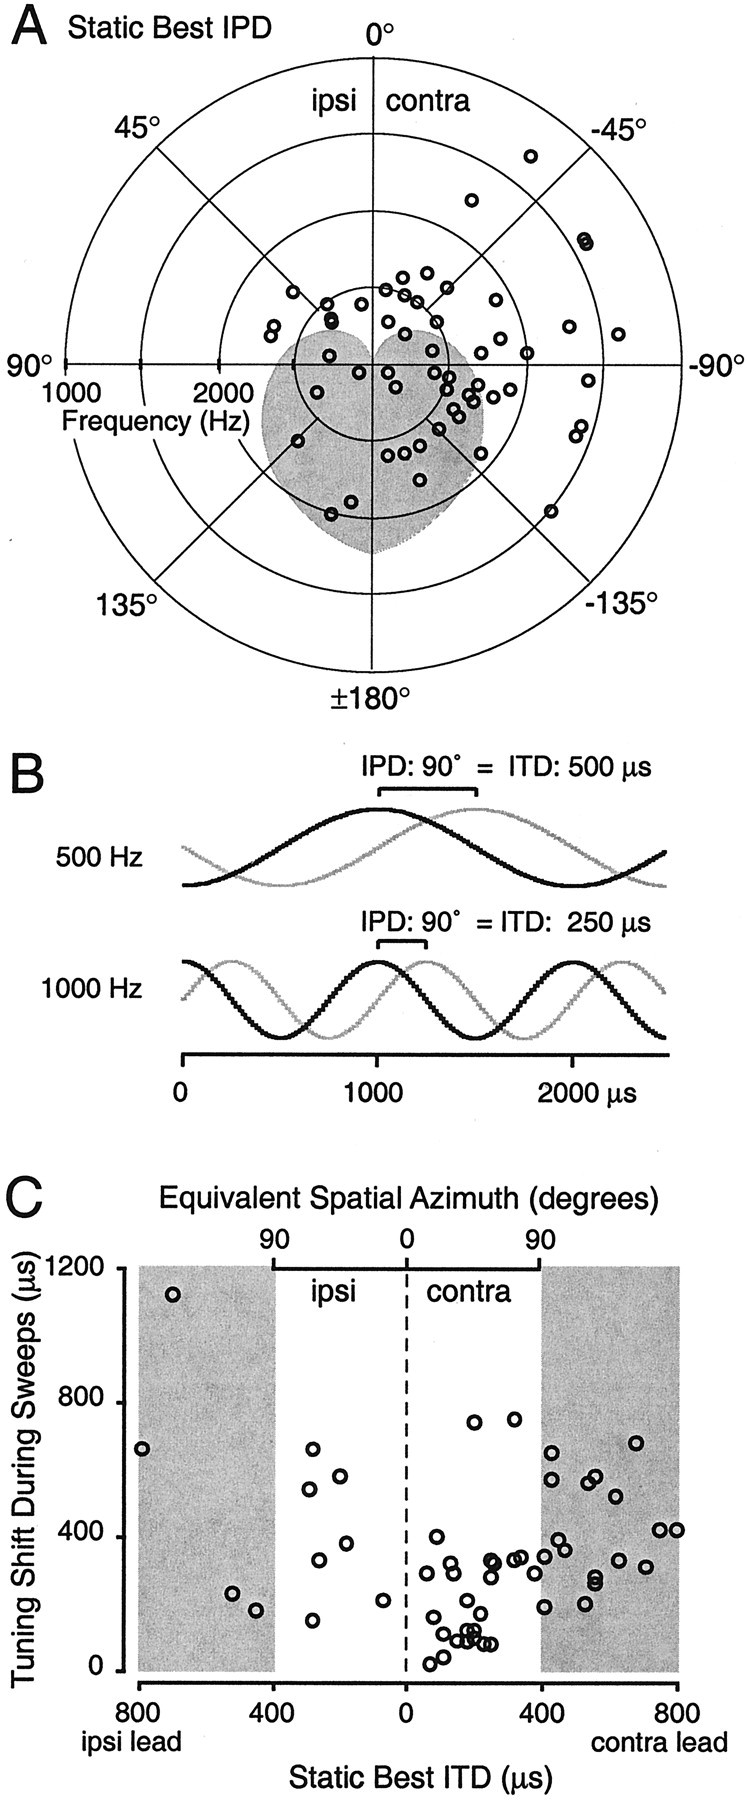
Static best IPDs and shifts in IPD tuning can also be expressed in terms of ITDs and equivalent azimuthal angles.A, Distribution of static best IPDs for each cell (n = 46) in the population (only data from cases with negative initial modulation depths are shown for cells where both cases were available). The carrier frequency at which the static best IPD was determined is indicated by the radial distance of each point from the origin. Points falling within the shaded area correspond to ITDs greater than could be produced by an azimuthal displacement of a sound source 90° away from midline at that carrier frequency, given the head radius measured for the larger of the two animals used in this study. Such IPDs are described as falling outside the “ecological range.” B, Larger differences in ITD are required to produce an equivalent IPD at lower carrier frequencies. For a 500 Hz carrier, an IPD of 90° is produced by a 500 μsec delay of the signal to one ear, but a similar IPD at 1000 Hz would be produced by an ITD of only 250 μsec. C, Tuning shifts in IPD for the cells shown in A are recalculated as shifts in ITD and equivalent azimuth and plotted against the static best ITDs. As in A, shaded regions indicate values exceeding the ecological range. Three extreme points (−1890.6, 731.4; 3203.2, 917.5; −3304.7, 2360.6) based on cells with very low best frequencies (200, 100, and 100 Hz, respectively) have been omitted to avoid a drastic rescaling of the axes.
As expected, the preferred IPDs of most cells corresponded to azimuthal locations contralateral to the recording site. The mean static best IPD of the population was −82.5°, and the mean tuning sharpness was 0.44. In small-headed mammals such as the gerbil, IPD tuning functions typically peak outside the ecological range. It is not surprising that a larger proportion of macaque cortical neurons should have mean IPDs in the ecological range because the monkey's larger head size means that for a given carrier frequency, a greater proportion of the 360° IPD axis falls within that range. Nevertheless, cortical responses to IPD were indifferent to the ecological plausibility of such stimuli, as evidenced by the independence of tuning shift magnitude and static best IPD (test of linear–circular association; sweeps: p = 0.33; steady-states: p = 0.45).
Psychophysical studies of auditory motion processing suggest that the effects of motion should also scale with speed (Perrott and Musicant, 1977, 1981; Mateeff and Hohnsbein, 1988). If the effects that we observed depended on the rate of simulated azimuthal motion, then cells with the lowest best frequencies would show the largest shifts: for progressively lower frequencies, a given change in IPD represents a greater change in ITD (Fig. 9B) and azimuthal angle. Nonetheless, the magnitude of tuning shifts, expressed in IPD, were consistent across cells with widely varying best frequencies: carrier frequency was not predictive of the magnitude of the tuning shifts observed for the sweeps (ρ = −0.13; p = 0.37).
Tuning shift magnitudes for all significant cases (n = 53) were converted to ITDs and are shown in Figure 9C. In 14 of 46 cells, shifts are larger than the maximum ecologically plausible ITD (∼398 μsec; indicated by the shading on Fig.9C). All of these cases involved carrier frequencies below 600 Hz. Conversely, the cells preferring small contralateral leads and exhibiting small ITD shifts were nearly all tuned to frequencies >1000 Hz. Although many of the individual values comprising the shifted IPD tuning functions are ecologically implausible, it is possible to express the magnitude of tuning shifts less than twice the maximum ITD (i.e., ≅800 μsec, or −90 to 90° in azimuthal angle) as shifts in azimuthal tuning from 0 to 180° (Fig. 9C). If we consider only one case per cell, the 43 (of 46) cells falling within this range have a mean azimuthal shift of 64.4° during the sweeps themselves.
Given the magnitude of these shifts, one should consider the possibility that they reflect a special sensitivity to auditory motion in the cortex. In the current study, as in others (Spitzer and Semple, 1991, 1993; Wilson and O'Neill, 1998), the shifts in tuning measured during the sweeps were uniformly opposite the direction of motion: responses were enhanced by motion toward the static best IPD and suppressed by motion directed away from it (Fig. 2B). Genuine sensitivity to motion direction, however, should be expressed as selectivity for either clockwise or counterclockwise motion in real space (Wagner and Takahashi, 1992; Wagner et al., 1994), which would appear as a change in the overall gain of responses to sweeps in opposite directions (i.e., the height of the sweep1 versus sweep2 curves in Figs. 2B,5B,E). In Figure10A, the response to sweep1, averaged across IPD, is plotted against the averaged response to sweep2 for each stimulus set. The strong linear relationship indicates a lack of selectivity for motion direction assessed throughout the full range of IPD.
Fig. 10.

Cortical neurons that are not selective for the direction of IPD modulation may still be selective for the direction of simulated azimuthal motion. A, Selectivity for motion direction per se would result in an overall gain change in responses to IPDs swept in the preferred direction. Responses tosweep1 were averaged over all (8) IPD ranges and compared with the average of the responses to sweep2. The line of fit to these data is shown. The strong linear relationship indicates that when responses throughout the full range of IPDs are averaged, cortical neurons show no preference for the direction of IPD modulation (i.e., relative shifts of the sweep1 and sweep2 curves occur without changes in the overall gain of either function). Thefilled circle indicates the cell showing the largest consistent direction preference (Fig. 11B). Although it is sometimes convenient to consider a given direction of IPD modulation as equivalent to motion in real space (e.g., a relative phase advance at the left ear simulates counterclockwise azimuthal motion), it is not possible to assign a direction of motion, in azimuth, to IPDs sweeps outside the ecological IPD range (Fig. 9).B, Across IPD, the peak of the population mean IPD MDSI occurs at the midline. The MDSI [(clockwise − counterclockwise)/(clockwise + counterclockwise)] was calculated for all IPD ranges (e.g., 0° represents sweeps in the range from −45 to 45° IPD) and all cells. A value of ±0.33 represents a response to the preferred direction of modulation twice that in the nonpreferred direction. Each point indicates the mean MDSI for the population at each IPD range. Vertical error bars indicate SEM. By convention, positive MDSIs represent clockwise motion, which implies motion toward contralateral space for sweeps near the midline.
It is important to realize, however, that had the stimuli in this study been limited to the ecological range of IPDs, most cells would have been classified as selective for motion direction. In Figure5B, for example, the responses to sweep1 (clockwise, in this case) consistently exceeded the responses to sweep2 throughout the ecological range (approximately −57 to 57° for a 400 Hz carrier). If we consider the responses to sweeps about the midline, and limit the analysis to cells with carriers where the range of these sweeps (−45 to 45° in IPD) is ecologically plausible, then 25 of 37 cells would be considered motion-direction selective by a conventional criterion (Poirier et al., 1997): the response to the sweep in one direction was more than twice the response to the sweep in the other. The mean motion direction selectivity index (MDSI) [the absolute value of (sweep1 − sweep2)/(sweep1 + sweep2)], where a value of 0.33 represents a doubling/halving of the response in one direction relative to the other, was 0.41.
Although sensitivity to “motion” defined with respect to the static IPD peak reflects a general sensitivity to stimulus history, this phenomenon need not be a specialization for auditory motion processing to impact the processing of auditory motion. Alternatively, a specialization for motion direction selectivity could be expressed in the distribution of static tuning properties of the cortical population. For example, the distribution of static best IPDs could be skewed to support the exploitation of this general mechanism for the specific purpose of motion-direction selectivity by concentrating context-dependent effects promoting motion-direction selectivity about the midline, where spatial acuity is maximal (Domnitz and Colburn, 1977). If we retain the sign of the MDSI, such that positive values indicate a preference for sounds moving clockwise in azimuth, the population average MDSI across IPD is a roughly sinusoidal function with a maximum at 0° IPD (Fig. 10B). In other words, auditory cortical neurons of the left hemisphere are most strongly selective for clockwise motion when it occurs about the midline. Near the midline, clockwise motion is motion toward contralateral space— toward the location of the mean static best IPD (−82.5°).
In addition to selectivity for motion direction, it is also possible that cortical neurons are particularly sensitive to acoustic motion simulated by IPD modulation. For example, the highest response rates were generally observed during the sweep in the preferred direction for each origin-target IPD pair (Fig. 2A). The responses of this cell during only the sweeps of the trapezoidal stimuli are shown in Figure11A. Not only are the responses to the clockwise (“leftward”) sweep stronger than responses to the counterclockwise sweep through most of the ecologically plausible range, the responses to the sweeps occupy a much larger dynamic range than do the responses comprising the static tuning function. An extreme example of this phenomenon is shown in Figure11B. This cell was powerfully direction selective throughout the entirety of the ecologically plausible range. In fact, this cell was uniquely direction selective throughout the full (360°) range of IPD (Fig. 10A, ●). More striking, however, is the vastly expanded dynamic range available to the neuron during the sweeps. For example, responses on the static IPD function are relatively flat from 0 to −90°, but over the same IPD range, the response to the sweep rises and falls quite steeply, spanning a dynamic range of nearly 100 Hz. Thus, the previously described increase in rate contrast for steady-state IPDs occurring in a dynamic context is even more apparent during the dynamic components of each stimulus.
Fig. 11.
Cortical neurons are often selective for motion direction within the ecological range, and some neurons are particularly sensitive to auditory motion itself. A, Responses during the sweep components of the trapezoidal stimuli for the cell featured in Figure 2. Each point is based on the average rate calculated in 25 msec intervals (i.e., a bin of the modulation period histograms in Fig. 2A), which corresponds to an IPD range of 9°. The static tuning function is shown as a dashed line, and IPDs outside the ecological range are shaded. Responses to the sweeps, relative to the static tuning function, are shifted opposite the direction of motion, such that they lead responses to the same IPDs predicted from the static tuning curve. Note that the effects of response latency, which cause the response to lag the stimulus that elicited it, result in an underestimation of these effects. A latency of 25 msec, for example, would result in a 9° underestimation of the phase lead of sweep responses relative to the static tuning function.B, Responses of a cell showing both selectivity to motion direction focused in the ecological range and sensitivity to IPD modulation itself. The dynamic range of responses to individual sweeps (e.g., 0 to −90°) vastly exceeded the dynamic range of the static tuning function itself. This cell responded relatively weakly to steady-state IPDs but quite strongly to changes of IPD throughout and slightly beyond the ecological range of IPD. For both cells, the sweeps between −135 and 135° have been removed for clarity.
The foregoing observation suggests that there are central adaptive mechanisms that regulate the gain of cortical responses on a relatively short (tens of milliseconds) timescale. The contribution of such mechanisms may explain the fact that shifts in IPD tuning were significantly larger (Wilcoxon, p < 0.0001) during the sweeps than the steady states. This increase in shift magnitude cannot be explained by larger firing rate differences between the steady-states preceding the sweeps (which differ by 90°) than between the steady-state IPD partners (which differ by 180°), because the distributions of those differences are statistically indistinguishable (Wilcoxon, p = 0.41). Shift magnitudes for sweeps are not correlated with shift magnitudes for steady states (ρ = 0.07; p = 0.62). Shift magnitudes for the sweeps also appear to depend more strongly on the adaptive mechanisms that determine the decay in firing rate by epoch during steady-state intervals. The ratio of the fourth/first epoch firing rates was inversely correlated with the tuning shift magnitudes for the sweeps (ρ = −0.38; p = 0.0048), such that cells showing the largest decay in firing rate for a constant stimulus exhibited the largest shifts when the stimulus was changing. This same ratio was unrelated to steady-state shift magnitudes (ρ = −0.06; p = 0.68). These findings further support the contention that multiple adaptive mechanisms, operating independently and at different timescales, subserve sensitivity to stimuli in the recent past, at varying degrees of recency.
DISCUSSION
Context-induced changes in the cortical representation of IPD signals are ubiquitous and substantial. All neurons showed clear evidence of conditioning, and as context varied, the range of responses to identical values or equivalent ranges of IPD could surpass the dynamic range of the static IPD tuning function itself. The average shift in cortical IPD tuning was more than twice as large as the typical shift obtained in the IC of anesthetized gerbils with identical stimuli (Miko et al., 1999; Malone and Semple, 2000). What proportion of the increased prevalence and magnitude of cortical conditioning reflects the change in structure (cortex vs IC), species (macaque vs gerbil), or state (awake vs anesthetized)? Does the character of cortical conditioning reflect patterns of connectivity unique to cortex, biophysical mechanisms peculiar to cortical neurons, or simply the ordinal position of cortex in the auditory pathway? Although the elaboration of context sensitivity likely continues beyond the auditory midbrain, more important than the locus of this elaboration is the implication of our basic finding: in the cortex of awake primates, an invariant mapping of IPD to discharge rate is sacrificed to a coding strategy that prioritizes stimulus changes over actual stimulus values.
The enhanced representation of stimulus change is at least partially attributable to a sensitivity to recent stimulus history.McAlpine et al. (2000) demonstrated that apparent motion sensitivity in the IC is consistent with cells there being sensitive to their own discharge history. We also found that discharge history was predictive of the responses to oppositely directed sweeps and equivalent steady-state IPDs occurring in different contexts. Analysis of conditioning elicited by monaural frequency sweeps (Malone and Semple, 2001), however, demonstrated that for many IC neurons, significant differences in the responses to a common target stimulus occurred even when the different origin stimuli preceding the target elicited statistically equivalent responses. Sensitivity to discharge history among the afferents of the recorded neuron could support stimulus-specific conditioning. The demonstration that visual contrast adaptation can be dissociated from the firing rate of the recorded cell further suggests that adaptation can be controlled by “information beyond the scope of the cell or its immediate signal pathway” (Bonds, 1991).
In this and previous studies of conditioning effects based on simulated auditory motion (Spitzer and Semple, 1991, 1993, 1995, 1998; Takahashi and Keller, 1992; Sanes et al., 1998; Wilson and O'Neill, 1998;McAlpine et al., 2000; Ingham et al., 2001), stimulus and discharge history cannot be effectively dissociated. Nevertheless, response adaptation during steady-state epochs exhibited intriguing stimulus-specific properties. Discharge rates decayed more rapidly at IPDs associated with enhanced responses, relative to the static tuning function, than at IPDs near the static best IPD, resulting in a progressive convergence of each context-shifted IPD tuning curve on the static best IPD. The adaptive properties of each recorded neuron apparently reflect something more than the recent history of the discharges of that neuron.
In the visual system at least, response adaptation is more rapid and profound in the cortex than in earlier stages of the visual pathway (Hawken et al., 1996). At least part of this change is intrinsic to individual cortical neurons, which adapt more rapidly to sinusoidal current injection in vitro that do cells of the LGN (Sanchez-Vives et al., 2000a). Consistent with this finding, quantitative parcellation of stimulus-selective and -nonselective adaptation in the visual system in two studies (Albrecht et al., 1984;Carandini and Ferster, 1997) indicates that the majority of the strength of adaptation could be attributed to nonselective effects of response history. Nevertheless, complex cells in primary visual cortex have recently been shown to exhibit rapid, stimulus-specific conditioning of their orientation tuning (Muller et al., 1999). Because the locus of adaptation to discharge history (i.e., whether it is predominantly intrinsic or extrinsic to the recorded neuron) affects how sequences of stimuli are processed (Malone and Semple, 2001), determining the stimulus specificity of adaptive effects in auditory cortex remains an important topic for future research.
Trapezoidal IPD stimuli enlist adaptive mechanisms on multiple timescales. Analogously, biophysical mechanisms that have been proposed to account for contrast adaptation in the visual system (Sanchez-Vives et al., 2000b) also act on different timescales. In motion-sensitive neurons of the fly visual system, for example, time courses of adaptation track the timescales of changes in stimulus variance: response gain is set by stimuli in the recent past, resulting in a phase lead with respect to the stimulus (Fairhall et al., 2001). Cortical responses during IPD sweeps show similar phase leads with respect to the static tuning function (i.e., cells begin to respond and cease responding earlier in the sweeps than would be predicted from the static tuning function), indicative of gain control at a timescale of tens of milliseconds. At the other temporal extreme, regulation of afterdischarge rates reflects firing rates averaged over both (origin and target) steady-state intervals of the periodic stimulus, suggesting the simultaneous operation of an adaptive mechanism acting on a timescale of seconds.
Because worst IPDs suppress responses below the spontaneous rates in many neurons, inhibition also clearly plays an important role in shaping cortical IPD sensitivity. Consequently, adaptation of inhibition likely contributes to dynamic conditioning in the cortex and elsewhere (Sanes et al., 1998). Although computational models of IPD processing based exclusively on adaptation of excitation successfully replicate some aspects of conditioned responses to triangular modulations of IPD (Cai et al., 1998), the addition of a post-inhibitory rebound (Borisyuk et al., 2001) was required to capture the full range of conditioning effects in the IC (Spitzer and Semple, 1993), where such effects are far less pronounced. Adaptation of both excitation and inhibition, occurring in the recorded neuron and its afferents, appears necessary to encompass the responses of IC neurons to trapezoidal frequency modulation and tone sequences (Malone and Semple, 2001). In progressively more central neurons, differential adaptation of excitatory and inhibitory afferents at multiple levels of the auditory pathway is likely to engender increasingly complex selectivity for dynamic acoustic signals.
Implications for auditory motion processing
Because conditioning can be elicited by monaural frequency sweeps and steps in the IC (Malone and Semple, 2001), conditioning effects probably reflect a general sensitivity to stimuli that change in time rather than a special sensitivity to auditory signals that move in space. Nevertheless, nonspecific enhancement of temporal rate contrast results in enhanced motion direction selectivity for ecologically realistic motion, given the appropriate distribution of best static IPDs. Given the surprising lability of cortical responses to IPDs on the slopes of the static tuning function, even cells with tuning peaks that lie outside the ecological range could participate actively in the coding of ecological IPDs, increasing the size of the responding population.
Across best frequency, ITD tuning functions in the guinea pig IC are steepest about the midline (McAlpine et al., 2001), where psychophysical performance is also best (Hafter et al., 1975). The steepening of IPD tuning functions would improve the ability of single neurons to signal changes of IPD/ITD with changes in rate (Skottun, 1998). The dramatic shifts in IPD tuning obtained in the current study fundamentally reflect the enhancement of the contrast, in discharge rate, of the representation of changing IPDs: in effect, a transient and local steepening of the tuning function of each neuron within the IPD range spanned by the ongoing stimulus. This effect was demonstrated both during the relatively short (250 msec) 90° IPD sweeps and for long (1 sec) duration steady states separated by them, consistent with adaptive coding of IPD changes at multiple timescales.
Given the magnitude of context-dependent shifts in cortical IPD tuning, how is a veridical representation of sound source location maintained for moving sound sources? The phase lead of responses during the sweeps, relative to responses predicted from the static tuning function, is consistent with the psychophysical observation that the perceived location of moving sound sources is consistently biased in the direction of motion (Perrott and Musicant, 1977, 1981; Mateeff and Hohnsbein, 1988). Nevertheless, the independence of IPD tuning shifts and carrier frequencies is contrary to the speed dependence of such effects. In addition, shifts in azimuth tuning, particularly for low carrier frequencies, are much too large to be straightforwardly related to the “predictive tracking” (Wilson and O'Neill, 1998) observed in human psychophysical studies. Because all cortical cells exhibited context dependencies of roughly similar magnitudes, however, it is possible that the relative representation of IPD could be preserved across cells in the population. The same mechanisms that enhance the discharge rate contrast in the responses of a given neuron across time will also enhance, at any given point in time, the contrast in responses across neurons in the responding population. Thus, although the peak of the population response for a given IPD value occurring in a dynamic context will be displaced from the response peak elicited by the same IPD occurring statically, the enhanced edge of the response profile of the population could effectively identify the instantaneous location of a dynamic sound source.
Footnotes
This work was supported by the W. M. Keck Foundation and by National Institute of Mental Health Grant MH12293.
Correspondence should be addressed to Malcolm N. Semple, 4 Washington Place, Room 809, The Center for Neural Science, New York University, New York, NY 10003. E-mail: mal@cns.nyu.edu.
REFERENCES
- 1.Ahissar M, Ahissar E, Bergman H, Vaadia E. Encoding of sound-source location and movement: activity of single neurons and interactions between adjacent neurons in the monkey auditory cortex. J Neurophysiol. 1992;67:203–215. doi: 10.1152/jn.1992.67.1.203. [DOI] [PubMed] [Google Scholar]
- 2.Albrecht DG, Farrar SB, Hamilton DB. Spatial contrast adaptation characteristics of neurones recorded in the cat's visual cortex. J Physiol (Lond) 1984;347:713–739. doi: 10.1113/jphysiol.1984.sp015092. [DOI] [PMC free article] [PubMed] [Google Scholar]
- 3.Altman JA, Kalmykova Role of the dog's auditory cortex in discrimination of sound signals simulating sound source movement. Hear Res. 1986;24:243–253. doi: 10.1016/0378-5955(86)90023-7. [DOI] [PubMed] [Google Scholar]
- 4.Bonds AB. Temporal dynamics of contrast gain in single cells of the cat striate cortex. Vis Neurosci. 1991;6:239–255. doi: 10.1017/s0952523800006258. [DOI] [PubMed] [Google Scholar]
- 5.Borisyuk A, Semple MN, Rinzel J. Computational model for the dynamic aspects of sound processing in the auditory midbrain. Neurocomputing. 2001;38–40:1127–1134. [Google Scholar]
- 6.Brugge JF, Merzenich MM. Responses of neurons in auditory cortex of the macaque monkey to monaural and binaural stimulation. J Neurophysiol. 1973;36:1138–1158. doi: 10.1152/jn.1973.36.6.1138. [DOI] [PubMed] [Google Scholar]
- 7.Cai H, Carney LH, Colburn HS. A model for binaural response properties of inferior colliculus neurons. I. A model with interaural time difference-sensitive excitatory and inhibitory inputs. J Acoust Soc Am. 1998;103:475–493. doi: 10.1121/1.421100. [DOI] [PubMed] [Google Scholar]
- 8.Carandini M, Ferster D. A tonic hyperpolarization underlying contrast adaptation in cat visual cortex. Science. 1997;276:949–952. doi: 10.1126/science.276.5314.949. [DOI] [PubMed] [Google Scholar]
- 9.Domnitz RH, Colburn HS. Lateral position and interaural discrimination. J Acoust Soc Am. 1977;61:1586–1598. doi: 10.1121/1.381472. [DOI] [PubMed] [Google Scholar]
- 10.Fairhall AL, Lewen GD, Bialek W, de Ruyter Van Steveninck RR. Efficiency and ambiguity in an adaptive neural code. Nature. 2001;412:787–792. doi: 10.1038/35090500. [DOI] [PubMed] [Google Scholar]
- 11.Hackett TA, Stepniewska I, Kaas JH. Subdivisions of auditory cortex and ipsilateral cortical connections of the parabelt auditory cortex in macaque monkeys. J Comp Neurol. 1998;394:475–495. doi: 10.1002/(sici)1096-9861(19980518)394:4<475::aid-cne6>3.0.co;2-z. [DOI] [PubMed] [Google Scholar]
- 12.Hafter ER, De Maio J, Hellman WS. Difference thresholds for interaural delay. J Acoust Soc Am. 1975;57:181–187. doi: 10.1121/1.380412. [DOI] [PubMed] [Google Scholar]
- 13.Hawken MJ, Shapley RM, Grosof DH. Temporal-frequency selectivity in monkey visual cortex. Vis Neurosci. 1996;13:477–492. doi: 10.1017/s0952523800008154. [DOI] [PubMed] [Google Scholar]
- 14.Heffner H. Effect of auditory cortex ablation on localization and discrimination of brief sounds. J Neurophysiol. 1978;41:963–976. doi: 10.1152/jn.1978.41.4.963. [DOI] [PubMed] [Google Scholar]
- 15.Heffner HE. The role of macaque auditory cortex in sound localization. Acta Otolaryngol [Suppl] 1997;532:22–27. doi: 10.3109/00016489709126140. [DOI] [PubMed] [Google Scholar]
- 16.Heffner HE, Heffner RS. Effect of bilateral auditory cortex lesions on sound localization in Japanese macaques. J Neurophysiol. 1990;64:915–931. doi: 10.1152/jn.1990.64.3.915. [DOI] [PubMed] [Google Scholar]
- 17.Ingham NJ, Hart HC, McAlpine D. Spatial receptive fields of inferior colliculus neurons to auditory apparent motion in free field. J Neurophysiol. 2001;85:23–33. doi: 10.1152/jn.2001.85.1.23. [DOI] [PubMed] [Google Scholar]
- 18.Jenkins WM, Merzenich MM. Role of cat primary auditory cortex for sound-localization behavior. J Neurophysiol. 1984;52:819–847. doi: 10.1152/jn.1984.52.5.819. [DOI] [PubMed] [Google Scholar]
- 19.Joris PX, Yin TC. Responses to amplitude-modulated tones in the auditory nerve of the cat. J Acoust Soc Am. 1992;91:215–232. doi: 10.1121/1.402757. [DOI] [PubMed] [Google Scholar]
- 20.Kelly JB. Effects of auditory cortical lesions on sound localization by the rat. J Neurophysiol. 1980;44:1161–1174. doi: 10.1152/jn.1980.44.6.1161. [DOI] [PubMed] [Google Scholar]
- 21.Kelly JB, Kavanagh GL. Effects of auditory cortical lesions on pure-tone sound localization by the albino rat. Behav Neurosci. 1986;100:569–575. doi: 10.1037//0735-7044.100.4.569. [DOI] [PubMed] [Google Scholar]
- 22.Malone BJ, Semple MN. Effects of stimulus context on the response properties of auditory cortical auditory neurons in the alert macaque. Assoc Res Otolaryngol (Abstr) 2000;22:85. [Google Scholar]
- 23.Malone BJ, Semple MN. Effects of auditory stimulus context on the representation of frequency in the gerbil inferior colliculus. J Neurophysiol. 2001;86:1113–1130. doi: 10.1152/jn.2001.86.3.1113. [DOI] [PubMed] [Google Scholar]
- 24.Mateeff S, Hohnsbein J. Dynamic auditory localization: perceived position of a moving sound source. Acta Physiol Pharmacol Bulg. 1988;14:32–38. [PubMed] [Google Scholar]
- 25.McAlpine D, Jiang D, Shackleton TM, Palmer AR. Responses of neurons in the inferior colliculus to dynamic interaural phase cues: evidence for a mechanism of binaural adaptation. J Neurophysiol. 2000;83:1356–1365. doi: 10.1152/jn.2000.83.3.1356. [DOI] [PubMed] [Google Scholar]
- 26.McAlpine D, Jiang D, Palmer AR. A neural code for low-frequency sound localization in mammals. Nat Neurosci. 2001;4:396–401. doi: 10.1038/86049. [DOI] [PubMed] [Google Scholar]
- 27.McKenna TM, Weinberger NM, Diamond DM. Responses of single auditory cortical neurons to tone sequences. Brain Res. 1989;481:142–153. doi: 10.1016/0006-8993(89)90494-0. [DOI] [PubMed] [Google Scholar]
- 28.Miko IJ, Kelly JB, Semple MN. Responses to time-varying interaural phase disparity in the inferior colliculus after transection of the midbrain commissures. Soc Neurosci Abstr. 1999;25:391. [Google Scholar]
- 29.Muller JR, Metha AB, Krauskopf J, Lennie P. Rapid adaptation in visual cortex to the structure of images. Science. 1999;285:1405–1408. doi: 10.1126/science.285.5432.1405. [DOI] [PubMed] [Google Scholar]
- 30.Neff WD, Casseday JH. Effects of unilateral ablation of auditory cortex on monaural cat's ability to localize sound. J Neurophysiol. 1977;40:44–52. doi: 10.1152/jn.1977.40.1.44. [DOI] [PubMed] [Google Scholar]
- 31.Perrott DR, Musicant AD. Minimum auditory movement angle: binaural localization of moving sound sources. J Acoust Soc Am. 1977;62:1463–1466. doi: 10.1121/1.381675. [DOI] [PubMed] [Google Scholar]
- 32.Perrott DR, Musicant AD. Dynamic minimum audible angle: binaural spatial acuity with moving sound sources. J Aud Res. 1981;21:287–295. [PubMed] [Google Scholar]
- 33.Poirier P, Jiang H, Lepore F, Guillemot JP. Positional, directional and speed selectivities in the primary auditory cortex of the cat. Hear Res. 1997;113:1–13. doi: 10.1016/s0378-5955(97)00126-3. [DOI] [PubMed] [Google Scholar]
- 34.Reale RA, Brugge JF. Auditory cortical neurons are sensitive to static and continuously changing interaural phase cues. J Neurophysiol. 1990;64:1247–1260. doi: 10.1152/jn.1990.64.4.1247. [DOI] [PubMed] [Google Scholar]
- 35.Sanchez-Vives MV, Nowak LG, McCormick DA. Cellular mechanisms of long-lasting adaptation in visual cortical neurons in vitro. J Neurosci. 2000a;20:4286–4299. doi: 10.1523/JNEUROSCI.20-11-04286.2000. [DOI] [PMC free article] [PubMed] [Google Scholar]
- 36.Sanchez-Vives MV, Nowak LG, McCormick DA. Membrane mechanisms underlying contrast adaptation in cat area 17 in vivo. J Neurosci. 2000b;20:4267–4285. doi: 10.1523/JNEUROSCI.20-11-04267.2000. [DOI] [PMC free article] [PubMed] [Google Scholar]
- 37.Sanes DH, Malone BJ, Semple MN. Role of synaptic inhibition in processing of dynamic binaural level stimuli. J Neurosci. 1998;18:794–803. doi: 10.1523/JNEUROSCI.18-02-00794.1998. [DOI] [PMC free article] [PubMed] [Google Scholar]
- 38.Scott BH, Malone BJ, Semple MN. Physiological delineation of primary auditory cortex in the alert rhesus macaque. Soc Neurosci Abstr. 2000;26:957. [Google Scholar]
- 39.Skottun BC. Sound localization and neurons. Nature. 1998;393:531. doi: 10.1038/31134. [DOI] [PubMed] [Google Scholar]
- 40.Sovijärvi ARA, Hyvärinen J. Auditory cortical neurons in the cat sensitive to the direction of sound source movement. Brain Res. 1974;73:455–471. doi: 10.1016/0006-8993(74)90669-6. [DOI] [PubMed] [Google Scholar]
- 41.Spezio ML, Keller CH, Marrocco RT, Takahashi TT. Head-related transfer functions of the Rhesus monkey. Hear Res. 2000;144:73–88. doi: 10.1016/s0378-5955(00)00050-2. [DOI] [PubMed] [Google Scholar]
- 42.Spitzer MW, Semple MN. Interaural phase coding in auditory midbrain: influence of dynamic stimulus features. Science. 1991;254:721–724. doi: 10.1126/science.1948053. [DOI] [PubMed] [Google Scholar]
- 43.Spitzer MW, Semple MN. Responses of inferior colliculus neurons to time-varying interaural phase disparity: effects of changing the center of virtual motion. J Neurophysiol. 1993;69:1245–1263. doi: 10.1152/jn.1993.69.4.1245. [DOI] [PubMed] [Google Scholar]
- 44.Spitzer MW, Semple MN. Neurons sensitive to interaural phase disparity in gerbil superior olive: diverse monaural and temporal response properties. J Neurophysiol. 1995;73:1668–1690. doi: 10.1152/jn.1995.73.4.1668. [DOI] [PubMed] [Google Scholar]
- 45.Spitzer MW, Semple MN. Transformation of binaural response properties in the ascending auditory pathway: influence of time-varying interaural phase disparity. J Neurophysiol. 1998;80:3062–3076. doi: 10.1152/jn.1998.80.6.3062. [DOI] [PubMed] [Google Scholar]
- 46.Stumpf E, Toronchuk JM, Cynader MS. Neurons in cat primary auditory cortex sensitive to correlates of auditory motion in three-dimensional space. Exp Brain Res. 1992;88:158–168. doi: 10.1007/BF02259137. [DOI] [PubMed] [Google Scholar]
- 47.Takahashi TT, Keller CH. Simulated motion enhances neuronal selectivity for a sound localization cue in background noise. J Neurosci. 1992;12:4381–4390. doi: 10.1523/JNEUROSCI.12-11-04381.1992. [DOI] [PMC free article] [PubMed] [Google Scholar]
- 48.Toronchuk JM, Stumpf E, Cynader MS. Auditory cortex neurons sensitive to correlates of auditory motion: underlying mechanisms. Exp Brain Res. 1992;88:169–180. doi: 10.1007/BF02259138. [DOI] [PubMed] [Google Scholar]
- 49.Wagner H, Takahashi T. Influence of temporal cues on acoustic motion-direction sensitivity of auditory neurons in the owl. J Neurophysiol. 1992;68:2063–2076. doi: 10.1152/jn.1992.68.6.2063. [DOI] [PubMed] [Google Scholar]
- 50.Wagner H, Trinath T, Kautz D. Influence of stimulus level on acoustic motion-direction sensitivity in barn owl midbrain neurons. J Neurophysiol. 1994;71:1907–1916. doi: 10.1152/jn.1994.71.5.1907. [DOI] [PubMed] [Google Scholar]
- 51.Wightman FL, Kistler DJ. The dominant role of low-frequency interaural time differences in sound localization. J Acoust Soc Am. 1992;91:1648–1661. doi: 10.1121/1.402445. [DOI] [PubMed] [Google Scholar]
- 52.Wilson WW, O'Neill WE. Auditory motion induces directionally dependent receptive field shifts in inferior colliculus neurons. J Neurophysiol. 1998;79:2040–2062. doi: 10.1152/jn.1998.79.4.2040. [DOI] [PubMed] [Google Scholar]
- 53.Yin TC, Kuwada S. Binaural interaction in low-frequency neurons in inferior colliculus of the cat. III. Effects of changing frequency. J Neurophysiol. 1983;50:1020–1042. doi: 10.1152/jn.1983.50.4.1020. [DOI] [PubMed] [Google Scholar]