

Abstract
Sensory systems must operate over a wide range of spatial scales, and single neuron receptive field (RF) organization may contribute to the ability of a neuron to encode information about stimuli having different spatial characteristics. Here we relate the RF organization of sensory neurons to their ability to encode time-varying stimuli, using linear stimulus estimation, measures of information transfer, and more conventional analysis techniques. The electrosensory systems of weakly electric fish are recognized as very tractable model systems for studies of sensory processing because behaviorally relevant stimuli are generated easily and related to known behaviors and because a detailed anatomical database is available to guide the design and interpretation of experiments. Receptive fields of neurons within the first central electrosensory-processing region have an antagonistic center–surround organization; the RF area varies with cell type, with dendritic morphology, and with the spontaneous activity patterns of the cell. Functional consequences of variations in center–surround organization were assessed by comparing responses to two spatial stimulus patterns that mimic naturalistic stimuli and that provide input to the center alone or to the center plus surround. Measures of the quality of stimulus estimation (coding fraction) and information transmission (mutual information) as well as traditional measures of responsiveness consistently demonstrate that, for cells having large surrounds, the activation of both receptive field components degrades the ability to encode time-varying stimuli. The loss of coding efficiency with center–surround stimulation probably results from cancellation of balanced excitatory and inhibitory inputs. However, cells with small surrounds relative to centers perform well under all spatial stimulus regimes.
Keywords: electroreception, electrolocation, electrocommunication, information theory, neural coding, pyramidal cells, stimulus reconstruction, receptive fields
Sensory neuron receptive field properties vary widely and generally are thought to be matched or tuned to the spatial and temporal characteristics of naturalistic stimuli, allowing these to be detected or encoded while limiting responsiveness to patterns that contain little useful information. This work focuses on a population of primary sensory neurons, pyramidal cells, within the electrosensory system of the gymnotiform fish Apteronotus leptorhynchus. The principal goal of these studies was to define the receptive field (RF) characteristics of pyramidal cells and to compare their responses to stimuli applied in a manner mimicking either signals received during communication or prey detection behaviors.
Weakly electric fish generate an electric field around the body via an electric organ and continuously monitor this electric organ discharge (EOD) field with electroreceptors scattered over the body surface (for review, see Turner et al., 1999). Electroreceptors designed to encode the amplitude and the timing of the EOD (Scheich et al., 1973) project somatotopically to the first central electrosensory-processing center, the electrosensory lateral line lobe or ELL, forming three complete maps of the ipsilateral body surface (Heiligenberg and Dye, 1982). These afferents provide monosynaptic excitation and disynaptic inhibition to the two principal ELL efferent neurons, the basilar and nonbasilar pyramidal cells (Maler, 1979; Maler et al., 1981), which also are referred to as E and I cells because they respond to increased EOD amplitude with excitation and inhibition, respectively (Saunders and Bastian, 1984). The ELL receives massive synaptic input from higher electrosensory centers as well (Sas and Maler, 1983, 1987). The pyramidal cells extend elaborate apical dendrites into the ELL molecular layers and receive both excitatory and inhibitory inputs from higher centers. Previous studies demonstrated multiple roles for these descending inputs, including gain control (Bastian, 1986a,b), positive feedback accentuation of stimulus features (for review, see Berman and Maler, 1999), and modulation of RF characteristics, including adaptive (plastic) optimization of common mode rejection (for review, see Bastian, 1999).
Recent studies also have demonstrated variations among ELL pyramidal cells in terms of spontaneous firing properties and responses to simple electrosensory stimuli. These variations are correlated highly with pyramidal cell morphology, particularly apical dendritic structure (Bastian and Courtright, 1991; Bastian and Nguyenkim, 2001). Hence these physiological properties, which are measured easily, allow RF characteristics to be related indirectly to pyramidal cell morphology.
Previous studies already have established that there are significant physiological as well as anatomical differences among pyramidal cells contingent on their locations within the multiple ELL somatotopic maps (Shumway, 1989a,b), and it also has been demonstrated that different maps are required for the correct performance of specific communication behaviors (Metzner and Juranek, 1997). This study focuses on variations among pyramidal cells within maps, with the goal of relating the firing characteristics of the cells and, by inference, cell morphology to receptive field structure. In addition to defining the spatial characteristics of pyramidal cell RFs, the functional consequences of different RF organizations were determined. Responses to stepwise and sinusoidal amplitude modulations (EOD AMs) as well as random patterns of EOD AMs were studied. In conjunction with the latter, stimulus reconstruction techniques (Rieke et al., 1996;Gabbiani and Koch, 1998; Borst and Theunissen, 1999) were used to estimate the ability of pyramidal cells to encode detailed information about the time course of electrosensory stimuli.
Previous investigations using stimulus reconstruction techniques showed that tuberous electroreceptor afferents performed well, encoding from 40 to 80% of the information about stimulus time course (Wessel et al., 1996; Metzner et al., 1998; Kreiman et al., 2000). Pyramidal cells, however, performed poorly, typically encoding <20% of the stimulus (Gabbiani et al., 1996; Metzner et al., 1998; Gabbiani and Metzner, 1999). When the random AMs were applied in a manner that stimulates RF centers and surrounds simultaneously, as is expected for electrocommunication stimuli, we confirmed that a subset of pyramidal cells performs poorly. However, when stimuli were presented preferentially to RF centers, as occurs during electrolocation and tracking of small prey (Nelson and MacIver, 1999), significant improvements in coding performance were seen.
MATERIALS AND METHODS
The weakly electric fish A. leptorhynchus was used exclusively in these studies. Animals were housed in groups of 3–10 in 150 l tanks, temperature was maintained between 26 and 28°C, and water resistivity varied from 2000 to 5000 Ω · cm. Experiments were performed in a 39 × 44 × 12 cm deep Plexiglas aquarium with water recirculated from the animal's home tank. Animals were respirated artificially with a continuous flow of aquarium water at a rate of 10 ml/min. Surgical techniques were the same as described previously (Bastian, 1996a,b), and all procedures were in accordance with the University of Oklahoma animal care and use guidelines.
Recording and stimulation. Extracellular single-unit recordings were made with metal-filled micropipettes constructed as described by Frank and Becker (1964). Recording sites determined from surface landmarks and recording depths were limited to the lateral and centrolateral ELL segments; pyramidal cells were identified on the basis of recording depth and previously established firing characteristics (Saunders and Bastian, 1984; Bastian and Courtright, 1991). The EOD waveform was measured via silver–silver chloride wire electrodes positioned near the animal's head and tail (Fig.1E1, E2). The neural signals and the head-to-tail EOD waveforms were amplified with World Precision Instruments (Sarasota, FL) DAM50 preamplifiers with a gain of 1000 and filters set at 300 Hz and 3 kHz. Spikes and EOD waveform zero crossings were detected with window discriminators, and their times of occurrence were measured with Cambridge Electronic Design (Cambridge, UK) 1401plus hardware and SpikeII software (resolution, 0.1 msec). The EOD waveform also was measured with a small dipole pair of silver–silver chloride electrodes separated by 2 mm, oriented perpendicular to the animal's skin, and positioned within the receptive field of each cell. This dipole was used to measure the changes in the local EOD amplitude resulting from the various stimuli. This “local EOD” was amplified with a World Precision Instruments DAM50 preamplifier (gain of 10,000; filters at 300 Hz and 3 kHz) and analog-to-digital converted with 10 kHz sampling rate.
Fig. 1.

Stimulus generation. A, Electrodes E1 and E2 near the animal's head and tail measured the normal electric organ discharge waveform,H-T EOD, and a sinusoidal Stimulus waveform was synchronized to the zero crossings of theH-T EOD (dotted lines). The stimulus waveform was presented to the animal with two different geometries. With global geometry the stimuli were applied via electrodesG1 and G2, resulting in relatively homogeneous stimulation of the body surface. With local geometry a stimulus dipole applied the stimulus to localized regions of the body surface. B, C, Period histograms of the responses of a p-receptor afferent to sinusoidal amplitude-modulated stimuli showing that, with correct calibration, global and local stimuli result in similar electroreceptor afferent responses.
The electric organ of Apteronotus consists of modified motoneurons; hence it remains intact during the neuromuscular blockade used in these experiments. Therefore, the spontaneous firing patterns that are described refer to activity in the presence of the animal's normal EOD but in the absence of any EOD modulations. Electrosensory stimuli consisted of amplitude modulations of the normal EOD produced by applying a train of sinusoidal waveforms to the fish. Each sinusoid was triggered at the zero crossing of each EOD cycle (Fig.1A, dashed lines) and had a period slightly less than that of the EOD waveform; hence the train remained synchronized to the animal's discharge and, depending on its polarity, either added to or subtracted from the animal's own discharge. To generate EOD AMs having different time courses, we multiplied (MT3 multiplier; Tucker-Davis Technologies, Gainesville, FL) the train of sinusoids by a square pulse (500 msec duration) to produce stepwise AMs, a DC offset sine wave to generate sinusoidal AMs, or band-limited white noise to generate random AMs. The resulting signal was isolated from ground (World Precision Instruments A395 linear stimulus isolator), passed through a step attenuator for controlling amplitude, and then applied to the animal with either of two different geometries.
With global geometry the stimulus was applied to the tank via silver–silver chloride electrodes ∼19 cm lateral to either side of the fish (Fig. 1, G1, G2). This stimulus produced a relatively homogeneous change in EOD amplitude over the body surface both ipsilateral and contralateral to the ELL-recorded from. The amplitude of this field was set to 1.0 mV/cm without the fish in place, and this gradient served as the reference stimulus level (0 dB). The typical global stimulus amplitude that was used to characterize cells was −12 dB or ∼250 μV/cm. With the second geometry, referred to as local geometry, the stimulus signals were generated as described above but delivered via a small stimulus dipole made from 76 μm stainless steel wires insulated except for their tips and with a tip spacing of 2 mm (Fig. 1A, stimulus dipole). This dipole, which exclusively activates small ipsilateral populations of electroreceptors, was carried by a computer-controlled three-axis positioning device that allowed for accurate placement of the stimulus dipole at any selected site on, or lateral to, the skin surface.
A principal goal of these studies was to compare pyramidal cell responses to stimuli applied with global geometry and with stimuli applied only to the subregions of the receptive field of a cell (local geometry). P-type electroreceptor afferents were used as the measuring devices to calibrate the effectiveness of different stimulation geometries. The local dipole typically was positioned 2–3 mm lateral to the animal's skin; at this distance dipole currents ranging from 100 to 250 nA, depending on water resistivity, resulted in receptor responses equivalent to those caused by the typical global stimulus of 250 μV/cm. Setting the product of dipole current and water resistivity to 5 × 10⁻⁴ V · cm resulted in a good match between global and local dipole stimuli; Figure 1B,C shows phase histograms of the responses of a p-receptor afferent to global and local stimuli of −12 dB, respectively. Calibration experiments were done for 25 receptor afferents in three fish. Receptor afferent locations spanned both the dorsoventral and rostrocaudal extent of the middle two-thirds of the body, which corresponded to the region containing the RFs of the pyramidal cells that were studied. Responses were measured as vector strengths of the phase histograms (see Data analysis). These averaged 0.074 ± 0.005 and 0.07 ± 0.005 (p = 0.55; Student's t test) for global and local stimulus geometries, respectively.
Data analysis. At the start of each experiment the fish was photographed from its lateral aspect; the outline of the fish was digitized, scaled to its original size, and imported to MATLAB (The MathWorks, Natick, MA). This image, along with the coordinates at which the stimuli were applied, allowed for accurate reconstruction of the spatial aspects of receptive fields. Records of spike times, times of EOD zero crossings, times of stimulus presentation, and peak-to-peak values of each successive EOD cycle, measured within the RF of a cell, were exported from SpikeII as text files for subsequent analysis with MATLAB. Pyramidal cell baseline firing frequencies and their tendencies to produce short bursts of spikes were determined from activity in the presence of the normal electric organ discharge. Pyramidal cells were categorized as bursty or nonbursty, depending on whether or not they produced clusters of spikes with short interspike intervals at rates above those expected for a Poisson spike train of the same mean frequency (Bastian and Nguyenkim, 2001). Responses to stepwise AMs were accumulated as peri-stimulus time histograms (PSTHs) and quantified as mean increases in firing frequency above baseline rates. Responses to sinusoidal AMs were accumulated as period histograms, and responses were quantified as the vector strength or mean vector length (Batschelet, 1981; Mardia and Jupp, 1999). This measure ranges from 0, when there is no phase relationship between the stimulus and response, to 1 with perfect phase locking.
Responses to random AMs were used to assess the ability of pyramidal cells to encode detailed information about the time course of electrosensory stimuli presented with global and local geometries. Random AMs were generated by multiplying the stimulus waveform by a noise signal generated with a WG1 waveform generator (Tucker-Davis Technologies). Before multiplication, the noise signal was low-pass-filtered (model 3382 eight-pole Butterworth filter; Krohn-Hite, Avon, MA) with a cutoff frequency (fc) typically equal to 10 Hz. Then this signal with SD ς was applied to the fish as described above. Linear stimulus estimation techniques (Rieke et al., 1996) have been used previously to determine the accuracy with which electroreceptor afferents (Wessel et al., 1996; Kreiman et al., 2000) as well as pyramidal cells (Gabbiani et al., 1996; Metzner et al., 1998; Gabbiani and Metzner, 1999) encode time-varying stimuli presented with a geometry similar to the global geometry described above. These techniques, described in detail by Gabbiani and Koch (1998) andGabbiani and Metzner (1999), also were used in this study. Records of spike times and peak-to-peak (p-p) amplitude of the EOD recorded within the RF of the cell under study were imported to MATLAB and resampled at 2 kHz. Because the p-p amplitude of the EOD was measured from successive EOD cycles, the original sampling frequency for this signal is equal to a given fish's EOD frequency, which ranges from 600 to ∼900 Hz. Resampling of the p-p EOD records to the higher frequency was done by spline interpolation, and then the resampled record was low-pass-filtered to remove any residual high-frequency noise.
The Wiener–Kolmogorov filter that minimized the mean square error ε2 between the stimulus and the reconstructed stimulus was computed from the resampled spike train and EOD amplitude data as described by Gabbiani and Koch (1998). The estimate of the original stimulus was obtained by convolution of the spike train with this filter. The accuracy of the reconstruction was quantified as the coding fraction (γ = 1−ε/ς), which ranges from 0 for the case in which the estimate is no better than that expected by chance to 1, where the estimate perfectly replicates the stimulus. Stimulus estimation and coding fractions were calculated with MATLAB algorithms described by Gabbiani and Koch (1998) and available at: http://www.klab.caltech.edu/∼gabbiani/signproc.html.
In addition to coding fraction, a lower bound on the rate of mutual information rate in bits per second (I) conveyed by the spike train was determined as:
(Borst and Theunissen, 1999), whereSNR(f) is the signal-to-noise ratio computed at frequency f. It is given by:
wherePss(f) andPnn(f) are the power spectra of the stimulus and spike train, respectively, andPsn(f) is the cross-spectrum between the stimulus and the spike train (Gabbiani, 1996; Rieke et al., 1996). Mutual information rate in bits per spike was calculated by dividing I by the firing rate of the cell during the stimulation. Means are given as ±1 SE.
RESULTS
ELL pyramidal cell receptive fields
Pyramidal cell receptive fields were mapped by positioning a small stimulus dipole 0.5–1 mm lateral to the fish at various rostrocaudal and dorsoventral coordinates. The stimulus dipole delivered a sinusoidally amplitude-modulated mimic of the animal's discharge that, on the basis of electroreceptor afferent recordings, altered afferent firing frequencies within a circular area having a radius of between 2 and 3 mm. Responses to this stimulus were summarized as phase histograms, as shown in Figure2A. When recording from E cells (basilar pyramidal cells), we set the polarity of the stimulus so that peak excitation occurred at the origin of the histogram, as shown by the waveform below Figure 2A. Stimulus polarity was inverted for I cells (nonbasilar pyramidal cells).
Fig. 2.

Basilar pyramidal cell (E cell) receptive field center mapped by defining the RF center boundaries. A, Period histogram of the responses of the cell to sinusoidal AM (200 cycles) presented locally near the RF center. Thez-values are Rayleigh statistics, and values ≥ 4.5 indicate significant phase modulation (papproximately ≤ 0.01). B, Period histogram typical of responses at the RF center boundary. Open circlesindicate sites defining the best-fit elliptical area (176 mm2) estimating the RF center. C, Period histogram typical of responses 2 mm beyond the RF center boundary (filled circles). D–K, Responses at sites within the antagonistic surround. L, M, Responses at sites outside the antagonistic surround.
The boundary of the RF center of a given cell was determined by identifying from 6 to 14 locations at which phase histograms of the responses of the cell were similar to responses from the RF center (compare Fig. 2A,B) but showed obvious phase shifts with 1–2 mm changes in the dorsoventral or rostrocaudal direction (compare Fig. 2B,C). Phase shifts seen because of moving the stimulus across the RF boundary averaged 98.6 ± 9.2° (n = 31 measurement pairs from 14 cells). Then receptive field center outlines were estimated by determining the least-squares best-fit ellipse to these locations. An example of a RF center estimated in this manner is shown by the gray area along with the eight loci used for the estimation (Fig. 2, white circles). No RF centers had borders extending to the contralateral side of the body. At locations more distant from the RF center the responses of the cell completely reversed polarity, as expected for stimuli applied to the antagonistic surround (Fig.2D); the regions of the body surface at which these “surround responses” could be evoked were, in some cells, surprisingly large (Fig. 2E-K). All ipsilateral locations tested within ∼2.5–3 cm from the center boundary of this cell gave surround responses. It was not determined whether the surrounds of pyramidal cells extended to the contralateral side of the body. The Rayleigh statistic (z) was used to determine whether the stimulus caused significant modulation of the activity of the cell; these are indicated for each histogram, and values >4.5 (p ≤ 0.01) were taken to indicate significant responses. Only when the stimulus dipole was moved greater than ∼3 cm from the nearest RF center boundary did the cell cease responding to the EOD AM (Fig. 2L,M).
Pyramidal cell receptive field center areas were found to vary with pyramidal cell type, E (basilar) versus I (nonbasilar), as well as with characteristics of the spontaneous firing patterns of the cells. Cells were characterized as either bursty or nonbursty, depending on whether or not autocorrelations of their spontaneous activity differed significantly from that expected for a Poisson spike train and, as described previously (Bastian and Nguyenkim, 2001), the majority of both E and I cells had bursty firing patterns. Of the sample of 33 cells for which RF center maps were produced, 27 had relatively low spontaneous rates and bursty firing patterns (Fig.3A,B). Receptive field center areas were estimated from the best-fit ellipse for each cell; the mean areas for the different cell types are shown in Figure 3C. Among the bursty cells, mean center areas were significantly larger for the E cells compared with the I cells, averaging 192 ± 21 and 142 ± 11 mm2, respectively (p = 0.05; t test). The high-frequency nonbursty pyramidal cells were seen less frequently (6 of 33 cells), and the average RF center area was intermediate between that of the bursty E and I cells (Fig. 3C). Although the mean area of the RF centers of nonbursty cells was not significantly different from that of the bursty E or I cells, the shapes of the centers did differ. The ratio of the major to minor axis of the best-fit ellipse was calculated for each cell; these averaged 2.99 ± 0.22 and 1.89 ± 0.21 for bursty and nonbursty cells, respectively (p < 0.002; t test). Hence the RF centers of bursty cells are more elongate in the rostrocaudal direction and flattened in the dorsoventral direction compared with those of the nonbursty cells. Overall, the major axes of the best-fit ellipses were well aligned with the long axis of the fish. The orientation of the major axes varied over a range of 10 to −21° relative to a line running from the tip of the snout through the center of the tail (mean deviation, −1.65 ± 6.01°).
Fig. 3.

Summary of pyramidal cell RF center areas determined by mapping center–surround boundaries. A, Mean spontaneous firing frequencies of bursty E cells (E), bursty I cells (I), and nonbursty (NB) E and I pyramidal cells. B, Mean burst indices (percentage of bursts unexpected, given a Poisson spike train) of E and I cells; by definition, NB cells have burst indices of zero. C, Mean RF areas for E, I, and nonbursty cells. Error bars = ±1 SEM.D, Scatter plot illustrating the correlations among pyramidal cell RF center area, spontaneous firing rate, and burst indices. Filled circles and squaresindicate E and I cells; open circles andsquares indicate nonbursty E and I cells, respectively.
It was shown previously that spontaneous firing characteristics of pyramidal cells are correlated with the morphology of a cell, especially the size of the apical dendrite arbor (Bastian and Courtright, 1991; Bastian and Nguyenkim, 2001). The lowest-frequency bursty cells are found most superficially within the ELL pyramidal cell layer, and these cells have the most extensive apical dendrites. Cells with higher spontaneous rates are less bursty, found deeper within the pyramidal cell layer, and have smaller dendritic arbors. The highest-frequency cells, which are typically nonbursty, have the smallest dendritic arbors, and these comprise a distinct morphological category termed deep basilar pyramidal cells. Receptive field center areas of bursty E and I cells are plotted against spontaneous firing rate and burst indices in Figure 3D (filled circles and squares, respectively). Areas were correlated negatively with the spontaneous firing rates of the cells (r = −0.51; p = 0.007) and correlated positively with their tendency to fire bursts of spikes (r = 0.41; p = 0.035). Hence those cells with low spontaneous firing frequencies and high burst indices had the largest RF centers. The nonbursty cells differed, having larger RF center areas than the highest-frequency bursty cells (Fig.3D, open symbols). Given the relationships between spontaneous firing characteristics and cell morphology, this result suggests that RF center areas also may be related to the morphologies of the cells.
Estimation of antagonistic surround areas
As shown in Figure 2, extensive areas of the body surface apparently contribute to the RF antagonistic surround of pyramidal cells. The large size of these surrounds precluded efficient determination of their area by directly searching for boundaries as described above. As an alternative, the stimulation dipole was positioned sequentially at 55 sites, each separated by 1 cm over a grid extending 10 cm in the rostrocaudal and 4 cm in the dorsoventral directions. The distance of the stimulus dipole lateral to the fish ranged from a minimum of ∼2 to a maximum of ∼5 mm because of the curved surface of the animal. Increasing the lateral distance between the surface of the fish and the stimulus dipole is expected to increase the area of skin stimulated by the dipole, and receptor afferent recordings showed that at a lateral distance of 3 mm the standard dipole stimulus altered afferent firing frequencies within a circular area having a radius of ∼5 mm.
At the RF center of each cell and at each of the 55 stimulation sites, responses to 20 sec presentations of a 4 Hz sinusoidal EOD AM were summarized as phase histograms, and the direction of the mean vector and the Rayleigh statistic (z-value) were computed for each histogram. The mean vector direction determined from stimulation within the RF center was taken as a reference direction. The directions of the mean vectors determined at each of the remaining stimulation sites were compared with the reference direction, and the z-values for those that differed by more than ±90° were given a negative value. Thus Rayleigh statistics from stimulation sites within the RF center remain positive, whereas those obtained from sites in the surround region are negative. Then the two-dimensional array ofz-values was interpolated to 1-mm-grid spacing (two-dimensional linear interpolation) for improved visualization and displayed as a surface superimposed on the outline of the fish, with regions of different colors indicating different z-values. The numbers of spikes within each phase histogram ranged between ∼80 and 400, depending on the firing rate of a given cell; for this range of spike counts z-values >4.5 indicate significant phase coupling to the EOD AM (p < 0.01). Therefore, ±4.5 was taken as the z-value limits to identify areas within which the dipole stimulus caused significant changes in the firing pattern of a cell.
Figure 4, A and B, shows RF maps for mid-frequency E and I cells recorded from neighboring ELL regions of the same fish. The red region of Figure4A indicates the area within which the stimulus caused significant responses in-phase with stimuli applied to the RF center, and the blue areas within the inner and outer white contour lines show the areas within which the cell gave significant out-of-phase responses (estimated surround areas). The color map for the I cell, Figure 4B, was inverted to emphasize that the cell responded to falling EOD amplitude applied to its RF center. For comparison, the RF centers also were outlined via the technique described in conjunction with Figure 2, and these are shown by the white ellipses along with the stimulation sites to which the ellipses were fit (Fig. 4B, filled circles). The increase in RF size seen when the mapping is done with the stimulus dipole further lateral to the fish is expected, given that the effective area of the stimulus expands with increasing distance of the dipole lateral to the fish, and this effective area is shown by the gray circle above the distance calibration. Although the majority of cells had antagonistic surrounds as large or larger than their centers, some of the highest-frequency and nonbursty cells had very small surrounds. Figure 4, C and D, shows the RF maps obtained from a nonbursty E cell (27 spikes/sec spontaneous rate), using the standard stimulus strength as well as a stimulus 6 dB greater in amplitude. Receptive field center areas were comparable with that of the E cell of Figure 3A, but essentially no antagonistic surround was seen with the standard stimulus. Increasing stimulus strength by a factor of 2 recruited only small increases in the surround area.
Fig. 4.
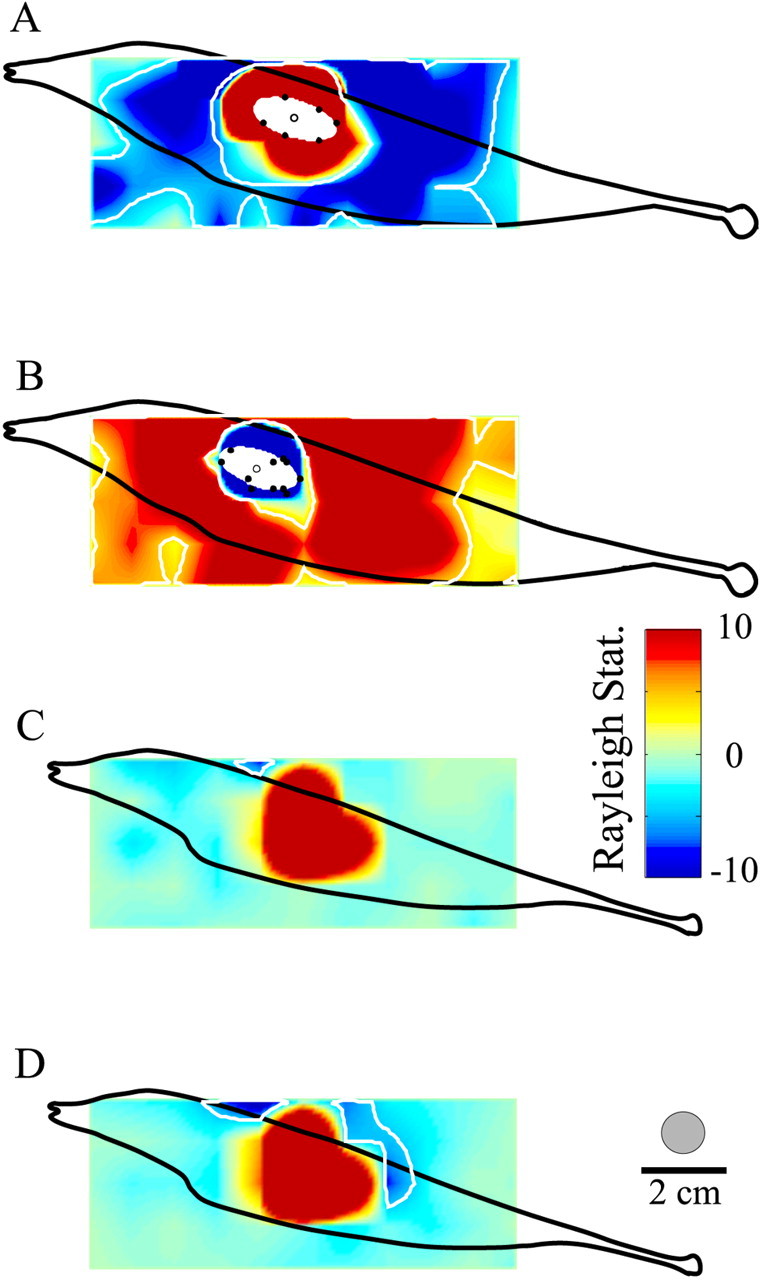
Pyramidal cell receptive field maps based on responses to sinusoidal AMs presented over an array of grid points.A, An E cell (18.8 sp/sec spontaneous rate; RF center area, 629 mm2; surround area, 3295 mm2). Whiteellipseshows RF center area (138 mm2) mapped as the best-fit ellipse to boundary points shown as black circles. B, An RF map for an 18.6 sp/sec I cell recorded from the same animal; center and surround areas, 296 and 3416 mm2, respectively. RF center areas determined from boundary points, 124.8 mm2. C, D, RF maps for a 27 sp/sec nonbursty E cell mapped with the standard stimulus intensity and with a 6 dB (∼2×) increase in amplitude, respectively. RF center and surround areas, 560 and 17 mm2, respectively, for the standard dipole stimulus; areas were increased to 591 and 227 mm2, respectively, with the stronger stimulus. Color maps were set to saturate at z-values of ±10. The gray circle indicates the spatial extent of the above-threshold stimulus attributable to the standard stimulus intensity determined from p-receptor afferent recordings.
The relative sizes of RF centers and antagonistic surrounds mapped in this manner varied with pyramidal cell type (E, I, or nonbursty, NB) and with the spontaneous firing rates of the cells. Figure5A–C summarizes RF dimensions for a population of 10 E cells, 11 I cells, and 7 NB cells. The average firing frequencies for the E and I cells did not differ, but as described above, the nonbursty cells have significantly higher spontaneous rates (Fig. 5A). As was found by using the perimeter-mapping technique, the RF centers of E cells are significantly larger than those of the I cells, whereas the RF centers of the NB cells are of intermediate size (Fig. 5B). The dimensions of RF antagonistic surrounds varied oppositely; the mean surround area of I cells was approximately threefold greater than that of either the E cells or the nonbursty cells (Fig. 5C).
Fig. 5.

Summary of RF dimensions mapped with dipole stimulus positioned over an array of grid points.A, Mean spontaneous firing rates of the sample of E cells (E), I cells (I), and nonbursty (NB) E and I cells selected for similar local EOD modulation.B, Mean RF center areas; E cell and NB cell RF center areas > mean I cell center area; p < 0.02; one-way ANOVA and Tukey–Kramer multiple comparison tests.C, Mean RF surround areas; I cell RF surround area > E and NB cell RF surrounds; p < 0.02; one-way ANOVA and Tukey–Kramer multiple comparisons. Error bars = ±1 SEM.D, E, Summaries of RF center and surround areas, respectively, of cells having different spontaneous firing rates (correlation coefficients: D, r = 0.143, p = 0.39; E,r = −0.51, p = 0.001).Filled circles and squares indicate E and I cells, respectively; open circles andsquares indicate nonbursty E and I cells.
Although a standard stimulus strength was used for these RF mapping experiments, the relative change in local EOD amplitude caused by the stimulus did vary. This variation occurs not only because the EOD amplitudes of individual fish are usually different but also because local EOD amplitudes measured at different sites on the body surface vary (Bastian, 1981a; Rasnow and Bower, 1996). The cells described in Figure 5A–C represent a subset of the total sample that was studied. These data were selected to insure that the local EOD modulations measured within the RF center were within the same range (25–75%) and that the mean modulation did not vary significantly between the E and I cell samples. The mean local EOD modulations averaged 51 ± 6.5 and 43 ± 3.2% (p> 0.27; t test) for the E and I cells, respectively. The mean local EOD modulation for the nonbursty cells was higher, 82 ± 21%, because in several cases stronger stimuli were used in an attempt to reveal potentially higher threshold surround regions. Analysis of the total populations of 18 E, 13 I, and 7 NB cells and ignoring differences in local EOD modulation revealed the same pattern of significant differences in RF dimensions as summarized in Figure5A–C.
Figure 5D shows that the dimensions of RF centers mapped with this technique are independent of the spontaneous firing frequency of the cells. That the negative correlation between RF center area and spontaneous rate seen with the perimeter mapping technique of Figures 2and 3 was not reproduced in these data may reflect the lower resolution of this latter technique. Antagonistic surround areas, however, were related to the spontaneous firing rate of the cells (Fig.5E) and also to the burst indices of the cells (data not shown). The correlation coefficient relating the log of surround areas of all cells that were studied and their spontaneous rates was −0.51 (n = 38; p = 0.001), but this correlation is primarily attributable to the relationship between the spontaneous frequency and surround dimensions of the E cells (Fig.5E, filled and open circles). Removal of the I cells (Fig. 5E, filled squares) from this analysis had minimal effects on this correlation (r = −0.5 for E cells alone), and analysis of the I cells separately revealed no correlation between their spontaneous rate and surround dimensions.
The uniformly large antagonistic surrounds of the I cells as well as the variable surround areas of the E cells may be explained, at least in part, by differences in the ELL interneuronal circuitry. The center response of the I cells (reduced firing frequency) results from receptor afferent activation of inhibitory interneurons located immediately ventral to a given I cell via axons of these inhibitory interneurons. The surround response (increased firing frequency) results from gap junction inputs from dendrites of the same class of interneurons. The interneurons responsible for the surround are, however, located at greater distances from a given I cell. The large size of the I cell surrounds may result from the fact that these dendritic processes ramify over long distances (>100 μm) and thus represent receptor afferents distant from the RF center. In addition, the interneurons also make gap junction contacts among themselves, allowing receptor afferents from large regions of the body to contribute to the surround of a given cell (Maler, 1979; Maler et al., 1981; Mathieson et al., 1987).
The more heterogeneous sizes of antagonistic surrounds of E cells may result from the variability in their position within the ELL lamina. The deep basilar pyramidal cells, which have high firing frequencies and small antagonistic surrounds, are found below the ELL laminae within which most inhibitory interneuronal synapses occur (Maler et al., 1981; Bastian and Courtright, 1991; Maler and Mugnaini, 1994). Hence both their high firing frequencies and small antagonistic surrounds may be, at least in part, attributable to reduced inhibitory interneuronal input.
Functional consequences of receptive field organization: responses to stepwise AMs
The functional significance of the variation in relative sizes of pyramidal cell RF centers and surrounds was assessed by comparing responses of an individual cell to stimuli of the same effective amplitudes, as judged by receptor afferent recordings, but presented with different geometries. Global stimulus geometry results in simultaneous activation of receptor afferents over most of the body surface and therefore provides approximately equivalent input to the center and surround simultaneously. Stimuli presented via the local dipole, however, activate areas smaller than the typical RF center; hence with local geometry the RF center can be stimulated without activating the surround. These two stimulus geometries mimic spatial aspects of electrosensory stimuli that normally are experienced by the fish under natural conditions. Electrocommunication signals generated by one animal and received by another result in spatially extensive activation of receptor afferents similar to the effects of globally presented stimuli. Electrolocation stimuli, especially those generated by small electrolocation targets, cause spatially restricted receptor afferent activation as results from the local stimulus geometry. Hence differences in pyramidal cell responses to these two categories of stimuli also may indicate differential processing of communication versus electrolocation stimuli.
Examples of nonbursty high-frequency (27 sp/sec) and bursty low-frequency (12 sp/sec) E cell responses to stepwise local increases in EOD amplitude (−12 dB) are summarized in the PSTHs of Figure6, A and B, respectively. Both cells responded with large initial increases in firing frequency, which adapted rapidly. The mean increases in firing frequency above background rates, measured over the 500 msec stimulus duration, were similar (25 sp/sec). Presenting the stimulus with the global geometry, which causes RF centers and antagonistic surrounds to receive the same change in EOD amplitude, had opposite effects on the responses of these cells. The mean response of the high-frequency cell was approximately doubled from 25 to 66 sp/sec, whereas that of the low-frequency cell was reduced from 25 to 9 sp/sec (Fig.6C,D, respectively). These opposite signed changes in response contingent on stimulus geometry were maintained over a wide range of stimulus intensities, as shown in Figure 6E. For the high-frequency cell, global stimuli always evoked stronger responses than the equivalent local stimulus (Fig.6E, open and filled circles, respectively). The opposite pattern is characteristic of low-frequency cells; global stimuli typically evoke weaker responses compared with the local stimuli (Fig. 6E, open andfilled triangles, respectively).
Fig. 6.
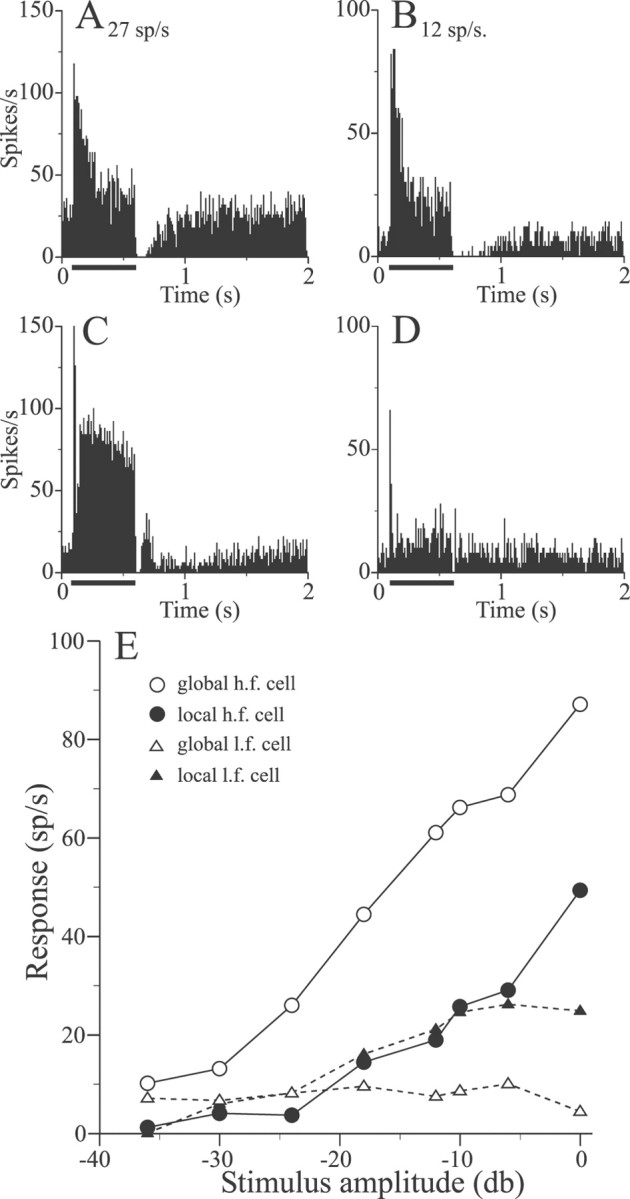
Responses of pyramidal cells to stepwise electric organ discharge (EOD) AMs. A, B, Responses of a high- and low-frequency E cell to −12 dB stepwise increases in EOD AM presented with local geometry. C, D, Responses of the cells of A and B to global presentation of stepwise AMs. E, Responses of the cells ofA and B to local and global EOD AMs of various amplitudes.
The effects of changing stimulus geometry on the responses of 69 pyramidal cells are summarized in Figure7. The difference between the responses of each cell to local and global geometries is plotted against the spontaneous firing rate of the cells. Low-frequency cells typically show positive response differences, indicating that the local stimulus is the more effective, as shown in the example of Figure6B,D,E.
Fig. 7.

Scatter plot relating differences in responses to local versus global stepwise AMs to the spontaneous firing frequencies of the cells. Filled circles and squaresindicate E and I cells, respectively; open circles andsquares indicate nonbursty E and I cells, respectively.
The negative correlation (r = −0.56; p< 0.001) indicates that cells with higher firing rates are relatively more sensitive to global stimuli, and for cells with spontaneous rates above ∼20 sp/sec the sensitivity to the global geometry exceeds that to the local, resulting in negative response differences. Separate analysis of the bursty E and I cells (Fig. 7, filled circlesand squares, respectively) showed that both types behaved similarly. Seven nonbursty E and three nonbursty I cells also were recorded in this experiment (Fig. 7, open circles andsquares, respectively), and these usually showed negative response differences being more sensitive to global rather than to local stimuli. Response differences also were correlated significantly with measures of the burstiness of the cells, as expected, given the correlation between burstiness and spontaneous rate (data not shown).
The large reductions in the responses of the low-frequency, bursty pyramidal cells seen when stimulus geometry was switched from local to global indicates that the antagonistic surrounds of these cells provide more powerful inhibition compared with that of the higher-frequency cells. The observations that the highest-frequency cells give stronger responses to global stimuli may reflect the fact that local stimuli do not stimulate the entire extent of the RF center of the cell. Switching to global geometry may provide additional input to center without recruiting a strong antagonistic surround.
Responses to sinusoidal AMs
A second set of experiments was performed by using sinusoidal EOD AMs identical to those used in RF-mapping studies. Examples of responses of high- and lower-frequency pyramidal cells to local and global presentation of these stimuli are shown in the phase histograms of Figure 8. As with stepwise AMs, responsiveness of the high- and low-frequency cells changed oppositely, contingent on stimulus geometry; high-frequency cells increased responsiveness with the switch from local to global (Fig.8A,C), whereas low-frequency cells decreased responsiveness (Fig. 8B,D). Furthermore, in many of the low- to medium-frequency cells global sinusoidal AMs evoked no response at all (Fig. 8D) despite the fact that the stimulus was well above threshold for receptor afferents. Responses to sinusoidal AMs were quantified as the mean vector (r) of the phase histogram. Figure 8E summarizes the responses of these two cells to a series of stimulus amplitudes and shows that the response differences resulting from changes in geometry are maintained over a wide range of intensities. In addition, some low-frequency cells that gave statistically significant responses to weaker AMs (less than approximately −20 dB) became unresponsive with increased stimulus amplitude (Fig. 8E, open triangles). This suggests that for some cells the thresholds for RF centers may be lower than that of the surrounds.
Fig. 8.
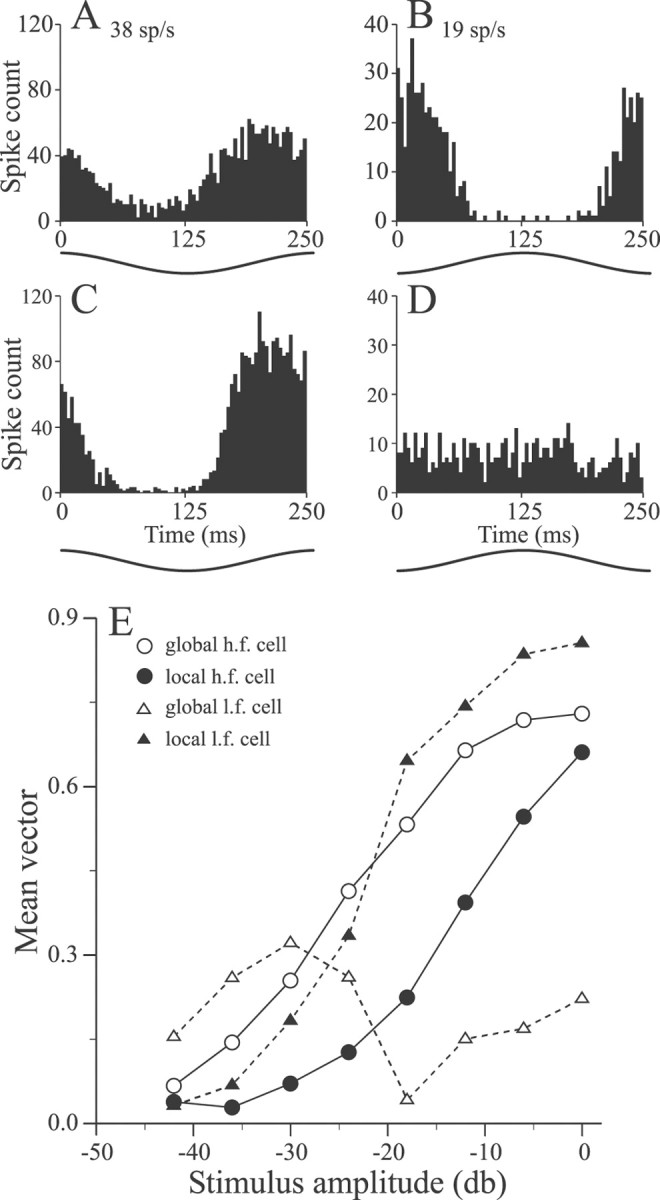
Responses of high- and low-frequency pyramidal cells to 4 Hz sinusoidal EOD AMs. A, B, Period histograms of a high-frequency E cell and low-frequency I cell responses to local stimulation (stimulus amplitude, −12 dB). C, D, Responses of the cells of A andB to −12 dB sinusoidal AMs presented globally.E, Responses of the cells of A andB to sinusoidal AMs of various amplitudes presented with global and local geometries.
The difference in mean vectors for the responses of a given cell to local and global stimuli was used to gauge the effects of changing stimulus geometry; Figure 9 summarizes these mean vector differences for 44 pyramidal cells of various spontaneous firing frequencies. As seen with stepwise EOD AMs, the difference in responsiveness was correlated negatively with the spontaneous rate of the cells (r = −0.77;p < 0.001). The low-frequency cells typically gave stronger responses to local versus global stimuli (positive mean vector difference), whereas the highest-frequency cells behaved oppositely. Separate analyses of E and I cells (Fig. 9, filled circles and squares) showed that these behaved similarly. The nonbursty E and I cells (Fig. 9, open circlesand squares, respectively) either showed small positive mean vector differences, indicating more similar responses to local and global geometries, or negative differences, indicating stronger responses to the global geometry.
Fig. 9.

Scatter plot relating differences in responses (mean vector differences) to local versus global sinusoidal AMs to spontaneous firing frequencies of the cells. Filled circles and squares indicate E and I cells, respectively; open circles and squaresindicate nonbursty E and I cells.
Responses to random AMs: information rates and stimulus estimation
Previous studies of both electroreceptor afferents and ELL pyramidal cells in the related fish Eigenmannia showed that, whereas single receptor afferents performed well as encoders of time-varying stimuli, pyramidal cells performed very poorly (Gabbiani et al., 1996; Metzner et al., 1998; Gabbiani and Metzner, 1999). Stimulus presentation in these previous studies was similar to the global geometry used here in that the RF center and surrounds were activated simultaneously. Given the differences in RF structure seen contingent on pyramidal cell type as well as differences in responses seen with local versus global stimulation, it seemed likely that encoding abilities might vary among pyramidal cells and also might improve with the local stimulus geometry, which more closely resembles stimuli generated by prey.
Random AMs (RAM) were presented with either global or local geometry, and stimulus reconstructions were produced as described in Materials and Methods. The coding fractions (γ) were used to assess the accuracy of the reconstruction of stimuli presented with the two geometries, and the mutual information rates in bits/spike were used to determine whether changes in coding fraction could be accounted for by changes in firing frequency. The RAM bandwidth was within the range of frequencies expected for electrolocation stimuli caused by small prey items, usually 0–10 Hz but occasionally 0–5 Hz (Nelson and MacIver, 1999). Contrast levels (SD of modulated EOD amplitude/mean EOD amplitude measured at the RF center) ranged from 3 to 26%.
Figure 10, A1 andA2, contrasts stimulus reconstructions obtained from a low-frequency (8 sp/sec) E cell with global and local stimulus presentation, respectively. The time course of the EOD amplitude modulation measured in the RF center is shown in gray along with the stimulus estimate (in black). The times of spike occurrence are indicated by the vertical black lines, and the optimal filter used for the reconstruction is shown immediately below the spike trains. Figure10A1 shows that, as found previously (Gabbiani et al., 1996; Metzner et al., 1998; Gabbiani and Metzner, 1999), some pyramidal cells perform very poorly as stimulus encoders when the geometry is global. Significant improvements are seen, however, when the RF center is stimulated alone (Fig. 10A2). The improvement is partly attributable to changes in the optimal filter waveform but also may reflect changes in firing frequency, which increased from 7.3 to 8.3 sp/sec with the application of the local stimulus. However, mutual information rates for the cell of Figure 10,A1 and A2, also increased from 0.06 bits/spike to 0.59 bits/spike with changes from global to local geometry, indicating that increased spike rate is probably a minor contributor to the improved coding fraction. Additionally, an obvious change in the firing pattern of this cell occurred when the geometry was changed to local; spikes showed an increased tendency to occur in clusters or bursts, increasing the spike train coefficient of variation from 1.14 to 1.33. The increased coefficient of variation also suggests that local stimuli are more effective in driving these cells.
Fig. 10.
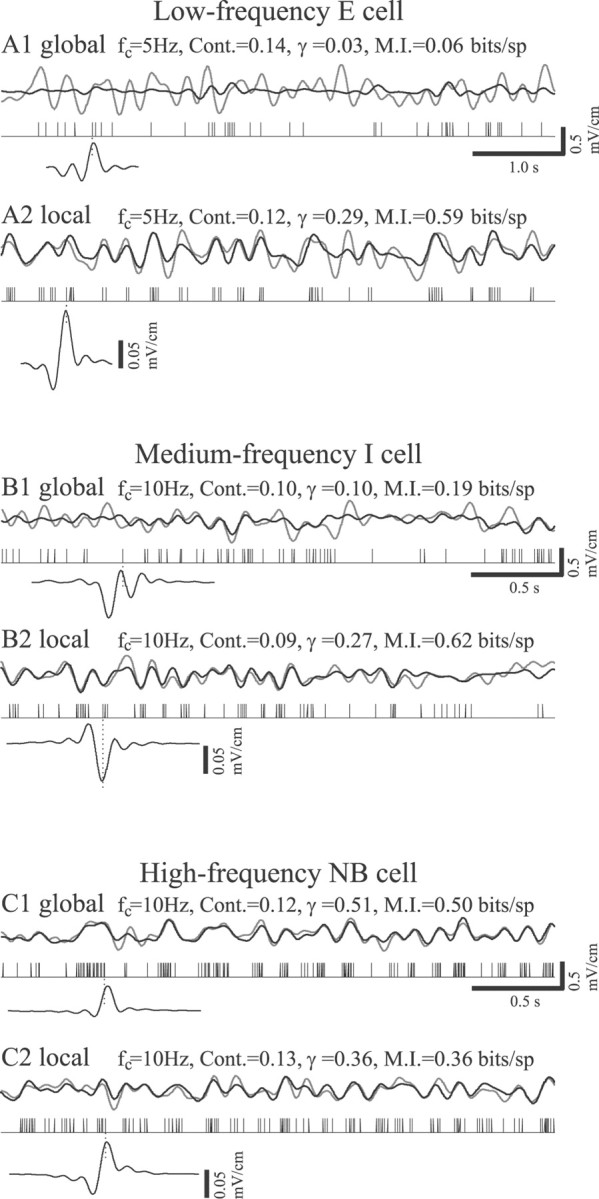
Examples of reconstructions of random EOD amplitude modulations presented with either global or local stimulus geometry. Gray lines, Stimulus waveforms; variations in p-p EOD amplitude were measured within the RF center of the cell.Black lines, Reconstruction waveforms. Vertical lines, Times of spike occurrence. Bottom insets, Optimal filters; alignment to individual spike times is indicated by the vertical dotted line. A1, A2, Global and local stimulation, respectively, of a low-frequency E cell.B1, B2, Global and local stimulation, respectively, of a medium-frequency I cell. C1, C2, Global and local stimulation, respectively, of a high-frequency NB E cell.
Figure 10, B1 and B2, contrasts the responses of a medium-frequency (16.5 sp/sec) I cell to the different stimulus geometries. Again, coding fraction increased substantially with local stimulation. This was accompanied by an increase in spike frequency, from 15.5 to 19 sp/sec, and an increase in mutual information, from 0.19 to 0.48 bits/spike. As in the case of the low-frequency E cell, the improvement in coding fraction was correlated with substantial changes in the optimal filter as well as increased clustering of spikes.
In some cases the highest-frequency pyramidal cells, which also have nonbursty patterns of spontaneous firing, showed opposite changes in coding fraction contingent on stimulus geometry, as is shown by Figure10, C1 and C2. The spontaneous firing rate of the cell was 37.7 sp/sec. Both the coding fraction and the mutual information rate determined from the responses of this cell to global stimuli, 0.51 and 0.50 bits/spike, respectively, were far higher than those typically seen with the lower-frequency cells. Furthermore, switching to local geometry reduced rather than increased the coding fraction and mutual information rate (γ = 0.36,I = 0.36 bits/spike) as well as reducing firing frequency from 44 to 38 sp/sec.
Figure 11 summarizes the stimulus-encoding performance of 11 E, 11 I, and 5 high-frequency nonbursty cells with global (G) and local (L) stimulus geometries. On average, coding fraction and mutual information rates of the low- to medium-frequency E and I cells were significantly greater with local versus global stimulation (Fig. 11A,B,light and dark gray bars). Neither mean firing rates nor stimulus contrast differed significantly among these data (Fig. 11C,D, light and dark gray bars). On average, changing stimulus geometry did not result in significant differences in either mean coding fraction or information rates for the nonbursty cells (Fig. 11A,B,black bars) although, as mentioned above, some nonbursty cells showed reduced rather than increased coding fractions with local stimulation. Although the sample size for nonbursty cells is small (n = 5), the available data suggest that these cells provide the best estimates of stimulus time course independent of stimulus geometry. However, the mutual information per spike is not as high as typically is seen for the lower-frequency cells with local stimulation; hence their high coding fractions must be attributable in large part to their higher firing frequencies (Fig. 11C,black bars).
Fig. 11.

Summary of comparisons of coding fraction and mutual information determined from reconstructions of random AM stimuli presented with global (G) or local (L) geometry. A, Mean coding fractions of both E and I cells are significantly greater for stimuli presented with local geometry (p values ≤ 0.001; t tests), but not different for NB cells (p = 0.76). B, Mean mutual information rates of both E and I cells are significantly greater for stimuli presented with local versus global geometry (p values ≤ 0.004; t tests), but not different for NB cells (p = 0.65). Neither mean spike rates during stimulation (C) nor mean stimulus contrasts (D) varied significantly contingent on stimulus geometry for E, I, or NB cells. Error bars = ±1 SEM.
As seen with stepwise and sinusoidal AM stimulation, the changes in coding fraction and mutual information seen with global versus local stimulation are correlated with the spontaneous activity patterns of the cells. Figure 12Ashows that the coding fraction improvement, measured as local minus global coding fraction, is most striking for the lowest-frequency cells, which are those that also have the largest inhibitory surrounds, as shown in Figure 5E. Coding fractions seen with local stimulation are relatively constant (Fig. 12C), averaging 0.29 ± 0.02 for all of the cells that were studied, and uncorrelated with spontaneous rate. Hence the strong negative correlation of Figure 12A reflects the fact that, with global stimulation, coding fraction is very poor for the lowest-frequency cells but improves for cells having higher spontaneous rates and smaller antagonistic surrounds (Fig. 12E). The changes in mutual information contingent on stimulus geometry show a similar correlation with the spontaneous firing rates of the cells (Fig. 12B). As with coding fraction, the largest improvements contingent on the switch to local stimulation occur for the low-frequency cells, and, as seen with responses to stepwise AMs and sinusoidal AMs, some of the highest-frequency cells show superior performance for global rather than for local stimulation (Fig.12B, points below dashed zero line). The relationships between the spontaneous rate of a cell and mutual information with local and global stimulation are shown in Figure 12, D and F, respectively. As with coding fraction, mutual information per/spike is very poor for low-frequency cells under global stimulation but improves for cells with increased firing rates (Fig. 12F). However, the opposite trend is seen for local stimulation in which there is a significant negative correlation between information rates and the baseline firing frequency of the cells (Fig. 12D). Given the relatively flat relationship between coding fraction and spontaneous rate (Fig.12C), reduced mutual information per spike is expected with increasing firing frequency.
Fig. 12.

Variations of coding fraction and mutual information rates with spontaneous firing rates of the cells. Increases in coding fraction (A) and mutual information rates (B) seen with local versus global stimulation are correlated negatively with the spontaneous firing rates of the cells (A, r = −0.67,p < 0.001; B, r= −0.82, p < 0.001). C, Coding fractions determined from local RF center stimulation are not correlated significantly with spontaneous rate (r = 0.33; p = 0.10). D, Mutual information rates in bits per spike are significantly lower for higher-frequency pyramidal cells (r = −0.55;p = 0.003). E, F, Both coding fraction and mutual information rates increase significantly with increasing pyramidal cell spontaneous rate (E,r = 0.83, p < 0.001;F, r = 0.73, p< 0.001). Filled circles and squaresindicate E and I cells, respectively; open circles andsquares indicate nonbursty E and I cells, respectively.
DISCUSSION
The application of information theory and the methods of statistical signal estimation and detection (Rieke et al., 1996; Borst and Theunissen, 1999; Dayan and Abbott, 2001) have contributed greatly to our understanding of how the size of an RF of a sensory neuron determines its coding properties. For the two-dimensional RFs found in visual, somatosensory, and electrosensory systems the coding for stimulus location is independent of RF size (Abbott and Dayan, 1999;Zhang and Sejnowski, 1999; Lewis and Maler, 2001). However, this independence does not hold for all stimulus attributes; coding for the spread of a stimulus is optimized with smaller RFs, whereas estimates of stimulus intensity are optimized with a large RF size (Lewis and Maler, 2001). These theoretical analyses have assumed a two-dimensional Gaussian RF structure that is a reasonable approximation of the RF centers of pyramidal cells (Fig. 2). It is, however, well documented that RFs of neurons at lower stages of sensory processing have an antagonistic center–surround organization. Under various naturalistic stimulus conditions different parts or all of the RF of a sensory cell are expected to be influenced. The effects of varying the RF components stimulated on the encoding performance of a neuron have yet to be studied in detail.
Here we address the effects of the antagonistic surround of a sensory neuron on its ability to encode time-varying stimulus intensity. As is the case for other senses, the electrosensory system must operate over a wide range of spatial scales. Isolated prey are expected to produce stimuli for which the spatial scale is similar to or smaller than the RF centers measured in this study (Nelson and MacIver, 1999). Electrocommunication signals produce spatially extensive stimuli that will activate ELL pyramidal cell RF centers and surrounds, and, under natural conditions, electric fish will have to encode or detect both local and global sensory inputs. We use both traditional methods of sensory physiology as well as quantitative measures of the quality of stimulus estimation (coding fraction) and information transmission (mutual information). These assays consistently demonstrate that, for the low-frequency cells having relative large surrounds, simultaneous activation of both RF components degrades the ability to encode the time-varying intensity of a stimulus. However, under these global stimulus conditions such cells are known to act as feature detectors (Gabbiani et al., 1996; Metzner et al., 1998; Gabbiani and Metzner, 1999). We show that these low-frequency cells perform much better as encoders of local stimuli and additionally that the highest-frequency cells perform well as encoders under both global and local stimulus conditions. Hence our results demonstrate that different categories of ELL pyramidal cells are capable of stimulus encoding under both stimulus regimes.
Our results confirm and extend those of previous studies of the related fish Eigenmannia, which also determined that many pyramidal cells were very poor encoders of stimuli applied with global geometry (Gabbiani et al., 1996; Metzner et al., 1998; Gabbiani and Metzner, 1999). However, these previous studies did not use input localized to pyramidal cell RF centers; hence improvements in coding fraction contingent on local stimulus geometry could not be detected. In addition, the previous recordings were restricted to the more superficial large pyramidal cells (Metzner et al., 1998); hence the high-frequency deep pyramidal cells could not be studied.
Both the RF mapping data as well as the differences in responsiveness to stepwise and sinusoidal EOD AMs under local and global conditions indicate that the size and effectiveness of antagonistic surrounds are related to the spontaneous firing rate of a cell. Previous studies established relationships between spontaneous activity patterns and pyramidal cell anatomy; specifically, low-frequency cells were found to be located more superficially within the ELL lamina and to have much larger apical dendritic trees (Bastian and Courtright, 1991). Hence it is expected that the low-frequency cells with large surrounds also will be found more superficially within the ELL and have larger apical dendrites. These latter morphological features determine the amount of descending electrosensory feedback that a cell receives as well as their expression of intracellular calcium release channels (Berman and Maler, 1999). It is therefore possible that variations in stimulus-encoding abilities also are related to these morphological and biochemical differences. Because feedback inputs also are known to influence the RFs of ELL pyramidal cells (Bastian, 1986a,b; Shumway and Maler, 1989), we propose that changes in feedback activity may function to optimize the coding efficiency of the pyramidal cell population for electrolocation versus communication signals.
It is well known that ELL pyramidal cells also show significant morphological and physiological differences contingent on which of the three ELL maps within which they reside (Shumway, 1989a,b). Additionally, selective ablation experiments demonstrated that different ELL maps are necessary and sufficient for the production of different EOD modulation behaviors (Metzner and Juranek, 1997), and under global stimulus conditions pyramidal cells, particularly I cells, from the different maps show differential performance in feature detection tasks (Metzner et al., 1998). Hence map-specific cell properties are correlated with the ability to perform specific behaviors. Future studies should include comparisons of stimulus-encoding performance of pyramidal cells having similar firing characteristics from all three ELL maps by using both global and local stimulus geometries. Map-specific stimulus-encoding characteristics may point to ELL subdivisions specialized to process electrolocation signals.
Comparisons with previous studies of RF organization
The receptive field center areas determined in this study are approximately twofold larger than previous estimates of those of a related fish, Apteronotus albifrons. This is probably attributable to methodological rather than species differences. The previous measurements were made with small stimuli moving parallel to the long axis of the fish (Bastian, 1981b). Many pyramidal cells, particularly those with low spontaneous rates, are rapidly adapting and respond only as the moving target crosses the RF boundary. Therefore, RF center areas determined from responses to moving targets not only are underestimated but also show apparent shifts in their location depending on the direction of target movement. A subset of the cells of this study also was mapped with the dipole moving in a pattern similar to that used in previous studies, and, as expected, the phasic nature of the responses of the cells resulted in underestimates of the true extent of the RF centers.
One previous study, of the related fish Eigenmannia virescens, also used stationary patterns of EOD modulation and found RF center areas between ∼45 and 55 mm2 for pyramidal cells from comparable regions of the ELL (Shumway, 1989a). These dimensions compare reasonably well with the mean RF center areas measured forApteronotus, considering that the fish used in the latter study were approximately one-half as large as those used here.
Previous anatomical and physiological studies indicated the presence of pyramidal cell antagonistic surrounds (Maler, 1979; Maler et al., 1981;Bastian, 1981b; Shumway, 1989a,b), but no studies before this have estimated their areas, which can be surprisingly large. Three components of the ELL circuitry likely contribute to these surrounds: intrinsic inhibitory interneurons, monosynaptic and disynaptic inhibitory inputs projecting to the ELL from higher centers, and inhibitory commissural neurons. The anatomy and physiology of these are well described (for review, see Berman and Maler, 1999). Additional studies that use localized pharmacological inactivation of specific pathways are needed to determine the contributions of each to the extensive antagonistic surrounds.
Behavioral considerations
P-type electroreceptor afferents fire at exceptionally high spontaneous rates, 10–20 times higher than ELL pyramidal cells, and information conveyed by these afferent spike trains subserves two categories of behavior: electrocommunication and electrolocation. Electrocommunication signals result when an individual fish senses the discharge of another (or others). The discharges of an individual and conspecifics sum; each fish senses a composite signal that shows a pattern of amplitude modulations or “beats” of a time course depending on the harmonic relationships among the EODs. One or more individuals then typically produce an EOD modulation of a type dictated by the social context. For example, individuals having discharges of similar frequencies may produce jamming avoidance responses, which are slow frequency changes that increase the frequency difference between the EODs. This shifts the AMs caused by the interacting EODs to higher frequencies that do not jam or interfere with electrolocation (for review, see Heiligenberg, 1991). Alternatively, an animal may produce “chirps”: brief rises in EOD frequency seen in agonistic or reproductive situations (Hagedorn, 1986). The jamming avoidance responses as well as all electrocommunication behaviors are similar in that they produce spatially extensive stimuli (global stimulation). It may be that for these behaviors detailed information about the time course of a stimulus is less important than the time of occurrence of specific events; hence feature detection may suffice.
Electrolocation signals, particularly those generated by small aquatic prey, differ in that the region of skin influenced is relatively small (local stimulation). Prey organisms produce electric images ∼1 cm in diameter at the time of detection and, given the relative fish–prey velocity at the time of detection, the bandwidth of this signal is ∼4.5 Hz (Nelson and MacIver, 1999). Images of this dimension are well matched to the RF center sizes seen in this study, and this signal bandwidth is within the range in which the encoding capabilities of the pyramidal cell are maximum. After detection, which often occurs with the prey near the dorsal surface of the animal's trunk, the fish execute a series of swimming movements that bring the prey toward the mouth for capture. Analysis of these movements indicates that the fish tracks the prey's position rather than producing a ballistic strike (MacIver et al., 2001). Detailed information about the time-varying local EOD amplitude resulting from changes in the fish–prey position may be necessary for successful prey-tracking behavior. Although pyramidal cells show improved stimulus-encoding performance for local stimuli, it is not yet understood why coding fractions do not exceed a maximum of ∼0.5. It may be that movement of the local stimulus also is required to reveal the maximum stimulus-encoding ability of the pyramidal cells. Ultimately, experiments focusing on higher order-processing regions will be required to determine how well individual neurons are able to recover information from populations of antecedent cells. Neurons within the optic tectum are particularly attractive candidates for such studies because they not only participate in electrosensory processing (Bastian, 1982) but also are involved in generating motor commands that lead to coordinated swimming movements (Yuthas, 1985).
Footnotes
This research was supported by National Institutes of Health Grant NS12337 (J.B.), by the Natural Sciences and Engineering Research Council (M.J.C.), and by the Canadian Institutes of Health Research (L.M.). We thank Brent Doiron and Dr. André Longtin for helpful discussions.
Correspondence should be addressed to Joseph Bastian, Department of Zoology, University of Oklahoma, 730 Van Vleet Oval, Norman, OK 73019. E-mail: jbastian@ou.edu.
REFERENCES
- 1.Abbott LF, Dayan P. The effect of correlated variability on the accuracy of a population code. Neural Comput. 1999;11:91–101. doi: 10.1162/089976699300016827. [DOI] [PubMed] [Google Scholar]
- 2.Bastian J. Electrolocation. I. How the electroreceptors of Apteronotus albifrons code for moving objects and other electrical stimuli. J Comp Physiol [A] 1981a;144:465–479. [Google Scholar]
- 3.Bastian J. Electrolocation. II. The effects of moving objects and other electrical stimuli on the activities of two categories of posterior lateral line lobe cells in Apteronotus albifrons. J Comp Physiol [A] 1981b;144:481–494. [Google Scholar]
- 4.Bastian J. Vision and electroreception: integration of sensory information in the optic tectum of the weakly electric fish Apteronotus albifrons. J Comp Physiol [A] 1982;147:287–297. [Google Scholar]
- 5.Bastian J. Gain control in the electrosensory system mediated by descending inputs to the electrosensory lateral line lobe. J Neurosci. 1986a;6:553–562. doi: 10.1523/JNEUROSCI.06-02-00553.1986. [DOI] [PMC free article] [PubMed] [Google Scholar]
- 6.Bastian J. Gain control in the electrosensory system: a role for the descending projections to the electrosensory lateral line lobe. J Comp Physiol [A] 1986b;158:505–515. doi: 10.1007/BF00603796. [DOI] [PubMed] [Google Scholar]
- 7.Bastian J. Plasticity in an electrosensory system. I. General features of a dynamic sensory filter. J Neurophysiol. 1996a;76:2483–2496. doi: 10.1152/jn.1996.76.4.2483. [DOI] [PubMed] [Google Scholar]
- 8.Bastian J. Plasticity in an electrosensory system. II. Postsynaptic events associated with a dynamic sensory filter. J Neurophysiol. 1996b;76:2497–2507. doi: 10.1152/jn.1996.76.4.2497. [DOI] [PubMed] [Google Scholar]
- 9.Bastian J. Plasticity of feedback inputs in the apteronotid electrosensory system. J Exp Biol. 1999;202:1327–1337. doi: 10.1242/jeb.202.10.1327. [DOI] [PubMed] [Google Scholar]
- 10.Bastian J, Courtright J. Morphological correlates of pyramidal cell adaptation rate in the electrosensory lateral line lobe of weakly electric fish. J Comp Physiol [A] 1991;168:393–407. doi: 10.1007/BF00199600. [DOI] [PubMed] [Google Scholar]
- 11.Bastian J, Nguyenkim J. Dendritic modulation of burst-like firing in sensory neurons. J Neurophysiol. 2001;85:10–22. doi: 10.1152/jn.2001.85.1.10. [DOI] [PubMed] [Google Scholar]
- 12.Batschelet E. Circular statistics in biology. Academic; New York: 1981. [Google Scholar]
- 13.Berman NJ, Maler L. Neural architecture of the electrosensory lateral line lobe: adaptations for coincidence detection, a sensory searchlight and frequency-dependent adaptive filtering. J Exp Biol. 1999;202:1243–1253. doi: 10.1242/jeb.202.10.1243. [DOI] [PubMed] [Google Scholar]
- 14.Borst A, Theunissen F. Information theory and neural coding. Nat Neurosci. 1999;2:947–957. doi: 10.1038/14731. [DOI] [PubMed] [Google Scholar]
- 15.Dayan P, Abbott LF. Theoretical neuroscience: computational and mathematical modeling of neural systems. MIT; Cambridge, MA: 2001. [Google Scholar]
- 16.Frank K, Becker MC. Physical techniques in biological research, Vol 5, Pt A. Academic; New York: 1964. Microelectrodes for recording and stimulation. pp. 23–84. [Google Scholar]
- 17.Gabbiani F. Coding of time-varying signals in spike trains of linear and half-wave rectifying neurons. Netw Comput Neurol Syst. 1996;7:61–85. doi: 10.1080/0954898X.1996.11978655. [DOI] [PubMed] [Google Scholar]
- 18.Gabbiani F, Koch C. Principles of spike train analysis. In: Koch C, Segev I, editors. Methods in neuronal modeling, 2nd Ed. MIT; Cambridge, MA: 1998. pp. 313–360. [Google Scholar]
- 19.Gabbiani F, Metzner W. Encoding and processing of sensory information in neuronal spike trains. J Exp Biol. 1999;202:1267–1279. doi: 10.1242/jeb.202.10.1267. [DOI] [PubMed] [Google Scholar]
- 20.Gabbiani F, Metzner W, Wessel R, Koch C. From stimulus encoding to feature extraction in weakly electric fish. Nature. 1996;384:564–567. doi: 10.1038/384564a0. [DOI] [PubMed] [Google Scholar]
- 21.Hagedorn M. The ecology, courtship, and mating of gymnotiform electric fish. In: Bullock TH, Heiligenberg W, editors. Electroreception. Wiley; New York: 1986. pp. 497–525. [Google Scholar]
- 22.Heiligenberg W. Neural nets in electric fish. MIT; Cambridge, MA: 1991. [Google Scholar]
- 23.Heiligenberg W, Dye J. Labeling of electroreceptor afferents in a gymnotoid fish by intracellular injection of HRP: the mystery of multiple maps. J Comp Physiol [A] 1982;148:287–296. [Google Scholar]
- 24.Kreiman G, Krahe R, Metzner W, Koch C, Gabbiani F. Robustness and variability of neuronal coding by amplitude-sensitive afferents in the weakly electric fish Eigenmannia. J Neurophysiol. 2000;84:189–224. doi: 10.1152/jn.2000.84.1.189. [DOI] [PubMed] [Google Scholar]
- 25.Lewis JE, Maler L. Neuronal population codes and the perception of object distance in weakly electric fish. J Neurosci. 2001;21:2842–2850. doi: 10.1523/JNEUROSCI.21-08-02842.2001. [DOI] [PMC free article] [PubMed] [Google Scholar]
- 26.MacIver MA, Sharabash NM, Nelson ME. Prey–capture behavior in gymnotid fish: motion analysis and effects of water conductivity. J Exp Biol. 2001;204:543–557. doi: 10.1242/jeb.204.3.543. [DOI] [PubMed] [Google Scholar]
- 27.Maler L. The posterior lateral line lobe of certain gymnotoid fish: quantitative light microscopy. J Comp Neurol. 1979;183:323–363. doi: 10.1002/cne.901830208. [DOI] [PubMed] [Google Scholar]
- 28.Maler L, Mugnaini E. Correlating γ-aminobutyric acidergic circuits and sensory function in the electrosensory lateral line lobe of a gymnotiform fish. J Comp Neurol. 1994;345:224–252. doi: 10.1002/cne.903450206. [DOI] [PubMed] [Google Scholar]
- 29.Maler L, Sas EK, Rogers J. The cytology of the posterior lateral line lobe of high-frequency electric fish (Gymnotidae): dendritic differentiation and synaptic specificity in a simple cortex. J Comp Neurol. 1981;195:87–139. doi: 10.1002/cne.901950107. [DOI] [PubMed] [Google Scholar]
- 30.Mardia KV, Jupp PE. Directional statistics. Wiley; New York: 1999. [Google Scholar]
- 31.Mathieson WB, Heiligenberg W, Maler L. Ultrastructural studies of physiologically identified electrosensory afferent synapses in the gymnotiform fish, Eigenmannia. J Comp Neurol. 1987;255:526–537. doi: 10.1002/cne.902550405. [DOI] [PubMed] [Google Scholar]
- 32.Metzner W, Juranek J. A sensory brain map for each behavior? Proc Natl Acad Sci USA. 1997;94:14798–14803. doi: 10.1073/pnas.94.26.14798. [DOI] [PMC free article] [PubMed] [Google Scholar]
- 33.Metzner W, Koch C, Wessel R, Gabbiani F. Feature extraction by burst-like spike patterns in multiple sensory maps. J Neurosci. 1998;18:2283–2300. doi: 10.1523/JNEUROSCI.18-06-02283.1998. [DOI] [PMC free article] [PubMed] [Google Scholar]
- 34.Nelson ME, MacIver MA. Prey capture in the weakly electric fish Apteronotus albifrons: sensory acquisition strategies and electrosensory consequences. J Exp Biol. 1999;202:1195–1203. doi: 10.1242/jeb.202.10.1195. [DOI] [PubMed] [Google Scholar]
- 35.Rasnow B, Bower JM. The electric organ discharges of the gymnotiform fishes. I. Apteronotus leptorhynchus. J Comp Physiol [A] 1996;178:383–396. [Google Scholar]
- 36.Rieke F, Warland D, de Ruyter van Steveninck R, Bialek W. Spikes: exploring the neural code. MIT; Cambridge, MA: 1996. [Google Scholar]
- 37.Sas E, Maler L. The nucleus praeeminentialis: a Golgi study of a feedback center in the electrosensory system of a gymnotid fish. J Comp Neurol. 1983;221:127–144. doi: 10.1002/cne.902210202. [DOI] [PubMed] [Google Scholar]
- 38.Sas E, Maler L. The organization of afferent input to the caudal lobe of the cerebellum of the gymnotid fish Apteronotus leptorhynchus. Anat Embryol (Berl) 1987;177:55–79. doi: 10.1007/BF00325290. [DOI] [PubMed] [Google Scholar]
- 39.Saunders J, Bastian J. The physiology and morphology of two types of electrosensory neurons in the weakly electric fish Apteronotus leptorhynchus. J Comp Physiol [A] 1984;154:199–209. [Google Scholar]
- 40.Scheich H, Bullock TH, Hamstra RH. Coding properties of two classes of afferent nerve fibers: high frequency electroreceptors in the electric fish, Eigenmannia. J Neurophysiol. 1973;36:39–60. doi: 10.1152/jn.1973.36.1.39. [DOI] [PubMed] [Google Scholar]
- 41.Shumway CA. Multiple electrosensory maps in the medulla of a weakly electric gymnotiform fish. I. Physiological differences. J Neurosci. 1989a;9:4388–4399. doi: 10.1523/JNEUROSCI.09-12-04388.1989. [DOI] [PMC free article] [PubMed] [Google Scholar]
- 42.Shumway CA. Multiple electrosensory maps in the medulla of a weakly electric gymnotiform fish. II. Anatomical differences. J Neurosci. 1989b;9:4400–4415. doi: 10.1523/JNEUROSCI.09-12-04400.1989. [DOI] [PMC free article] [PubMed] [Google Scholar]
- 43.Shumway CA, Maler L. GABAergic inhibition shapes temporal and spatial response properties of pyramidal cells in the electrosensory lateral line lobe of gymnotiform fish. J Comp Physiol [A] 1989;164:391–407. doi: 10.1007/BF00612998. [DOI] [PubMed] [Google Scholar]
- 44.Turner RW, Maler L, Burrows M. Electroreception and electrocommunication, pp 1167–1458. Company of Biologists; Cambridge, UK: 1999. [Google Scholar]
- 45.Wessel R, Koch C, Gabbiani F. Coding of time-varying electric field amplitude modulations in a wave-type electric fish. J Neurophysiol. 1996;75:2280–2293. doi: 10.1152/jn.1996.75.6.2280. [DOI] [PubMed] [Google Scholar]
- 46.Yuthas J. Motor patterns evoked by stimulation of the optic tectum in two species of weakly electric fish. Soc Neurosci Abstr. 1985;11:1021. [Google Scholar]
- 47.Zhang K, Sejnowski TJ. Neuronal tuning: to sharpen or broaden? Neural Comput. 1999;11:75–84. doi: 10.1162/089976699300016809. [DOI] [PubMed] [Google Scholar]