

Abstract
We model the propagation of neural activity through a feedforward network consisting of layers of integrate-and-fire neurons. In the presence of a noisy background current and spontaneous background firing, firing rate modulations are transmitted linearly through many layers, with a delay proportional to the synaptic time constant and with little distortion. Single neuron properties and firing statistics are in agreement with physiological data. The proposed mode of propagation allows for fast computation with population coding based on firing rates, as is demonstrated with a local motion detector.
Keywords: rate coding, sensory processing, propagation, integrate-and-fire neurons, network models, synfire models, population coding
The nature of the neural code the nervous system uses for computing and representing information remains controversial. A widely held view is that stimulus features are coded in the mean firing rates of neurons, referred to as rate coding (Adrian, 1928; Stein, 1967;Barlow, 1972). Rate coding is based on the observation that the firing rates of most sensory neurons correlates with the intensity of the encoded stimulus feature. In addition, the fact that neuronal firing rates are typically highly variable has been used as an argument that only the mean firing rate encodes information.
A potential problem with rate coding is that given typical firing rates (10–100 Hz) and the irregularity of firing (Poisson-like statistics), averaging times of tens of milliseconds are required to read out rate-coded signals (Gautrais and Thorpe, 1998). On the other hand, it is known that neural computation can be very fast. For instance, humans can categorize complex visual scenes in as little as 150 msec (Thorpe et al., 1996), which is particularly striking because the signal has to pass many synaptic stages for this computation. A possible solution to speed up readout is to collect spikes from a population of many independent, parallel neurons. In a seminal study, Knight (1972a) showed that a population of noisy neurons can follow rapid stimulus oscillations, as also has been observed in experiments (Knight, 1972b;Nowak and Bullier, 1997; Schmolesky et al., 1998; Galarreta and Hestrin, 2001). However, in a reasonable implementation of a rate-coding network with 100 neurons, ∼10–50 msec integration time is still needed for a reliable signal estimate (Shadlen and Newsome, 1998). If temporal averaging is required at every synaptic stage, rate coding would either be very slow or very inefficient if many parallel neurons would perform the same task. This raises the question of whether rate coding is fast enough to account for information transfer in biological networks or whether other coding schemes should be considered (Gray et al., 1989; Van Rullen and Thorpe, 2001).
Although these coding issues have been studied extensively in single populations (Wilson and Cowan, 1972; Tsodyks and Sejnowski, 1995; van Vreeswijk and Sompolinsky, 1996; Gerstner, 1999), it is not clear how the findings generalize to the multilayer architectures relevant for cortical processing. Multilayer architectures place important constraints on computation because delays and distortions accumulate at each layer. An additional problem is that, when activity propagates through a multilayer network, firing tends to synchronize. It was shown that, for a wide range of parameters, any input pattern propagation through such a network either dies out (when it is too weak) or transforms into a tightly synchronized spike packet (Diesmann et al., 1999). Although the synchronization is the basis for synfire coding in which information is carried by synchronized population spikes (Abeles, 1991), it would destroy rate coding after a few layers because rate coding requires primarily independently firing neurons.
In this paper, we study information transmission in multilayer architectures in which computation is distributed and activity needs to propagate through many layers. We show that, in the presence of a noisy background current, firing rates propagate rapidly and linearly through a deeply layered network. The noise is essential but does not lead to deterioration of the propagated activity. The efficiency of the rate coding is improved by combining it with a population code. We propose that the resulting signal coding is a realistic framework for sensory computation.
MATERIALS AND METHODS
We simulate a layered network of leaky integrate-and-fire neurons with 100 MΩ input resistance, 20 msec time constant, −60 mV resting potential, and −50 mV firing threshold. The integration time step is 0.1 msec. After firing, the membrane potential is reset to the resting potential at which it remains clamped for 1 msec (absolute refractory period).
The neurons are injected with different levels of background current. In the propagation mode central to this paper, the rate mode of Figure1c, all neurons are injected with a Gaussian-distributed, first-order low-pass-filtered noisy background current with positive mean (mean of 55 pA, SD of 70 pA, time constant of 2 msec). The noise current causes background spiking at 5 Hz with approximately Poisson statistics. The mean current injected in neurons in the input layer is enhanced 40% to compensate for the lack of synaptic input to this layer; without compensation, their background firing rates would be substantially lower.
Fig. 1.

Propagation of activity through a layered network. a, The architecture of the simulated network. Layers of integrate-and-fire neurons are connected in an all-to-all manner with identical excitatory synapses. The network is feedforward without lateral or recurrent connections. To study propagation, an input current is injected into all neurons of the input layer. b–e, Propagation of a random stimulus through a layered network with 10 layers of 20 parallel neurons per layer. In eachpanel, the input layer is injected with the same random stimulus (bottom panels in b and c). Poststimulus time histograms (5 msec bins) are averaged across neurons for layers 1 (input layer), 5, and 10. Top panels in b and c show the spikes in layer 10 in a raster plot. The total number of spikes is approximately identical across layers and across conditions. b, Synfire chain mode of propagation. The neurons are injected with a small amount of noise current (mean of 0 pA; SD of 20 pA). Either most neurons in the population fire synchronously or all are silent. c, Rate mode propagation. Response to the same stimulus, but each neuron is primed with an independent, noisy background current with positive mean (mean of 55 pA; SD of 70 pA). The firing rates follow the stimulus rapidly and faithfully. d, Response in layer 10 to the same stimulus when the background firing is caused by a noiseless net current (mean of 101 pA; SD of 0 pA). The response is synchronized. e, Response in layer 10 to the same stimulus when the background firing is purely noise induced (mean of 0 pA; SD of 170 pA). There is no synchronization, but the firing rates are thresholded.
Unless stated otherwise, the layers contain 20 neurons each. The neurons receive excitatory input from all neurons in the previous layer through conductance-based synapses. The synaptic conductances are modeled with a single exponential decay with a time constant of 5 msec. The excitatory synapses have a reversal potential of 0 mV. The magnitude of the synaptic conductances is determined as follows. First, the conductance is set such that synaptic charge equals the charge required to fire the neuron from rest, divided by the number of inputs (see ). Next, the synaptic conductance is boosted by 25% so that the total number of spikes is conserved across layers. This corrects for the non-uniformity of membrane potential distribution and compensates for the loss of charge through both the leak conductance and the shunting during the refractory period. In simulations without a mean background current (e.g. in the synfire mode) (see Fig.1b), doubling the synaptic amplitude is necessary to maintain propagation.
Axonal and dendritic delays are not included. Inclusion of a fixed latency simply introduces additional latency in the response without changing the propagation. If the latencies are random, additional smearing of the poststimulus time histograms (PSTHs) occurs.
The stimulus in Figures 1 and 2 is a Gaussian-distributed noise low-pass filtered at 50 msec and half-wave rectified. This stimulus current is injected to all neurons in the input layer.
Fig. 2.

The effect of the mean and SD of the background current on the distribution of membrane potentials and on the accuracy of transmission. a, The probability distribution of membrane potentials of a neuron for the different propagation modes. Membrane potentials of a single neuron are collected for 2 sec while just the background current is applied; no stimulus is present. i, The probability distribution for synfire mode of Figure 1b. The narrow distribution favors synchronous firing. ii, The distribution for the rate mode (Fig. 1c). The distribution is wide, favoring asynchronous firing and a rapid response. iii, The distribution for the synchronized propagation mode of Figure 1d. iv, The distribution for the propagation mode of Figure 1e. For clarity, the distributions are scaled vertically. b, The dissimilarity between stimulus and the fifth layer response for varying background currents. A random stimulus current is injected into the first layer. The dissimilarity is measured by comparing the injected current with the network output (see Materials and Methods). In the rate mode, the response is most similar to the input. (The contour lines on the bottom plane denote 0.1 intervals starting at 0.2). c, The background firing rates for the different conditions. The background firing rate increases with increasing mean and increasing noise current. The threshold current is just above 100 pA. Contour lines denote 5 Hz intervals.
For Figure 2b, the dissimilarity is calculated as ∫[ 5(t + δt) − (t)]2dt, where 5(t) is the normalized, binned firing rate in the fifth layer, 5(t) = r5(t)/ , and (t) is the normalized stimulus. The time shift δt compensates for the delay in the response and is chosen such that the dissimilarity is minimal. The dissimilarity is zero only if the response and stimulus are precisely proportional. The synaptic weights are tuned such that, for each data point in Figure2b, the total number of spikes in the input layer and the output layer are the same.
In Figures 5 and 6, the inhibitory synapses have a reversal potential of −60 mV and a time constant of 5 msec. The slow inhibitory synapses in Figure 6 have a time constant of 25 msec. Because the reversal potential of the inhibitory synapses is close to the resting potential, their driving force is small, and relatively small IPSPs would result. Therefore, we assumed the inhibitory conductances five times larger than the excitatory ones.
Fig. 5.

Transmission of spatiotemporal patterns in a network in which the layers are connected with a center-surround connectivity profile. A moving current injected in 20 neurons of the input layer. The activity of the input layer (a) and the response in the fifth layer (b). The synaptic strengths are modeled with a difference of Gaussians connectivity profile (excitatory profile, SD 15 times the distance between neurons; inhibitory profile, twice as wide). PSTH bins averaged over 25 msec and 10 neurons. c, Read out of the stimulus position in the input layer (top curve) and layer 5 (bottom curve). The response is collected in 2 msec bins, and the stimulus location is determined by reading out the population code with a maximum likelihood estimator.
Fig. 6.
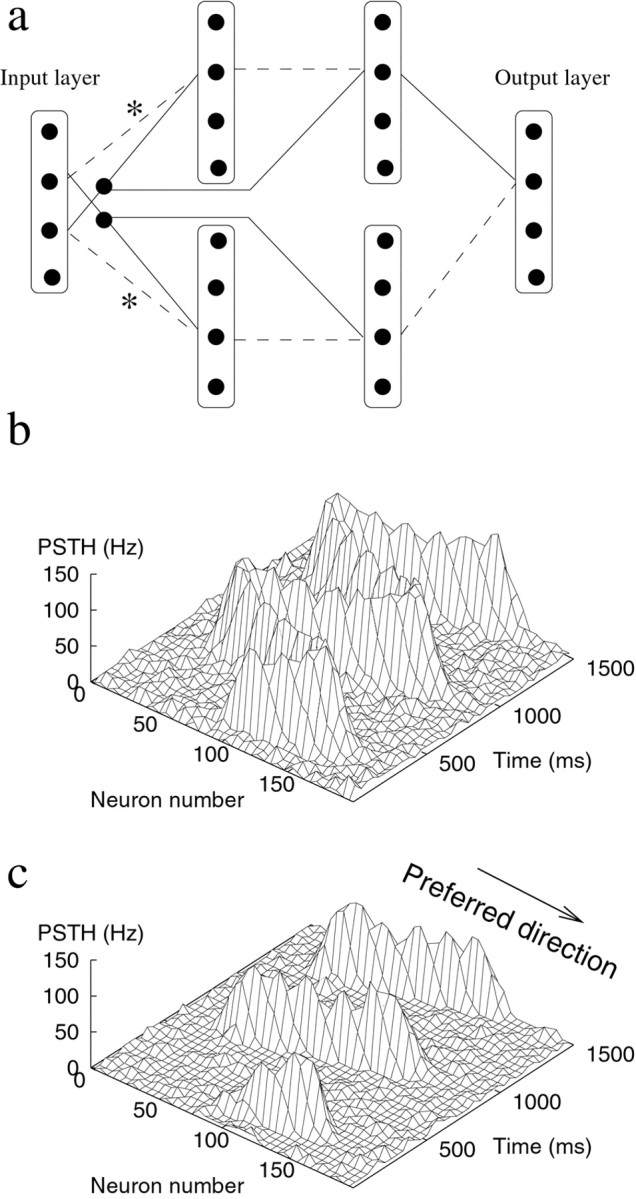
Motion detection with a rate mode network. a, Implementation of a motion detector in a layered network. Two cross-correlation circuits (top and bottom parts) calculate the correlation between the input and its delayed and translated copy. To prevent a response to uniformly modulation of the input, the response in the nonpreferred direction (bottom part) is subtracted from the response in the preferred direction (top part) in the final layer. Every cell connects with a Gaussian connectivity profile (SD of 7 units) to the cells in the next layer, but for clarity, only one connection is indicated. Thesolid lines denote excitatory connections, and thedashed lines denote inhibitory connections. Thelines marked ∗ correspond to connections with slow synapses. b, Input to the network is a current injection that moves sinusoidally back and forth in the preferred and nonpreferred directions. c, The output of the motion detection circuit in response to the stimulus in a. The output is active only in the preferred direction.
RESULTS
Transmission of firing rates
We first study the propagation of activity through a layered network (Fig. 1a). The neurons are modeled as integrate-and-fire (I&F) neurons. Each neuron is identical and receives synaptic input from all neurons in the previous layer (all-to-all connectivity); all synapses have equal strength. The network is purely feedforward. A random stimulus current injected into all cells of the input layer causes firing that propagates through neurons in subsequent layers. Mere propagation of neural activity is obviously not the computational goal of the brain. Nevertheless, it is necessary to study propagation before we can consider actual computation, because the properties of propagation through multiple layers impose important constraints on the network.
Depending on the background activity and the properties of the neurons, very different modes of activity propagation exist. We first consider the case in which the neurons are either noiseless or receive a small noise current. After an increase in the stimulus, the neurons in the first layer reach threshold and fire roughly simultaneously (Fig.1b). Only sufficiently strong and well synchronized spike packets in the input layer propagate to the next layer. As can be observed in Figure 1b, the activity further synchronizes in subsequent layers until it reaches a narrow limit width (Marsalek et al., 1997; Burkitt and Clark, 1999; Diesmann et al., 1999). This propagation mode has been termed the synfire chain (Abeles, 1991).
Given that the individual neurons are somewhat noisy and the membrane time constant smears synaptic input currents, this synchronization is perhaps unexpected. The reason is that the tendency to synchronize strongly suppresses spike timing jitter in individual neurons (Diesmann et al., 1999). Because all neurons are in the same state when the stimulus arrives and because all neurons receive identical input, each layer behaves like a single I&F neuron. The synchronization is advantageous for coding schemes that require preservation of precise spike timing. On the other hand, weaker responses in the input layer fail to propagate; the packet dies out. The response in the deeper layers is thus all-or-none, as can be observed from the layer 5 and layer 10 response in Figure1b.
A very different mode of propagation is revealed when a noisy background current is present. In Figure 1c, the same stimulus current is injected, but now firing rates are transmitted rapidly and approximately linearly. This mode exists provided that each neuron continuously receives an independent noise current with a positive mean. This background causes the neurons to fire asynchronously at a low background rate of 5 Hz. As can be observed by comparing the response in the 10th layer with the stimulus, the stimulus is faithfully transmitted across many layers, despite the small size of the network. With a small delay proportional to the synaptic time constant (see below), the response in every layer is approximately proportional to the stimulus intensity. There is little deterioration of the response, despite the fact that noise is added to each neuron at each layer. We term this “rate mode propagation.”
There are two components to the background current. The mean, or bias, current raises the average membrane potential and makes the transmission of rate changes more rapid and more sensitive as on average neurons are brought closer to threshold. The SD, or noise component, of the current prevents synchronization by ensuring that each neuron is in a different state when the input current arrives. Therefore, each neuron independently estimates the stimulus, and the temporal structure of the response is maintained. Background activity itself is not sufficient to obtain rate mode propagation; both the bias and noise in the background current are necessary components for rate mode transmission. With just a bias current, synchronization still occurs (Fig. 1d), whereas with just a noise current, there is no synchronization but the firing rates are strongly thresholded and only strong stimuli propagate (Fig. 1e). These different modes correspond to different distributions of membrane potentials in the absence of a stimulus. The combination of the bias and noise components causes the distribution of membrane potentials to be both broad and close to threshold (Fig.2a).
In the idealized case in which neurons have no leak conductance and synapses are infinitely fast, the transmission can occur without any distortion or delay (Knight, 1972a) (see ). In our simulations, neurons have realistic synapses and both a leak conductance and a refractory period. Although an analytical description for these more general models is not known (Burkitt and Clark, 1999; Gerstner, 1999; van Rossum, 2001), the simulations indicate that distortion-free propagation remains a reasonable approximation for more realistic neurons.
In additional simulations, we included spike frequency adaptation in the model by means of a Ca-dependent K current. When a step current is applied to these neuron, this current causes the firing rate to decay with a time constant of 50 msec to ∼50% of the initial rate. The effect of spike frequency adaptation accumulates in layered networks. In response to a step stimulus, the response of subsequent layers adapts more strongly, and, after a few layers, almost no steady-state response is left, consistent with observations (Schmolesky et al., 1998). However, because the adapting current takes time to develop, the early part of the response is unaffected by adaptation, and, therefore, adaptation does not change the qualitive behavior of the rate mode.
Tuning propagation
Figure 2b illustrates how well the output of the network matches the input as the mean and SD of the background current are systematically varied. A random current is injected in the input layer as in Fig. 1, and the dissimilarity between the stimulus and the fifth layer response is measured. The dissimilarity calculates the integrated deviation between stimulus and output (see Materials and Methods). When it is zero, the response and stimulus are precisely proportional.
The transmission modes illustrated in Figure 1 are not discrete but form a continuum as mean and SD of the background current are varied. For small noise currents, the network operates in the synfire mode. For intermediate mean and SD, the dissimilarity is minimal (Fig.2b). These are the same values for which the cross-correlation between stimulus and response is maximized (data not shown). This is the regimen of rate mode propagation, in which the firing rate of the network faithfully encodes the stimulus current. Additional increases in the background current increase the background firing (Fig. 2c). The background firing is a necessary consequence of bringing noisy neurons close to threshold. When the background current is too large, the background firing overwhelms weak signals. The output then resembles the input less, and the dissimilarity increases (Fig. 2b).
Although it is likely that, in various parts of the nervous system, properties of the spiking pattern other than the firing rate encode information, this result suggests that, when firing rates are to be transmitted, the optimal setting of the background current is such that the network operates in the rate mode. In the rate mode, the spontaneous firing rate and membrane potential distribution approximate those found in vivo (Smith and Smith, 1965;Anderson et al., 2000).
Rate mode transmission requires not only an appropriate background current but also appropriately tuned synapses. The synaptic time constant determines the necessary amount of noise, because shorter synaptic time constants tend to lead to synchronized activity. The synaptic efficacy determines the gain of the propagation. If the synaptic strengths are too weak, the response in subsequent layers decays and fails to propagate, whereas if the synaptic strengths are too strong, the response rapidly saturates. When the noise current is kept constant, modest changes in the synaptic efficacy, such as might occur in vivo through the action of neuromodulators or anesthesia, modify the gain but do not qualitatively alter the mode of propagation; they do not eliminate response linearity and do not introduce synchrony.
Speed and latency
In , it is shown that, in the rate mode under idealized conditions, the firing rate of each layer follows the input current instantaneously and linearly. The input current is given by the input rate filtered by the synaptic time course. Therefore, as observed previously for single layers (Knight, 1972a;Tsodyks and Sejnowski, 1995; Gerstner, 1999), the typical response time of the network is limited by the synaptic time course (here 5 msec), not by the slower membrane time constant (here 20 msec) or by the time needed to count sufficient spikes to obtain a reliable rate estimate.
Also, under the conditions of the simulation, the synaptic time course determines the propagation speed in the rate mode. Figure3a illustrates the response in the 10th layer to a step stimulus applied to the input layer. The synaptic time course acts as a low-pass filter on the firing rate at every layer. Therefore, the filtering of the response in the 10th layer is reasonably well described by nine subsequent first-order low-pass filters, each with a time constant equal to the synaptic time constant (Fig. 3a, dashed line). The filtering is, however, nonlinear: the onset transient of the firing rate rises faster than the linear filter predicts, and the filtering is amplitude dependent, because a small-amplitude stimulus is filtered with a longer time constant (Fig. 3a, right). The underlying reason is the non-uniformity of the membrane potential distribution (Fig.2a) (Kempter et al., 1998). As a result, the fraction of neurons that fires does not perfectly follow the stimulus current. The nonlinear filter resembles anisotropic diffusion filters proposed for computer vision in the spatial domain (Perona and Malik, 1990). These filters have the advantage that they average out noise, while preserving large transients in the signal. This type of filtering might thus follow naturally from activity propagation in biological networks.
Fig. 3.

Speed and distortion of rate mode propagation. a, Response in the input layer (bottom panel) and in layer 10 (top panel; solid line) to a step current applied to the input layer. The response in the 10th layer is well described by filtering the input with nine consecutive low-pass filters with the synaptic time constant (dashed line; drawn with 5 Hz vertical offset to ease comparison). Left, Large-amplitude stimulus.Right, Small-amplitude stimulus. Response averaged over 100 runs. b, Latency of the network in response to step stimuli of different amplitudes. The latency, defined as the time between stimulus onset and 50% response, increases linearly with layer number. The latencies are longer for small-amplitude responses than for high-amplitude responses. Error bars indicate the response jitter, as given by SD of the latency across trials. c, The linearity of the response. A long-lasting step stimulus is applied. The firing rate in the fifth layer versus the average firing frequency in the input layer (solid line). The averaging started after the response onset in that layer and extended over the full layer.Dashed line denotes response in 10th layer. Thin solid line indicates identity (shown for comparison).
The latency of the response in the rate mode is consistent with this type of filtering. The latency is proportional to the synaptic time constant and to the number of layers crossed (Fig. 3b). For small-amplitude responses, the latency is longer than for large-amplitude responses; there is a smooth dependence of latency on amplitude. Such latency differences are consistent with observations in visual cortex (Maunsell et al., 1999).
In comparison, in synfire propagation, weak stimuli do not propagate. For stronger stimuli, the latency at the first layer is inversely proportional to the stimulus strength. The latency between subsequent layers is short (again on the order of the synaptic time constant) and independent of the stimulus, because of synchronization, these layers receive a very strong, brief input.
For sensory processing, it has been argued that it is advantageous when relevant information about the stimulus can be reconstructed from the neural response (Rieke et al., 1996). In our network in which the task up to now is merely transmission, the stimulus should be reconstructable from the output. In other words, a one-to-one relationship between stimulus and response should exist. This is the case for the rate mode but not for the other propagation modes. Without a mean bias current, weak stimuli evoke no response in the deeper layers; they are lost, and their reconstruction is impossible (Fig.1b,e). With a noiseless mean bias current, stimulus reconstruction is only approximately possible when a much longer integration time is imposed (Fig. 1d). Only in the rate mode does the response provide accurate information about the stimulus (Fig.1c). Figure 2c shows the linearity of the input–output relationship, comparing the rate in the input layer with that of the fifth and 10th layers. Although the relationship between stimulus and response need not necessarily be linear, any nonlinearity is amplified in subsequent layers, leading to the above problems (loss of weak stimuli and saturation of strong stimuli). Therefore, unless compensating mechanisms such as adaptation or synaptic depression are present, only linear input–output relationships allow for stimulus reconstruction in multilayer architectures.
Accuracy
To quantify how accurately a stimulus of a given amplitude is transmitted, we estimate the input firing rate from the response in the output layer. The network has a variable number of layers. A step stimulus is applied to the network as in Figure 3a, causing the network to fire at 100 Hz. We impose a time window in which we count the total number of spikes in the output layer. The counting starts at the average response onset time of the output layer and lasts a variable duration. We define the accuracy of the response as the trial-to-trial variability in the spike count (Fig.4a).
Fig. 4.

Trial-to-trial variability of the network in response to step stimuli. A step stimulus causing 100 Hz firing was repeatedly applied to the network, and the trial-to-trial variance was measured. a, The mean and variance of the total spike count per layer are plotted parametrically as a function of the count duration. In rate mode, the count obeys sub-Poisson statistics. Thestraight line indicates Poisson statistics, and thebottom dashed line is the lower limit of the variance for 20 periodically spiking neurons with independent phases. b, As in a, but for the synfire mode with a small amount of noise (20 pA). The fluctuations in the total count are larger (note difference in vertical scale). Straight line, Poisson statistics; dashed curve, the variance of 20 periodically spiking neurons with the same phase. Same symbols as in a. c, The accuracy of estimating firing rates in the network as a function of the integration time. The error in the firing rate estimate decreases as the square root of the integration time.Solid line, Error in layer 5 in a network with 20 neurons per layer firing at 100 Hz; dashed line, same network firing at 25 Hz; dotted line, synfire mode. d, The estimation error as a function of the number of neurons per layer. In the rate mode, the estimation error decreases approximately as the square root of the number of neurons per layer (top solid curves, 5 msec integration time; bottom solid curve, 50 msec integration time; 5 layer network). Dashed lines are fits with a square root function. In the synfire, the error remains approximately constant (dotted line, 5 msec integration time). e, The dependence of the error on the number of layers. In the rate mode, the estimate does not deteriorate much when the stimulus propagates through many layers; instead, the error remains fairly constant after the first couple of layers (top tobottom curve, 5, 10, and 50 msec integration time). In the synfire mode the estimate deteriorates with layer number (dashed curve, 50 msec integration time). f, The dependence of the estimate on the synaptic time constant. The integration time at the output layer was 5, 20, and 100 msec (top to bottom curve; 5 layer network). When the synaptic time constant is too short, the network starts to synchronize and the error increases. A longer synaptic time constant slows down propagation but does not yield much better performance.
For a single neuron, the accuracy of such estimates depends on the interspike interval distribution. If the stimulus and response are not precisely locked, a periodically spiking neuron would give the lowest trial-to-trial variance. For a network, the accuracy of the estimate depends on two factors: the accuracy in the firing of the individual neurons and the amount of correlation between the neurons (Shadlen and Newsome, 1998). For a network, the variance is lowest for an uncorrelated population of periodically spiking neurons (Fig. 4a, dashed line). The minimal variance oscillates between 0, whenever the counting window is a multiple of the spiking period and the count is always identical, and w/4, where w is the number of neurons per layer. The input layer performs close to this limit. In subsequent layers, the neurons receive noisy, correlated input from the previous layer; as a result, the neurons fire more irregular and the trial-to-trial variance increases (Fig. 4a). The spike count of the single neurons and the population obey sub-Poisson statistics, 〈δN2〉 ≈ α〈N〉, with α < 1 (for Poisson, α = 1). Poisson-like statistics have been observed for single neurons in many parts of the brain, although for longer count windows, α often slightly exceeds 1, presumably because of slow drifts (Softky and Koch, 1993; Holt et al., 1996; Shadlen and Newsome, 1998).
In the synfire mode, the neurons fire periodically and synchronously. Trial-to-trial variability is obviously absent when no noise is introduced. However, when a small amount of noise (SD of 20 pA) is injected to all neurons, synchrony is preserved, but spike times fluctuate somewhat from trial to trial. In this case, the count variance of the population is much larger than for rate mode propagation (Fig. 4b). When the population fires synchronously, small timing fluctuations can lead to large variations in the spike count, because the population spike can fall just inside or outside the counting window. The variance is similar to that of a synchronized periodically firing population (dashed line).
From the total spike count N, the estimated firing rate is given by fest = N/(wΔt), where Δt is the time window of integration. The observed Poisson-like statistics imply that the SD of the rate estimate decreases with the square root of the integration time and with the square root of the number of neurons in a layer. In Figure4c, the integration time is varied. As noted previously (Gautrais and Thorpe, 1998), the error in the estimate is substantial, even for integration times of the order of 25 msec. This is especially true for weak stimuli (Fig. 4c, dashed line). The effect of increasing the number of neurons per layer is shown in Figure 4d. This illustrates the fact that the precision of the transmission can be improved by increasing the number of neurons per layer, while simultaneously reducing the synaptic weights to avoid saturation. In the synfire mode, the addition of neurons does not improve the signal estimate based on spike count but instead reduces the temporal jitter in the spike packets (Burkitt and Clark, 1999).
Interestingly, the spike count variability rapidly converges to a fixed value in propagating from layer to layer. The accuracy does not deteriorate much, despite the fact that noise is added at every layer. For short integration times (on the order of the typical interspike interval or less), the statistics are Poisson for every layer, which means that the error is almost independent of the number of layers (Fig. 4e, top curve). The estimate is simply limited by the number of available spikes. For longer integration times, the error in the deeper layers is relatively larger than in the input layer (Fig. 4e). Nevertheless, the fluctuations are limited and remain bounded. The underlying reason is that the output variability of a spiking neuron is not directly proportional to the input variability; instead, the output variability normalizes the input variability, leading to a fixed point in the variability (Shadlen and Newsome, 1998).
Two other imperfections in the transmission should be noted. The fluctuations in latency (indicated by error bars in Fig. 3b) increase with layer, as is consistent with physiology (Schmolesky et al., 1998; Raiguel et al., 1999). Together with the stimulus dependence of the latency, this could potentially limit the computational speed for a computation involving rapid comparison of two different rates at a layer far removed from the input. Furthermore, as indicated above, small-amplitude responses are weakened and will, after many layers, eventually be drowned out by the background activity.
It is important to note that, to read out the response, we impose the temporal integration only at the final stage of the network. The intermediate layers do not integrate the signal before it is sent on. This contrasts with a scheme in which every layer imposes a long integration time to count enough spikes and then sends the signal to next layer. Here, the intermediate propagation is fast and is determined by the synaptic time constant. By varying the synaptic time constant, the integration time of the intermediate layers can be varied. This is illustrated in Figure 4f: increasing the synaptic time constant fivefold from 5 to 25 msec improves the accuracy maximally ∼15%. However, because the synaptic time constant determines the propagation speed (Fig. 3a), the propagation slows down fivefold. On the other hand, the synaptic time constant can not be arbitrarily shortened. As noted above, when the synaptic time constant is too short, the network synchronizes and the estimation error increases sharply.
Postponing the temporal integration to the last layer is not only possible for networks that just transmit firing rates but for any network that performs a linear computation (addition and subtraction of population firing rates). Mathematically, this is because the statistical properties are preserved under linear transformation. For nonlinear computations, this is no longer true, and a general treatment is not feasible (Rice, 1944). Nevertheless, as shown below, elementary computations can be performed rapidly by the network. The lack of a precise firing rate estimate is no excuse to wait with computation.
Population coding
All-to-all connectivity with identical synapses, although useful for analysis, is not very realistic. To determine how more realistic connectivity affects propagation, we replace the all-to-all connectivity with a Gaussian connectivity profile, with strong connections in the center and weaker synaptic strengths away from the center. The first observation is that, with exclusively excitatory synapses, the activity spreads out laterally within a few layers. Therefore, we use a center-surround connectivity profile with inhibitory side lobes (modeled by a difference of Gaussians). In such a network, the stimulus remains spatially localized.
We first consider propagation in the synfire mode. In this network, whether or not the neurons synchronize depends on the stimulus properties. When a broad, “full-field” stimulus is presented, the situation is no different from the all-to-all connected network and the full population synchronizes. However, when a narrow stimulus is presented, the synchronization is much weaker than in the all-to-all case. The reason is twofold. First, the number of neurons participating in the activity is small; this limits averaging process underlying the synchronization. However, more importantly, in these networks, neurons of a given layer do not receive the same input when a localized stimulus is presented; only neurons that are nearby will receive primarily identical input and will synchronize. The population PSTH measured across the full layer shows no synchronization and is similar to Figure 1e.
In contrast, the rate mode description remains valid when a center-surround connectivity profile is used, although the connectivity profile lowers the amount of noise required to desynchronize the network. In contrast to the all-to-all network, neurons of a given layer do not see the same input, and therefore synchronization is more easily eliminated. To quantify this effect, we repeat the simulation of Figure 2b, but now the network has a center-surround connectivity and the stimulus is applied to a narrow subpopulation of neurons in the input layer. Again, the dissimilarity between the output and stimulus is measured. The dissimilarity is now minimal (optimal) when the SD of the noise current is 50 pA (compared with 70 pA for the flat connectivity profile) (Fig. 2b); the optimal mean current is unchanged.
Next, a moving stimulus current is injected to the input layer, and the output of a five layer network is plotted at different times (Fig.5). Again, the output faithfully codes the input. At each time, a population of neurons is active, representing both the amplitude and the location of the stimulus. With this connectivity profile, the rate mode is integrated with population coding (Georgopoulos et al., 1986; Nicolelis et al., 1998). In population codes, neurons have receptive fields centered at different locations, but their tuning curves are wide and overlap considerably so that a single stimulus activates a population of neurons. Combining the response rates of the different neurons, the stimulus location can be reconstructed. Using 20 parallel neurons to code just the stimulus amplitude (a single analog quantity) as we did above is a wasteful scheme. However, in this network, each neuron takes part in the response to many different stimulus locations. This enhances the efficiency and allows the network to transmit spatiotemporal patterns.
The location of the stimulus can be estimated from the population response within a very brief integration time. This is illustrated in Figure 5c: the population response of the network is sampled every 2 msec. The position of the stimulus is estimated using a maximum likelihood fit based on the shape of the average response profile (Paradiso, 1988; Deneve et al., 1999; M. C. W. van Rossum, unpublished observations). Because of the synaptic delays, the estimate of the position in layer 5 is delayed, but the small population (width of the active population is 15 units) reflects the stimulus position accurately, despite the very brief integration time; the SD in the position estimate is approximately six units. The error in the estimate in the output layer is hardly worse than in the input layer. Also, the location information propagates rapidly with little distortion.
Computation
The above properties of the rate mode propagation can be used for computation. As an example of a nontrivial, fast computation based on a population code, we implement a Reichardt local motion detector. The Reichardt detector is a classic algorithm for motion detection consistent with physiology and psychophysics (Reichardt, 1957; van Santen and Sperling, 1984). Although the biological implementation of motion detection is likely much more refined and probably involves recurrent connections (Suarez et al., 1995), the detector can be implemented in a feedforward network. The input to the Reichardt detector is a moving spatial image. The detector calculates the motion by correlating the image with a temporally delayed and spatially translated copy of the input.
Correlation is a multiplication operation that renders this computation nonlinear. Above it was seen that, in the rate mode, neurons sum their excitatory inputs linearly. Likewise, inhibitory inputs are approximately subtracted linearly (subtractive inhibition). Nevertheless, nonlinear computations can be performed by using the fact that no negative firing rates are possible, i.e., the firing rate rectifies the input. This nonlinearity is the basis for computation in these noisy networks. It can, for instance, be used to calculate the Exclusive-OR (XOR) function of two population firing rates (Maass and Natschläger, 2000), which is important for the theory of computation. For the motion detector, the multiplication of two population firing rates fAand fB is required. A precise multiplication is difficult to implement in the current framework. However, we can approximate the multiplication by the minimum function, which captures the essence of the multiplication needed for cross-correlation. Namely, like the minimum function, it only has a non-zero output when both inputs are active. The minimum of two firing rates can be calculated as the following: min (fA, fB) = [fA − [fA − fB]+]+, where [x]+ = max (0, x) denotes the rectification. The minimum is computed with a two layer network: the first layer calculating [fA − fB]+, and the second layer combines the output of the first layer with fA to form [fA − [fA − fB]+]+. Although the minimum is mathematically not the same as a multiplication, the approximation is sufficient for the current application. Furthermore, the approximation improves if the nonlinearity is softer than stated here, as was observed by Anderson et al. (2000).
The other elements of the Reichardt detector are implemented as follows. The time delay is implemented by a slow synapse (25 msec). This delayed signal could mimic input from lagged lateral geniculate nucleus cells (Saul and Humphrey, 1992). The spatial offset (10 units) is provided by the connectivity pattern. The resulting detector is shown in Figure6a. A moving current stimulus is applied to the input layer of the network (Fig. 6b). The output of the network detects the local motion in the input (Fig.6c). It is active only when the current moves in the preferred direction. This example illustrates that fast computations are feasible using rate-based models combined with population coding.
DISCUSSION
Because neural computation can be very rapid and often involves multiple synaptic stages, we considered activity propagation and computation in architectures with multiple layers. The main observation of this paper is that, under realistic noise conditions, information can be rapidly coded in the population firing rate and can propagate through many layers. We propose that this propagation mode (termed rate mode) forms a good framework for sensory computation.
The need to propagate information through multiple layers imposes important constraints that have not often been considered in previous studies. First, to retain information about the stimulus, small stimuli should be conserved, whereas strong stimuli should not saturate the response. Unless compensatory mechanisms such as adaptation or synaptic depression are present, an (almost) linear input–output relationship is necessary because deviations from linearity will be strongly amplified in a multilayer network. By injecting a noisy bias current, the rate mode has a linear input–output relationship.
A second, related constraint is that synchronization must be prevented if information is to be coded in the firing rates. This constraint is met by adding sufficient noise to the neurons. Possible sources of the background noise are manifold: noise in the spike generator, spontaneous quantal events (Bekkers et al., 1990), or input from other cells in a network maintaining an asynchronous low-activity state (van Vreeswijk and Sompolinsky, 1996). Additional variability, such as heterogeneity in the excitability of the cell, (Wilson and Cowan, 1972) or stochastic vesicle release (Maass and Natschläger, 2000), will further help to prevent synchrony. Despite the addition of noise at every layer, the stimulus shape deteriorates remarkably little during propagation (Fig.1c). This is reflected in the spike count statistics, which in the rate mode converge to a constant after a few layers, consistent with the observation that count statistics are conserved across many brain regions (Shadlen and Newsome, 1998).
Finally, if computation is to be fast, only a small delay per layer can be tolerated. In the rate mode, the network transmits changes in firing rates rapidly. The main filtering in the firing rate comes from the synapses. The relevant time constant is thus the synaptic time constant; the much slower membrane time constant does not limit the propagation speed. Apart from the delay, the temporal response is hardly distorted (Knight, 1972a). This is consistent with the observation made by Marsalek et al. (1997) that the PSTHs of neurons at consecutive stages of the visual system can be remarkably similar (Nowak and Bullier, 1997;Schmolesky et al., 1998).
In summary, even with a remarkably small number of neurons per layer (∼20), the rate mode satisfies the requirements for transmission in layered networks. The rate mode relies critically on the presence of a noisy background current. As a necessary consequence of the noise, the neurons are spontaneously active in the absence of stimuli. This background activity decreases the signal-to-noise ratio. The noise level determines the trade-off between speed and linearity on one side and background activity on the other side. Interestingly, the noise level optimal for rate mode propagation leads to realistic spontaneous activity levels (Smith and Smith, 1965), membrane potential distributions (Anderson et al., 2000), and count statistics (Softky and Koch, 1993).
With a center-surround connectivity profile, the rate mode can be combined with a population code allowing transmission of both the “location” and the amplitude of the stimulus. Information about location propagates rapidly through the network, like the temporal information, and can be read out very quickly. This suggests that rate coding may be fast enough for sensory processing. Rapid image categorization as seen by Thorpe et al. (1996) could possibly be implemented in a simple feedforward network (Fukushima, 1980; Riesenhuber and Poggio, 1999). The rate mode could allow the accurate propagation required for such computations.
Computation in the rate mode depends on the fact that the firing rate of the network rectifies the input. Although traditionally neurons have been considered as threshold units, in recent computational and physiological studies, background activity was seen to smooth the input–output relationship of neurons, approximating half-wave rectification (Anderson et al., 2000; Hôand Destexhe, 2000). This half-wave rectification allows nontrivial computations. Computations based on this mechanism rely on the presence of inhibition. It is interesting to note in this respect that the inhibitory reversal potential of GABAA currents are not strongly hyperpolarizing but close to the resting potential. This prevents neurons from becoming too hyperpolarized when inhibited. Stronger hyperpolarization would increase the response latency once inhibition is relieved because neurons are further from threshold. Shunting at relatively high inhibitory reversal potentials prevents high response latencies and keeps the neurons in the operating regimen of the rate mode.
This study has considered only feedforward networks. It has been argued that input from feedback connections takes time to develop and therefore can be neglected in the early response. Our results imply that neurons that form feedback loops are also rapidly activated (Panzeri et al., 2001). The minimal delay of a feedback loop is the sum of the synaptic delays and the conduction delay and could be on the order of 10 msec. Fast-acting feedback has been observed in previous experiments (Hupé et al., 2001).
The presented model resembles previous studies of single layer networks (Tsodyks and Sejnowski, 1995; Shadlen and Newsome, 1998; Gerstner, 1999) in that noise sets the operating regimen of the network. Although the noise yields realistic spike time variability, the noise decreases the signal-to-noise ratio and it necessitates long integration times. From these previous studies, this seems problematic in systems in which signals need to be processed accurately and rapidly (Van Rullen and Thorpe, 2001). In multilayer architectures, these problems are accentuated, rendering these networks seemingly unsuitable for sensory computation. A suggested solution of using many parallel neurons is inefficient (Shadlen and Newsome, 1998). This study, however, shows that rate coding in multilayer networks is possible provided the noise is correctly tuned. Although the noise is a requirement for rate mode propagation, the computational cost of the noise is small. The rate mode allows for fast transmission, because intermediate layers do not temporally integrate the input before the signal is sent on to the next layer. Only a single temporal integration (lasting perhaps 10–50 msec) at the final stage is required.
The number of neurons per layer can be small (∼20). In accordance with physiology, the synaptic connections are strong; maybe only ∼20 active inputs are required to fire a neuron (Otmakhov et al., 1993). However, the number of synapses onto a cortical neuron is typically much larger. When all inputs are active, this leads to the known paradox that, despite the large number of strong inputs, neurons are not saturated and fire in an irregular manner (Softky and Koch, 1993; Shadlen and Newsome, 1998). Without more detailed knowledge, the final answer remains unknown, but mechanisms such as (balanced) inhibition, synaptic depression, and spike frequency adaptation probably should be taken into account.
We finally note that the rate mode studied here differs drastically from the synfire chain (Abeles, 1991), in which spiking activity synchronizes (Marsalek et al., 1997;Burkitt and Clark, 1999; Diesmann et al., 1999). Interestingly, there is no sharp transition between these very different modes of propagation, both of which are relatively stable against parameter variability. Biologically, which mode dominates could depend on parameters such as background activity, anesthesia, and brain region. The results also open the possibility that the propagation mode is actively regulated by changes in background activity.
We calculate how firing rates are transmitted from layer to layer in the idealized case that each neuron emits only one spike. This is appropriate for brief transient stimuli. Consider the transmission from one layer (termed presynaptic) to the next (postsynaptic). Assuming that the synapses are infinitely fast and the postsynaptic neuron has no leak, a simple counting argument yields the distribution of the postsynaptic spike time given the presynaptic spike time distribution ppre(t) (Marsalek et al., 1997). Given that the postsynaptic cell needs at least nt presynaptic spikes out of n inputs to fire, the postsynaptic spike time distribution is as follows:
where 𝒫(t) denotes the cumulative spike time distribution, 𝒫(t) = ∫ p(t). Differentiation with respect to t yields (Burkitt and Clark, 1999) the following:
Using this, it can be shown that, when many neurons converge onto a postsynaptic neuron, the output distribution is in most cases narrower than the input distribution, i.e., the response synchronizes (Marsalek et al., 1997).
Next, consider a population of postsynaptic neurons, all receiving some arbitrary small background current. Because the postsynaptic neurons have no leak, the membrane potentials are distributed uniformly between rest and threshold. As a result, the number of presynaptic spikes needed for a postsynaptic spike varies. Suppose that the synapses are tuned such that, from resting potential, precisely n inputs are required for the neuron to fire, i.e., the charge per synaptic event Qsyn = Qthr/ n, where Qthr is the charge required to fire the neuron from resting potential. The postsynaptic spike-times are now distributed as the following:
Meaning that, in this idealized case without synaptic or axonal delays, the output distribution statistically (in the limit of infinitely many, independent neurons per layer) equals the input distribution. The activity then propagates without any latency or distortion.
Footnotes
This work was supported by the Sloan-Swartz Center for Theoretical Neurobiology and National Institutes of Health Grants NS 36853 and EY 11115 and National Science Foundation Grant IBN 9726944. We gratefully acknowledge discussions with Larry Abbott, Matteo Carandini, Wulfram Gerstner, Alfonso Renart, Rob de Ruyter van Steveninck, and Robert Smith.
Correspondence should be addressed to Mark C. W. van Rossum, Department of Biology, MS 008, Brandeis University, 415 South Street, Waltham, MA 02454-9110. E-mail:vrossum@brandeis.edu.
REFERENCES
- 1.Abeles M. Corticonics: neural circuits of the cerebral cortex. Cambridge UP; Cambridge, MA: 1991. [Google Scholar]
- 2.Adrian ED. The basis of sensation. Christophers; London: 1928. [Google Scholar]
- 3.Anderson JS, Lampl I, Gillespie DC, Ferster D. The contribution of noise to contrast invariance of orientation tuning in cat visual cortex. Science. 2000;290:1968–1972. doi: 10.1126/science.290.5498.1968. [DOI] [PubMed] [Google Scholar]
- 4.Barlow HB. Single units and sensation: a neuron doctrine for perceptual psychology? Perception. 1972;1:371–394. doi: 10.1068/p010371. [DOI] [PubMed] [Google Scholar]
- 5.Bekkers JM, Richerson GB, Stevens CF. Origin of variability in quantal size in cultured hippocampal neurons and hippocampal slices. Proc Natl Acad Sci. 1990;87:5359–5362. doi: 10.1073/pnas.87.14.5359. [DOI] [PMC free article] [PubMed] [Google Scholar]
- 6.Burkitt AN, Clark GM. Analysis of integrate-and-fire neurons: synchronization of synaptic input and output spike. Neural Comp. 1999;11:871–901. doi: 10.1162/089976699300016485. [DOI] [PubMed] [Google Scholar]
- 7.Deneve S, Latham PE, Pouget A. Reading population codes: a neural implementation of ideal observers. Nat Neurosci. 1999;2:740–745. doi: 10.1038/11205. [DOI] [PubMed] [Google Scholar]
- 8.Diesmann M, Gewaltig MO, Aertsen A. Stable propagation of synchronous spiking in cortical neural networks. Nature. 1999;402:529–533. doi: 10.1038/990101. [DOI] [PubMed] [Google Scholar]
- 9.Fukushima K. Neocognitron: a self-organising multi-layered neural network. Biol Cybern. 1980;20:121–136. [Google Scholar]
- 10.Galarreta M, Hestrin S. Spike transmission and synchrony detection in networks of GABAergic interneurons. Science. 2001;292:2295–2299. doi: 10.1126/science.1061395. [DOI] [PubMed] [Google Scholar]
- 11.Gautrais J, Thorpe S. Rate coding versus temporal order coding: a theoretical approach. Biosystems. 1998;48:57–65. doi: 10.1016/s0303-2647(98)00050-1. [DOI] [PubMed] [Google Scholar]
- 12.Georgopoulos AP, Schwartz AB, Kettner RE. Neuronal population coding of movement direction. Science. 1986;233:1416–1419. doi: 10.1126/science.3749885. [DOI] [PubMed] [Google Scholar]
- 13.Gerstner W. Population dynamics of spiking neurons: fast transients, asynchronous state, and locking. Neural Comp. 1999;12:43–89. doi: 10.1162/089976600300015899. [DOI] [PubMed] [Google Scholar]
- 14.Gray CM, Konig P, Engel AK, Singer W. Oscillatory responses in cat visual cortex exhibit inter-columnar synchronization which reflects global stimulus properties. Nature. 1989;338:334–337. doi: 10.1038/338334a0. [DOI] [PubMed] [Google Scholar]
- 15.Hô N, Destexhe A. Synaptic background activity enhances the responsiveness of neocortical pyramidal neurons. J Neurophysiol. 2000;84:1488–1496. doi: 10.1152/jn.2000.84.3.1488. [DOI] [PubMed] [Google Scholar]
- 16.Holt GR, Softky WR, Koch C, Douglas RJ. Comparison of discharge variability in vitro and in vivo in cat visual neurons. J Neurophysiol. 1996;75:1806–1814. doi: 10.1152/jn.1996.75.5.1806. [DOI] [PubMed] [Google Scholar]
- 17.Hupé JM, James AC, Girard P, Lomber SG, Payne BR, Bullier J. Feedback connections act on the early part of the responses in monkey visual cortex. J Neurophysiol. 2001;85:134–145. doi: 10.1152/jn.2001.85.1.134. [DOI] [PubMed] [Google Scholar]
- 18.Kempter R, Gerstner W, van Hemmen JL, Wagner H. Extracting oscillations: neuronal coincidence detection with noisy periodic spike input. Neural Comp. 1998;10:1987–2017. doi: 10.1162/089976698300016945. [DOI] [PubMed] [Google Scholar]
- 19.Knight BW. Dynamics of encoding in a population of neurons. J Gen Physiol. 1972a;59:734–766. doi: 10.1085/jgp.59.6.734. [DOI] [PMC free article] [PubMed] [Google Scholar]
- 20.Knight BW. The relationship between the firing rate of a single neuron and the level of activity in a population of neurons. J Gen Physiol. 1972b;59:767–778. doi: 10.1085/jgp.59.6.767. [DOI] [PMC free article] [PubMed] [Google Scholar]
- 21.Maass W, Natschläger T. A model for fast analog computation based on unreliable synapses. Neural Comp. 2000;12:1679–1704. doi: 10.1162/089976600300015303. [DOI] [PubMed] [Google Scholar]
- 22.Marsalek PR, Koch C, Maunsell J. On the relationship between synaptic input and spike output jitter in individual neurons. Proc Natl Acad Sci. 1997;94:735–740. doi: 10.1073/pnas.94.2.735. [DOI] [PMC free article] [PubMed] [Google Scholar]
- 23.Maunsell JH, Ghose GM, Assad JA, McAdams CJ, Boudreau CE, Noerager BD. Visual response latencies of magnocellular and parvocellular LGN neurons in macaque monkeys. Vis Neurosci. 1999;16:1–14. doi: 10.1017/s0952523899156177. [DOI] [PubMed] [Google Scholar]
- 24.Nicolelis MAL, Ghazanfar AA, Stambaugh CR, Olieviera LMO, Laubach M, Chapin JK, Nelson RJ, Kaas JH. Simultaneous encoding of tactile information by three primate cortical areas. Nat Neurosci. 1998;1:621–630. doi: 10.1038/2855. [DOI] [PubMed] [Google Scholar]
- 25.Nowak LG, Bullier J. The timing of information transfer in the visual system. In: Rockland KS, Kaas JH, Peters A, editors. Extrastriate cortex in primates, Vol 12, Cerebral cortex. Plenum; New York: 1997. pp. 205–241. [Google Scholar]
- 26.Otmakhov N, Shirke AM, Malinow R. Measuring the impact of probabilistic transmission on neuronal output. Neuron. 1993;10:1101–1111. doi: 10.1016/0896-6273(93)90058-y. [DOI] [PubMed] [Google Scholar]
- 27.Panzeri S, Rolls ET, Battaglia F, Lavis R. Speed of feedforward and recurrent processing in multilayer networks of integrate-and-fire neurons. Network Comput Neural Syst. 2001;12:423–440. [PubMed] [Google Scholar]
- 28.Paradiso MA. A theory for the use of visual orientation information which exploits the columnar structure of striate cortex. Biol Cybern. 1988;58:35–49. doi: 10.1007/BF00363954. [DOI] [PubMed] [Google Scholar]
- 29.Perona P, Malik J. Scale-space and edge detection using anisotropic diffusion. IEEE Trans Pattern Anal Machine Intell. 1990;12:629–639. [Google Scholar]
- 30.Raiguel SE, Xiao D-K, Marcar VL, Orban GA. Response latency of macaque area MT/V1 neurons and its relationship to stimulus parameter. J Neurophysiol. 1999;82:1944–1956. doi: 10.1152/jn.1999.82.4.1944. [DOI] [PubMed] [Google Scholar]
- 31.Reichardt W. Autokorrelationsauswertung als Funktionsprinzip des Nervensystems. Z Naturforsch. 1957;12b:448–457. [Google Scholar]
- 32.Rice SO. Mathematical analysis of random noise. Bell Syst Tech J. 1944;24:46–156. [Google Scholar]
- 33.Rieke F, Warland D, Steveninck R, Bialek W. Spikes: exploring the neural code. MIT; Cambridge, MA: 1996. [Google Scholar]
- 34.Riesenhuber M, Poggio T. Hierarchical models of object recognition in cortex. Nat Neurosci. 1999;2:1019–1025. doi: 10.1038/14819. [DOI] [PubMed] [Google Scholar]
- 35.Saul AB, Humphrey AL. Evidence of input from lagged cells in the lateral geniculate nucleus to simple cells in cortical area 17 of the cat. J Neurophysiol. 1992;68:1190–1208. doi: 10.1152/jn.1992.68.4.1190. [DOI] [PubMed] [Google Scholar]
- 36.Schmolesky MT, Wang Y, Hanes DP, Leutgeb S, Schall JB, Leventhal AG. Signal timing across the macaque visual system. J Neurophysiol. 1998;79:3272–3278. doi: 10.1152/jn.1998.79.6.3272. [DOI] [PubMed] [Google Scholar]
- 37.Shadlen MN, Newsome WT. The variable discharge of cortical neurons: implications for connectivity, computation, and information coding. J Neurosci. 1998;18:3870–3896. doi: 10.1523/JNEUROSCI.18-10-03870.1998. [DOI] [PMC free article] [PubMed] [Google Scholar]
- 38.Smith DR, Smith GK. A statistical analysis of the continual activity of single cortical neurons in the cat unanesthetized forebrain. Biophys J. 1965;5:47–74. doi: 10.1016/s0006-3495(65)86702-9. [DOI] [PMC free article] [PubMed] [Google Scholar]
- 39.Softky WR, Koch C. The highly irregular firing of cortical cells is inconsistent with temporal integration of random EPSPs. J Neurosci. 1993;13:334–350. doi: 10.1523/JNEUROSCI.13-01-00334.1993. [DOI] [PMC free article] [PubMed] [Google Scholar]
- 40.Stein RB. The information capacity of nerve cells using a frequency code. Biophys J. 1967;7:797–826. doi: 10.1016/S0006-3495(67)86623-2. [DOI] [PMC free article] [PubMed] [Google Scholar]
- 41.Suarez H, Koch C, Douglas R. Modeling direction selectivity of simple cells in striate visual cortex within the framework of the canonical microcircuit. J Neurosci. 1995;15:6700–6719. doi: 10.1523/JNEUROSCI.15-10-06700.1995. [DOI] [PMC free article] [PubMed] [Google Scholar]
- 42.Thorpe S, Fize D, Marlot C. Speed of processing in the human visual system. Nature. 1996;381:520–522. doi: 10.1038/381520a0. [DOI] [PubMed] [Google Scholar]
- 43.Tsodyks MV, Sejnowski TJ. Rapid state switching in balanced cortical network models. Network. 1995;6:111–124. [Google Scholar]
- 44.van Rossum MCW. The transient precision of integrate and fire neurons; effect of background activity and noise. J Comp Neurosci. 2001;10:303–311. doi: 10.1023/a:1011268215708. [DOI] [PubMed] [Google Scholar]
- 45.Van Rullen R, Thorpe SJ. Rate coding versus temporal coding: what the retinal ganglion cells tell the visual cortex. Neural Comp. 2001;13:1255–1283. doi: 10.1162/08997660152002852. [DOI] [PubMed] [Google Scholar]
- 46.van Santen JPH, Sperling G. Temporal covariance model of human motion perception. J Opt Soc Am A. 1984;1:451–473. doi: 10.1364/josaa.1.000451. [DOI] [PubMed] [Google Scholar]
- 47.van Vreeswijk C, Sompolinsky H. Chaos in neuronal networks with balanced excitatory and inhibitory activity. Science. 1996;274:1724–1726. doi: 10.1126/science.274.5293.1724. [DOI] [PubMed] [Google Scholar]
- 48.Wilson HR, Cowan JD. Excitatory and inhibitory interactions in localized populations of model neurons. Biophys J. 1972;12:1–24. doi: 10.1016/S0006-3495(72)86068-5. [DOI] [PMC free article] [PubMed] [Google Scholar]