

Abstract
Phasic transmitter release at synapses in the mammalian CNS is regulated by local [Ca2+] transients, which control the fusion of readily releasable vesicles docked at active zones (AZs) in the presynaptic membrane. The time course and amplitude of these [Ca2+] transients critically determine the time course and amplitude of the release and thus the frequency and amplitude tuning of the synaptic connection. As yet, the spatiotemporal nature of the [Ca2+] transients and the number and location of release-controlling Ca2+ channels relative to the vesicles, the “topography” of the release sites, have remained elusive. We used a time-dependent model to simulate Ca2+ influx, three-dimensional buffered Ca2+ diffusion, and the binding of Ca2+ to the release sensor. The parameters of the model were constrained by recent anatomical and biophysical data of the calyx of Held. Comparing the predictions of the model with previously measured release probabilities under a variety of experimental conditions, we inferred which release site topography is likely to operate at the calyx: At each AZ one or a few clusters of Ca2+ channels control the release of the vesicles. The distance of a vesicle to the cluster(s) varies across the multiple release sites of a single calyx (ranging from 30 to 300 nm; average ∼100 nm). Assuming this topography, vesicles in different locations are exposed to different [Ca2+] transients, with peak amplitudes ranging from 0.5 to 40 μm (half-width ∼400 μsec) during an action potential. Consequently the vesicles have different release probabilities ranging from <0.01 to 1. We demonstrate how this spatially heterogeneous release probability creates functional advantages for synaptic transmission.
Keywords: active zone, buffer, diffusion, glutamate, heterogeneity, synapse, transmitter release, vesicle, domain
During fast synaptic transmission the release of neurotransmitter from vesicles in presynaptic terminals is controlled by calcium ions (Ca2+) (Katz, 1969). Brief influx of Ca2+ through voltage-gated channels causes a transient rise in the intracellular concentration of Ca2+([Ca2+]). Within <1 msec this rise in [Ca2+] causes vesicles to fuse with the presynaptic membrane, releasing transmitter. The transient rise in [Ca2+] is less pronounced with increasing distance from the Ca2+channels. Therefore, a vesicle (i.e., the Ca2+ sensor controlling its release) must be located sufficiently close to one or more Ca2+ channels. The exact distance between channels and vesicles critically determines the time course and amplitude of the [Ca2+] signal at the vesicles and thus determines the time course and amplitude of the release rate (Augustine and Neher, 1992). Therefore, understanding the functional and spatial organization of the release-controlling Ca2+ channels relative to vesicles (henceforth “topography of release sites”) is crucial for a quantitative description of synaptic transmission itself (Augustine, 2001).
Because direct measurements of the local [Ca2+] transients are not (yet) available, our understanding of the local [Ca2+] dynamics during action potentials (APs) must rely on experimental data on release and on quantitative models (Neher, 1998a). A number of studies have investigated the significance of channel/vesicle location (Yamada and Zucker, 1992;Cooper et al., 1996; Gil et al., 2000), some of them quantifying release on the basis of measured Ca2+sensitivity of the release-controlling Ca2+ sensor (Chow et al., 1994; Klingauf and Neher, 1997; Bennett et al., 2000). However, the considerable number of poorly known parameters in the models often has defeated attempts to derive with certainty the topography of release sites (Neher, 1998a).
We present a time-resolved model that simulates Ca2+ influx, three-dimensional buffered Ca2+ diffusion, and the binding of Ca2+ to the release sensor for the calyx of Held (henceforth, calyx), a giant terminal in the medial nucleus of the trapezoid body (MNTB) of mammalian brainstem (Forsythe et al., 1995). The model is based on recent anatomical and biophysical data, which constrain key parameters of the simulations. We infer the topography of release sites by comparing simulated transmitter release with previous experimental data (effects of added exogenous Ca2+ buffers BAPTA and EGTA as well as effects of altered Ca2+ channel gating). The topographic analysis indicates that the “readily releasable” pool of vesicles is heterogeneous with respect to its release probability. Heterogeneous release probability of vesicles has been observed at the calyx (Wu and Borst, 1999; Sakaba and Neher, 2001b). We show that, other than being an intrinsic property of the release apparatus, the heterogeneity may arise to a large extent from variability in the distances between vesicles and release-controlling Ca2+ channels at different release sites of a single calyx.
Our model reproduces the experimental data, including previously unexplained effects of exogenous Ca2+buffers, only if the spatial nonuniformity is included explicitly in the calculations (discussed in Quastel et al., 1992). To demonstrate further the functional significance of the proposed nonuniformity, we investigated its effects on synaptic delay and on release during consecutive APs.
MATERIALS AND METHODS
Inferring the topography
The model simulates the time course (0–5 msec for a single AP; room temperature) of Ca2+ influx, three-dimensional buffered Ca2+ diffusion, and phasic transmitter release for a calyx at the developmental stage postnatal days 8–10. Parameters in the simulations were constrained by electrophysiological and morphological measurements of the calyx (Table1). The only remaining crucial but unknown parameters were the conductance of single Ca2+ channels and the channel–vesicle topography at release sites. We assumed a topography and then set the single Ca2+ channel conductance such that the predicted release probability for physiological conditions is the same as that observed in the experiments (see Results for values). We then simulated release under nonphysiological conditions: added exogenous Ca2+ buffers, lowered [Ca2+] of the extracellular solution, and reduced open probability of Ca2+channels (using, for each topography, the same single channel conductance as that used for the physiological condition). The predicted effects of the nonphysiological conditions on release critically depend on the assumed topography. Testing different hypothetical topographies, we compared the results of the model with the experimental data (Table 2) and thus inferred whether a particular topography is likely to be present at the calyx or not.
Table 1.
Experimental calyx data used to constrain model parameters
| Calyx volume1-a | 400 μm3* | ‡; Helmchen et al., 1997 |
| Calyx membrane surface1-a | 2400 μm2* | ‡ |
| Calyx height1-a,1-b | 400 nm* | ‡ |
| Percentage of calyx surface identified as AZ1-a | 2%* | ‡ |
| Number of AZs1-a,1-c | 500-600* | ‡ |
| Diffusional separation of any AZ to its nearest neighbor1-a | 200–1000 nm (median = 400 nm) | ‡ |
| Size of AZs (approximated as circular patches of varying radii)1-a,1-d | 0.052 ± 0.024 μm2 (SD) mean radius, 125 nm | ‡; also see Rowland et al., 2000 |
| Total Ca2+ influx during single, physiological AP | 0.93 pC = 12 μm in 400 μm3 | Helmchen et al., 1997 |
| Endogenous Ca2+ binding ratio | 40 (2.5% of ions remain free) | Helmchen et al., 1997 |
| Δ[Ca2+] during single AP1-e | From 50 (resting) to 379 nm | Helmchen et al., 1997 (Fig.7B) |
| Whole-cell Ca2+ current (ICa) | Peak = 2.41 nA half-widtht0.5 = 383 μsec | Borst and Sakmann, 1998 (see Fig. 6A for time course) |
| Voltage-dependent gating of Ca2+ channels and channel current1-f | Two-gate Hodgkin–Huxley model | see Borst and Sakmann (1998)for parameter values |
| Ca2+ sensitivity of release1-g | Five-site independent, model A | Bollmann et al., 2000 (Fig. 1) |
| Five-site cooperative, model B | Schneggenburger and Neher, 2000 | |
| Pr, calyx of undialyzed calyx1-h | Model A: 25% (of 800 vesicles) | Bollmann et al., 2000 |
| Model B: 10% (of 2000 vesicles) | Schneggenburger and Neher, 2000 |
Parameters do not (directly) affect calculations of local [Ca2+] transients or Pr but volume average [Ca2+] and estimates of channel density only (see Materials and Methods, Discussion).
Sätzler, Söhl, Bollmann, Borst, Frotscher, Sakmann, and Lübke, unpublished data.
Anatomical parameters taken from an EM-based three-dimensional reconstruction of a single calyx (rat, postnatal day 9). Average anatomy during postnatal days 8–10 may deviate from this example. Parameters for the model calyx in Table 1are chosen such that they are internally consistent (e.g., not combining above-average whole-cell Ca2+ current with below-average calyx volume).
“Height” means the average distance between membrane facing the cleft and that opposite the cleft; consider calyx as a thin disk with surface 1000 μm2 at top/bottom, height ∼400 nm, and volume 400 μm3.
Corresponding to an average of 1.3 (Release Model A) or 3.3 (Release Model B) readily releasable vesicles docked per AZ.
The value is smaller than that reported by Sätzler, Söhl, Bollmann, Borst, Frotscher, Sakmann, and Lübke (unpublished data). The latter includes uneven surface of the AZs, which does not contribute to diffusional distance.
379 nm is the equilibrium [Ca2+] after adding 12 μm free Ca2+ to the calyx (with ATP and endogenous fixed buffer).
For all simulations, single Ca2+ channel currents were predicted with a two-gate HH model calibrated to the calyx (see Materials and Methods). Only for the nonperiodic grid topography, a third gate was added to the channel model (see Property II).
All conclusions presented in this paper were tested with two release models for the calyx: a kinetic release model with five independent binding sites (Release Model A) and one with five cooperative (sequential) binding sites (Release Model B). The number of quanta released during physiological APs was the same in both studies (200). Figure 1 shows a direct comparison of the Ca2+ sensitivities of the models.
Pr, calyxdenotes the release probability during single AP, defined throughout this paper as the total number of vesicles (as fraction of the readily releasable pool) that are released in response to a single AP (phasic release only).
Table 2.
Experimental calyx data used to infer topography of release sites
| Pr, calyx of calyx dialyzed with exogenous buffers2-a | 0.2 mm EGTA: 25 ± 2.5% (SEM) | Borst and Sakmann, 1996 |
| 1 mm EGTA: 16.5 ± 1.7% | ||
| 10 mm EGTA: 11.3 ± 2.4% | ||
| 0.05 mm BAPTA: 25 ± 3.8% (SEM) | Borst et al., 1995 | |
| 1 mm BAPTA: 8.6 ± 0.9% | ||
| 10 mm BAPTA: <1%2-b | (model results: Fig.9A) | |
| Apparent Hill coefficient:Pr, calyx ∝ (∫ICa·dt)n, when reducing [Ca2+]ex2-c | n= 2.2–3.5 | Barnes-Davies and Forsythe, 1995;Borst and Sakmann, 1999a; Wu et al., 1999(model results: Fig. 9B) |
| Pr, calyx ∝ (∫ICa·dt)m, when reducing channel open probability by AP waveforms2-d | m = 3–3.5 | Borst and Sakmann, 1999a (model results: Fig.6B) |
| Pr, calyx ∝ (∫ICa·dt)m, when partially blocking P/Q-type Ca2+channels | m = 3.7 ± 0.2 (SEM) | Wu et al., 1999 |
In the referenced studies, calyces dialyzed with small concentrations of exogenous buffer (0.2 mm EGTA or 0.05 mm BAPTA) had the samePr, calyx (within errors) as before dialyzing (control). Pr, calyx given here is for Release Model A (control: 25%). For Release Model B (control: 10%), scalePr, calyx accordingly.
Implied phasic release probability during APs as estimated from Borst and Sakmann (1999b).
Note that, instead ofPr, calyx, experimental studies usually use EPSC amplitude as a measure for release. For the fast phasic component of AP-evoked release, EPSCpeak ∝Pr, calyx. Some studies report n for release versus [Ca2+] of the extracellular solution ([Ca2+]ex) (for either varying or adjusted [Mg2+]ex) or versus ICa, peak. However, ∫ICa·dt ∝ICa, peak ∝ [Ca2+]ex (approximately), when [Ca2+]ex is reduced from 2 to 0.25 mm (Borst and Sakmann, 1996; Helmchen et al., 1997; Schneggenburger et al., 1999).
The nomenclature of m andn, which measure Ca2+ channel cooperativity and/or Ca2+ cooperativity, follows that in Wu et al. (1999) (n = 2.7). See Results for additional explanation.
Numerical simulations
In the simulations the calyx volume was split up into subcompartments (“reaction volumes”) of identical size around active zones (AZs; see Results for dimensions). For the periodic grid topography (see Results), boundary conditions (to adjoining compartments) for the buffered diffusion were periodic (side walls only). For all other simulations the boundaries were “closed,” and the location of the channel cluster and the vesicles on the AZ, the radius of the circular AZ, as well as the stochastic Ca2+ currents through channels were different in each subcompartment (see Results). Dimensions of the compartments were chosen sufficiently large so that reflections of Ca2+ at the walls affect only volume average [Ca2+] but not local [Ca2+] near the vesicles (see below). The local [Ca2+] transients around individual AZs in the model were assumed to be independent. The model was implemented as Ansi C code, running on a Silicon Graphics Oregon 2000 computer (processor MIPS RP1200, 300 MHz). A single simulation (0–5 msec) took ∼45 min to complete.
Hodgkin–Huxley model for Ca2+ channel gating and time course of ICa
To simulate Ca2+ influx through individual channels in response to APs, the model uses a two-gate Hodgkin–Huxley model with parameters that were fit for the calyx. The gates of the channels and the resulting currents are driven by AP waveforms (equations and parameters as in Borst and Sakmann, 1998). For some simulations with low channel open probability, a third gate was added (see Results). As the time course for Ca2+ entry at each channel location [iCa(t)], the simulations used either the “uniform iCa mode” or the “stochastic iCa mode.” In the uniform iCa mode all channels are “open” and iCa(t) is the same for all channels, with a time course matching that of the whole-cell Ca2+ current (predicted by the Hodgkin–Huxley Model). In the stochasticiCa mode the model variesiCa(t) for each channel stochastically. In this mode the individual channel locations contribute differentiCa(t), and some remain closed. Individual iCa(t) are simulated by using Monte Carlo-type pseudo-stochastic sampling to determine the open and closed times of the two gates [random number generator, ran(2) (Press et al., 1988); time step foriCa(t), 1 μsec]. Whenever a channel is open, the current is given according to the electrical driving force and the conductance. Single channel conductance was varied for different topographies (see above) but was the same for all channels. Note that values for single channel conductance given in Results refer to open channels, whereas values for channel current iCa [given as the peak amplitude ofiCa(t),iCa, peak] refer to the average across all open or closed channels. To simulate experiments with reduced [Ca2+] of the extracellular solution, we reduced the channel conductance to match the reduction of whole-cell ICa observed in the experiments.
Buffered diffusion of Ca2+
At time 0, Ca2+ and buffers were at resting concentrations and at spatial equilibrium. Standard equations (3.20–3.23 in Smith, 2001) for diffusion and buffering were solved numerically (forward Euler finite difference). We assumed unrestricted diffusion of Ca2+ and buffers around AZs (i.e., barriers, particularly nondocked vesicles in the vicinity of AZs, were neglected). To validate the unrestricted diffusion assumption (Glavinovic and Rabie, 2001) for the calyx, we analyzed the three-dimensional reconstruction of 31 of the ∼600 AZs (K. Sätzler, L. Söhl, J. Bollmann, J. Borst, M. Frotscher, B. Sakmann, and J. Lübke, unpublished data). In a dome-like control volume around each AZ (200 nm distance from the edge of the control volume to the nearest point on AZ), there were, on average, 62 vesicles (not docked, i.e., not readily releasable). These vesicles occupied ∼6% of the dome-like control volume. Therefore, their effect as diffusion barriers is negligible.
Only for the simulation of consecutive APs (see Results), a linear extrusion mechanism was used, which reduces the [Ca2+] of each voxel separately by ([Ca2+] − [Ca2+]rest)·γ·Δtper time step, where [Ca2+]rest = 50 nm (see below), γ = 400 Hz is the pump rate, and Δt is the time step.
Spatial resolution was as follows: (5 nm)3voxels for the first six layers on the membrane (0–30 nm), (10 nm)3 for 30–90 nm, and (20 nm)3 for the remainder. After 1.5 msec, when [Ca2+] gradients have dissipated, spatial resolution was decreased by collapsing neighboring voxels into (10 nm)3, (20 nm)3, and (40 nm)3. For those voxels (of the first layer) located “above” the presumed Ca2+ channels, Δ[Ca2+] =iCa(t)·Δt/(V·F) per time step was added to [Ca2+] of the voxel (Δt, time step; V, voxel volume; F, Faraday's constant). Time step was 10 fsec to 0.68 nsec, such that the relative change in concentration of any substance in any voxel during any time step did not exceed ±1% (autoadaptive);dtmax = 0.15·(dx)2/220 μm2/sec, where dx = 5 nm for times up to 1.5 msec and 10 nm thereafter.
Unless otherwise indicated, the model solution contained (control condition): free Ca2+ at a starting concentration of [Ca2+]rest = 50 nm (Helmchen et al., 1997) and diffusion coefficientDCa = 220 μm2/sec (Albritton et al., 1992); endogenous fixed buffer (termed EFB, unspecified identity, single Ca2+ binding site) with a binding ratio of 40 (Helmchen et al., 1997), total concentration [EFB]total = 80 μm, affinity KD = 2 μm (varied in sensitivity analyses between 200 nm and 200 μm; see below), and a forward Ca2+ binding rate,kon = 5·108 per Msec (Klingauf and Neher, 1997) (sensitivity analysis below); ATP with [ATP]total = 0.58 mm,KD, Ca = 200 μm, kon, Ca = 5·108 per Msec (Baylor and Hollingworth, 1998) (with kon, Ca corrected for temperature; sensitivity analysis below),DATP = 220 μm2/sec. Kinetic parameters of ATP are for the binding of ATP to Ca2+ only (not Mg2+). The presence of 4 mm Mg-ATP in the pipette during the experiments (Borst et al., 1995) was accounted for by reducing the concentration of total ATP available for Ca2+ binding to 0.58 mm. The remaining ATP was assumed to stay bound to Mg2+ during the [Ca2+] transient (KD, Mg = 100 μm) and thus unavailable for Ca2+ buffering (slow off-rate of Mg-ATP,koff, Mg = 150–390/sec; Baylor and Hollingworth, 1998). For some simulations, mobile exogenous buffers were added at varying concentrations: BAPTA (kon = 4·108 per Msec,KD = 220 nm, DBAPTA = 220 μm2/sec; Naraghi and Neher, 1997) and EGTA. The binding kinetics of EGTA are strongly pH-dependent. We thus used two sets of parameters: “EGTA” (kon = 10·106 per Msec,KD = 70 nm;Nägerl et al., 2000) or “EGTA-2” (kon = 2.5·106 per Msec,KD = 180 nm;Naraghi and Neher, 1997). DEGTA =DEGTA-2 = 220 μm2/sec.
Because the buffered diffusion algorithm uses neither the steady-state assumption nor the rapid buffer or the linearized buffer approximation, it correctly simulates any local/global depletion of unbound buffers (“buffer saturation”; Naraghi and Neher, 1997). Because [Ca2+] in the simulations is generally low (micromolar range), mobile buffers deplete only marginally. For example, in the simulation with added 1 mm BAPTA (see Fig.7D), at the time of peak Ca2+influx and at the center of the channel cluster (where depletion is the strongest), the concentration of unbound BAPTA is still 90% of the volume average concentration (94% for unbound ATP). In contrast, unbound endogenous fixed buffer (EFB) is depleted locally because it binds Ca2+ without being replenished by diffusion. As a result, unbound EFB (at the cluster center and at the peak of the Ca2+ current) is depleted to 6% of the volume average concentration.
Fig. 7.
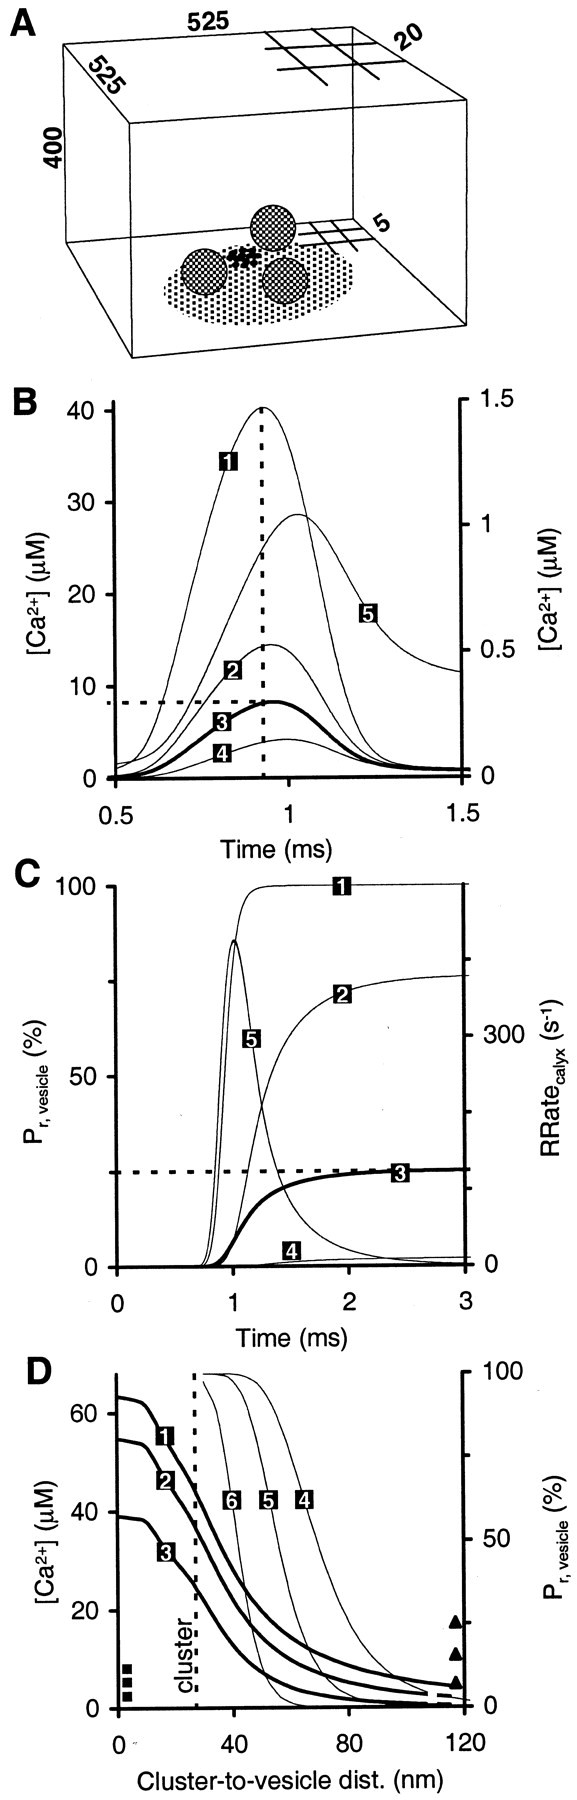
Heterogeneity of AP-evoked [Ca2+] transients and their effects on release probability. A, Reaction volume with the reference topography used in the simulation; all numbers are given in nanometers (not drawn to scale). Partial 5 and 20 nm grids indicate varying spatial resolution (see Materials and Methods). Shown is a Ca2+ channel cluster (12 channels; in first voxel layer on membrane) and readily releasable vesicles (three examples shown) on the AZ; AZs have variable size. The illustration shows one example of random placement of a cluster and vesicles at a single AZ.B, Time course of [Ca2+] for vesicles at different distances from the channel cluster. Trace 1, 30 nm from the center of the cluster. Trace 2, 60 nm from the center of the cluster. Trace 3, Average over all vesicles; peak, 8.2 μm, half-width, 391 μsec. Trace 4, 120 nm from the center of the cluster. Trace 5, Volume average [Ca2+] (right axis).Vertical dashed line indicates time of peakICa. C, Time course of cumulative release probability for single vesicle [Pr, vesicle(t)] at different distances (same simulation as in B). 1, 2, 4, Same distances as in A. 3, Average of Pr, vesicle across all vesicles (Pr, 5 msec = 25%). 5, Release rate of calyx (assuming pool size of 800; right axis). D, Spatial profiles of [Ca2+] (1–3, snapshot at time of peak ICa) and ofPr, vesicle (4–6, after 5 msec; right axis) under different buffer conditions [channel cluster centered at distance 0 nm, extending to distance 25 nm (vertical dashed line)]. 1, 4, Endogenous fixed buffer (EFB) and ATP (control condition). 2, 5, EFB, ATP, and 10 mm EGTA. 3, 6, EFB, ATP, and 1 mm BAPTA. Squares atleft axis indicate average [Ca2+] across all vesicles (8.1, 5.4, and 2.5 μm for control, EGTA, and BAPTA, respectively). Triangles atright axis indicate averagePr, vesicle across all vesicles (equalingPr, calyx; 25, 16, and 7.1% for control, EGTA, and BAPTA, respectively).
Net Ca2+ influx into calyx volume versus modeled subcompartments
In the reference topography simulating physiological conditions with Release Model A, the conductance was 14.52 pS per channel cluster, corresponding to an average ICa, peak= 0.66 pA per cluster. (The conductance for the simulations with the less Ca2+-sensitive Release Model B was 37.04 pS.) This corresponds to 0.26 fC or 12 μmunbuffered Ca2+ entering each subcompartment (volume, 0.110 μm3), thus increasing volume average [Ca2+] to 379 nm, as observed in experiments (see Table 1). The 600 subcompartments (for 600 AZs) contributed a total of 0.16 pC Ca2+ (per AP and assuming one cluster per AZ), which is 17% [42% in case of Release Model B] of the whole-cell value observed in experiments (see Table 1). The total modeled volume (600 subcompartments or ∼17% of 400 μm3) corresponds to this ratio. Therefore, the increase in volume average [Ca2+] in the subcompartments was the same as that experimentally observed for the whole calyx. This approach indirectly accounts for Ca2+ that enters through channels located away from release sites, assuming that these channels do not (significantly) affect local [Ca2+] transients at release sites but only the volume average [Ca2+] (see Discussion). To comply with the experimental measurement of volume average [Ca2+], Δ[Ca2+] was 12 μm in every simulation; whenever Ca2+ influx for the control condition was changed (for topographies other than the reference topography and for Release Model B; see Results), the volume of the subcompartments was adjusted accordingly. [The model does not include contributions to [Ca2+] from the release of Ca2+ from intracellular stores. At the calyx this contribution during a single AP is marginal at most (Helmchen et al., 1997).]
Release
We defined release probabilityPr (as a percentage) as the fraction of all readily releasable vesicles that are released during a single AP (phasic release only; see Table 1 for size of readily releasable pool). “Release site” is defined as the functional entity of one readily releasable vesicle and the one or more Ca2+ channels controlling its release. At the calyx (∼600 AZs) a single AZ contains, on average, more than one release site (Sätzler, Söhl, Bollmann, Borst, Frotscher, Sakmann, and Lübke, unpublished data). Although different release sites at the same AZ may be controlled by the same Ca2+ channels, the model assumes that release from individual sites is stochastically independent. Under this assumption more than one vesicle during a single AP may be released from a single AZ (Auger and Marty, 2000; Sun and Wu, 2001). However, a single release site can release at most one vesicle per AP (the model does not include recovery of the readily releasable pool). Because it is a relative measure, predicted Prdoes not depend on the total number of vesicles in the readily releasable pool (= number of release sites) nor on the number of AZs or the number of release sites per AZ.
To quantify Pr in response to a transient increase in [Ca2+], the model uses, alternately, two kinetic schemes (Fig.1): Release Model A (Bollmann et al., 2000) or Release Model B (Schneggenburger and Neher, 2000). Note that, because it is less Ca2+-sensitive, Release Model B predicts higher absolute [Ca2+] transients than Release Model A. However, relative spatial profiles of the transients are almost identical (marginal depletion of mobile buffers; see above). Therefore, the conclusions on the release site topography are valid for either release model. For clarity, figures generally show [Ca2+] transients andPr of simulations with Release Model A. Analogous results with Release Model B are given in the text only. At time 0, the Ca2+ binding sites of the sensors were equilibrated with [Ca2+]rest. The readily releasable pool was “full.” For each assumed vesicle location (location at which the membrane of the vesicle is closest to presynaptic membrane), the time course of the local [Ca2+] transient predicted by the reaction–diffusion scheme (measured in the voxel ∼10 nm above the presynaptic membrane) was translated into a release rate versus time. This was done for each vesicle individually, assuming that (1) release sites are independent and (2) binding of Ca2+ to the release-controlling Ca2+ sensor does not affect [Ca2+] (Yamada and Zucker, 1992). The differential equations of the model describing the relative state occupancies were solved numerically (forward Euler finite difference), using a variable time step such that, during any time step, the absolute change of the relative occupancy of any state was at most ±0.5%. The time integral (0–5 msec) of the release rate of an individual vesicle is Pr, vesicle. The (heterogeneous) release rates of individual vesicles were averaged into an average release rate versus time. The time integral of this rate (0–5 msec) is the predicted average release probability of all vesicles in the calyx (Pr, calyx). Different release site topographies predict differentPr, calyx because they correspond to different distributions of channel-to-vesicle distances for the readily releasable pool. The average release rate was converted to an EPSC, as described by Bollmann et al. (2000) (convolution of release rate with quantal EPSC).
Fig. 1.

Intrinsic Ca2+ sensitivity of transmitter release. Shown is Pr for a single vesicle when exposed to a [Ca2+] transient with a time course equal to that of whole-cellICa (full width at half-maximum, 383 μsec) and with a peak amplitude of [Ca2+]vesicle. The thin lines indicate release probability during APs according to Release Model A (Pr, vesicle = 25% at [Ca2+]vesicle = 8.8 μm; Bollmann et al., 2000) or Release Model B (Pr, vesicle = 10% at [Ca2+]vesicle = 35 μm; Schneggenburger and Neher, 2000).
Sensitivity of Pr to kinetics and concentrations of endogenous buffers
The model includes the mobile Ca2+buffer ATP as well as one fixed buffer. The fixed buffer simulates the effect of one or more not further identified fixed or poorly mobile buffers. We varied concentration and binding kinetics of the endogenous buffers to estimate the sensitivity of predictedPr to these parameters. Even drastic variations in the parameters of endogenous buffers (two to three orders of magnitude) do not change the predictedPr, calyx to a degree that would compromise our results on release site topography. The reference simulation for each parameter variation is the simulation for the reference topography (see Results; control condition,Pr, calyx = 25%).
Endogenous fixed buffer. We varied [EFB] between 10 and 10,000% of the reference value (80 μm) while adjustingKD, EFB such that [EFB]/KD, EFB (approximate binding ratio) was kept unchanged at 40. This variation changes the predictedPr, calyx between 41 and 18%, respectively. During an AP the EFB locally depletes/equilibrates with [Ca2+] (see above) and thus is rendered ineffective as a local sink for Ca2+. Therefore, EFB has only a small effect on the direct attenuation of the local [Ca2+] transients that control phasic release of transmitter. This shows that the predictions of the model of Pr are accurate even if the concentration of EFB in the presynaptic volume were not spatially uniform.
ATP. Two sets of parameter variations for ATP were investigated. (1) Keeping [ATP]/KD, ATPconstant, we changed both [ATP] and KD, ATP between 10 and 1000% of their respective reference values (see above). This changesPr, calyx between 37 and 22%, respectively. (2) Keeping [ATP]·kon(buffer) product constant, we changed both [ATP] and (inversely)kon, ATP, between 10 and 1000% of the reference values. This changesPr, calyx between 44% (low [ATP], high kon, ATP) and 12% (lowkon, ATP, high [ATP]). Complete removal of ATP from the model calyx results in Pr, calyx = 48%. For simulations with the added exogenous buffers EGTA or BAPTA, the presence of ATP changes the predictedPr, calyx even less because the effect of ATP is small compared with that of the exogenous buffer (see Fig. 4D).
Fig. 4.

Effect of Ca2+channel spacing on release probability. A, Reaction volume with the periodic grid topography used in the simulation; allnumbers are given in nanometers (not drawn to scale). Partial 5 and 20 nm grids indicate varying spatial resolution.Dashed lines indicate repetition of volume with the use of periodic boundary conditions (see Materials and Methods). Ca2+ channels are located on a uniform grid with grid constant d (example showsd = 60 nm). Readily releasable vesicles are located randomly anywhere on the membrane. B, Spatial profiles of [Ca2+] (traces 1–3, snapshot at time of peak ICa) and ofPr, vesicle (traces 4–6, after 5 msec; rightaxis) generated by ad = 60 nm regular grid of channels under different buffer conditions; single Ca2+ channel current the same as in D. Channels are at 30 and 90 nm.Traces 1, 4, Endogenous fixed buffer (EFB) and ATP (control condition). Traces 2, 5, EFB, ATP, and 10 mm EGTA. Traces 3, 6, EFB, ATP, and 1 mm BAPTA. Squares at left axis indicate average [Ca2+] across the membrane (7.4, 4.3, and 1.9 μm for control, EGTA, and BAPTA, respectively). Triangles atright axis indicate averagePr, vesicle (=Pr, calyx) across the membrane (25, 2.4, and 0.13% for control, EGTA, and BAPTA, respectively).C, Peaks of [Ca2+] transients for different grid constants and buffer conditions (1, 4,and 7; 2, 5, and 8;3, 6, and 9 as in B; single Ca2+ channel current same as inD). 1–3, Peak of transient at 10 nm above a channel. 4–6, Peak of average transient across the membrane. 7–9, Peak of transient at half-grid constant from two neighboring channels. D, Predicted average Pr, vesicle across the membrane (=Pr, calyx) as a function of grid constantd. Traces 1–6 showPr, calyx for six different buffer conditions. Trace 1, EFB and 50 μm BAPTA.Trace 2, EFB and ATP (control condition). Trace 3, EFB, ATP, and 10 mm EGTA-2. Trace 4, EFB, ATP, and 10 mm EGTA. Trace 5, EFB and 1 mm BAPTA. Trace 6, EFB, ATP, and 1 mm BAPTA. Trace 7, PeakiCa per channel required to achievePr, calyx ∼25% for the control condition (right axis).
RESULTS
In the first part of Results, we infer which channel–vesicle topography characterizes release sites at the calyx (developmental stage postnatal days 8–10). In the second part, we simulate the spatiotemporal pattern of AP-evoked [Ca2+] transients and of phasic transmitter release at the calyx. In the third part, we illustrate the functional significance of the proposed release site topography for synaptic transmission at this fast synapse.
Topography of release sites
Overview
Because the location of Ca2+ channels at the calyx is not known, there is a multitude of conceivable topographic arrangements of channels relative to readily releasable vesicles. We analyzed various topographies for their compatibility with measured phasic release probabilities (Pr) under different experimental conditions (Table 3): (1) reducing the [Ca2+] transients by dialyzing the calyx with exogenous Ca2+ buffers EGTA or BAPTA and (2) reducing the Ca2+ influx by altering the gating of the Ca2+channels.
Table 3.
Summary of findings on topography
| Single versus multiple channels per vesicle | Distance of vesicle from Ca2+ source | Consistent with effects of BAPTA and EGTA onPr | Consistent with apparent Hill coefficientm ∼ n |
|---|---|---|---|
| Single channel | Fixed | − | − |
| Variable | + | − | |
| Channel grid | Narrow grid | − | + |
| Wide grid | + | − | |
| Channel cluster(s) | Fixed | − | + |
| Variable | + | + |
(1) The efficacy of Ca2+ buffers in reducing the [Ca2+] transient around a Ca2+ channel depends on the diffusion distance from the channel (Neher, 1986). For the calyx it was found previously that there is no channel-to-vesicle distance, for which the theoretical efficacy of BAPTA versus EGTA is consistent with experimental data (Naraghi and Neher, 1997). Although we confirm this result, we find further that the observed buffer efficacies can be explained by assuming that the channel-to-vesicle distance is different for different release sites of the same calyx.
(2) When the open probability of Ca2+channels at the calyx is reduced, Pris reduced in a supralinear manner. On the basis of this experimental finding, it was concluded previously that the majority of readily releasable vesicles at the calyx is controlled by more than one Ca2+ channel per vesicle (Borst and Sakmann, 1999a). We find further that the multiple Ca2+ channels controlling a vesicle, rather than being distributed evenly in the membrane, are likely to be organized in clusters of Ca2+channels.
On the basis of these findings, we suggest that phasic transmitter release at the calyx is governed by the following nonuniform topography of release sites (henceforth “reference topography”). Readily releasable vesicles are controlled by clusters of Ca2+ channels, with one or a few clusters per AZ. For any one release site the distances between the vesicle and the individual channels of a cluster are similar. However, vesicles at different release sites are located at a broad range of distances from the channel cluster (average distance ∼100 nm; coefficient of variation > 0.5). Details of the findings on topography are explained below as Properties I–III.
Property I: The distance between a vesicle and its release-controlling Ca2+ channel(s) varies across different release sites of the same calyx
For the calyx the distance between a vesicle and the Ca2+ channel(s) controlling its release is not known. Knowing the sensitivity of the Ca2+ sensor does not solve this problem, because the conductance of Ca2+ channels in the calyx is unknown. The [Ca2+] transient that drives vesicle release could be supplied by a channel at distance D and with conductance C or, alternatively, from a channel twice as far away but with approximately twice the conductance (see below). This scaling behavior prevents one from inferring at what distances from Ca2+channels the vesicles are likely to be located. However, the scaling is broken when experimental data on the effects of added exogenous Ca2+ buffers EGTA or BAPTA are taken into account.
When a calyx is loaded with EGTA or BAPTA,Pr is reduced in a concentration-dependent manner. For example, 10 mm EGTA reducesPr to ∼0.45 ofPr in the native calyx. BAPTA (1 mm), which binds Ca2+ faster than EGTA, reducesPr to ∼0.35 ofPr in the native calyx (see Table 2). The reduction of Pr by the buffers is ascribed to the effect of the buffers on [Ca2+] transients. EGTA and BAPTA intercept part of the Ca2+ diffusing from the inner mouth of the channels to the vesicles, thereby reducing the peak amplitude of the [Ca2+] transients reaching the vesicles ([Ca2+]vesicle). In combination with experimental data, diffusion calculations thus may be used to infer characteristic distances between release-controlling Ca2+ channels and vesicles. This has been addressed previously for the calyx (Naraghi and Neher, 1997). Here we confirm the earlier result while offering a different interpretation.
We begin by assuming that every releasable vesicle at an AZ in the calyx is located at some fixed distance from a single Ca2+ channel that controls its release (e.g., 80 nm) (Fig.2A). The Ca2+ current through each channel gives rise to a [Ca2+] transient, with a peak amplitude decaying rapidly with increasing distance from the channel. Therefore, to yield similar [Ca2+]vesicle (and thus Pr) for different vesicle distances, we increased the single channel conductance for increasing distance (Fig. 2B). Single channel conductance was chosen such that the predicted release probability for a vesicle (Pr, vesicle) was 25% under control conditions (“control” means that the model calyx contained only endogenous fixed buffer and ATP). For any given distance the simulations for added buffers used the same channel conductance as that used for the control condition. The time course of the single channel current [iCa(t); approximately Gaussian] was calculated with a Hodgkin–Huxley Model. In these simulations iCa(t) was the same for all channels (uniformiCa mode; see Materials and Methods). Depending on the conductance, peaks ofiCa (per channel) varied from 0.0157 pA (for distance of 5 nm) to 0.936 (for distance of 125 nm). After the addition of exogenous buffers, the predicted [Ca2+]vesicle is strongly dependent on distance (Fig. 2C). This is expected because, for a single Ca2+ channel domain (Neher, 1986), the reduction in [Ca2+]vesiclerelative to [Ca2+]vesicleunder control conditions is stronger the farther away from the channel the vesicle is located.
Fig. 2.

Effect of channel-to-vesicle distance on release probability. A, Reaction volume used in the simulation; all numbers are given in nanometers (not drawn to scale). Height (400 nm) is equal to the thickness of the calyx, and the width corresponds approximately to the distance between neighboring AZs (see Table 1). Partial 5 and 20 nm grids indicate varying spatial resolution (see Materials and Methods). Single Ca2+channel is located at the center in the first voxel layer on the membrane (same for all channel-to-vesicle distances). Readily releasable vesicle is located on the membrane at 80 nm from the channel (example only). B, Peak Ca2+ current per channel required to yield release probability (Pr, vesicle) of 25% for the control condition [control = endogenous fixed buffer (EFB) and ATP only] if all vesicles were located at the same distance from the Ca2+ channel that controls their release.C, Predicted peak [Ca2+] at the location of the vesicle for the same assumption as in B.Traces 1–4 represent four different buffer conditions.Trace 1, EFB and ATP (control condition). Trace 2, EFB, ATP, and 10 mm EGTA-2. Trace 3, EFB, ATP, and 10 mm EGTA. Trace 4, EFB, ATP, and 1 mm BAPTA. D, Predicted Pr, vesicle for the same assumption as in B. Traces 1–4 for the buffer conditions are the same as in C. Thedashed box indicates the distance range in whichPr, vesicle in the presence of EGTA, but not BAPTA, is similar to the experiment. Vertical dashed line indicates average vesicle distance (118 nm) of the reference topography used in the second part of Results.
Figure 2D showsPr, vesicle as a function of the distance from the Ca2+ channel. As expected, for distances of 10 nm or less the efficacy of EGTA in reducing release is marginal. By comparing the differential effect of added exogenous buffers EGTA and BAPTA at any one distance, Figure2D confirms a previous result for the calyx (Naraghi and Neher, 1997). There is no distance at which the predictedPr, vesicle is consistent with experimental results for both EGTA and BAPTA loading (assuming either parameter set, EGTA or EGTA-2). For any distance at which the predicted reduction of Pr, vesicle by 10 mm EGTA (Fig. 2D, trace 3) is similar to that observed in the experiments (25–40 nm) (Fig. 2D, dashed box), the predicted reduction of 1 mm BAPTA is much stronger than that observed in the experiments. At distances >125 nm the predicted reduction of Pr, vesicle of neither BAPTA nor EGTA is consistent with the experiments. (Fig. 2 shows simulations with Release Model A. Analogous simulations with Release Model B yielded the same result.)
In comparing the Pr, vesicle in Figure 2D with experiments (which measure the average release probability across all vesicles in the calyx) we assumed implicitly that all readily releasable vesicles in the calyx are located at the same distance from their release-controlling channel. Under this assumption the experimental observation could not be explained. We therefore propose that the distance of individual vesicles to their release-controlling Ca2+channel(s) varies across different release sites. This explanation indeed is suggested by the experiments. Although some vesicles seem to be located sufficiently far from Ca2+channels to be affected by the slowly binding buffer EGTA (10 mm), other vesicles in the same calyx may be located closer to channels so that even the fast binding buffer BAPTA (1 mm) reduces their release probability only moderately.
To test this assumption, we assumed a simple distribution of distances. Every AZ is a circular area with the same radius of 125 nm (see Table1; for the simple distribution the variation of AZ sizes was neglected). Every AZ has only a single Ca2+ channel controlling the release. The channel is located at the center of the AZ. Vesicles are located at random anywhere on the AZs, with a distance ranging between 0 and 125 nm from the center, the average distance being 83 nm (Fig.3A). The predicted averagePr, vesicle across all vesicles is 25.0% for the control condition, 15.4% when adding 10 mm EGTA, and 7.7% when adding 1 mm BAPTA (iCa, peak = 0.53 pA per channel, Release Model A). Even for this simple distribution the predicted average Pr, vesicle is similar to thePr observed in experiments with added buffers (Fig. 3B). The quantitative mechanism that favors variable location of vesicles in reproducing the experimental data will be illustrated further below.
Fig. 3.
Measured buffer efficacies are reproduced (within ±2 SEM) when assuming variable channel-to-vesicle distance.A, Reaction volume used in the simulation; allnumbers are given in nanometers (not drawn to scale). Partial 5 and 20 nm grids indicate varying spatial resolution (see Materials and Methods). Single Ca2+ channel is located at the center in the first voxel layer on the membrane. Readily releasable vesicles (three examples shown) are located randomly anywhere on the AZ (all AZs are a circular area with a 125 nm radius centered on the Ca2+ channel). B, Comparison of model-predicted Pr with measured Pr. Filled columns, Predicted average Pr, vesicle for added exogenous buffer as ratio of control [control = endogenous fixed buffer (EFB) and ATP only]. Open columns, Measured data for calyx. Error bars indicate ± 1 SEM (see Table 2).
Property II: Release-relevant Ca2+ sources are separated by diffusion distances >200 nm
During APs at the calyx many Ca2+channels open for every vesicle that is released (Borst and Sakmann, 1996). The experimental findings on the effects of added exogenous buffers on Pr may be used to infer a minimum distance between the Ca2+ channels that control phasic release. For these simulations the channels were arranged on a regular grid covering the entire presynaptic membrane (henceforth “periodic grid topography”) (Fig.4A). The separation of neighboring channels (grid constant d, 60 nm in Fig.4A,B) was varied, adjusting the single channel conductance such that the predicted release probability for the control condition was 25%. Simulations used the uniformiCa mode.
Using d = 60 nm as an example, Figure4B illustrates how the Ca2+ domains generated by individual channels in a regular grid combine into a net [Ca2+] transient (left axis), how this transient is modified in the presence of exogenous buffers, and how this affects the predicted release probability of vesicles at different hypothetical locations in the grid (right axis). For d = 60 nm, there is no location at whichPr, vesicle in the presence of 1 mm BAPTA is similar to that measured in the experiments (i.e., 0.35 ofPr, vesicle under control conditions). In the immediate vicinity of a channel the peak of the [Ca2+] transient in the presence of 1 mm BAPTA is approximately one-half of control. At this location, however, Pr, vesicleis only 0.05 of that under control conditions. For all other locations the release-reducing effect of 1 mm BAPTA relative to control is even stronger. This means that there can be no distribution of vesicles within the d = 60 nm grid that would be in agreement with the experimentally observedPr (vesicles at fixed distance to the next channel, random locations, or any other distribution).
Extending the analysis, we varied d between 5 nm (uniform influx through the membrane) and 500 nm, thus varying the diffusion distances for Ca2+ between different Ca2+ channels. Keeping the total Ca2+ influx into the model calyx constant, we varied the single channel conductance asd2. This leaves the peak of the average [Ca2+] transient (average across all locations in grid) nearly constant (8–9 μmfor control, 4.5–4.9 μm for 10 mm EGTA, 1.9–2.2 μm for 1 mm BAPTA). However, the spatial profile of the [Ca2+] transients becomes increasingly nonuniform, leading to a steeper gradient between the spatial peaks of [Ca2+] in the direct vicinity of channels and the troughs of [Ca2+] between neighboring channels. For d = 480 nm, the peak of the predicted [Ca2+] transient ([Ca2+]peak) in the direct vicinity of channels is 350 μm, the peak of the average transient is 9.0 μm, and the peak at distance d/2 from two neighboring channels is 4.1 μm (Fig. 4C).
Similar to the analysis for Property I, we begin by investigating whether there is any hypothetical location in the grid of channels (i.e., all vesicles located at the same distance from nearest channel) for which the predicted Pr, vesicleis in agreement with the experiments with added exogenous buffers. Atd = 5 nm, [Ca2+]peak in the presence of 1 mm BAPTA is 0.24 of that of control. Pr, vesicle is only 0.0024 of control, i.e., >100 times smaller than that observed in the experiments (implying a supralinearity of n = 4.2 when expressing Pr, vesicle ∝ [Ca2+]npeak). As seen in Figure 4, B and C, the reduction of [Ca2+]peak in the presence of exogenous buffers relative to [Ca2+]peak under control conditions is weaker the closer the location to any one channel and the larger the d. For example, if vesicles and channels were colocalized (in a grid of d = 200 nm), then [Ca2+]peak in the presence of 1 mm BAPTA would be 0.75 of [Ca2+]peak under control conditions, and Pr, vesiclein the presence of 1 mm BAPTA would be ∼0.754 = 0.32 ofPr, vesicle under control conditions (in agreement with the experiments). For the same assumption, however, predicted Pr, vesicle in the presence of 10 mm EGTA would be too high (0.7 of control). Summarizing, there is no location within a grid of Ca2+ channels (for any d) at which the predicted effects of BAPTA and EGTA are both in agreement with the experiments.
Similar to the simulations for Property I, the agreement between measured and modeled Pr improves when a distribution of different locations of vesicles within the grid is considered. As a simple distribution of vesicles we assumed that vesicles are located at random anywhere within the grid of channels (exact dimensions of AZs, for the moment, were neglected). Then the predicted release probability of the calyx (Pr, calyx) is given by the averagePr, vesicle across all locations in the grid. Given such a simple distribution,Pr, calyx in the control condition is nearly constant for all d. However, the predicted efficacy of added exogenous buffers in reducingPr, calyx changes by more than two orders of magnitude (Fig. 4D). When compared with experimental data, the results for EGTA (both parameter sets) as well as for BAPTA show that d is likely to be at least 200 nm. Otherwise, the expected effect of either exogenous buffer would be far stronger than that observed in the experiments. To eliminate the uncertainty introduced by the role of ATP (for which the kinetic parameters and concentration in the native calyx are uncertain), we repeated the simulations without ATP and simulated the effect of BAPTA and endogenous fixed buffer alone (50 μmvs 1 mm BAPTA; see Materials and Methods for effect of endogenous fixed buffer). The results also implyd > 200 nm. (Fig. 4 shows simulations with Release Model A. Analogous simulations with Release Model B yielded similar results, suggesting d > 250 nm.)
In the simulations assuming a periodic grid of Ca2+ channels, we have, so far, used the uniform iCa mode (i.e., every channel of the grid opens during an AP). However, because only 10–20% of all Ca2+ channels may open during a single AP (Colecraft et al., 2001), the topographic pattern of open Ca2+ channels is different from the pattern of all, i.e., open or closed channels. In particular, the average diffusion distance of Ca2+ between open channels may be large (>200 nm), even if these open channels are part of a periodic channel grid with d < 200 nm.
To illustrate this, we might consider, for example, the following situation. Each vesicle is surrounded by a large uniform grid of Ca2+ channels (Yamada and Zucker, 1992). We used a grid of 10 × 10 channels, with a grid constant of 50 nm. The readily releasable vesicle was located in the middle of the channel field, in our example colocalized with one of the Ca2+ channels (“nonperiodic grid topography”) (Fig. 5A). Time course and amplitude of the Ca2+ currents were varied across channels (stochasticiCa mode; see Materials and Methods). To simulate low open probability of Ca2+channels during APs, we added a third gate to the two-gate Hodgkin–Huxley Model. The third gate, for which gating was independent of the membrane potential, either opened for the entire course of an AP (probability popen, max) or remained closed. Thus, the peak open probability of a single Ca2+ channel during an AP waspopen = 69% ·popen, max, where 69% is the predicted peak open probability of the two-gate Hodgkin–Huxley Model for the AP waveform (see Materials and Methods) andpopen, max was varied between 100 and 15%. To yield Pr, calyx∼25% for the control condition, we set single channel conductance to 0.40 pS for popen = 69% and scaled it as 1/popen up to 2.67 pS forpopen = 10.4% (Release Model A). This left the average total Ca2+ influx per AP unchanged, independent of popen (iCa, peak was 0.018 pA per channel, averaged across all open and closed channels).
Fig. 5.

Effect of Ca2+ channel open probability on release probability. A, Reaction volume with the nonperiodic grid topography (100 channels on d = 50 nm grid) used in the simulation (height of reaction volume, 500 nm). Readily releasable vesicle is colocalized with the Ca2+ channel at the center of the grid.B, Predicted Pr, vesicleafter adding 1 mm BAPTA as a ratio ofPr, vesicle under the control condition (control = endogenous fixed buffer and ATP only) as a function of the open probability of Ca2+ channels (popen) assumed in the three-gate channel model. For decreasingpopen, single channel conductance was increased as 1/popen (see Property II for values). Results for ratios show mean ± SEM after 200–1000 Monte Carlo simulations for each data point (stochasticiCa mode). The ratio forpopen = 100% is the one predicted by the uniform iCa mode (i.e., all channels open). Control condition: Pr, vesicle= 30% ± 1.5% for popen = 10.4%;Pr, vesicle = 35% ± 1.5% forpopen = 69%;Pr, vesicle = 35.2% forpopen = 100%.
Figure 5B shows predicted effects of added 1 mm BAPTA onPr, calyx. The results demonstrate how the effective topography (open Ca2+ channels relative to vesicle) changes with decreasing popen and how this affects whether the topography reproduces the experimental data. Forpopen = 69%, the predicted release-suppressing effect of added 1 mm BAPTA is much stronger than that observed in the experiments (as expected from the result for d = 50 nm in Fig. 4D).Pr, calyx with added 1 mm BAPTA is 0.04 ± 0.005 ofPr, calyx under control conditions, i.e., approximately eight times lower than measured in the experiments (all values given as mean ± SEM after 200–800 Monte Carlo simulations). This is expected, because for highpopen the diffusional distances between open Ca2+ channels are too small. In contrast, for popen = 10%, most open Ca2+ channels are separated by diffusion distances >200 nm. Thus the predicted effect of 1 mm BAPTA is consistent with experimental data (Pr, calyx reduced to 0.26 ± 0.06 of control). (As indicated in Table 3, the nonperiodic grid topography, although it is consistent with experiments with added BAPTA, is not consistent with experiments measuring the apparent Hill coefficient m; see Property III.)
For diffusion distances d of several hundred nanometers, required iCa, peak per channel is on the order of 1 pA (Fig. 4D, right axis). This current is ∼5–10 times higher than the usual upper estimates for single Ca2+ channels (conductance ∼2 pS at physiological conditions; Gollasch et al., 1992; Church and Stanley, 1996). For large d, therefore, we replaced each single channel with a cluster of 10 channels, each conducting only one-tenth of the original channel (channel-to-channel distance within cluster, ∼15 nm). Predicted effects of added exogenous buffers remained almost unchanged (data not shown). The [Ca2+] transient provided by a single large channel is, for many quantitative arguments, indistinguishable from that of a cluster of channels. Henceforth, we will refer to either as a Ca2+ source.
In summary, we conclude that, for any hypothesized location of vesicles within a large field of channels or channel clusters, the average distance between neighboring (open) Ca2+sources is likely to be >200 nm.
Buffer effects in single channel versus multiple channel topographies
Our result, at a first glance, may seem to contradict previous interpretations of experiments with added exogenous buffers. Previously, a substantial effect of the kinetically slow buffer EGTA in reducing Pr, particularly when compared with the effects of kinetically fast BAPTA, was used to infer relatively large diffusion distances for Ca2+ between release-controlling channels and vesicles (Borst and Sakmann, 1996). This is true when assuming that a vesicle is triggered by a single Ca2+channel/source. The larger the distance from a single Ca2+ source, the stronger the predicted relative reduction of phasic release by mobile buffers (Neher, 1998b) (Fig. 2D). However, for the case of a grid of channels, the effect is more complicated. The larger the grid distanced, i.e., the larger the average diffusion distance between vesicles and their nearest channels, the less efficient the buffers are in reducing phasic release. This can be understood by approximating [Ca2+]vesicle by adding up, for any one location in the grid, the single domains of all other channels (linearized steady-state approximation; Neher, 1998b). The smaller the d, the more spatially uniform are the [Ca2+] transients (along the membrane) and thus the more generated not only by a single nearby channel but by a large number of channels at different locations (Fig. 4C). In addition, because Pr, vesicle is a nonlinear function of [Ca2+]vesicle, it is not sufficient to consider the effect of added exogenous buffers on [Ca2+]vesiclealone. Instead, when considering distributions of vesicle distances, the effect of the buffers on the average release probability must be considered, too. (As seen in Fig. 4, the effect of the buffers on the average [Ca2+]vesicle is independent of d, whereas the effect on averagePr, vesicle changes by more than two orders of magnitude.)
The above finding relates primarily to the probable location of Ca2+ sources with respect to other Ca2+ sources, not to the location of vesicles. As shown, inferring diffusion distances between channels and vesicles from exogenous buffer experiments depends on previous assumptions on how many Ca2+ channels contribute to the local [Ca2+] at the vesicle (single channel domain vs multiple channels domain). Therefore, we will address the question of how many Ca2+ channels control the release of a vesicle in a separate, independent argument.
Property III: The majority of vesicles is controlled by clusters of ∼10 or more Ca2+ channels
Experimental modifications of the stochastic gating of Ca2+ channels and/or their partial blockage by toxins affect phasic transmitter release at the calyx (see Table 2). Such experiments have been used to conclude that the majority of vesicles at this synapse is controlled by more than one channel (Borst and Sakmann, 1999a; Wu et al., 1999). Extending these results, we estimate how many Ca2+ channels are likely to control the release of a single vesicle and how these channels are located.
Time-independent model without diffusion. We begin with a simple model (Yoshikami et al., 1989), which assumes the following: (1) The release probability (Pr, vesicle) of every vesicle is proportional to the nth power of [Ca2+]vesicle,Pr, vesicle ∝ [Ca2+]nvesicle. [Ca2+]vesicle is supplied by one or more channels controlling the release of the vesicle. (2) The total number of channels controlling each vesicle (N), open or closed, is the same at every release site. (3) During an AP a channel either opens (probabilitypopen) or remains closed (no multiple opening). (4) Each open channel contributes the same [Ca2+] to [Ca2+]vesicle. Assuming that sites are independent, we get:Pr, calyx = (Pr, vesicle)average ∝ Σk = 1Np(k)·kn, where p(k) is the probability that, at any single site, k of the N channels open during an AP (binomial distribution). Because channel gating is stochastic, the number of open channels at each release site varies around the average number (popen·N). This causes a variance of [Ca2+]vesicleacross sites. Therefore, only the average [Ca2+]vesicle of all release sites is reduced proportionally to p. Ifn ≠ 1, the effect on release is nonlinear, i.e., the average release probability of all vesicles in the calyx (Pr, calyx) is not proportional to the average [Ca2+]vesicleraised to the nth power. Instead,Pr, calyx ∝popenm [the notation ofm vs n follows the one in Wu et al. (1999), defined in Table 2]. Therefore, the apparent degree of supralinearity of release versus Ca2+ influx measured experimentally (m) may be different from n and depends on how the influx is varied (Yoshikami et al., 1989; Quastel et al., 1992). The discrepancy of m versus n is larger the higher the coefficient of variation (CV) of [Ca2+]vesicleacross release sites. CV, which depends on the number of Ca2+ channels per site, is largest for the case of a single channel, for N = 1, m= 1, independent of n (Yoshikami et al., 1989; Augustine et al., 1991). As the number of channels controlling each site increases, the CV of [Ca2+]vesicledecreases and m converges to n.
N estimated with time-independent model. In presynaptic voltage-clamp recordings at the calyx, Borst and Sakmann (1999a)reduced popen for Ca2+ channels by modifying the AP waveform. To simulate these experiments with the time-independent model, we calculated Pr, calyx forpopen = 69% (for the physiological AP waveform) (Fig. 6A) and for popen = 42% (step-like AP waveform) and determined m according toPr, calyx ∝popenm (bothpopen given by a two-gate Hodgkin–Huxley Model fit to the calyx as in Borst and Sakmann, 1998). We assumed n = 3.3 (maximum possible mpredicted by time-dependent diffusion model; see below). As expected,m predicted by the time-independent model was equal to 1 forN = 1 and converged to 3.3 for large N (Fig.6B, solid line). On the basis of the experimental finding that m ∼ n, the predictions for m suggest that phasic transmitter release for the majority of vesicles is likely to be controlled by at least 10 Ca2+ channels per vesicle. Although in the model m is a function ofpopen (high vs low), the inferred minimum number of channels N is insensitive to the exact values for popen. We also testedpopen = 75 versus 25% (yieldingN > 11) and popen = 20 versus 10% (yielding N > 14).
Fig. 6.
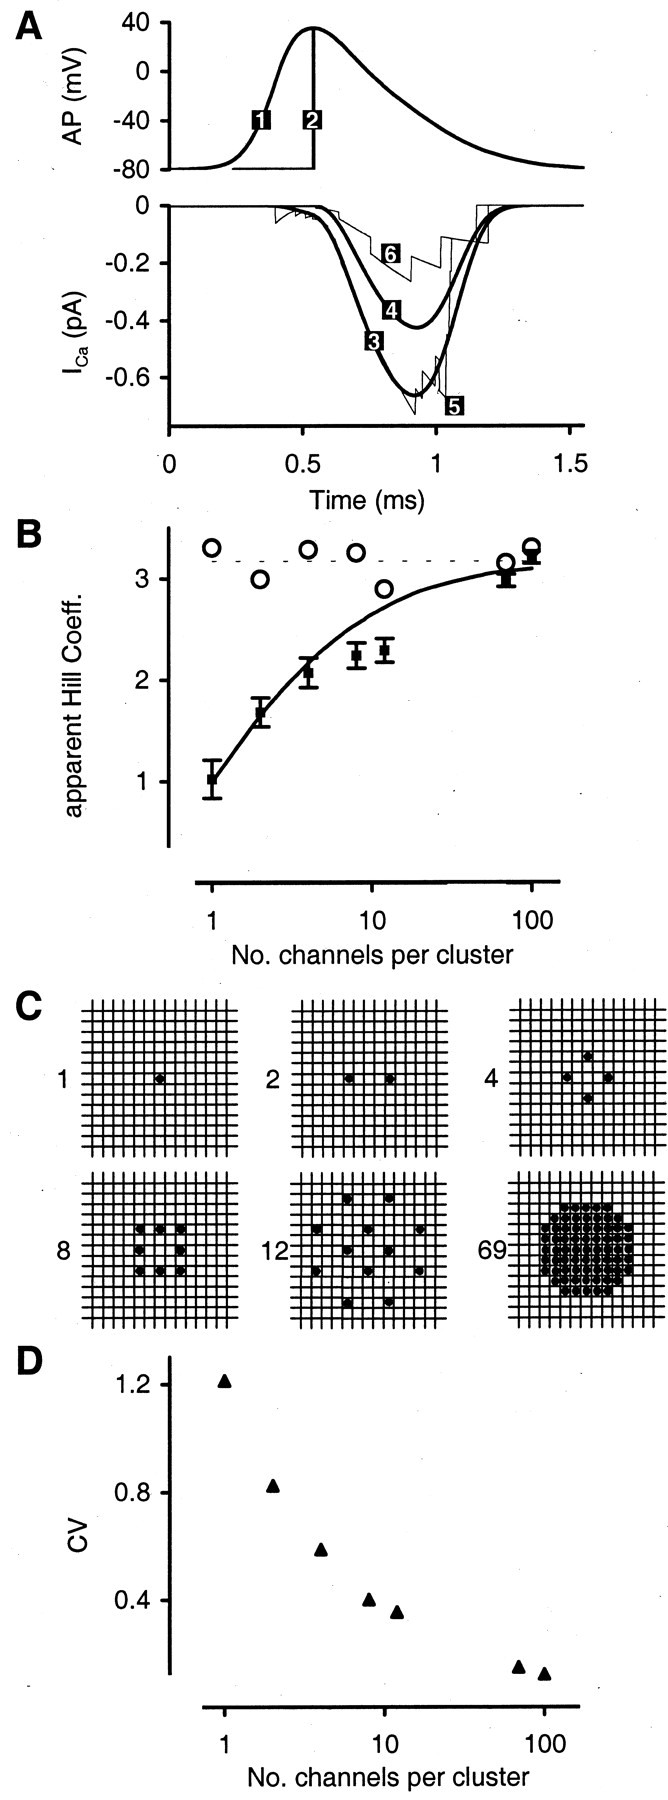
Effect of the number of Ca2+channels on release probability. A,ICa predicted by Hodgkin–Huxley Model for different AP waveforms. Trace 1, Physiological AP.Trace 2, Step AP to reduce peak channel open probability (popen). Trace 3, Average ICa (used in uniformiCa mode) for 12 channel cluster (physiological AP); half-width of ICa = 383 μsec; popen = 69%. Trace 4, Same as trace 3 but for step AP;popen = 42%. Trace 5, Example of stochastic ICa (used in stochastic iCa mode) for cluster of 12 channels (physiological AP). Trace 6, Same astrace 5 but for step AP. B, Effects of the number of channels per cluster on apparent Hill coefficientm (see Property III for details). Solid line, m predicted by time-independent model.Squares, m predicted by time-dependent model with the stochastic iCa mode (for allN the vesicle locations are as described for the reference topography). Error bars indicate ± SEM after 400 Monte Carlo simulations for each data point. Open circles, Apparent Hill coefficient predicted by time-dependent model with the uniform iCa mode.C, Number and position of Ca2+channels in clusters of different N (1–100) used in the simulation. Grid indicates (5 nm)3 voxels on the membrane; the black circles indicate a voxel with a channel. The cluster with N = 100 channels is the same as the cluster with N = 1 channel except that the same voxel holds 100 channels instead of 1 (unrealistic channel density). Reaction volume, as well as location of readily releasable vesicles and of cluster centers (indicated by the black circle inN = 1 cluster) on AZs, is as in Figure7A. D, Coefficient of variation of the total Ca2+ influx through a cluster [time integral of ICa(t), 0–5 msec] as a function of the number of channels per cluster (physiological AP waveform).
Time-dependent model with diffusion. The simplified model above neglects time-dependent buffered diffusion of Ca2+ as well as the exact time-dependent response of vesicles to transient [Ca2+]. To confirm the result onN, we implemented stochastic channel gating into the three-dimensional time-dependent model used to infer Properties I and II. Vesicles and clusters of Ca2+ channels were located randomly on AZs as described for the reference topography. Time course and amplitude of the Ca2+currents were varied across channels (stochasticiCa mode; see Materials and Methods). Channel kinetics were driven either by the physiological AP waveform, resulting in popen = 69%, or by the modified step-like waveform (popen = 42%). Total conductance per channel cluster was 4.8 pS or 4.8 pS/N per channel. [4.8 pS is 0.33 of the conductance used to simulate release under control conditions. The lower conductance, which simulates lower [Ca2+] of the extracellular solution, was used so that nmodel ∼3 (averagen observed in the experiments; see Table 2).]
N estimated with time-dependent model. When channels are gated by the step-like AP, the total influx into the calyx is 61% of that under the physiological AP. The average release probabilityPr, calyx is reduced to 0.61m, where the value of m is strongly dependent on N (Fig. 6B). We show results for seven cluster types with N varying between 1 and 100 channels per cluster (Fig. 6C). To confirm that the predicted change in m is attributable to the change in the CV (Fig. 6D) of the total Ca2+ influx per cluster and not attributable to different channel-to-vesicle distances inherent in clusters of varying N, we repeated the simulations for all seven clusters. This time we did not vary individual channel currents stochastically but used the uniformiCa mode. As expected, the predicted Hill coefficient is ∼3.3 for all N (Fig.6B, open circles).
The time-dependent model confirms the finding on N derived from the time-independent model. However, for N = 4–12, an additional effect is revealed. Because the Ca2+ channels in the cluster cannot all be in the same location in the membrane, the diffusion distance to the vesicle they control varies and thus the [Ca2+] that each open channel contributes to the combined [Ca2+]vesiclevaries as well. Therefore, variable diffusion distances of the channels controlling a particular vesicle raises the CV of [Ca2+]vesicle (for the same N), thus increasing the discrepancy between the measured values of m versus n. To illustrate this further, we may consider again the nonperiodic grid topography simulated in Property II (Fig. 5A). At highpopen = 69%, the prediction form (2.5 ± 0.1) is consistent with the experiments, because at high popen each vesicle is controlled by a large number of Ca2+channels at similar distances (m given as mean ± SEM after 200–800 Monte Carlo simulations). At lowpopen = 10%, a vesicle still is controlled by ∼10 Ca2+ channels (for the grid of 100 channels). However, in the grid these channels are not located at similar distances from the vesicle. Therefore, the predictedm for popen = 10% is only 1.37 ± 0.14, far lower than that measured in the experiments.
In summary, we conclude that N ∼10 or more Ca2+ channels control the phasic release of a single vesicle at the majority of release sites at the calyx and, further, that these channels are located at similar distances from the vesicle they control. For the N = 12 cluster in Figure6B, the average vesicle, located at 118 nm from the cluster center, is located at 90–140 nm from an individual channel.
It should be noted that the above simulations are based on the assumption that the Hodgkin–Huxley Model is a sufficiently accurate description for gating and current of single Ca2+ channels. The model is probably not accurate for all Ca2+ channel subtypes. Just as variable distance between channels and vesicles increases the variance of [Ca2+]vesicle (see above), different subtypes of Ca2+channels with presumably different gating and/or conductances would produce the same effect, thus further increasing the discrepancy between m and n (for the sameN). Similarly, ifpopen during APs is lower than 69% assumed in the above simulations, more channels per cluster would be needed to achieve sufficiently low CV of the [Ca2+] reaching the vesicles. Hence our estimate N ∼ 10 should be viewed as a lower limit.
Property synthesis: Phasic release is controlled by one or a few channel clusters per AZ, and vesicles are located at variable distance from the cluster(s)
Properties I–III describe three specific “requirements” on the topography of release sites at the calyx. Although there are many conceivable topographies that would exhibit one or two of these properties, very few topographies exhibit all three properties simultaneously. Further combining these requirements with recent anatomical data of the location and size of AZs in the presynaptic membrane of the calyx, one can infer a single, probable topography for the calyx.
Electron microscopic (EM) reconstruction of the calyx shows that AZs are separated by 200–800 nm from the next closest AZ (see Table 1). The average radius of an AZ is 125 nm. Therefore, >200 nm separation of Ca2+ sources (Property II) suggests that phasic release for the majority of AZs is controlled by a single source of Ca2+ per AZ, a source being a single Ca2+ channel or a group of Ca2+ channels.
As for the distances between Ca2+ channels and vesicles, the simulations of the effects of added exogenous buffers (Property I) and of reduced Ca2+ channel open probability (Property III) suggest seemingly contradicting properties. Simulations for exogenous buffer suggest nonuniformity (variable distances), whereas simulations for reducedpopen suggest uniformity (similar distances). However, these two properties are not mutually exclusive and may be treated as independent requirements on the topography. The nonuniformity relates to the distances that different releasable vesicles have to the Ca2+ source that controls the release of the vesicles. The uniformity relates to the distances that one vesicle has to the several individual channels of the Ca2+ source.
To satisfy both requirements in one topography, we suggest that Ca2+ channels at AZs appear in clusters, with 10 or more channels per cluster and with a maximum distance between any two channels in the cluster of ∼50 nm. Ten Ca2+ channels on a circular area with a diameter of 50 nm correspond to one channel per 14 × 14 nm2 membrane area. This is consistent with estimates of channel-to-channel distances for other synapses (Stanley, 1997). For any one vesicle located, for example, 100 nm away from the center of the cluster, the distances between the Ca2+ channels and this vesicle are “similar” (75–125 nm). As a second, independent property of the reference topography, we suggest that different releasable vesicles (at the same AZ or at other AZs) are located at different distances from the Ca2+ channel cluster. Note that the simulations to reproduce the measured effects of added exogenous buffers on Pr cannot predict the exact distribution of cluster-to-vesicle distances. However, the simulations indicate that the CV of the distribution must be ∼0.5 or larger.
Spatiotemporal pattern of [Ca2+] transients and phasic transmitter release
We have derived the topographic properties likely to be found at release sites of the calyx. However specific, these properties do not define the topography in every detail. In particular, they cannot define the exact distances between readily releasable vesicles and their Ca2+ sources; different distributions of cluster-to-vesicle distances may result in similar netPr, calyx and thus may reproduce the experimental data equally well. Below, we propose a possible specific topography, which is consistent with the above properties and the anatomic data. Using this topography in the model, we simulate the physiological [Ca2+] transients that control phasic transmitter release at AZs.
Proposed location of Ca2+ channels
At each AZ a single cluster of Ca2+channels controls phasic release. The cluster has a diameter of ∼50 nm. It consists of 12 channels, with a conductance of 1.2 pS per channel. The 1.2 pS corresponds to an averageiCa, peak = 0.055 pA per channel during APs (popen = 69%). Ca2+ channels in the cluster are located as was shown in Figure 6C (N = 12). The cluster (center) is located at random anywhere in each AZ (Fig.7A). Consistent with anatomical data, individual AZs are circular areas of variable size, with a radius varying around raverage= 125 nm, ς = 31 nm (distribution of radius is Gaussian; see Table 1).
Proposed location of readily releasable vesicles
Readily releasable vesicles are located at random anywhere on every AZ, except for whichever space is already occupied by the channel cluster (Fig. 7A). The random location of vesicles was chosen for the lack of direct evidence of a more defined spatial organization. As a consequence of the large AZs, the distance between a vesicle and the center of the channel cluster ranges between 30 and 300 nm (mode = 90 nm; mean = 118 nm; ς = 59 nm).
The above topography was used for all further simulations (henceforth reference topography). All numbers given in the following text apply to simulations that use Release Model A, unless indicated otherwise. For the reference topography, uniform iCamode and stochastic iCa mode predict almost the same [Ca2+] transients and time course of release. Small differences in predictedPr, calyx between the two simulation modes are indicated in the corresponding figures.
Heterogeneous release probability and physiological Ca2+ signaling
In the simulations for the reference topography, vesicles located at different distances from Ca2+ channels are exposed to predicted [Ca2+] transients of different amplitude and time course (Fig. 7B). For single APs under physiological conditions, [Ca2+]vesiclevaries between 40 μm for vesicles closest to the channels (30 nm from cluster center) and 0.5 μm for the very few vesicles furthest away (300 nm from cluster center) [between 110 and 1.5 μm when using Release Model B]. The peak of the average transient (across all vesicle locations) is 8.2 μm [23 μm]. It has a half-width (full width at half-maximum) of 391 μsec [384 μsec] (Fig. 7B). As a result of the variation in [Ca2+]vesicle,Pr, vesicle varies as well, between 100 and 0.006% [85 and 0.0003%] (Fig. 7C).
In essence, the consideration of variable distance between Ca2+ channels and vesicles constitutes a departure from the concept of a single or average physiological [Ca2+] transient driving phasic transmitter release. Likewise, by definition of the nonlinear response of Pr, vesicle versus [Ca2+]vesicle, the definition of an average distance of vesicles to channels is rendered somewhat futile. For the reference topography, the average distance of a vesicle to the center of the channel cluster is 118 nm (across all vesicles and AZs in the calyx). However, a vesicle actually located at 118 nm from a cluster does not have the average release probability of all vesicles in the calyx Pr, calyx = 25%, but only Pr, vesicle = 2% (Fig. 7C). Neither can one define an effective or typical distance. To yieldPr, vesicle =Pr, calyx = 25%, a vesicle must be located at 80 nm from the channel cluster (vesicle at medium distance in Fig. 8). Here, the simulation predicts an approximately bell-shaped transient, peaking at [Ca2+]vesicle = 8.7 μm (Fig. 8D, as estimated by Bollmann et al., 2000). However, focusing on the distance of 80 nm yields misleading results when the effects of added exogenous buffers are interpreted. In the presence of 1 mm BAPTA the predictedPr, vesicle for the vesicle at 80 nm does not exhibit the reduction of the predicted average release probability to Pr, calyx = 7%, but to Pr, vesicle = 0.02%.
Fig. 8.

Visualization of reference topography and Ca2+ diffusion at calyx. A, Presynaptic membrane with one AZ, one Ca2+ channel cluster, and three readily releasable vesicles. Positioning of cluster and vesicles as well as the number of vesicles on AZ represents one example of random placement at 600 AZs. Vesicles have a diameter of 50 nm (same in A–D); drawings are to scale. In the example the vesicles are located at 50, 80, and 150 nm from the center of the channel cluster. B, Same as A but viewed from the top and with superimposed false color coding of [Ca2+] on the membrane around the channel cluster. Concentrations reflect predicted AP-evoked [Ca2+] transients under physiological conditions (same simulation as in Fig.7B; time, 0.60 msec). For optical clarity AZ has been replaced by a dotted circle. Orange/redcodes show [Ca2+] domain around the open channels.C, Same as B but viewed from theside, with an additional vertical panelto show [Ca2+] in the plane perpendicular to the membrane (time, 1.15 msec). Dashed circle indicates that the vesicle has fused already. D, Variable channel-to-vesicle distances result in variable peaks of [Ca2+] transients and thus heterogeneousPr, vesicle.
Heterogeneity and effects of added exogenous buffers
As shown in Figure 9A, the simulation reproduces well (i.e., within ± 2 SEM confidence interval) the experimentally measured concentration-dependent effects of both BAPTA and EGTA on Pr. (The only exception is Pr, calyx predicted for 1 mm EGTA. Possibly, the proportion of vesicles located away from the channel cluster is larger than that inherent in the random distribution on active zones as used for the reference topography. At 80 nm from the cluster, for example,Pr, vesicle under control conditions is 25%, but Pr, vesicle under 1 mm EGTA is 20%, i.e., within a ± 2 SEM confidence interval of the experimental result.)
Fig. 9.

Predicted effects of added exogenous buffers and lowered extracellular [Ca2+] onPr, calyx. A, Predicted effect of exogenous buffers onPr, calyx for two topographies (reference topography versus periodic grid topography, withd = 60 nm) compared with experimental data.Filled squares, EGTA (experimental); filled triangles, BAPTA (experimental; mean ± SEM as shown in Table 2). Trace 1, EGTA (reference topography);Trace 2, BAPTA (reference topography); Trace 3, EGTA (grid topography); Trace 4, BAPTA (grid topography). Reaction volume and location of channels/vesicles are as in Figure 7A (reference topography) or Figure4A (grid topography). The same simulations with the stochastic iCa mode (data not shown) yielded the same results as the uniform iCamode: EGTA (1 mm, 24.3% ± 0.5%; 10 mm,16.0% ± 0.3%) and BAPTA (1 mm, 7.5.% ± 0.3%; 10 mm, 0.1% ± 0.01%; mean ± SEM after 100–200 Monte Carlo simulations). B, PredictedPr, calyx as a function of Ca2+ influx for the same topographies as inA compared with experimental data (see Table 2). Influx was reduced by reducing the single channel conductance from 1.2 pS (control; vertical dashed line) to 0.12 pS.Squares (uniform iCa mode) and circles (mean of stochasticiCa mode) indicate the reference topography (circles are not plotted where indistinguishable fromsquares; SEMs, after 200 Monte Carlo simulations, are smaller than the dimension of the circles).Triangles (uniform iCa mode) indicate the grid topography (predicted slope, n = 4.4). Solid thin line indicates slope,n = 2.7; shaded area indicates range of slopes in experimental studies (n = 2.2–3.5). Each data set is normalized to (1, 1). Reaction volume and location of channels/vesicles are as in Figure 7A (reference topography) or Figure 4A (grid topography).Pr, calyx at control conditions is 25%.
We will now illustrate why variable location of vesicles predicts Pr, calyx as observed in the experiments, whereas other, more spatially uniform organizations do not. Variable diffusion distances between release-controlling channel clusters and vesicles create a pool of vesicles with a broad distribution of Pr, vesicle. By the same token, Ca2+ buffers affect eachPr, vesicle differently, again depending on the diffusion distance for Ca2+ from channels to the particular vesicle. Experiments, however, only measurePr, calyx, the average of allPr, vesicle. The overall net effect of added buffers on Pr, calyx, therefore, depends on the distribution of distances between channel clusters and vesicles.
To illustrate the differential efficacy of added buffers, let us consider the vesicles as three separate groups according to distance: close (30–40 nm from cluster center), medium (40–70 nm), and far (>70 nm). As was shown in Figure 7D, the release probability of close vesicles isPr, vesicle = 100% in response to a single AP (control, i.e., no added exogenous buffers). At 30–40 nm the exogenous buffers (1 mm BAPTA as well as 10 mm EGTA) reduce [Ca2+]vesicle to ∼0.5 of that under control conditions. However,Pr, vesicle of the close vesicles remains unaffected, because release already is saturated. This is different for vesicles at medium distance. Again in a comparison of buffer versus control condition, BAPTA reduces [Ca2+]vesicle to 0.5 of that under control condition, enough to reduce the release probability strongly. However, EGTA at this distance reduces [Ca2+]vesicleless, and Pr, vesicle stays high. For far vesicles, finally, both buffers strongly reduce [Ca2+]vesicle.Pr, vesicle is reduced even more strongly because the release-controlling Ca2+ sensor, which at this distance is not saturated, responds steeply to changes in [Ca2+]vesicle. Because different vesicles are affected to different degrees, the overall effects of the buffers onPr, calyx are in agreement with the experiments, although no single vesicle alone reflects the changes toPr, calyx. The above reference topography is in contrast to the more homogenous periodic grid topography used to infer Property II. While the reduction of the average [Ca2+]vesicle by added exogenous buffers in the grid topography is similar to that in the reference topography, the predicted reduction ofPr, calyx in the grid topography is much too strong (Figs. 4B, 7D). In essence, the nonuniformity of vesicle distances inherent in the reference topography creates a safe harbor for some of the vesicles (independent of which release model is used), such that they are released even if the Ca2+ transients are reduced by exogenous buffers.
Heterogeneity and effects of reduced Ca2+ influx
As described in Property III, the number and location of Ca2+ channels relative to vesicles affect the measured steepness (m, n) at whichPr, calyx responds to changes in Ca2+ influx. Figure 9B shows the predicted reduction in Pr, calyxwhen the Ca2+ influx is reduced by reducing the single channel conductance (1.2 to 0.12 pS, reflecting a reduction from 2 to ∼0.2 mmCa2+ in the extracellular solution). Predicted Pr, calyx depends supralinearly on the total Ca2+ influx. The predicted slope in the double logarithmic plot increases with decreasing conductance. The average predicted slope isn = 2.8 (in agreement with the experiments; see Table2). When Ca2+ influx is reduced by reducing the channel open probability,Pr, calyx is reduced supralinearly with m = 2.3 ± 0.1 (mean ± SEM after 400 Monte Carlo simulations, as was shown for N = 12 channels in Fig. 6B). Note that the prediction form, as well as that for n at large conductance, is somewhat lower than that observed in the experiments. The reason is that Pr, vesicle of some vesicles is almost saturated and, therefore, less sensitive to changes in [Ca2+]vesicle. For comparison, the predicted n for the periodic grid topography (d = 60 nm) is 4.4, i.e., outside the range observed in the experiments (Fig. 9B).
Functional significance of proposed topography for high-frequency transmission
Contribution of Ca2+ diffusion to synaptic delay
The time of Ca2+ diffusion from channels to vesicles is believed to constitute only a small part of synaptic delay times (Adler et al., 1991; Yamada and Zucker, 1992;Borst and Sakmann, 1996). Our simulations confirm this view for the calyx, albeit with some qualifications (simulations used Release Model A; analogous simulations that used Release Model B yielded similar results; data not shown).
Once Ca2+ channels have opened, Ca2+ needs to diffuse to the vesicle (i.e., to its presumably colocalized release-controlling Ca2+ sensor). This process is not instantaneous and thus contributes to synaptic delay. To quantify the effect, Figure 10Ashows the time course of Ca2+ influx through channels, superimposed with the predicted time course of [Ca2+] transients at various distances. As shown for the case of a nonphysiological pulse-like whole-cell Ca2+ current (ICa, pulse), the local transient at the channel cluster (30 nm from center) reaches nearly steady state within ∼100 μsec after onset of the Ca2+ current. In contrast, the average transient (average across all vesicles) as well as the transient at 200 nm has not yet reached its steady-state level. In other words, because of buffered diffusion of Ca2+ the time course of [Ca2+] transients controlling the vesicles would be delayed againstICa if it were pulse-like.
Fig. 10.
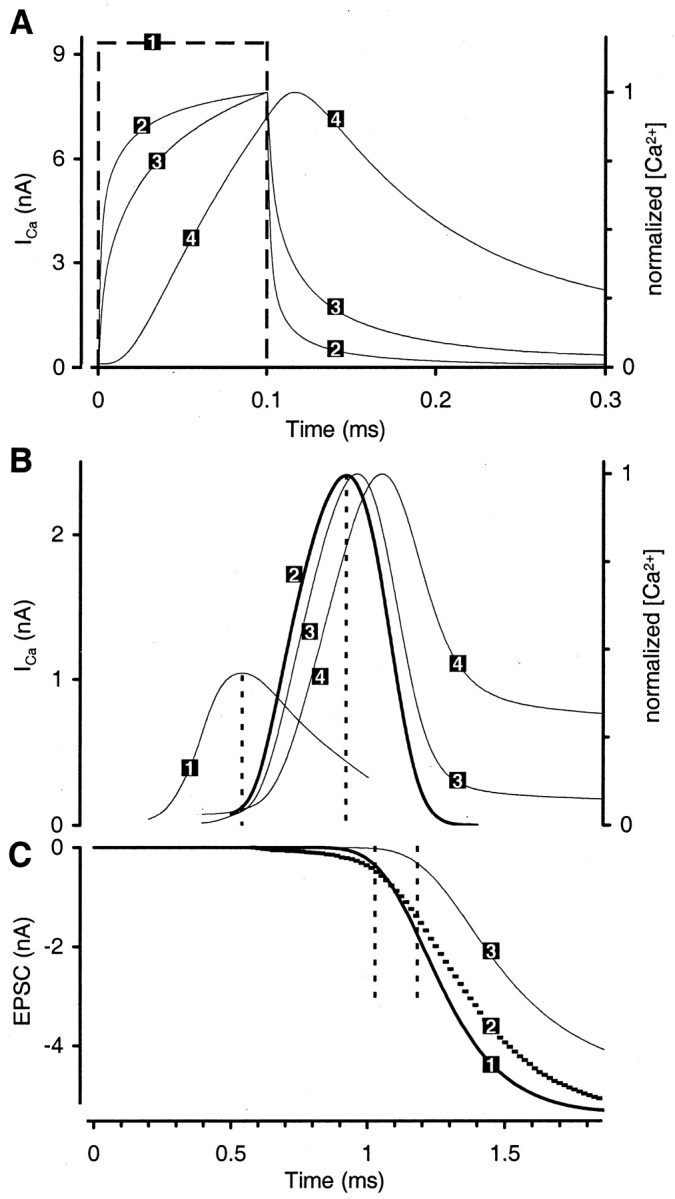
Functional significance of variable channel-to-vesicle distance: synaptic delay. A, Pulse-like ICa (dashed line) generates [Ca2+] transients with different time courses and amplitudes at different distances from channel cluster (solid lines, right axis; each normalized to the same amplitude). Reaction volume and topography are the same as in Figure 7A. See Results for further details.Trace 1, Rectangular pulse-likeICa of 100 μsec duration. Trace 2, Distance 30 nm [Ca2+]peak = 167 μm. Trace 3, Average across vesicles, [Ca2+]peak = 32 μm.Trace 4, Distance 200 nm [Ca2+]peak = 3.6 μm. B, PhysiologicalICa (heavy line) generates [Ca2+] transients with different time courses and amplitudes at different distances from channel cluster (thin lines, right axis; each normalized to the same amplitude). Reaction volume and topography are the same as in Figure7A. Trace 1, AP (time course only; same as trace 1 in Fig. 6A).First dashed line from the left indicates the time of peak of AP (0.54 msec). Trace 2, Physiological whole-cell ICa. Second dashed line indicates the time of peak ofICa (0.92 msec). Trace 3, Average across vesicles, [Ca2+]peak = 8.2 μm. Trace 4, Distance 200 nm [Ca2+]peak = 1.6 μm. C, For same simulations as inB, trace 1 predicted EPSC for physiological ICa. First vertical dashed line from the left indicates the time of peak of release rate predicted for physiologicalICa (1.03 msec). Trace 2, Measured single EPSC from Bollmann et al. (2000) (shifted by ∼400 μsec to the left). Trace 3, EPSC for virtual [Ca2+] transient (transient astrace 3 in B). Second vertical dashed line from the left indicates the time of peak of release rate predicted for virtual transient (1.18 msec). Note that C uses the same time scale asB.
This is different in the case of a physiological, approximately bell-shaped ICa(ICa, physiol) as generated by a cluster of Ca2+ channels that open and close stochastically (Fig. 10B; time integrals ofICa, pulse andICa, physiol are the same). The local [Ca2+] transient at the channel cluster follows ICa, physiol almost perfectly (data not shown in Fig. 10B). Even at 200 nm, the peak of [Ca2+] is reached only ∼150 μsec later than the peak ofICa, physiol itself. The average [Ca2+] transient follows the time course of ICa, physiolwell, with a small lag of ∼50 μsec (see also Schneggenburger and Neher, 2000). Thus we estimate that during APs at the calyx the direct contribution of Ca2+ diffusion time to synaptic delay is only ∼50 μsec. This is aided by the time course of the physiological Ca2+ current. Its rise and decay [approximately bell-shaped, half-width (full width at half-maximum), 383 μsec] are slow enough to be followed easily by the buffered diffusion system that governs the [Ca2+] transients.
We will now consider another effect of Ca2+ diffusion on synaptic delay. We define synaptic delay as the time between the onset (5% of peak) ofICa and the onset of the predicted EPSC. The delay time in the model does not represent synaptic delay as it is measured in experiments. This is because the model does not account for additional delays caused by steps after the response of the release-controlling Ca2+ sensor. Therefore, the experimentally measured EPSC in Figure 10C(dashed curve) was shifted in time (∼400 μsec toward earlier times) to allow for comparison of the time course (Bollmann et al., 2000). [Note, however, that the EPSC time course predicted by the model cannot be expected to match perfectly that of measured EPSCs. First, the postsynaptic response to transmitter deviates from a linear superposition of quantal EPSCs (Sakaba and Neher, 2001b), a fact not yet included in the model. Second, additional steps in the transmission process after fusion of a vesicle may contribute to the variation in the time of onset of quantal EPSCs.]
In the following analysis we will focus on differences in synaptic delay predicted for different [Ca2+] transients rather than on delay times in absolute terms. The onset of the EPSC for the pulse-like ICa is at 65 μsec after the onset of ICa(20–80% rise time of EPSC is 230 μsec; peak is 7.1 nA; data not shown). The short delay is expected from the high [Ca2+] transients and the fast forward binding rates of the Ca2+ sensor, although the Ca2+ does not reach all vesicles immediately. For the physiologicalICa, the onset of the EPSC (Fig.10C, trace 1; rise time, 310 μsec; peak, 5.3 nA) is ∼400 μsec after the onset ofICa (onset ofICa, physiol is at the peak of the AP, at 540 μsec). The peak of the average release rate underlying the EPSC (data not shown) is at 1030 μsec or 100 μsec later than the peak of ICa, physiol (Fig.10C, first vertical dashed line from theleft). For the calyx this time interval has been measured to be approximately five times larger (∼500 μsec; Borst and Sakmann, 1996). This confirms that a large part of the physiological delay is caused by steps after the kinetic response of the release-controlling Ca2+ sensor.
Bollmann et al. (2000) and Schneggenburger and Neher (2000) have shown that EPSCs at the calyx, when evoked by [Ca2+] uncaged from photosensitive chelators, have synaptic delays which are shorter, the higher the [Ca2+]vesicle. In the model, phasic release comprises release from vesicles that are located at different distances to channel clusters and thus are exposed to [Ca2+] transients of different amplitude (maximum of ∼40 vs ∼8 μm for the average). Therefore, the vesicles in close proximity to channel clusters release neurotransmitter earlier than the average vesicle and thus shorten the synaptic delay. To quantify the effect, we calculated the EPSC that would be predicted if all vesicles were controlled by a single virtual [Ca2+] transient; i.e., if all vesicles were located at the same distance from Ca2+ channel clusters. As the virtual transient, we chose the average [Ca2+](t) predicted by the diffusion model (average across all vesicles) (Fig.10B). This simulation essentially removes effects of heterogeneous [Ca2+]vesicle from the predicted EPSC. The resulting EPSC (EPSCvirtual) (Fig. 10C, trace 3) has a peak amplitude of 4.5 nA (rise time, 410 μsec), similar to that of EPSCphysiol predicted by the full diffusion model. However, the onset of EPSCvirtual is ∼150 μsec later than that of EPSCphysiol. The peak of the vesicle release rate generating EPSCvirtual is at 1182 μsec (Fig.10C, second vertical dashed line from theleft).
In summary, the diffusion time of Ca2+contributes only ∼50 μsec to the synpatic delay. However, a direct contribution of only ∼50 μsec does not imply that buffered Ca2+ diffusion is insignificant for determining the onset of EPSCs. Instead, the time of onset of physiological EPSCs depends on the amplitude of [Ca2+] transients and thus on where the vesicles are located with respect to Ca2+channels.
Invariance of release time course
The time course of phasic transmitter release has been shown to be remarkably stable, even when the rate of release is reduced by several orders of magnitude, for example by lowering [Ca2+] of the extracellular solution from 2 mm (control) to 0.25 mm (Van der Kloot, 1988; Isaacson and Walmsley, 1995; Borst and Sakmann, 1996). To test the compliance of the model with this finding, we reduced the single channel conductance in the above simulation to 0.15 pS per channel, a value eight times lower than that used for the above EPSCphysiol. The predictedPr, calyx is 0.11%, which corresponds to less than one vesicle per AP (uniformiCa mode). The simulated EPSC (EPSClow Ca; data not shown) thus represents the average of evoked, quantal miniature EPSCs.
The predicted relative time course of EPSClow Cais similar to that of EPSCphysiol [Release Model A, rise time 415 μsec (low Ca2+) vs 310 μsec (physiol); Release Model B, rise time 310 μsec (low Ca2+) vs 295 μsec (physiol)]. The onset of EPSClow Ca is later than that of EPSCphysiol (Release Model A, +135 μsec; Release Model B, +80 μsec), a prediction consistent with a measured increase in delays after a reduction of Ca2+ influx at the calyx (Taschenberger and von Gersdorff, 2000).
The small increase in the predicted delay of EPSClow Ca versus EPSCphysiol does not (primarily) stem from the lower [Ca2+] transients reaching the vesicles any later. The (nonuniform) [Ca2+] transients for the low Ca2+ condition have amplitudes approximately eight times smaller, but their time courses differ by at most ± 20 μsec from those under control conditions (data not shown). Rather, the increase stems from the kinetic response of the molecular release model itself. Both models (A and B) predict slower responses to the [Ca2+] transients of the low Ca2+ condition. Still, the overall changes in EPSC time course are small. This is because, under the low Ca2+ condition, the EPSC is generated almost exclusively by release from vesicles located close to the channel clusters (30 nm from cluster center). Here, predicted [Ca2+] transients are still as high as 5 μm (Release Model B, 14 μm), a concentration in which the kinetic response of both release models is similar to that under control conditions (Bollmann et al., 2000;Schneggenburger and Neher, 2000).
In summary, the predicted invariance of the (relative) release time course for reduced Ca2+ influx depends not only on the release model but on the release site topography as well.
Synaptic reliability during consecutive APs
Part of a structure involved in the location of sound, the calyx is capable of sustained high-frequency transmission with high temporal fidelity between presynaptic and postsynaptic AP (Oertel, 1999). Possible functional advantages of heterogeneous release probability with respect to this function have been discussed by Wu and Borst (1999) and Sakaba and Neher (2001b). Briefly, one concept proposes that vesicles that, by whatever mechanism, have a low probability to be released by a single AP may have a higher release probability in subsequent, consecutive APs (∼100 Hz or more). The increase in release probability is thought to be attributable to the Ca2+ (bound or unbound) that remains in the calyx from the influx generated by one or more previous APs. The exact mechanism of this facilitation is not crucial to the concept (for an overview, see Fisher et al., 1997).
In the model calyx the release probability is heterogeneous because of a nonuniform location of vesicles across different release sites of the same calyx. We will show how this leads to a gradual increase in release probability during consecutive APs, simulated as a 100 Hz train of 10 APs. Two situations are compared: (1) release predicted for the native calyx, i.e., with only endogenous buffers in the presynaptic solution (henceforth “native calyx”) and (2) release predicted for a calyx dialyzed with 0.5 mm EGTA (“EGTA calyx”). To include the effect of Ca2+ removal, we added to the model a linear extrusion mechanism with a rate γ = 400/sec (Helmchen et al., 1997) (see Materials and Methods).ICa during individual APs remained unchanged. This is in line with the above concept, which assumes that changes in ICa during consecutive APs are not the main factor for increasingPr.
Because the model simulates the Ca2+dynamics of the entire calyx, it predicts a rise in the volume average [Ca2+] during each AP (Fig.11A). Figure11B shows the predicted phasic transmitter release. In the following,Pr(i)cumudenotes the cumulative number of vesicles released up to theith AP [AP(i)] divided by the total number of readily releasable vesicles at the start of the train. Comparing the incremental release from AP to AP, we extract the release probability per single AP [Pr(i)single], which denotes the number of vesicles released by AP(i) divided by the total number of vesicles available for release before AP(i).Pr(i)singleis thus the average release probability of those vesicles that have remained in the calyx after all APs before AP(i). Note that the EPSCs in Figure 11C are calculated by assuming a linear superposition of quantal EPSCs (see Materials and Methods). This leads to a deviation from experimental EPSCs, particularly during the decay phase of single EPSCs and during trains (Sakaba and Neher, 2001b). Therefore, we focus our analysis on predicted release probabilities but nevertheless include the EPSCs for illustration of the concept.
Fig. 11.
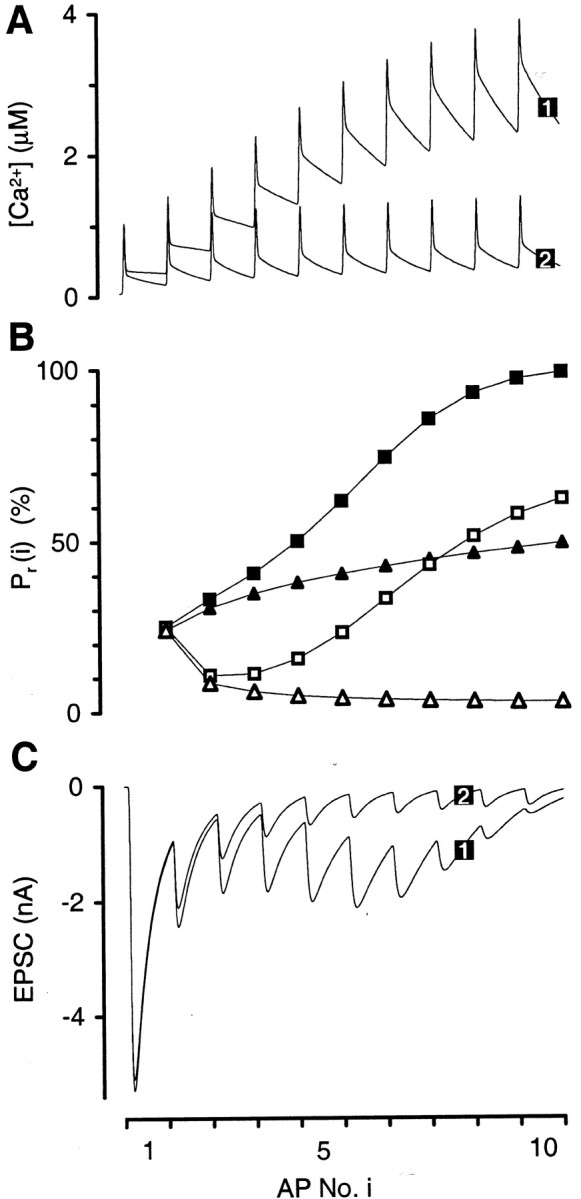
Functional significance of variable channel-to-vesicle distance: consecutive APs. A, Volume average [Ca2+] in calyx during 10 consecutive APs at 100 Hz (reaction volume as in Fig. 7A, reference topography; Ca2+ extrusion included; for details, see Results). Trace 1 shows native calyx (endogenous fixed buffer and ATP only). Trace 2 shows EGTA calyx (with added 0.5 mm EDTA). B, Same simulation as in A. Filled squares, Cumulative number of vesicles released after each pulse in the native calyx as a fraction of the number of vesicles in the readily releasable pool at the start of the train [Pr(i)cumu].Filled triangles, Same as squares but for EGTA calyx. Open squares, Same as filled squares but showing release probability per single AP [Pr(i)single].Open triangles, Same as open squares but for EGTA calyx. C, Same simulation as inA. Trace 1, EPSC for native calyx;trace 2, EPSC for EGTA calyx. Note thatA–C use the same time scale (1 AP = 10 msec).
For the EGTA calyx the fraction of released vesicles increases toPr(10)cumu = 49.3%, meaning that after the 10th AP approximately one-half of the readily releasable vesicles in the original calyx have been released. The predictedPr(i)singledecreases for consecutive APs because the release probability is heterogeneous. During each AP the vesicles located closer to the channel cluster are released preferentially, whereas the vesicles further away tend to be left behind. Such a decrease inPr(i)singleduring the first few stimuli of a train has been observed at the calyx (Sakaba and Neher, 2001b). The predicted volume-averaged [Ca2+] rises only moderately during the course of 10 APs: from 0.18 μm after the first AP (near spatial equilibrium) to 0.40 μm after the tenth AP. Therefore, in line with the above concept, facilitation is kept to a minimum and the increase inPr(i)singleduring the train of APs does not occur in the EGTA calyx.
For the native calyx the situation is quite different.Pr(i)cumuincreases toPr(10)cumu = 98.9%. In contrast to the EGTA calyx, the volume-averaged [Ca2+] rises significantly from 0.34 μm after the first AP to 2.4 μm after the tenth AP.Pr(i)singledecreases from the first to the third AP. However, after the third AP the release probability increases again, toPr(10)single = 62.1%. The gradual increase inPr(i)singleallows the model synapse to gradually make use of the vesicles not released during the first APs (because of disadvantageous location). The EPSC amplitude decreases for APs 8, 9, and 10. This is because the original pool of vesicles is almost exhausted.Pr(10)cumu = 98.9% implies that the calyx could not maintain transmission beyond 100 msec (10 APs). However, within the first 100 msec, experiments for the calyx have measured significant recruitment of new vesicles, i.e., vesicles that were not yet included in the original count of readily releasable vesicles (Wu and Borst, 1999). Even if these vesicles had a rather low response to single isolated APs (because of either intrinsic properties or their disadvantageous location), they could be facilitated in the above manner (see discussion in Wu and Borst, 1999). Therefore, in a real calyx such rapidly recruited new vesicles will be available to maintain the release of neurotransmitter during consecutive APs (Wang and Kaczmarek, 1998).
Facilitation
In the native calyx,Pr(2)single = 10.8%, whereas this probability is lower (8.5%) in the EGTA calyx. A lowerPr(2)single in the presence of buffers, i.e., a more pronounced heterogeneity, has in fact been observed for the calyx (Sakaba and Neher, 2001b). The 10.8 versus 8.5% implies a facilitation ofPr of ∼27% (comparing the native vs the EGTA calyx). In the model the facilitation of vesicles during consecutive APs is caused by several effects: (1) Ca2+ still bound to binding sites of release-controlling Ca2+ sensor after the first AP (marginal contribution, off-rates are fast); (2) pre-equilibration of the release-controlling Ca2+ sensor to a higher volume average [Ca2+]vol(marginal contribution; on-rates are fast); (3) partial depletion (local and global) of endogenous buffers (fixed and ATP) and therefore less effective attenuation of the local [Ca2+]vesicle for the second AP [moderate contribution because attenuation of [Ca2+]vesicle by endogenous buffers is weak (see Materials and Methods); but see Bennett et al. (2000) and discussion in Neher (1998b)]; (4) higher [Ca2+]vesicleduring the second AP because transients induced byICa are added (approximately) to the higher volume-averaged [Ca2+] at the beginning of the second AP (main contribution). Note that the above effects may not describe facilitation of physiological release probabilities in a more than qualitative way, and our analysis does not preclude the possibility of additional mechanisms mediating short-term facilitation at the calyx. In experiments with trains of APs, the second EPSC and thus the impliedPr(2)single is higher than that predicted by our model (Barnes-Davies and Forsythe, 1995; Borst et al., 1995; Schneggenburger et al., 1999).
DISCUSSION
Release site topography
The main result is the topography of release sites at the calyx (postnatal days 8–10). The majority of Ca2+ channels controlling phasic release is organized in clusters (10 or more channels per cluster; cluster diameter ∼50 nm or less). Readily releasable vesicles are located at a variable distance from the cluster controlling their release (30–300 nm; average ∼100 nm). Using this nonuniform topography, the model reproduces Pr in agreement with experiments. This does not exclude possible other distributions of cluster-to-vesicle distances (provided they are not equidistant) because these may yield similar net Pracross the multiple release sites of the calyx. For example, we cannot rule out the possible existence of colocalized subclasses of vesicles for which the distance from channels might be controlled by anatomical links (Rozov et al., 2001; Sakaba and Neher, 2001a).
Robustness of findings on topography
The findings on the topography are robust; they are based on large quantitative effects and are insensitive to imperfectly known parameters. For example, reproduction of the effects of the buffers onPr does not depend on the exact distribution of channel-to-vesicle distances (see Property I), nor does it depend on the assumed time course of single channel currents [a pulse-like current of 100 μsec duration (Fig. 10A) predicts 33% Pr for the control condition, 21% for 10 mm EGTA, and 11% for 1 mm BAPTA]. The requirement that neighboring Ca2+ sources be separated by at least ∼200 nm is valid for two parameter sets for EGTA and is independent of ATP (see Property II). The requirement that multiple Ca2+ channels control individual vesicles can be derived independently of Ca2+diffusion (see Property III). Furthermore, predictedPr, the basis for the findings on topography, shows only weak sensitivity to any reasonable variation of endogenous buffer parameters (see Materials and Methods). Finally, two release models yield the same findings on the topography (see Properties I–III).
Alternative, but less likely, topographies
Having focused our analysis on required topographic properties rather than on specific fixed topographies, we can evaluate a large parameter space of alternative topographies without testing them in time-consuming simulations. Although conceivable anatomically, alternative topographies satisfy only one or two of the required properties and, therefore, are consistent with only parts of the experimental data.
For example, a vesicle located inside a ring of Ca2+ channels (Bertram et al., 1999) is consistent with the requirement that a vesicle be controlled by multiple Ca2+ channels at similar distance. However, because the channel-to-vesicle distance does not vary across release sites, such a topography is inconsistent with the measured buffer effects.
As another example, it appears unlikely that the majority of AZs is controlled by more than a few Ca2+ channel clusters. More than one cluster per AZ would decrease the nonuniformity of cluster-to-vesicle distances (CV of distances across release sites too low) while also decreasing the uniformity of distances of an individual vesicle to its release-controlling Ca2+ channels.
Ca2+ transients at room temperature
Because the two release models ascribe different intrinsic Ca2+ sensitivities to a releasable vesicle, predicting exact amplitudes of AP-evoked [Ca2+] transients depends on which model is used in the simulation (see Results). As for the time course, the simulations suggest that it follows the time course ofICa (half-width ∼380 μsec) with only a small lag of ∼50 μsec (except for the few vesicles located further than ∼150 nm away). Note that, at physiological temperatures, [Ca2+] transients reaching vesicles presumably will be briefer and higher, as judged from the changes in Ca2+ influx (Borst and Sakmann, 1998) and APs/EPSCs (Taschenberger and von Gersdorff, 2000).
Release-relevant Ca2+ channels and channel subtypes
For the reference topography, 83% [Release Model B, 58%] of whole-cell ICa is mediated by Ca2+ channels that are located such that they do not control phasic release directly (see Materials and Methods). This is supported by experiments that show that most P/Q-type Ca2+ channels appear to be located near release sites, whereas part of the N-type and R-type channels appear to be located several hundreds of nanometers away from AZs (Wu et al., 1999). During development of the calyx (postnatal days 7–13) the contribution of N-type and R-type channels decreases, leaving the P/Q-type as the predominant Ca2+ channel subtype triggering phasic release (Iwasaki and Takahashi, 1998). We therefore assume that the channel clusters in the model, which mediate the local [Ca2+] signal for phasic release, represent P/Q-type channels.
While channels confined to AZs contribute 17% [42%] of the total Ca2+ influx, AZs cover only 2% of the total presynaptic membrane surface (see Table 1). Assuming similar conductance and popen for all Ca2+ channels, this implies that the density of channels in AZs is ∼10 times higher than that in the unspecialized membrane [Release Model B, 36 times]. This complies with experiments showing regions of locally elevated [Ca2+] at presynaptic release sites (Llinãs et al., 1992; DiGregorio et al., 1999).
Overlap of Ca2+ channel domains and buffer saturation
Whether phasic transmitter release is controlled by one or by several Ca2+ channel domains per vesicle has been much debated (Augustine, 2001).
Regarding experiments that reduced the open probability of Ca2+ channels, the reference topography reproduces the effects of overlapping domains, as discussed in Borst and Sakmann (1999a). Regarding the effects of added exogenous buffers, vesicles essentially behave as if controlled by a single Ca2+ channel domain. Although the Ca2+ current used in the simulations (ICa, peak = 0.66 pA per cluster) is likely too large to be supplied by a single channel, the combined domain of ∼10 clustered channels resembles that of a single large channel. Still, as expected from the relatively low [Ca2+] transients (micromolar range), mobile buffers in the simulation deplete only marginally (see Materials and Methods; also see discussion in Naraghi and Neher, 1997).
Possible other causes for heterogeneousPr
Heterogeneous release probability of vesicles has been observed at several CNS synapses (Dobrunz and Stevens, 1997; Markram et al., 1997;Silver et al., 1998), including the calyx (Sakaba and Neher, 2001b). Even in a readily releasable/fully recovered vesicle pool, a multitude of mechanisms can cause individual vesicles of the pool to have different probabilities of being released during an AP (discussed inSakaba and Neher, 2001b). We suggest that the observed heterogeneity to a large extent may be caused by the variability in the distance between a vesicle and its release-controlling Ca2+channels; other intrinsic properties of the release apparatus, in particular its sensitivity to local [Ca2+] transients, contribute only partially to the heterogeneity. Two arguments support this. (1)Pr in response to spatially uniform [Ca2+] signals measured over a wide range of [Ca2+] could be well explained by a single kinetic model for all vesicles in the readily releasable pool (Bollmann et al., 2000; Schneggenburger and Neher, 2000). This suggests that, at the calyx, possible intrinsic heterogeneities of the response of the vesicles to [Ca2+] are not strongly pronounced (in comparison, see Blank et al., 1998). (2) Although usually not measurable during single APs, the heterogeneity ofPr becomes apparent when the calyx is dialyzed with BAPTA versus EGTA. These Ca2+ buffers differentially modify the [Ca2+] transients during APs, the main difference being at what distance from the Ca2+ channels they are most potent in attenuating the [Ca2+] transient. Thus it seems likely that the observed heterogeneity ofPr to a large extent is caused by the variability in the distance between vesicles and Ca2+ channels. This assumption accurately predicts the experimental results. Note, however, that these arguments do not preclude possible, additional, intrinsic heterogeneity ofPr.
Because other mammalian CNS synapses have similar differential efficacies of BAPTA versus EGTA in suppressing release (Ohana and Sakmann, 1998; Rozov et al., 2001), nonuniform distance between vesicle and Ca2+ source may be found at these synapses as well.
Functional significance of topography and synaptic development
The rather loose, nonuniform spatial organization of vesicles and Ca2+ channels we propose for the calyx (development stage postnatal days 8–10) is in contrast to the spatially more organized release sites of the neuromuscular junction of crayfish (Msghina et al., 1999) and frog (Harlow et al., 2001). However “nonorganized” they may seem, the topographic characteristics we have inferred appear to offer several functional advantages, some of which coincide with synaptic development.
Channel clusters
The clustering of Ca2+ channels ensures that stochastically gated Ca2+channels generate a nevertheless reliable and low-noise [Ca2+] transient controlling the release of transmitter (discussed in Stanley, 1997). Recent studies at the calyx have found that a further increase in its maximum transmission rate during development (postnatal days 5–14) coincides with a faster time course of the presynaptic AP (Taschenberger and von Gersdorff, 2000). A faster AP, however, only results in a faster [Ca2+] transient for all vesicles if the Ca2+ channels are clustered. The clustering of Ca2+ channels (probably P/Q-type; see above) thus ensures maximum benefit of faster APs for synaptic transmission.
Synaptic delay
Synaptic delay times at the calyx shorten during early development (Taschenberger and von Gersdorff, 2000). The delays depend, among other factors such as AP time course, on the location of vesicles (see Results). Therefore, the shortening of delays may be attributable partly to a possible spatial reorganization of vesicles around release-controlling channels during development.
Heterogeneous Pr
The multitude of channel-to-vesicle distances (in our model, random) serves to create an “immediate back-up pool” of vesicles. Vesicles in this pool, which is defined only by the location of the vesicles, are readily releasable with respect to the intrinsic Ca2+ sensitivity. Their release probability in response to single AP-evoked [Ca2+] transients is negligible but increases gradually during consecutive APs (see Results).
In conclusion, we find that the developmental specialization of the calyx toward high-fidelity, high-frequency transmission may be aided by a spatial reorganization of its release sites toward the proposed nonuniform topography.
Footnotes
J.G.G.B. was supported by a Pioneer program of the Netherlands Organization for Scientific Research. We thank Erwin Neher for advice on the present work; Johann Heiner Bollmann, Ora Ohana, Arnd Roth, and Lisa D. Silverman for advice on this manuscript; Raphael J. Utz for the term “topography” as well as for late-night linguistic and diplomatic guidance; art for biomed/E. Heil (Frankfurt/M) for three-dimensional graphics (Fig. 8); and everyone in the Department of Cell Physiology at the Max Planck Institute for Medical Research, Heidelberg, for helpful discussions.
Correspondence should be addressed to Christoph Meinrenken, Max Planck Institute for Medical Research/4, Jahnstrasse 29, 69120 Heidelberg, Germany. E-mail: cjm@mpimf-heidelberg.mpg.de.
J. G. G. Borst's present address: Department of Neuroscience, Erasmus University, Rotterdam, The Netherlands.
REFERENCES
- 1.Adler EM, Augustine GJ, Duffy SN, Charlton MP. Alien intracellular calcium chelators attenuate neurotransmitter release at the squid giant synapse. J Neurosci. 1991;11:1496–1507. doi: 10.1523/JNEUROSCI.11-06-01496.1991. [DOI] [PMC free article] [PubMed] [Google Scholar]
- 2.Albritton NL, Meyer T, Stryer L. Range of messenger action of calcium ion and inositol 1,4,5-triphosphate. Science. 1992;258:1812–1815. doi: 10.1126/science.1465619. [DOI] [PubMed] [Google Scholar]
- 3.Auger C, Marty A. Quantal currents at single-site central synapses. J Physiol (Lond) 2000;526:3–11. doi: 10.1111/j.1469-7793.2000.t01-3-00003.x. [DOI] [PMC free article] [PubMed] [Google Scholar]
- 4.Augustine GJ. How does calcium trigger neurotransmitter release? Curr Opin Neurobiol. 2001;11:320–326. doi: 10.1016/s0959-4388(00)00214-2. [DOI] [PubMed] [Google Scholar]
- 5.Augustine GJ, Neher E. Neuronal [Ca2+] signaling takes the local route. Curr Opin Neurobiol. 1992;2:302–307. doi: 10.1016/0959-4388(92)90119-6. [DOI] [PubMed] [Google Scholar]
- 6.Augustine GJ, Adler EM, Charlton MP. The calcium signal for transmitter secretion from presynaptic nerve terminals. Ann NY Acad Sci. 1991;635:365–381. doi: 10.1111/j.1749-6632.1991.tb36505.x. [DOI] [PubMed] [Google Scholar]
- 7.Barnes-Davies M, Forsythe ID. Pre- and postsynaptic glutamate receptors at a giant excitatory synapse in rat auditory brainstem slices. J Physiol (Lond) 1995;488:387–406. doi: 10.1113/jphysiol.1995.sp020974. [DOI] [PMC free article] [PubMed] [Google Scholar]
- 8.Baylor SM, Hollingworth S. Model of sarcomeric Ca2+ movements, including ATP Ca2+ binding and diffusion, during activation of frog skeletal muscle. J Gen Physiol. 1998;112:297–316. doi: 10.1085/jgp.112.3.297. [DOI] [PMC free article] [PubMed] [Google Scholar]
- 9.Bennett MR, Farnell L, Gibson WG. The probability of quantal secretion within an array of calcium channels of an active zone. Biophys J. 2000;78:2222–2240. doi: 10.1016/S0006-3495(00)76770-1. [DOI] [PMC free article] [PubMed] [Google Scholar]
- 10.Bertram R, Smith GD, Sherman A. Modeling study of the effects of overlapping Ca2+ microdomains on neurotransmitter release. Biophys J. 1999;76:735–750. doi: 10.1016/S0006-3495(99)77240-1. [DOI] [PMC free article] [PubMed] [Google Scholar]
- 11.Blank PS, Cho MS, Vogel SS, Kaplan D, Kang A, Malley J, Zimmerberg J. Submaximal responses in calcium-triggered exocytosis are explained by differences in the calcium sensitivity of individual secretory vesicles. J Gen Physiol. 1998;112:559–567. doi: 10.1085/jgp.112.5.559. [DOI] [PMC free article] [PubMed] [Google Scholar]
- 12.Bollmann JH, Sakmann B, Borst JGG. Calcium sensitivity of glutamate release in a calyx-type terminal. Science. 2000;289:953–957. doi: 10.1126/science.289.5481.953. [DOI] [PubMed] [Google Scholar]
- 13.Borst JGG, Sakmann B. Calcium influx and transmitter release in a fast CNS synapse. Nature. 1996;383:431–434. doi: 10.1038/383431a0. [DOI] [PubMed] [Google Scholar]
- 14.Borst JGG, Sakmann B. Calcium current during single action potential in a large presynaptic terminal of the rat brain stem. J Physiol (Lond) 1998;506:143–157. doi: 10.1111/j.1469-7793.1998.143bx.x. [DOI] [PMC free article] [PubMed] [Google Scholar]
- 15.Borst JGG, Sakmann B. Effects of changes in action potential shape on calcium currents and transmitter release in a calyx-type synapse of the rat auditory brain stem. Philos Trans R Soc Lond B Biol Sci. 1999a;354:347–355. doi: 10.1098/rstb.1999.0386. [DOI] [PMC free article] [PubMed] [Google Scholar]
- 16.Borst JGG, Sakmann B. Depletion of calcium in the synaptic cleft of a calyx-type synapse in the rat brainstem. J Physiol (Lond) 1999b;521:123–133. doi: 10.1111/j.1469-7793.1999.00123.x. [DOI] [PMC free article] [PubMed] [Google Scholar]
- 17.Borst JGG, Helmchen F, Sakmann B. Pre- and postsynaptic whole-cell recordings in the medial nucleus of the trapezoid body of the rat. J Physiol (Lond) 1995;489:825–840. doi: 10.1113/jphysiol.1995.sp021095. [DOI] [PMC free article] [PubMed] [Google Scholar]
- 18.Chow RH, Klingauf J, Neher E. Time course of Ca2+ concentration triggering exocytosis in neuroendocrine cells. Proc Natl Acad Sci USA. 1994;91:12765–12769. doi: 10.1073/pnas.91.26.12765. [DOI] [PMC free article] [PubMed] [Google Scholar]
- 19.Church PJ, Stanley EF. Single L-type calcium channel conductance with physiological levels of calcium in chick ciliary ganglion neurons. J Physiol (Lond) 1996;496:59–68. doi: 10.1113/jphysiol.1996.sp021665. [DOI] [PMC free article] [PubMed] [Google Scholar]
- 20.Colecraft HM, Brody DL, Yue DT. G-protein inhibition of N- and P/Q-type calcium channels: distinctive elementary mechanisms and their functional impact. J Neurosci. 2001;21:1137–1147. doi: 10.1523/JNEUROSCI.21-04-01137.2001. [DOI] [PMC free article] [PubMed] [Google Scholar]
- 21.Cooper RL, Winslow JL, Govind CK, Atwood HL. Synaptic structural complexity as a factor enhancing probability of calcium-mediated transmitter release. J Neurophysiol. 1996;75:2451–2466. doi: 10.1152/jn.1996.75.6.2451. [DOI] [PubMed] [Google Scholar]
- 22.DiGregorio DA, Peskoff A, Vergara JL. Measurement of action potential-induced presynaptic calcium domains at a cultured neuromuscular junction. J Neurosci. 1999;19:7846–7859. doi: 10.1523/JNEUROSCI.19-18-07846.1999. [DOI] [PMC free article] [PubMed] [Google Scholar]
- 23.Dobrunz LE, Stevens CF. Heterogeneity of release probability, facilitation, and depletion at central synapses. Neuron. 1997;18:995–1008. doi: 10.1016/s0896-6273(00)80338-4. [DOI] [PubMed] [Google Scholar]
- 24.Fisher SA, Fischer TM, Carew TJ. Multiple overlapping processes underlying short-term synaptic enhancement. Trends Neurosci. 1997;20:170–177. doi: 10.1016/s0166-2236(96)01001-6. [DOI] [PubMed] [Google Scholar]
- 25.Forsythe ID, Barnes-Davies M, Brew HM. The calyx of Held: a model for transmission at mammalian glutamatergic synapses. In: Wheal H, Thomson A, editors. Excitatory amino acids and synaptic transmission. Academic; London: 1995. pp. 133–144. [Google Scholar]
- 26.Gil A, Segura J, Pertusa JAG, Soria B. Monte Carlo simulation of 3-D buffered Ca2+ diffusion in neuroendocrine cells. Biophys J. 2000;78:13–33. doi: 10.1016/s0006-3495(00)76569-6. [DOI] [PMC free article] [PubMed] [Google Scholar]
- 27.Glavinovic MI, Rabie HR. Monte Carlo evaluation of quantal analysis in the light of Ca2+ dynamics and the geometry of secretion. Pflügers Arch. 2001;443:132–145. doi: 10.1007/s004240100631. [DOI] [PubMed] [Google Scholar]
- 28.Gollasch M, Hescheler J, Quale JM, Patlak JB, Nelson MT. Single calcium channel currents of arterial smooth muscle at physiological calcium concentrations. Am J Physiol. 1992;263:C948–C952. doi: 10.1152/ajpcell.1992.263.5.C948. [DOI] [PubMed] [Google Scholar]
- 29.Harlow LH, Ress D, Stoschek A, Marshall RM, McMahan UJ. The architecture of active zone material at the frog's neuromuscular junction. Nature. 2001;409:479–484. doi: 10.1038/35054000. [DOI] [PubMed] [Google Scholar]
- 30.Helmchen F, Borst JGG, Sakmann B. Calcium dynamics associated with a single action potential in a CNS presynaptic terminal. Biophys J. 1997;72:1458–1471. doi: 10.1016/S0006-3495(97)78792-7. [DOI] [PMC free article] [PubMed] [Google Scholar]
- 31.Isaacson JS, Walmsley B. Counting quanta: direct measurements of transmitter release at a central synapse. Neuron. 1995;15:875–884. doi: 10.1016/0896-6273(95)90178-7. [DOI] [PubMed] [Google Scholar]
- 32.Iwasaki S, Takahashi T. Developmental changes in calcium channel types mediating synaptic transmission in rat auditory brain stem. J Physiol (Lond) 1998;509:419–423. doi: 10.1111/j.1469-7793.1998.419bn.x. [DOI] [PMC free article] [PubMed] [Google Scholar]
- 33.Katz B. The release of neural transmitter substances. Thomas; Springfield, IL: 1969. [Google Scholar]
- 34.Klingauf J, Neher E. Modeling buffered Ca2+ diffusion near the membrane: implications for secretion in neuroendocrine cells. Biophys J. 1997;72:674–690. doi: 10.1016/s0006-3495(97)78704-6. [DOI] [PMC free article] [PubMed] [Google Scholar]
- 35.Llinãs R, Sugimori M, Silver RB. Microdomains of high calcium concentration in a presynaptic terminal. Science. 1992;256:677–679. doi: 10.1126/science.1350109. [DOI] [PubMed] [Google Scholar]
- 36.Markram H, Lübke J, Frotscher M, Roth A, Sakmann B. Physiology and anatomy of synaptic connections between thick tufted pyramidal neurones in the developing rat neocortex. J Physiol (Lond) 1997;500:409–440. doi: 10.1113/jphysiol.1997.sp022031. [DOI] [PMC free article] [PubMed] [Google Scholar]
- 37.Msghina M, Millar AG, Charlton MP, Govind CK, Atwood HL. Calcium entry related to active zones and differences in transmitter release at phasic and tonic synapses. J Neurosci. 1999;19:8419–8434. doi: 10.1523/JNEUROSCI.19-19-08419.1999. [DOI] [PMC free article] [PubMed] [Google Scholar]
- 38.Nägerl UV, Novo D, Mody I, Vergara JL. Binding kinetics of calbindin-D28k determined by flash photolysis of caged Ca2+. Biophys J. 2000;79:3009–3018. doi: 10.1016/S0006-3495(00)76537-4. [DOI] [PMC free article] [PubMed] [Google Scholar]
- 39.Naraghi M, Neher E. Linearized buffered Ca2+ diffusion in microdomains and its implications for calculation of [Ca2+] at the mouth of a calcium channel. J Neurosci. 1997;17:6961–6973. doi: 10.1523/JNEUROSCI.17-18-06961.1997. [DOI] [PMC free article] [PubMed] [Google Scholar]
- 40.Neher E. Concentration profiles of intracellular calcium in the presence of a diffusable chelator. Exp Brain Res. 1986;14:80–96. [Google Scholar]
- 41.Neher E. Vesicle pools and Ca2+ microdomains: new tools for understanding their roles in neurotransmitter release. Neuron. 1998a;20:389–399. doi: 10.1016/s0896-6273(00)80983-6. [DOI] [PubMed] [Google Scholar]
- 42.Neher E. Usefulness and limitations of linear approximations to the understanding of Ca2+ signals. Cell Calcium. 1998b;24:345–357. doi: 10.1016/s0143-4160(98)90058-6. [DOI] [PubMed] [Google Scholar]
- 43.Oertel D. The role of timing in the brain stem auditory nuclei of vertebrates. Annu Rev Physiol. 1999;61:497–519. doi: 10.1146/annurev.physiol.61.1.497. [DOI] [PubMed] [Google Scholar]
- 44.Ohana O, Sakmann B. Transmitter release modulation in nerve terminals of rat neocortical pyramidal cells by intracellular calcium buffers. J Physiol (Lond) 1998;513:135–148. doi: 10.1111/j.1469-7793.1998.135by.x. [DOI] [PMC free article] [PubMed] [Google Scholar]
- 45.Press WH, Teukolsky SA, Vetterling WT, Flannery BP. Numerical recipes in C. Cambridge UP; New York: 1988. [Google Scholar]
- 46.Quastel DMJ, Guan YY, Saint DA. The relation between transmitter release and Ca2+ entry at the mouse motor nerve terminal: role of stochastic factors causing heterogeneity. Neuroscience. 1992;51:657–671. doi: 10.1016/0306-4522(92)90305-l. [DOI] [PubMed] [Google Scholar]
- 47.Rowland KC, Irby NK, Spirou AG. Specialized synapse-associated structures within the calyx of Held. J Neurosci. 2000;20:9135–9144. doi: 10.1523/JNEUROSCI.20-24-09135.2000. [DOI] [PMC free article] [PubMed] [Google Scholar]
- 48.Rozov A, Burnashev N, Sakmann B, Neher E. Transmitter release modulation by intracellular Ca2+ buffers in facilitating and depressing nerve terminals of pyramidal cells in layer 2/3 of the rat neocortex indicates a target cell-specific difference in presynaptic calcium dynamics. J Physiol (Lond) 2001;531:807–826. doi: 10.1111/j.1469-7793.2001.0807h.x. [DOI] [PMC free article] [PubMed] [Google Scholar]
- 49.Sakaba T, Neher E. Preferential potentiation of fast-releasing synaptic vesicles by cAMP at the calyx of Held. Proc Natl Acad Sci USA. 2001a;98:331–336. doi: 10.1073/pnas.021541098. [DOI] [PMC free article] [PubMed] [Google Scholar]
- 50.Sakaba T, Neher E. Quantitative relationship between transmitter release and calcium current at the calyx of Held synapse. J Neurosci. 2001b;21:462–476. doi: 10.1523/JNEUROSCI.21-02-00462.2001. [DOI] [PMC free article] [PubMed] [Google Scholar]
- 51.Schneggenburger R, Neher E. Intracellular calcium dependence of transmitter release rates at a fast central synapse. Nature. 2000;406:889–893. doi: 10.1038/35022702. [DOI] [PubMed] [Google Scholar]
- 52.Schneggenburger R, Meyer AC, Neher E. Released fraction and total size of pool of immediately available transmitter quanta at a calyx synapse. Neuron. 1999;23:399–409. doi: 10.1016/s0896-6273(00)80789-8. [DOI] [PubMed] [Google Scholar]
- 53.Silver RA, Momiyama A, Cull-Candy SG. Locus of frequency-dependent depression identified with multiple-probability fluctuation analysis at rat climbing fibre–Purkinje cell synapses. J Physiol (Lond) 1998;510:881–902. doi: 10.1111/j.1469-7793.1998.881bj.x. [DOI] [PMC free article] [PubMed] [Google Scholar]
- 54.Smith GD. Modeling local and global calcium signals using reaction diffusion equations. In: Schutter ED, editor. Computational neuroscience. CRC; Boca Raton, FL: 2001. pp. 49–85. [Google Scholar]
- 55.Stanley EF. The calcium channel and the organization of the presynaptic transmitter release face. Trends Neurosci. 1997;20:404–409. doi: 10.1016/s0166-2236(97)01091-6. [DOI] [PubMed] [Google Scholar]
- 56.Sun J, Wu L. Fast kinetics of exocytosis revealed by simultaneous measurements of presynaptic capacitance and postsynaptic currents at a central synapse. Neuron. 2001;30:171–182. doi: 10.1016/s0896-6273(01)00271-9. [DOI] [PubMed] [Google Scholar]
- 57.Taschenberger H, von Gersdorff H. Fine-tuning an auditory synapse for speed and fidelity: developmental changes in presynaptic waveform, EPSC kinetics, and synaptic plasticity. J Neurosci. 2000;20:9162–9173. doi: 10.1523/JNEUROSCI.20-24-09162.2000. [DOI] [PMC free article] [PubMed] [Google Scholar]
- 58.Van der Kloot W. Estimating the timing of quantal releases during end-plate currents at the frog neuromuscular junction. J Physiol (Lond) 1988;402:595–603. doi: 10.1113/jphysiol.1988.sp017224. [DOI] [PMC free article] [PubMed] [Google Scholar]
- 59.Wang LY, Kaczmarek LK. High-frequency firing helps replenish the readily releasable pool of synaptic vesicles. Nature. 1998;394:384–388. doi: 10.1038/28645. [DOI] [PubMed] [Google Scholar]
- 60.Wu LG, Borst JGG. The reduced release probability of releasable vesicles during recovery from short-term synaptic depression. Neuron. 1999;23:821–832. doi: 10.1016/s0896-6273(01)80039-8. [DOI] [PubMed] [Google Scholar]
- 61.Wu LG, Westenbroek RE, Borst JGG, Catterall WA, Bert Sakmann Calcium channel types with distinct presynaptic localization couple differentially to transmitter release in single calyx-type synapses. J Neurosci. 1999;19:726–736. doi: 10.1523/JNEUROSCI.19-02-00726.1999. [DOI] [PMC free article] [PubMed] [Google Scholar]
- 62.Yamada WM, Zucker RS. Time course of transmitter release calculated from simulations of a calcium diffusion model. Biophys J. 1992;61:671–682. doi: 10.1016/S0006-3495(92)81872-6. [DOI] [PMC free article] [PubMed] [Google Scholar]
- 63.Yoshikami D, Bagabaldo Z, Olivera BM. The inhibitory effects of omega-conotoxins on Ca channels and synapses. Ann NY Acad Sci. 1989;560:230–248. doi: 10.1111/j.1749-6632.1989.tb24100.x. [DOI] [PubMed] [Google Scholar]