

Abstract
In gustatory cortex, single-neuron activity reflects the multimodal processing of taste stimuli. Little is known, however, about the interactions between gustatory cortical (GC) neurons during tastant processing. Here, these interactions were characterized. It was found that 36% (85 of 237) of neuron pairs, including many (61%) in which one or both single units were not taste specific, produced significant cross-correlations (CCs) to a subset of tastants across a hundreds of milliseconds timescale. Significant CCs arose from the coupling between the firing rates of neurons as those rates changed through time. Such coupling significantly increased the amount of tastant-specific information contained in ensembles. These data suggest that taste-specific GC assemblies may transiently form and coevolve on a behaviorally appropriate timescale, contributing to rats' ability to discriminate tastants.
Keywords: insular, taste, cross-correlation, multiple electrode, coding, dynamics
In awake rats, gustatory cortical (GC) neurons produce time-varying responses to gustatory stimuli (Katz et al., 2001a). Such time-varying responses may arise because these neurons are embedded in neural networks that process tastants interactively, as has been suggested for other sensory systems (Bazhenov et al., 2001; Ghazanfar et al., 2001). In recordings from pairs of neurons in anesthetized rats, the occurrence of tight (±20 msec) cross-correlations (CCs) has revealed functional interactions between GC (Yokota et al., 1996, 1997; Nakamura and Ogawa, 1997) or gustatory brainstem (Adachi et al., 1989; Di Lorenzo and Monroe, 1997) neurons. These previous studies, however, did not determine whether neural interactions across hundreds of milliseconds, the timescale of both single-neuron GC response dynamics (Katz et al., 2001a) and gustatory decision making (Halpern, 1985), might be related to system processing (Nowak and Bullier, 2000; Salinas and Sejnowski, 2001).
To determine whether time-varying GC responses are related to network processing, it is necessary to characterize GC neuronal interactions across this broader timescale by recording the simultaneous activity of small ensembles of GC neurons while delivering tastants to the tongues of awake rats. After application of a subset of tastants, pairs of neurons produced peaked CCs (mean half-width ≅300 msec), even when single-unit analyses suggested that one or both neurons were not taste specific. Taste-specific CCs were explicable as coupling in response rates of neurons as they changed through poststimulus time and suggest the emergence of taste-specific neural assemblies that interact on a behaviorally relevant timescale. The formation of such assemblies facilitates tastant processing in a manner consistent with population theories of taste perception (Erickson, 2001).
MATERIALS AND METHODS
Subjects. All procedures accorded with the National Institutes of Health guidelines for the treatment of animal subjects. Male (n = 3) and female (n = 9) Long–Evans rats (275–300 gm) served as subjects for this study. Because no sex-related differences were observed, the data from male and female rats were pooled.
Surgery. Anesthetized rats [5% halothane and then either pentobarbital (50 mg/kg, i.p.) or ketamine and xylazine (100 and 10 mg/kg, i.m., respectively)] were implanted unilaterally or bilaterally with electrode bundles in the GC [anteroposterior, 1.2–1.5 mm; mediolateral, 5.2 mm; dorsoventral, approximately −4.5 mm from dura] (Kosar et al., 1986). Intraoral cannulas (IOCs) were implanted bilaterally as well (Phillips and Norgren, 1970; Katz et al., 2001a).
Each electrode bundle included 16 Formvar-coated nichrome wires (diameter of 25-μm), cut flat with carbide-tipped scissors. The impedance of the wires was 200–500 KΩ at 1 kHz. The wires were glued to a small microdrive such that they could be advanced through the brain in the weeks after surgery (Katz et al., 2001b).
Behavioral procedure. After recovery from surgery, water-restricted rats were adapted to mild restraint, after which 90–120 min sessions were run in which 40 μl of a randomly selected tastant was delivered every 90 sec, interspersed with 80 μl water rinses. The stimuli were delivered via IOCs or a nozzle situated directly in front of the mouth. The two delivery methods produced similar responses (Nishijo and Norgren, 1991; Katz et al., 2001a). The tastants were citric acid [CA (0.02 m)], NaCl [Na (0.1 m)], sucrose [Suc (0.1m)], quinine HCl [Q (0.001m)], nicotine [Nic (100 μm)], and water (W) (Katz et al., 2001a). One rat was not tested with nicotine.
The triggering of tastant delivery solenoids was transmitted to the data acquisition computer (Plexon Inc., Dallas, TX). Off-line, the data were adjusted for physical delays between this signal and the time at which fluid hit the tongue, in accordance with the following test. The stimulus delivery apparatus was placed an appropriate distance from an “artificial rat tongue” (two bare wire tips, separated by 1 mm of air, that were the ends of an open circuit including a battery and oscilloscope); the second input to the oscilloscope monitored the transistor–transistor logic pulse to the fluid-delivery solenoid. NaCl was delivered, connecting and completing the battery circuit, and the resultant delay between solenoid opening and stimulus hitting the tongue could be viewed on the oscilloscope. In the case of delivery via an intraoral cannula, this delay was reliably 45 msec (±4 msec range). In the case of nozzle delivery (which had to be placed further from the tongue), the delay was 90 msec (±8 msec range).
Electrophysiology. Single neurons of >3:1 signal-to-noise ratio were isolated using a waveform template algorithm (Nicolelis et al., 1997a) and corrected off-line using cluster cutting software (Plexon Inc.). All isolations lasted >2 hr, allowing for the delivery of 10–30 trials of each tastant. Figure1 presents an example of a raw oscilloscope trace, as well as an example of extracted waveforms and associated interspike interval statistics of units isolated from individual microwires. The larger unit in Figure 1Ais Neuron 1 from Figure2A, and the two units in Figure 1, B and C, are Neurons 1and 2 from Figure 2B.
Fig. 1.

Examples of GC recordings. A, An oscilloscope trace showing the signal from a single microwire placed in GC. One larger and one smaller spike can be seen. The larger spike isNeuron 1 from Figure 2A. Thetrace has a time base of 5 msec per division.B, Extracted waveforms from two channels in a different animal. The signal-to-noise ratio of the left neuron was 6:1; that of the right neuron was 4:1. These areNeurons 1 and 2, respectively, used in Figure 2B. C, The interspike interval plots for the neurons in B. Note the presence of a refractory period in the records of both neurons. k = 1000.
Fig. 2.
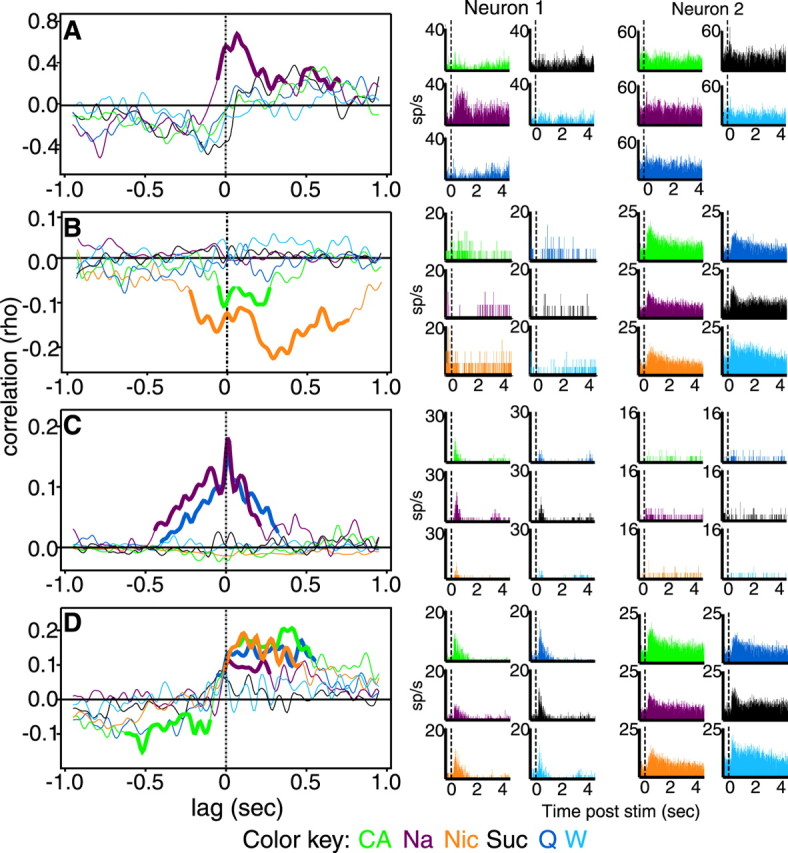
Taste-specific CCs between pairs of GC neurons.A, The CCs (left) and PSTHs (right) of a pair of GC neurons to the battery of tastants. The CCs of this pair to NaCl (mauve) is highly significant (significant portions are shown as bold lines); the half-height of the peak is ∼300 msec. Theabscissa is lag (in seconds); theordinate is correlation. The PSTHs for Neuron 1 show an positive response to NaCl and subtle negative responses to quinine HCl and acid; Neuron 2 did not respond in a taste-specific manner. B, Similar CCs and PSTHs for another pair of neurons, showing significant negative interactions to nicotine and acid; only mild specificity of response can be seen in the PSTHs. C, CCs and PSTHs for two neurons recorded from a single wire. These neurons cohered in the presence of NaCl and quinine on a very short timescale, visible in the sharp peak just offset from 0 lag, as well as on the longer timescale. Neither neuron showed taste specificity of response in PSTHs. D, CCs and PSTHs for a between-hemisphere pair of neurons (same rat as in Fig.1B), one of which was mildly taste specific according to PSTH, that produced significant positive CC peaks to nicotine, NaCl, and quinine and showed a biphasic negative–positive interaction to acid. Green, CA; mauve, Na; orange, Nic; dark blue, Q;black, Suc; light blue,W.
Paired-unit analyses. CCs were calculated using spikes produced during the 4 sec after tastant administration. Analyses were performed to ascertain which of various types of coupling were responsible for significant CC peaks and to determine the nature of GC interactions (Perkel et al., 1967; Aertsen et al., 1989; Brody, 1999a). These analyses involved sequentially removing various aspects of the observed responses (see below).
To remove the portions of CCs attributable to common input to both neurons, the “optimal shift predictors” [cross-correlations made after the trials of one of the neurons are shuffled; essentially cross-correlations between the two peristimulus histograms (PSTH) with trial-to-trial coherence ignored] were subtracted from CCs made from the original data (Perkel et al., 1967). The “shift predictor” contains only information that is time locked to stimulus presentation, that is, that pertains to stimulus-driven activation. This subtraction procedure therefore leaves only cross-correlation structure that is related to actual interdependence between the neurons. In fact, this procedure leads to an underestimation of the actual interdependence between neurons, because some true between-neuron interactions may in fact be stimulus locked.
To test whether direct spike-to-spike coupling (synchrony) was responsible for the CC peaks, raw data were compared with bootstrapped simulations (Seidemann et al., 1996; Baker and Lemon, 2000; Bair et al., 2001). First, single-trial spike trains were turned into firing probability vectors, determined at each time point by the interspike interval between previous and succeeding action potentials. These vectors were then smoothed through convolution with a ς of 50 msec Gaussian distribution. Once the smoothed vectors (one per trial) were created, spike trains were simulated from each. Ten such “smoothed simulations” were produced, and the average CC for each simulated neuron pair was calculated. Neuronal activity was modeled as gamma processes, which is to say as Poisson processes with refractory periods and “fat tails.” The orders of the gamma distributions were chosen to match the interspike interval plots (minimizing least-squared error) of the real data (Baker and Lemon, 2000).
Surrogate spike data were generated using the millisecond-by-millisecond firing probability estimation and the appropriate gamma distribution (Baker and Lemon, 2000). These simulations provided estimates of the expected variability in cross-correlogram height, taking into account the observed single-unit spiking distributions and broad single-trial response patterns but ignoring spike-to-spike interactions in the real data. CC peaks generated from spike trains simulated in this way solely reflected rate-related (i.e., not spike-to-spike) coupling.
If the firing rates of a neuron pair vary together between trials across a session, this coupling may cause the appearance of a peak in their cross-correlogram (Brody, 1999b). To test whether such coupled magnitude could account for CC peaks observed in this study, the above simulation procedure was repeated, but the computed probability vectors were normalized so that each trial had the same mean before spike-train simulation (“normalized smoothed simulation”). Such normalization removed any coupled magnitude effects by removing any between-trial structure in the responses and leaves only within-trial rate coupling.
To test whether coupled rate changes, the tendency for significant within-trial changes in the time-varying response of one neuron to be coupled to those of another neuron, played a role in producing CC peaks, the above data were compared with the results of yet another simulation: the “rate-change simulation.” Trials were simulated as above, with one difference: no smoothing was done across times of significant within-trial firing rate changes (Pauluis and Baker, 2000). The algorithm used to determine times of firing rate change worked locally on sets of three successive action potentials. The interspike interval between the first two spikes served as the momentary average of the gamma distribution describing the firing of that neuron, the order having been estimated as described above. This provided the means to determine whether the third was unlikely (p < 0.01) to have been produced by the same gamma-distributed firing rate. Such “unlikely spikes” were determined to represent significant changes in firing rate (Pauluis and Baker, 2000).
CCs based on these vectors emphasized coupling of firing rate change times. Comparisons with smoothed simulations thus revealed the importance of coupled rate changes. These CCs were also compared with CCs calculated from “normalized rate-change simulations.”
To test whether any coupled rate changes reflected purely coupled latency, the tendency for the initial response onsets of the neuron pairs to vary together between trials (Brody, 1999a), the initial response changes, determined as part of the analysis described in the above paragraphs, for interacting neuron pairs were examined. Any coupled latency will be reflected in a simple Pearson's product moment correlation between the initial latencies of the two neurons.
Because interpretations of CCs are complicated by peaks in the autocorrelograms of the neurons (Rosenberg et al., 1989; Nowak and Bullier, 2000), we bolstered our analyses with several supporting measures. First, the autocorrelograms of all units were examined, and only data for which the autocorrelograms did not differ significantly between tastants (according to χ2 tests) was further analyzed. Second, significance tests were constructed based on one final simulation, in which independent pairs of spike trains were constructed based on the observed single-unit firing rates and spiking distributions, but ignoring any single-trial interactions in the data. The PSTH of each neuron was used as the underlying firing probability vector in this analysis, and a number of trials equal to that actually collected were generated from this one probability vector. Ten such simulations were prepared for each pair of neurons, and binwise confidence intervals for chance interactions were constructed from the means and SDs of these samples. Actual and simulated CCs were smoothed with a 20 msec Gaussian to limit the effect of outliers.
To ensure conservatism of interpretation, the significance criterion was set at p < 0.001. Furthermore, only sections of CC that were significant for ≥100 msec, or for which the peak was greater than twice the amplitude of the significance criterion, were counted as significant. These four criteria, set after examining real and simulated CCs, made the occurrence of appreciable rates of spurious significance very unlikely.
The results differed little for significance criteria set between 0.01 and 0.001, a fact that stands testament to the robustness of the phenomena. Furthermore, the fact that the number of significantly interacting pairs did not scale with size of recorded ensemble [the correlation between these two variables did not reach significance (r2 = 0.24; Fisher's z (10) = 1.77; NS)] adds credence, above and beyond the stringent significance criterion used, to our claim that the observed interactions did not occur randomly. Results using a variety of alternative techniques for building CC confidence intervals (Brillinger, 1992; Politis et al., 1992) also led to similar conclusions. The simulations were used because they facilitated additional analysis, as described above.
Between-simulation comparisons used the maximum height of the peak of the produced CCs, normalized to the peak height of the empirical CC. Widths at half-height were calculated as the distance between the sides of a peak at the height halfway between the peak and the average value of the correlation across all lags (or between the peak and zero, if the CC showed biphasic peaks). The similarities between cross-correlations was calculated using Pearson's product Moment correlation (r), computed using the values of one cross-correlation for lags between ±1 sec as one vector of numbers and the values of the second cross-correlation for the identical lags as the paired vector. This analysis permitted the estimation of similarities in the timing and direction of cross-correlation peaks. Two cross-correlations with similarly timed peaks in the same direction (positive or negative) will have an r > 0, two with similarly timed peaks in different directions (one positive and one negative) will have an r < 0, and two with unrelated peak timings will have an r = 0.
To further examine the information content of GC cross-correlations, the responses of whole ensembles were subjected to linear discriminant analysis (Gochin et al., 1994; Schoenbaum and Eichenbaum, 1995;Nicolelis et al., 1997b; Chapin, 1999). This multivariate technique looks for structure in the covariance matrix of the variables and uses this covariance structure to build optimal linear estimators for the responses to each stimulus. In this case, the covariance structure reflects information related to that which is exposed in the cross-correlations. The firing rate vectors of individual trials (described above) were the input to the algorithm (the input vectors were n × t numbers long, with nindicating number of neurons and t indicating number of time bins); the number of correctly and incorrectly classified trials was the output. Each trial was classified on the basis of the distance between that trial and the estimator of each stimulus, with the smallest distance determining the “predicted” tastant. An identical analysis was then run on the same data, with an additional random time jitter (of up to ±6 bins) introduced to each trial. This jitter destroyed the between-neuron structure, leaving only individual responses intact. Thus, the difference in error rates between the jittered and unjittered data provided a test of the usefulness of between-neuron patterns for coding tastants. The pattern of correct and incorrect classifications was transformed into “bits,” a basic measure of the information content of a signal (Krippendorff, 1986).
Single-unit analysis. Details of the analysis of single-unit firing rates can be found by Katz et al. (2001).
Histology. After the end of recording, rats were killed with sodium pentobarbital (150 mg/kg) and perfused first with PBS and then 5% formalin in PBS. Electrolytic lesions made after perfusion (70 μA for 7 sec) in fixed, 80 μm coronal slices stained with cresyl violet revealed that all recordings were made in GC (dysgranular insular cortex).
RESULTS
GC neurons fire coherently on the timescale of hundreds of milliseconds
The sample consisted of 237 neuron pairs (mean yield per rat was 20 pairs; range of six to 45), 167 within a single hemisphere and 70 between hemispheres.
Stimulus-specific neural interactions occurred frequently at a relatively broad timescale (half-widths of 75–500 msec). Representative examples, revealing the relative likelihood (at a given lag) that a neuron 2 spike follows or precedes a neuron 1 spike, are shown in Figure 2A–D. The neuron pair in Figure1A interacted significantly only in the presence of Na. The CCs for other tastants were not significant. The corresponding color-coded PSTHs are shown to their right (the color key is at the bottom). Neuron 1 produced an excitatory firing rate change to Na and a significant inhibitory response to CA. Neuron 2 did not respond in a statistically significant manner to any of the proffered tastants. This pattern was not uncommon: 67% (57 of 85) of the interacting pairs contained one (46%; 39 of 85) or two (21%; 18 of 85) neurons that were either unresponsive or that produced similarly shaped responses to all of the tested tastants (Table1).
Table 1.
Summary of cross-correlations
| % (n) | Excitatory | Inhibitory | |
|---|---|---|---|
| Neuron pairs involved in significant CCs | 35% (85 of 237) | ||
| Total CCs (pairs × tastants) showing significant peaks | 13% (177 of 1401) | 67% (119) | 33% (58) |
| Pairs significant for: | |||
| Citric acid | 16% (28 of 177) | 64% (18) | 36% (10) |
| NaCl | 21% (37 of 177) | 65% (24) | 35% (13) |
| Nicotine | 9% (16 of 177) | 63% (10) | 37% (6) |
| Quinine | 19% (34 of 177) | 76% (26) | 24% (8) |
| Sucrose | 17% (30 of 177) | 60% (18) | 40% (12) |
| Water | 18% (32 of 177) | 72% (23) | 28% (9) |
| Pattern explainable in terms of palatability (e.g.,significant CC to Suc and Na and not to Q or Nic) | 7% (6 of 85) | ||
| Single-unit responses: | |||
| Both neurons show taste-specific single-unit responses | 31% (55 of 177) | 71% (32) | 29% (23) |
| Only one taste-specific neuron | 50% (88 of 177) | 72% (63) | 28% (25) |
| Neither neuron taste-specific | 19% (34 of 177) | 71% (24) | 29% (10) |
The CCs in Figure 2B show a significant negative correlation peak in the presence of Nic and CA. The occurrence of a “negative” correlation means that neuron 2 tended not to fire in the vicinity of a neuron 1 spike. This pattern of interaction is not reflected by significant inhibition of the single-unit responses to these tastants.
Figure 2C shows one of the relatively few (17.6%; 15 of 85) sharp interactions (width of a few milliseconds) that was observed. In the presence of Na and Q, the CCs of this pair contained a sharp peak (centered on a broader peak) near 0 sec lag time. This pair, like 33% (5 of 15) of those showing such sharp CCs, was isolated from a single wire (9.8% of the total number of significant peaks came from single-wire pairs). None of the taste specificity of the CCs was paralleled by taste specificity in the PSTHs of the neurons.
Sharp CCs were not observed between any interhemispheric pairs, but many such pairs (22%;19 of 85) showed broad interactions. An example is shown in Figure 2D. This pair showed significant positive correlation peaks to Nic, NA, and Q and a biphasic negative–positive interaction to CA. The PSTHs of these neurons were not significantly different for any applied tastants. In all other regards, interhemispheric interactions were generally similar to interactions in intrahemispheric pairs.
Overall, 36% (85 of 237) of the GC pairs interacted in the presence of at least one tastant (mean half-width of 300 ± 15 msec). Of these, 59% (50 of 85) interacted significantly in the presence of more than one tastant (that is, the leftmost bar in Fig.3A is 41% of the total number of pairs represented in the histogram). In total, 13% of the total number of CCs (177 of 1401) were significant. Most tastants induced similar numbers of significant CCs (Table 1); nicotine produced significantly fewer, perhaps because of relative concentration differences or adaptation (Dessirier et al., 2000). Palatability of the tastants did not determine the pattern of significant CCs (Table1).
Fig. 3.
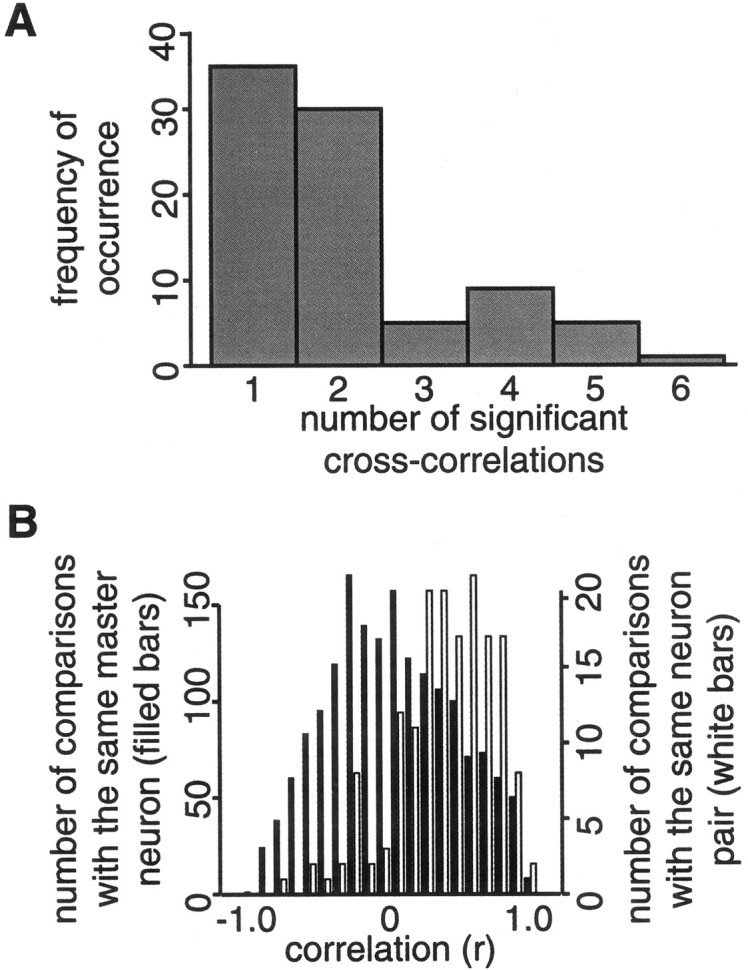
Summary of cross-correlation patterns in GC neuron pairs. A, Frequency histogram showing the number of significant cross-covariances, of a total possible six (one for each tastant), for each neuron pair. Most pairs only covaried in response to one or two tastants, but a substantial number covaried in response to four or five. B, Frequency histograms showing that CCs produced to different tastants by the same neuron pair tend to be similar (white bars), in that the Pearson'sr between such CCs tends to be greater than zero. For comparison, the black bars show the Pearson'sr between cross-covariances that share only one neuron in common; note that this distribution is centered on zero.
When neuron pairs did interact to a subset of tastants (e.g., two to five), the subset of CCs with significant peaks tended to have similar “morphologies;” that is, they tended to show similarly timed peaks in the same direction (Fig. 2B–D). This observation, summarized in Figure 3B, shows the similarity between pairs of cross-correlations at the same set of lags. The white bars show the similarity (Pearson's product moment correlationr) between the shapes of significant CCs involving the same pair of neurons (for instance, the CCs to Na and Q for the pair shown in Fig. 2C); for this subgroup of pairs, the meanr = 0.36. Black bars show the similarity between any two significantly peaked CCs that have only one neuron in common; for these comparisons, the average r = 0.02. The two distributions are significantly different from each other (χ2(20) = 703.5;p < 0.000001), as are the mean correlations (Fisher'sz (163) = 14.15; p < 0.000001).
Taste-specific assemblies of GC neurons change their firing rates together
The fact that many neuron pairs interacted similarly to a subset of tastants suggests that taste specificity can be found in the makeup of the groups of GC neurons interacting in response to each tastant. Figure 4 shows such taste-specific assemblies recorded for three of the 12 rats. Circles at the intersections in each half-matrix represent the pairwise interactions. The size of a circle represents the significance of the interaction (white for negative and dark gray for positive); small black circles represent nonsignificant interactions (for the neurons showing biphasic patterns of interaction, the size of the circle is keyed to the strongest interaction, and the circle is shown half-whiteand half-gray). Although positive interactions predominated, both were plentiful. For each tastant, a distinct but overlapping set of neurons interacted in response to presentation of each tastant. Many pairs (Fig. 4C, neurons 4 and7) only interacted in the presence of a single tastant (in this case, Na), whereas others interacted in the presence of many to a range of degrees (Fig. 4B, neurons 1 and 2).
Fig. 4.
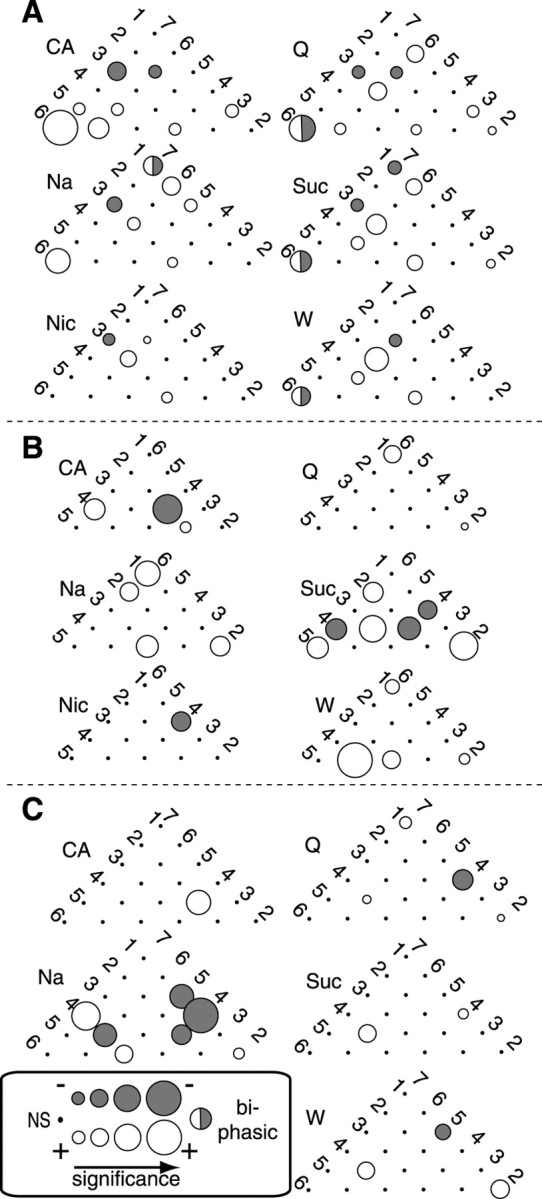
Taste-specific assemblies of interacting neurons.A–C, The half-matrix of the neuron pairs in three separate ensembles, showing which pairs produced significant CC peaks in response to the different tastants. Small black circles denote lack of significant interaction, and the sizes of shaded circles denote relative significance level.White circles denote excitatory interactions, anddark gray circles denote inhibitory interactions (for the rare neuron pairs that showed biphasically significant CCs, the size of the circle refers to the most significant peak, and half of the circle is shown in eachshade). In virtually all cases, the assemblies for different tastants are distinct (some pairs interact to only one tastant) but overlap (some pairs interact for several tastants).
We next determined whether such coherence structure within ensembles, measured at the timescale of CC widths, could be used to identify applied tastants. This possibility was tested using linear discriminant analysis (LDA). Single-trial firing rates of all neurons in ensembles (including those not involved in significant cross-correlations) were turned into rate vectors and binned at a range of timescales (100, 125, 160, 200, and 250 msec, chosen to produce whole numbers of bins). Across-ensemble vectors were used as input to the LDA algorithm, which produced a linear function that allowed maximal discrimination between the tastants, measured as the error rate of response classification.
Figure 5 presents the results of the LDA. Figure 5A shows, for the range of bin sizes tested, the significance of the difference in percentage of correct using normal and shuffled (±1–6 bins) data. Eliminating the covariance structure between neurons in the ensemble impairs performance for bin sizes 160 and 200 msec (both p values < 0.02), a range that is consistent with the timescale of the observed cross-correlations. Figure 5B shows the bits of information (that is, the amount of information useful for identifying tastants from the responses) for all ensembles at a bin width of 160 msec. For the vast majority of ensembles (n = 10), performance with shuffled data (white bars) was worse than performance with normal data (black bars); even with the small number of trials and neurons, the difference was significant for five individual ensembles. Figure 5C summarizes these latter data, showing the average amount of information (in bits) for normal and shuffled data. The shuffled data contained significantly lower amounts of information (t(11) = 2.73; p < 0.02).
Fig. 5.

Use of the GC ensembles to discriminate between administered tastants. A, Quantification of the reduction in discriminative performance of LDA after time shifting (±6 bins) of single-unit spike trains within GC ensembles. Theabscissa is bin size for the analysis, and theordinate is significance level (pvalue of the t test comparing error rates for normal and shifted data). The dashed horizontal line showsp = 0.05. When the time bins used were between 160 and 200 msec, LDA performed significantly worse when time shifting eliminated the true between-neuron coherence in the data.B, Information contained within ensembles obtained from each rat, using a bin size of 160 msec. Black bars show the available information (in bits) using the real data, andwhite bars show the bits using time-shifted data.C, Summary of the data in B, using real and time-shifted data. *p < 0.02.
As noted, significant CCs can arise from a number of sources. We therefore undertook a series of analyses to determine what the observed interactions may “mean” in terms of the processing of gustatory information. The analytic process required obtaining the times of significant firing rate changes in individual trials. After quantification of these times, initial latencies for every trial involved in significant interactions were correlated. The average correlation (0.02) suggests that coupled latencies did not contribute to the CCs.
To test for other possible sources of CCs, simulations that excluded aspects of the data were produced from individual trials of the single-unit responses, and CCs calculated from these various simulations were compared. Figure6A presents CCs constructed from the Na interaction of the neuron pair shown in Figure2A. The empirical CC is shown in a thick solid line, the CC calculated from normalized rate-change simulations is shown in a thinner solid line, from normalized smoothed simulations in a dashed line, and from control simulations (all single-trial effects excluded) in a dot–dash line. The strongest interaction is seen in the real data, but the rate-change simulation produced a substantial CC, and the smoothed simulation produced an even lower CC. The corresponding PSTHs for neuron 1 can be seen to the right; each is remarkably similar to the others, clearly demonstrating that the CCs do not depend on the summed single-unit responses.
Fig. 6.

CCs in GC are related to coupled within-trial rate changes. A, A set of CCs for the same neuron pair shown in Figure 1A. The thick solid lineshows the observed CC (i.e., from real data) in response to NaCl. CCs calculated between simulations of the responses of that pair of neurons to NaCl are also shown: one in which all single-trial information has been discarded (dot–dash line), one in which only slow single-trial firing rate variations have been included (dashed line), and one in which times of significant firing rate change are sharp (thin solid line; see Results). The PSTHs for the neuron that produced a significant single-unit response to NaCl, for each condition, are shown to the right. The vast differences in CC are not reflected in appreciable differences between PSTHs for the real and variously simulated spike trains.B, Comparison between the maximum heights of the significant CCs produced from rate-change vector simulations and smoothed vector simulations. Proportion of the real data maximum peak height is on the ordinate; the error bars are SEM. The difference between the two simulations is highly significant.C, Similar comparison between CCs produced by scaled rate-change vector simulations and unscaled rate-change vector simulations. The difference is not significant.
The results of these analyses are summarized in Figure6B. The difference between the rate change and smoothed simulations was highly significant (t(175) = 6.73; p < 0.000001). Coupled shifts in firing rate contribute significantly to the CCs. Figure 6C compares the rate-change and normalized rate-change simulations. Had magnitude coupling contributed to the interactions, the latter should have been significantly smaller than the former. Such was not the case: the size of the peaks are virtually identical for the two simulations (t(175) < 1).
In summary, the information reflected in the taste-specific coherent assemblies is preserved in the broad time course of individual trial responses, and significant amounts of that information can be traced to sudden changes in instantaneous firing rates, even when these changes do not show up in PSTHs.
DISCUSSION
GC neurons cohere during tasting
Information related to gustation evolves in GC responses (Katz et al., 2001a) on the same timescale as gustatory perception (Halpern, 1985). We investigated interactions between GC neurons during tastant responses and explored how such interactions might be related to the single-unit processing of gustatory stimuli. These data reveal that pairs of GC neurons interact across hundreds of milliseconds, that the interactions are taste specific, that they do not depend on the shapes of the PSTH or on stimulus palatability, and that they define distinct, but overlapping, neural assemblies that respond to the presence of each tastant by undergoing coupled changes in firing rate. Our analyses demonstrate that these couplings could, in principle, be used to discriminate between tastants.
Previous studies reported taste-specific CCs between GC neurons on a narrow timescale (±20 msec) (Nakamura and Ogawa, 1997; Yokota et al., 1997). We observed a small number of such CCs (Fig. 2C), the properties of which were consistent with these previous reports. The fact that sharp CCs were not found in interhemispheric pairs and the relatively high likelihood that they were found between neurons isolated from a single wire suggests that monosynaptic connections are formed preferentially between neurons in close spatial proximity to each other.
However, our findings differ from those reported previously in two ways. First, the effects of anesthesia, which may change system dynamics (Nowak and Bullier, 2000; Gaese and Ostwald, 2001), were avoided through the use of awake rats. Second, the broad (hundreds of milliseconds) interactions observed here (Fig. 2) are widespread and systemic, even appearing between neurons in opposite hemispheres (Fig.2D). The systemic nature of this phenomenon, together with the well known millisecond-to-millisecond variability of neural responses (Shadlen and Newsome, 1998), suggests that broad interactions may better represent the processing of tastants than do tight (indicative of monosynaptic connections) interactions.
Gustatory processing via coherent rate changes in taste-specific assemblies
What do broad CCs have to do with chemosensory processing? Research in olfaction suggests that specific information may be carried in patterns of transient synchrony between neurons (Wehr and Laurent, 1996). In this study, we found that the shapes of CCs provide some information about tastant identity, in that most pairs of neurons only interact after application of only a subset of tastants. Figures2B–D and 3 suggest, however, that significant CCs in GC may simply be a “flag” to the membership of a neuron pair in a processing group. Specifically, significant CCs can serve to flag the membership of a neuron pair in a stimulus-specific neural assembly (Fig. 4). The formation of such assemblies has been related to system function by a number of researchers studying other systems (Singer, 1990; Abeles et al., 1993; Vaadia et al., 1995; Stopfer et al., 1997;Nicolelis et al., 1998; Laurent, 1999; Christensen et al., 2000). Although it is difficult to ascertain whether interactions between neurons provide “more” coding-relevant information than single-neuron firing patterns (as they seem to in olfaction), elimination of this information via random time shifting of individual responses significantly degraded the ability of the ensembles to discriminate between applied tastants (Fig. 5). Although it should be remembered that such analyses represent proof only of an “observer's” ability to use neural interactions (and not that the rat does so), this supports the suggestion that these interactions between GC neurons can play a role in the processing of tastant stimuli.
The performed analyses permit the exclusion of common source, coupled latency, and coupled magnitude as sources of the interactions between taste-specific subset of coherent neurons (Fig. 6). Other possibilities can also be eliminated. Between-trial variations in the rats' handling of taste stimuli, for instance, could give rise to peaked CCs, but those CCs would be taste specific only if tastant delivery was similarly variable for a subset of stimuli and not at all variable for others. The fact that different but overlapping subsets of neurons interacted to different tastants (Fig. 2) further reduces the feasibility of this hypothesis. Alternatively, it might be argued that palatability-specific orofacial behaviors drove the between-neuron coupling. The fact that pairwise interactions seldom fell out according to palatability (Table 1), however, eliminates this explanation.
Therefore, we conclude that coupled changes in firing rate (a portion of which must “live” at a timescale smaller than the 50 msec filter used to produce our simulations) are the underlying source of GC interactions. Subsets of neurons in GC became coupled after the presentation of particular tastants, and the responses of neurons in that ensemble changed in concert with those of others. The action of gustatory assemblies is thus intimately related to rate changes on a timescale similar to that of taste behavior (Halpern, 1985). The failure of PSTHs to reflect the significant interactions (Figs. 2, 6) suggests that the firing rate coupling was not locked to stimulus onset. Rather, it is an internal, single-trial process.
The conclusions offered here are consistent with recent work from a variety of preparations. Researchers have suggested that networks of neurons form functional ensembles (Welsh et al., 1995; Laubach et al., 2000) and that such ensembles undergo coupled firing rate changes (Seidemann et al., 1996). Recent simulations suggest explicit mechanisms of between-neuron coupling to explain such a process in olfaction (Bazhenov et al., 2001). The current results are also consistent with research suggesting that the taste specificity of neural responses is partially determined by interconnections among neurons (Ogawa et al., 1998; Smith and Li, 1998).
In summary, the time-varying tastant responses produced by GC neurons in awake rats, even those that do not translate into taste-specific PSTHs, can be attributed to coherent rate changes in taste-specific assemblies. These data suggest that taste perception may involve the formation and action of such assemblies and to the way in which ensembles of neurons work together.
Footnotes
This research was supported by National Institutes of Health Grants DC-00403 (D.B.K.), DC-01065 (S.A.S.), and DE-11121 (M.A.L.N.) and by a grant from the Philip Morris Research Center. We gratefully acknowledge the advice of Drs. Stuart Baker, Robert Erickson, Asif Ghazanfar, Rebecka Jornsten, Ben Rubin, Geoff Schoenbaum, Marshall Shuler, Alan Spector, and Johan Wessberg.
Correspondence should be addressed to Donald B. Katz, Box 2309, Duke University Medical Center, Durham, NC 27710. E-mail:dkatz@neuro.duke.edu.
REFERENCES
- 1.Abeles M, Bergman H, Margalit E, Vaadia E. Spatiotemporal firing patterns in the frontal cortex of behaving monkeys. J Neurophysiol. 1993;70:1629–1638. doi: 10.1152/jn.1993.70.4.1629. [DOI] [PubMed] [Google Scholar]
- 2.Adachi M, Ohshima T, Yamada S, Satoh T. Cross-correlation analysis of taste neuron pairs in rat solitary tract nucleus. J Neurophysiol. 1989;62:501–509. doi: 10.1152/jn.1989.62.2.501. [DOI] [PubMed] [Google Scholar]
- 3.Aertsen AM, Gerstein GL, Habib MK, Palm G. Dynamics of neuronal firing correlation: modulation of “effective connectivity.”. J Neurophysiol. 1989;61:900–917. doi: 10.1152/jn.1989.61.5.900. [DOI] [PubMed] [Google Scholar]
- 4.Bair W, Zohary E, Newsome WT. Correlated firing in macaque visual area MT: time scales and relationship to behavior. J Neurosci. 2001;21:1676–1697. doi: 10.1523/JNEUROSCI.21-05-01676.2001. [DOI] [PMC free article] [PubMed] [Google Scholar]
- 5.Baker SN, Lemon RN. Precise spatiotemporal repeating patterns in monkey primary and supplementary motor areas occur at chance levels. J Neurophysiol. 2000;84:1770–1780. doi: 10.1152/jn.2000.84.4.1770. [DOI] [PubMed] [Google Scholar]
- 6.Bazhenov M, Stopfer M, Rabinovich M, Abarbanel HD, Sejnowski TJ, Laurent G. Model of cellular and network mechanisms for odor-evoked temporal patterning in the locust antennal lobe. Neuron. 2001;30:569–581. doi: 10.1016/s0896-6273(01)00286-0. [DOI] [PMC free article] [PubMed] [Google Scholar]
- 7.Brillinger DR. Nerve cell spike train data analysis: a progression of technique. J Am Stat Assoc. 1992;87:260–271. [Google Scholar]
- 8.Brody CD. Correlations without synchrony. Neural Comput. 1999a;11:1537–1551. doi: 10.1162/089976699300016133. [DOI] [PubMed] [Google Scholar]
- 9.Brody CD. On artefactual spike train cross-correlations. Neurocomputing. 1999b;26–27:957–962. [Google Scholar]
- 10.Chapin JK. Population-level analysis of multi-single neuron recording data: multivariate statistical methods. In: Nicolelis MAL, editor. Methods for neural ensemble recordings. CRC; Boca Raton, FL: 1999. pp. 193–228. [Google Scholar]
- 11.Christensen TA, Pawlowski VM, Lei H, Hildebrand JG. Multi-unit recordings reveal context-dependent modulation of synchrony in odor-specific neural ensembles. Nat Neurosci. 2000;3:927–931. doi: 10.1038/78840. [DOI] [PubMed] [Google Scholar]
- 12.Dessirier J-M, Simons CT, Sudo M, Sudo S, Carstens E. Sensitization, desensitization, stimulus-induced recovery (SIR) of rat trigeminal caudalis neurons to repeated oral application of capsaicin, nicotine. J Neurophysiol. 2000;84:1851–1862. doi: 10.1152/jn.2000.84.4.1851. [DOI] [PubMed] [Google Scholar]
- 13.Di Lorenzo PM, Monroe S. Transfer of information about taste from the nucleus of the solitary tract to the parabrachial nucleus of the pons. Brain Res. 1997;763:167–181. doi: 10.1016/s0006-8993(97)00217-5. [DOI] [PubMed] [Google Scholar]
- 14.Erickson RP. The evolution and implications of population and modular neural coding ideas. Prog Brain Res. 2001;130:9–29. doi: 10.1016/s0079-6123(01)30003-1. [DOI] [PubMed] [Google Scholar]
- 15.Gaese BH, Ostwald J. Anesthesia changes frequency tuning of neurons in the rat primary auditory cortex. J Neurophysiol. 2001;86:1062–1066. doi: 10.1152/jn.2001.86.2.1062. [DOI] [PubMed] [Google Scholar]
- 16.Ghazanfar AA, Krupa DJ, Nicolelis MA. Role of cortical feedback in the receptive field structure and nonlinear properties of somatosensory thalamic neurons. Exp Brain Res. 2001;141:88–100. doi: 10.1007/s002210100849. [DOI] [PubMed] [Google Scholar]
- 17.Gochin PM, Colombo M, Dorfman GA, Gerstein GL, Gross CG. Neural ensemble coding in inferior temporal cortex. J Neurophysiol. 1994;71:2325–2337. doi: 10.1152/jn.1994.71.6.2325. [DOI] [PubMed] [Google Scholar]
- 18.Halpern BP. Time as a factor in gustation: temporal patterns of taste stimulation and response. In: Pfaff DW, editor. Taste, olfaction, and the central nervous system. Rockefeller UP; New York: 1985. pp. 181–209. [Google Scholar]
- 19.Katz DB, Simon SA, Nicolelis MA. Dynamic and multimodal responses of gustatory cortical neurons in awake rats. J Neurosci. 2001a;21:4478–4489. doi: 10.1523/JNEUROSCI.21-12-04478.2001. [DOI] [PMC free article] [PubMed] [Google Scholar]
- 20.Katz DB, Simon SA, Nicolelis MAL. Electrophysiological studies of gustation in awake rats. In: Simon SA, Nicolelis MAL, editors. Methods and frontiers in the chemical senses. CRC; Boca Raton, FL: 2001b. pp. 339–357. [Google Scholar]
- 21.Kosar E, Grill HJ, Norgren R. Gustatory cortex in the rat. I. Physiological properties and cytoarchitecture. Brain Res. 1986;379:329–341. doi: 10.1016/0006-8993(86)90787-0. [DOI] [PubMed] [Google Scholar]
- 22.Krippendorff K. Information theory: structural models for qualitative data. Sage UP; Beverly Hills, CA: 1986. [Google Scholar]
- 23.Laubach M, Wessberg J, Nicolelis MA. Cortical ensemble activity increasingly predicts behaviour outcomes during learning of a motor task. Nature. 2000;405:567–571. doi: 10.1038/35014604. [DOI] [PubMed] [Google Scholar]
- 24.Laurent G. A systems perspective on early olfactory coding. Science. 1999;286:723–728. doi: 10.1126/science.286.5440.723. [DOI] [PubMed] [Google Scholar]
- 25.Nakamura T, Ogawa H. Neural interaction between cortical taste neurons in rats: a cross-correlation analysis. Chem Senses. 1997;22:517–528. doi: 10.1093/chemse/22.5.517. [DOI] [PubMed] [Google Scholar]
- 26.Nicolelis MA, Katz D, Krupa DJ. Potential circuit mechanisms underlying concurrent thalamic and cortical plasticity. Rev Neurosci. 1998;9:213–224. doi: 10.1515/revneuro.1998.9.3.213. [DOI] [PubMed] [Google Scholar]
- 27.Nicolelis MAL, Ghazanfar AA, Faggin BM, Votaw S, Oliveira LMO. Reconstructing the engram: simultaneous, multisite, many single neuron recordings. Neuron. 1997a;18:529–537. doi: 10.1016/s0896-6273(00)80295-0. [DOI] [PubMed] [Google Scholar]
- 28.Nicolelis MAL, Lin RCS, Chapin JK. Neonatal whisker removal reduces the discrimination of tactile stimuli by thalamic ensembles in adult rats. J Neurophysiol. 1997b;78:1691–1706. doi: 10.1152/jn.1997.78.3.1691. [DOI] [PubMed] [Google Scholar]
- 29.Nishijo H, Norgren R. Parabrachial gustatory neural activity during licking by rats. J Neurophysiol. 1991;66:974–985. doi: 10.1152/jn.1991.66.3.974. [DOI] [PubMed] [Google Scholar]
- 30.Nowak LG, Bullier J. Cross-correlograms for neuronal spike trains. Different types of temporal correlation in neocortex, their origin and significance. In: Miller R, editor. Time and the brain. Harwood; Sidney: 2000. pp. 53–96. [Google Scholar]
- 31.Ogawa H, Hasegawa K, Otawa S, Ikeda I. GABAergic inhibition and modifications of taste responses in the cortical taste area in rats. Neurosci Res. 1998;32:85–95. doi: 10.1016/s0168-0102(98)00071-6. [DOI] [PubMed] [Google Scholar]
- 32.Pauluis Q, Baker SN. An accurate measure of the instantaneous discharge probability, with application to unitary joint-even analysis. Neural Comput. 2000;12:647–669. doi: 10.1162/089976600300015736. [DOI] [PubMed] [Google Scholar]
- 33.Perkel DH, Gerstein GL, Moore GP. Neuronal spike trains and stochastic point processes. II. Simultaneous spike trains. Biophys J. 1967;7:419–440. doi: 10.1016/S0006-3495(67)86597-4. [DOI] [PMC free article] [PubMed] [Google Scholar]
- 34.Phillips MI, Norgren R. A rapid method for permanent implantation of an intraoral fistula in rats. Behav Res Methods Instrum Comput. 1970;2:124. [Google Scholar]
- 35.Politis DN, Romano JP, Lai TL. Bootsrap confidence bands for spectra and cross-spectra. IEEE Trans Signal Proc. 1992;40:1206–1215. [Google Scholar]
- 36.Rosenberg JR, Amjad AM, Breeze P, Brillinger DR, Halliday DM. The Fourier approach to the identification of functional coupling between neuronal spike trains. Prog Biophys Mol Biol. 1989;53:1–31. doi: 10.1016/0079-6107(89)90004-7. [DOI] [PubMed] [Google Scholar]
- 37.Salinas E, Sejnowski TJ. Correlated neuronal activity and the flow of neural information. Nat Rev Neurosci. 2001;2:539–550. doi: 10.1038/35086012. [DOI] [PMC free article] [PubMed] [Google Scholar]
- 38.Schoenbaum G, Eichenbaum H. Information coding in the rodent prefrontal cortex. II. Ensemble activity in orbitofrontal cortex. J Neurophysiol. 1995;74:751–762. doi: 10.1152/jn.1995.74.2.751. [DOI] [PubMed] [Google Scholar]
- 39.Seidemann E, Meilijson I, Abeles M, Bergman H, Vaadia E. Simultaneously recorded single units in the frontal cortex go through sequences of discrete and stable states in monkeys performing a delayed localization task. J Neurosci. 1996;16:752–768. doi: 10.1523/JNEUROSCI.16-02-00752.1996. [DOI] [PMC free article] [PubMed] [Google Scholar]
- 40.Shadlen MN, Newsome WT. The variable discharge of cortical neurons: implications for connectivity, computation, and information coding. J Neurosci. 1998;18:3870–3896. doi: 10.1523/JNEUROSCI.18-10-03870.1998. [DOI] [PMC free article] [PubMed] [Google Scholar]
- 41.Singer W. The formation of cooperative cell assemblies in the visual cortex. J Exp Biol. 1990;153:177–197. doi: 10.1242/jeb.153.1.177. [DOI] [PubMed] [Google Scholar]
- 42.Smith DV, Li CS. Tonic GABAergic inhibition of taste-responsive neurons in the nucleus of the solitary tract. Chem Senses. 1998;23:159–169. doi: 10.1093/chemse/23.2.159. [DOI] [PubMed] [Google Scholar]
- 43.Stopfer M, Bhagavan S, Smith BH, Laurent G. Impaired odour discrimination on desynchronization of odour-encoding neural assemblies. Nature. 1997;390:70–74. doi: 10.1038/36335. [DOI] [PubMed] [Google Scholar]
- 44.Vaadia E, Haalman I, Abeles M, Bergman H, Prut Y, Slovin H, Aertsen A. Dynamics of neuronal interactions in monkey cortex in relation to behavioural events. Nature. 1995;373:515–518. doi: 10.1038/373515a0. [DOI] [PubMed] [Google Scholar]
- 45.Wehr M, Laurent G. Odour encoding by temporal sequences of firing in oscillating neural assemblies. Nature. 1996;384:162–166. doi: 10.1038/384162a0. [DOI] [PubMed] [Google Scholar]
- 46.Welsh JP, Lang EJ, Sugihara I, Llinás R. Dynamic organization of motor control within the olivocerebellar system. Nature. 1995;374:453–457. doi: 10.1038/374453a0. [DOI] [PubMed] [Google Scholar]
- 47.Yokota T, Eguchi K, Satoh T. Correlated discharges of two neurons in rat gustatory cortex during gustatory stimulation. Neurosci Lett. 1996;209:204–206. doi: 10.1016/0304-3940(96)12619-7. [DOI] [PubMed] [Google Scholar]
- 48.Yokota T, Eguchi K, Satoh T. Sensitivity of rat cortical neurons in distinguishing taste qualities by individual and correlative activities. Chem Senses. 1997;22:363–373. doi: 10.1093/chemse/22.4.363. [DOI] [PubMed] [Google Scholar]