

Abstract
In blood, apolipoprotein E (ApoE) is a component of circulating lipoproteins and mediates the clearance of these lipoproteins from blood by binding to ApoE receptors. Humans express three genetic ApoE variants, ApoE2, ApoE3, and ApoE4, which exhibit distinct ApoE receptor-binding properties and differentially affect Alzheimer's disease (AD), such that ApoE2 protects against, and ApoE4 predisposes to AD. In brain, ApoE-containing lipoproteins are secreted by activated astrocytes and microglia, but their functions and role in AD pathogenesis are largely unknown. Ample evidence suggests that ApoE4 induces microglial dysregulation and impedes Aβ clearance in AD, but the direct neuronal effects of ApoE variants are poorly studied. Extending previous studies, we here demonstrate that the three ApoE variants differentially activate multiple neuronal signaling pathways and regulate synaptogenesis. Specifically, using human neurons (male embryonic stem cell-derived) cultured in the absence of glia to exclude indirect glial mechanisms, we show that ApoE broadly stimulates signal transduction cascades. Among others, such stimulation enhances APP synthesis and synapse formation with an ApoE4>ApoE3>ApoE2 potency rank order, paralleling the relative risk for AD conferred by these ApoE variants. Unlike the previously described induction of APP transcription, however, ApoE-induced synaptogenesis involves CREB activation rather than cFos activation. We thus propose that in brain, ApoE acts as a glia-secreted signal that activates neuronal signaling pathways. The parallel potency rank order of ApoE4>ApoE3>ApoE2 in AD risk and neuronal signaling suggests that ApoE4 may in an apparent paradox promote AD pathogenesis by causing a chronic increase in signaling, possibly via enhancing APP expression.
SIGNIFICANCE STATEMENT Humans express three genetic variants of apolipoprotein E (ApoE), ApoE2, ApoE3, and ApoE4. ApoE4 constitutes the most important genetic risk factor for Alzheimer's disease (AD), whereas ApoE2 protects against AD. Significant evidence suggests that ApoE4 impairs microglial function and impedes astrocytic Aβ clearance in brain, but the direct neuronal effects of ApoE are poorly understood, and the differences between ApoE variants in these effects are unclear. Here, we report that ApoE acts on neurons as a glia-secreted signaling molecule that, among others, enhances synapse formation. In activating neuronal signaling, the three ApoE variants exhibit a differential potency of ApoE4>ApoE3>ApoE2, which mirrors their relative effects on AD risk, suggesting that differential signaling by ApoE variants may contribute to AD pathogenesis.
Keywords: Alzheimer's disease (AD), apolipoprotein E (ApoE), induced neuronal (iN) cells, signaling pathway, synapse formation
Introduction
Apolipoprotein E (ApoE) is a major component of circulating lipoproteins that mediates the clearance of lipoproteins from blood by binding to ApoE receptors (Goldstein and Brown, 2015). Human ApoE is expressed in three allelic genetic variants, ApoE2, ApoE3, and ApoE4, which exhibit distinct receptor-binding properties (Calandra et al., 2011). ApoE2 binds much less strongly, and ApoE4 more strongly than ApoE3 to ApoE receptors, at least under some conditions (Weisgraber et al., 1982; Utermann, 1985; Mamotte et al., 1999). Likely due to their differential ApoE-receptor binding properties, both ApoE2 and ApoE4 homozygosity predisposes to dyslipoproteinemias, albeit with different severity (de Knijff et al., 1994; Smelt and de Beer, 2004). ApoE is not only present in blood, however, but also secreted in brain by activated astrocytes and microglia (Schmidt et al., 2014; Lane-Donovan and Herz, 2017). ApoE production in brain is likely physiologically significant since ApoE4 is the most important genetic risk factor for Alzheimer's disease (AD), whereas ApoE2 protects against AD (Strittmatter et al., 1993; Rebeck et al., 2002). However, the functional activities of the three ApoE variants in brain and their different effects in AD pathogenesis are incompletely understood.
Patients that are homozygous for inactivating ApoE gene mutations suffer from severe dyslipoproteinemia but appear cognitively normal and do not exhibit major neurological impairments, suggesting that ApoE is not essential in normal brain or required to prevent neurodegenerative processes (Ghiselli et al., 1981; Lohse et al., 1992; Mak et al., 2014). However, ApoE could be a protective signal during damage response or repair, a possibility supported by the finding that microglia and astrocyte activation induces ApoE expression (Poirier et al., 1991; Saura et al., 2003). At least three major hypotheses that are not mutually exclusive have been advanced to account for the role of ApoE2 and ApoE4 in protecting against or promoting AD pathogenesis, respectively. The first hypothesis is based on the observation that ApoE is important for the clearance of amyloid-β (Aβ) peptides that are thought to contribute to AD pathogenesis (Deane et al., 2008; Castellano et al., 2011; Verghese et al., 2013; Robert et al., 2017). Here, ApoE4 is proposed to promote AD by decreasing Aβ clearance and increasing Aβ levels, although the precise role of Aβ in AD pathogenesis remains unclear. The second hypothesis is framed by the finding that ApoE binds to TREM2, a microglial surface receptor that constitutes another major AD risk factor (Guerreiro et al., 2013; Jonsson et al., 2013; Atagi et al., 2015; Bailey et al., 2015; Colonna and Wang, 2016; Yeh et al., 2016). ApoE binding to TREM2 is thought to regulate microglia (Jendresen et al., 2017), and ApoE4 may promote AD pathogenesis by impeding normal microglial function, for example by impairing microglia in an Aβ-dependent manner (Krasemann et al., 2017; Ulrich et al., 2018). However, TREM2 lacks classical ApoE-binding LDL-receptor domains (Südhof et al., 1985), and microglia themselves produce copious amounts of ApoE that would thus have to act in an autocrine manner (Boyles et al., 1985; Martins et al., 2001; Nathan et al., 2001). The third hypothesis suggests that ApoE2, ApoE3, and ApoE4 differentially activate neuronal ApoE-receptors that control intracellular signaling, and posits that differences between the ApoE variants in stimulating neuronal ApoE receptors are associated with changes in AD risk. This hypothesis is based on the observation that ApoE activates neuronal signaling (Gotthardt et al., 2000; Ohkubo et al., 2001; Qiu et al., 2004) and that ApoE variants exhibit a differences efficacy in activating neuronal signaling, thereby causing differential induction of APP and Aβ synthesis in neurons with a potency rank order of ApoE4>ApoE3>ApoE2 (Huang et al., 2017). Of potential relevance, there is also evidence that the three ApoE variants may differ in their lipidation states, which could affect the interaction of ApoE particles with their target cells and receptors (Weisgraber, 1994; Hu et al., 2015; Heinsinger et al., 2016). How differential neuronal ApoE-induced neuronal signaling may promote AD pathogenesis, however, also remains unclear.
In the present study, we investigated the third hypothesis to affirm its reproducibility and broad applicability. ApoE-induced neuronal signaling can only be studied in the absence of glia and of serum because glia produce copious amounts of ApoE, and serum contains high concentrations of ApoE. This experimental constraint may explain why questions were raised about the reproducibility of ApoE-induced neuronal signaling (Wang et al., 2018), but prompted us to perform extensive confirmatory studies. Furthermore, ApoE-induced signaling was previously only demonstrated with recombinant ApoE, raising concerns about the physiological implications of such signaling since different from physiologically secreted ApoE, recombinant ApoE may not be properly lipidated. Because of this concern, we have now also examined ApoE in a physiological context. Moreover, ApoE activates APP and Aβ synthesis in neurons (Huang et al., 2017), but may stimulate other neuronal responses as well, including synapse formation (Mauch et al., 2001), motivating us to broadly study the signaling pathways and downstream effects of ApoE-induced signaling. Indeed, we here find that ApoE stimulated multiple neuronal signaling pathways and, among others, enhanced synapse formation with an ApoE4>ApoE3>ApoE2 potency rank order in a manner requiring MAP-kinase activation. In contrast to the previously described induction of APP transcription by ApoE (Huang et al., 2017) but consistent with an earlier study on ApoE-induced signaling (Ohkubo et al., 2001), ApoE-induced synapse formation involved activation of CREB. Thus, we propose that ApoE acts as a secreted molecule to broadly activate neuronal signaling pathways, and that these pathways may be relevant to AD pathogenesis because of the differential signaling efficacy of the three genetic ApoE variants that mirrors their relative effects on AD pathogenesis.
Materials and Methods
Experimental design and statistical analyses.
No statistical methods were used to predetermine sample size because effect sizes were unknown before experiments. No samples were excluded from analysis. For several experiments, two major sets of experiments [see Figs. 2, 2-2, 8, and 6-1] were randomized and investigators were blinded to sample identities during experimentation and outcome assessment. All experiments involving mice and human embryonic stem (ES) cells were performed in accordance with Stanford University and federal guidelines with approval of appropriate protocols by the various regulatory committees. All cultures of mouse cells were composed of mixed male and female cells; all human neurons were produced from the H1 male ES cell line.
Figure 2.

Activation of the ApoE signaling pathway (DLK-MKK7-ERK/MAP-kinase) is reproduced by multiple experimenters in a highly independent manner. Data are from human neurons cultured on MEFs in the absence of serum; recombinant ApoE (10 μg/ml, produced in HEK293 cells, see Figure 2-1 and Figure 7-2 or control solutions were added at day 10 (D10), and neurons were analyzed at D12 as indicated. The human neuronal cultures, ApoE and control solutions were prepared by two experimenters in parallel (“A ApoE” and “B ApoE”), anonymized by an independent third individual, and used by the same experimenters (“dataset A” and “dataset B”) in a blinded manner. A, Dataset A showing that ApoE induces an increase in ERK phosphorylation and in the levels of DLK, APP, and synapsin-1 (Syn1) proteins with an ApoE4>ApoE3>ApoE2 potency rank order (top, representative immunoblots; bottom, summary graphs). Protein levels measured using fluorescent secondary antibodies were normalized for the Tuj1 signal examined on the same blots as an internal standard and additionally for the levels observed in control neurons. Because ApoE solutions were anonymized, samples on the immunoblot are not in a logical order. B, Dataset B showing that ApoE induces an increase in ERK phosphorylation and in the levels of DLK and APP proteins with an ApoE4>ApoE3>ApoE2 potency rank order (synapsin-1 was not analyzed). Only summary graphs are shown; for representative immunoblots, see Figure 2-2. C, ApoE2, ApoE3, and ApoE4 increase neuronal APP and PSD95 but not MAP2 gene expression as assessed by mRNA measurements in human neurons treated with the two independently produced ApoE preparations. APP and PSD95 mRNA levels were normalized for those of MAP2 as an internal standard and for the levels observed in the absence of ApoE (1.0). Data in bar graphs are means ± SEM (n ≥ 3 independent experiments); statistical significance was evaluated by two-way ANOVA with Tukey's multiple-comparisons test (*p < 0.05, **p < 0.01; ***p < 0.001) as detailed in the boxes. Note that in all analyses in which ApoE has an effect on a measured parameter, ApoE3 is always significantly more potent than ApoE2 and less potent than ApoE4.
Figure 8.

ApoE increases excitatory synaptic strength but does not change the intrinsic electrical properties of human neurons, with ApoE4 being more and ApoE2 being less efficacious than ApoE3. Data are from human neurons cultured on MEFs in the absence of serum; recombinant ApoE (10 μg/ml) or control solutions were added at D10, and neurons were analyzed at D23–25 in a double-blind manner, alongside the morphological examination performed in parallel and shown in Figure 6-1. A, B, Summary graphs of membrane capacitance (A) and resistance (B). C, Representative traces of evoked EPSCs. D, Quantification of evoked EPSC amplitudes in human neuronal cultures. E, Representative traces of mEPSCs from human neurons. F, G, Summary plots and graphs of the frequency (F) and amplitudes (G) of mEPSCs. Quantifications are shown both as cumulative probability plots and as bar diagrams (inserts). Electrophysiological recordings were done in parallel with morphological analyses (Fig. 3-1B,C). Statistical significance (*p < 0.05; ***p < 0.001) was performed with one-way ANOVA with post hoc Tukey's multiple-comparisons test for all bar diagrams, presented as means ± SEM (n = 31–38 in 3 batches for evoked EPSCs; n = 32–39 in 5 batches for mEPSCs); Kolmogorov–Smirnov test was performed for cumulative probability plots in F and G.
The statistical analyses of our results were conducted using Prism 8 software (GraphPad Software) and are summarized in Table 1. In the figures, quantitative data are presented as means ± SEM. All experiments were independently repeated at least three times. Statistical comparisons between groups were analyzed for significance by one-way or two-way ANOVA with Tukey's post hoc test. Our data meet the normal distribution assumption of these tests. There is an estimate of variation within each group of data, and the variance is similar between the groups that are being statistically compared.
Table 1.
Summary of statistical analysis
| Figure | Test used | Sample size | Degree of freedom and p-value |
|---|---|---|---|
| No. | Tukey's post hoc | n/exp. | F(DFn,DFd); p-value |
| 2A | Two-way ANOVA | 3/3 | F(3,48) = 52.66; p < 0.0001 |
| 2B | Two-way ANOVA | 3/3 | F(3,40) = 15.3; p < 0.0001 |
| 2C | Two-way ANOVA | 3/3 | F(3,32) = 120.7; p < 0.0001 |
| 3B | One-way ANOVA | 4–6/4 | F(6,25) = 12.25; p < 0.0001 |
| 3C | One-way ANOVA | 4–6/4 | F(6,25) = 18.02; p < 0.0001 |
| 4B | One-way ANOVA | 4/3 | F(2,7) = 22.85; p = 0.0009 |
| 5A | Two-way ANOVA | 4/3 | F(3,36) = 75.81; p < 0.0001 |
| Two-way ANOVA | F(3,36) = 20.09; p < 0.0001 | ||
| 5B | Two-way ANOVA | 4/3 | F(3,36) = 75.81; p < 0.0001 |
| Two-way ANOVA | F(3,36) = 0.08013; p = 0.9704 | ||
| 5C | One-way ANOVA | 3–9/3 | F(11,42) = 74.37; p < 0.0001 |
| Two-way ANOVA | F(2,18) = 3.882; p = 0.0396 | ||
| 5D | One-way ANOVA | 4/3 | F(15,48) = 9.965; p < 0.0001 |
| 6B | One-way ANOVA | 17/3 | F(9,160) = 83.48; p < 0.0001 |
| 6C | One-way ANOVA | 17/3 | F(9,160) = 0.7898; p = 0.6262 |
| 6D | One-way ANOVA | 17/3 | F(9,160) = 0.6154; p = 0.7827 |
| 6E | One-way ANOVA | 17/3 | F(9,160) = 0.4825; p = 0.8848 |
| 6F | One-way ANOVA | 17/3 | F(9,160) = 0.6741; p = 0.7315 |
| 6H | One-way ANOVA | 23/3 | F(3,88) = 28.24; p < 0.0001 |
| 6I | One-way ANOVA | 23/3 | F(3,88) = 0.4337; p = 0.7294 |
| 6J | One-way ANOVA | 23/3 | F(3,88) = 1.122; p = 0.3445 |
| 7A | Two-way ANOVA | 14/4 | F(9,780) = 903.4; p < 0.0001 |
| 7B | Two-way ANOVA | 6/3 | F(3,120) = 319.2; p < 0.0001 |
| 7C | Two-way ANOVA | 10/3 | F(7,432) = 307.4; p < 0.0001 |
| 7D | Two-way ANOVA | 8/3 | F(3,168) = 412.7; p < 0.0001 |
| 8A | One-way ANOVA | 25–39/3 | F(3,127) = 2.642; p = 0.0522 |
| 8B | One-way ANOVA | 32–39/3 | F(3,134) = 0.3289; p = 0.8044 |
| 8D | One-way ANOVA | 31–38/3 | F(3, 134) = 19.12; p < 0.0001 |
| 8F | One-way ANOVA | 32–39/3 | F(3,138) = 9.078; p < 0.0001 |
| 8G | One-way ANOVA | 32–39/3 | F(3,138) = 2.237; p = 0.0867 |
| 9A | Two-way ANOVA | 6/3 | F(5,180) = 119.9; p < 0.0001 |
| 9B | Two-way ANOVA | 14/4 | F(11,936) = 666.3; p < 0.0001 |
| 10A | Two-way ANOVA | 9/4 | F(13,672) = 240.2; p < 0.0001 |
| 10B | Two-way ANOVA | 5/3 | F(13,336) = 102.2; p < 0.0001 |
| 10C | Two-way ANOVA | 5/3 | F(11,288) = 133.9; p < 0.0001 |
| 11A | Two-way ANOVA | 8/4 | F(7,336) = 48.64; p < 0.0001 |
| One-way ANOVA | F(7,56) = 12.26; p < 0.0001 | ||
| 12A | Two-way ANOVA | 6–12/6 | F(5,324) = 94.71; p < 0.0001 |
| One-way ANOVA | F(5,48) = 14.14; p < 0.0001 | ||
| 12C | Two-way ANOVA | 5/3 | F(5,144) = 209.4; p < 0.0001 |
| One-way ANOVA | F(5,24) = 20.46; p < 0.0001 | ||
| 12E | Two-way ANOVA | 4/3 | F(7,144) = 98.23; p < 0.0001 |
| 13B | One-way ANOVA | 4/3 | F(7,24) = 52.99; p < 0.0001 |
| 2-1B | One-way ANOVA | 6/3 | F(2,15) = 24.12; p < 0.0001 |
| 2-1C | One-way ANOVA | 3/3 | F(2,6) = 0.1482; p = 0.8653 |
| 6-1A | One-way ANOVA | 32–34/3 | F(3,129) = 25.66; p < 0.0001 |
| One-way ANOVA | F(3,129) = 0.479; p = 0.6974 | ||
| One-way ANOVA | F(3,129) = 0.08649; p = 0.9673 | ||
| 6-1B | One-way ANOVA | 10/3 | F(3,36) = 0.192; p = 0.9012 |
| 7-1A | Two-way ANOVA | 14/4 | F(3,312) = 271.7; p < 0.0001 |
| Two-way ANOVA | F(4,390) = 180.2; p < 0.0001 | ||
| 7-3A | Two-way ANOVA | 6/4 | F(3,120) = 188.9; p < 0.0001 |
| 7-3B | Two-way ANOVA | 6/4 | F(3,120) = 169.3; p < 0.0001 |
| 7-3C | Two-way ANOVA | 3–6/3 | F(25,330) = 12.26; p < 0.0001 |
This table summarizes information about methods of statistical analysis, degree of freedom, and significance for each figure. Tukey's multiple-comparisons test was performed post hoc for all.
Culture of principal cell types a. H1 human ESCs were obtained from WiCell Research Resources (Wicell, WI), maintained in mTeSR1 medium (Stem Cell Technologies) without feeder cells, and used at intermediate passage numbers (∼50-60) to generate human neurons, as described previously (Zhang et al., 2013). iPS cell lines EB and SKC from the Stanford Stem Cell Core (Fig. 4-2A,B)(Sebastiano et al., 2011; Sebastiano et al., 2014). Mycoplasma testing and karyotyping were performed regularly (approximately every 10 passages). The H1 ES cell line is not listed in the database of commonly-misidentified cell lines maintained by ICLAC. b. Mouse glia were cultured from the cortex of newborn CD1 mice. The cortex was dissected, digested with papain (10 U/ml) for 20 minutes at 37oC, and harshly triturated. Cells were plated onto T75 flasks in Dulbecco's Modified Eagle Medium (DMEM) supplemented with 10% fetal bovine serum (FBS). At 80-90% confluence, glial cultures were trypsinized and re-plated at lower density (20-30% confluence) in DMEM + 10% FBS. This re-plating procedure was repeated 2-3 times (typically 3-4 days apart) to remove mouse neurons before cultured glia were used for analysis or co-culture experiments with human neurons. No antibiotics or other drugs were used in glial cultures. c. Murine embryonic fibroblasts (MEFs) were isolated from mouse embryos of CF-1 strain (Harlan Laboratories, Inc.) harvested at 12.5-13.5 postcoitum (p.c.). Briefly, embryos were dissected out of terminally-anesthetized mice. The head and internal organs were removed, and the remaining carcasses were finely minced, trypsinized into single-cell suspensions, and plated onto T75 flasks. The cultured MEFs (P0) were frozen or briefly expanded (a maximum of 3 times, P3) before they were used for experiments. Production of recombinant ApoE proteins Recombinant ApoE2, ApoE3, and ApoE4 were produced in HEK293 (FreeStyle 293-F) cells (ThermoFisher) or bacteria (E. coli BL21 strain). Expression vectors for human ApoE2, ApoE3, and ApoE4 were constructed using ApoE3 cDNA in a pDONR221 vector (Gateway recombination system) obtained from Harvard Medical School (Harvard PlasmID Database, clone ID: HsCD00044600). Site-directed mutagenesis was used to generate ApoE2 (C526T) and ApoE4 (T388C) cDNAs. The ApoE2, ApoE3, and ApoE4 cDNAs were cloned into the lentiviral vector pLX304 (Addgene plasmid # 25890) using Gateway LR Clonase II (Invitrogen); the control plasmid was FUGW (Addgene plasmid # 14883), used to monitor transfection efficiency. 293-F cells were cultured in suspension in serum-free FreeStyle 293 Expression Medium (ThermoFisher, protein-free and chemically defined formulation) and transfected with control or ApoE expression plasmids using lipid-based FreeStyle MAX Reagent (ThermoFisher) following the manufacturer’s instructions. Supernatants from transfected 293-F cells were harvested 6 days after transfection and assessed by SDS-PAGE to determine the purity and yields of recombinant ApoE proteins (Fig. 7-2A). The ApoE supernatants were diluted to proper concentration by fresh NBA/B27 (typically 50-80X) and added into cultured neurons for ApoE stimulation. The supernatant from control- (FUGW-) transfected 293-F cells was diluted the same way and added onto neurons as the control condition, in order to control for effect of other secreted proteins. HEK293 ApoE proteins were used in all ApoE stimulation experiments unless otherwise indicated. In the E. coli BL21 strain, ApoE proteins were expressed as GST fusion proteins in modified pGEX-KG vectors harboring in multiple cloning site (BamHI-EcoRI) a cleavage site recognized by human rhinovirus 3C protease (PreScission Protease): LEVLFQ/GP (DNA sequence: ctggaagttctgttccaggggccc). The cDNAs encoding ApoE2, ApoE3, and ApoE4 (mature, 299 amino acids) for the HEK293 cell expression experiments were cloned into BamHI and HindIII sites. GST-ApoE proteins were purified essentially as described (Burre et al., 2010). Bacteria were grown to OD600 of 0.5 and protein expression was induced with Isopropyl β-D-1-thiogalactopyranoside (IPTG, 0.05 mM) for 6 h at room temperature. Bacteria were then pelleted and resuspended in solubilization buffer (0.5 mg/ml lysozyme in PBS, 1 mM PMSF, 1 mM EDTA, and an EDTA-free protease inhibitor cocktail). Cell were lysed by liquid nitrogen freeze-thaw cycling and sonication. After centrifugation to remove insoluble components of cell lysates, proteins were affinity-purified with glutathione sepharose beads and collected by cleavage with rhinovirus 3C protease (PBS, 16 hours at 4 °C). The purity and yields of both HEK293 and bacterial ApoE proteins were assayed by Coomassie Blue staining (Bio-Rad, Cat# 1610786), silver staining (ThermoFisher, Cat# 24600) and immunoblotting against ApoE with conventional and non-denaturing SDS-PAGE (Fig. 7-2). Deglycosylation was also performed on HEK293 ApoE proteins to assay the glycosylation state of three variants (BioLabs, Cat# P6044S). Download Table 1-1, XML file (1.3MB, xml)
Culture of principal cell types.
All cell culture procedures were performed as reported previously (Zhang et al., 2013; Pak et al., 2015; Patzke et al., 2015; Yi et al., 2016; Huang et al., 2017). H1 human ESCs were obtained from WiCell Research Resources (RRID:CVCL_9771) and maintained in the feeder-free condition. Mouse glia were cultured from the cortex of newborn CD1 mice (Pak et al., 2015). Murine embryonic fibroblasts (MEFs) were isolated from mouse embryos of CF-1 strain (Harlan Laboratories) harvested at 12.5–13.5 postcoitum.
Generation of human neurons from H1 human ES cells.
Human neurons were generated from H1 cells essentially as described previously (Zhang et al., 2013). In short, ES cells were detached with Accutase and plated onto Matrigel-coated 6-well plates (4 × 10⁴ cells/well) on day −2. Lentiviruses expressing Ngn2 and rtTA were prepared as described below, diluted in fresh mTeSR1 medium, and added to the ESCs on day −1. Doxycycline (2 mg/L, to activate Ngn2 expression) was added on day 0 (D0) in DMEM/F-12 medium with N2 supplement without morphogens. Puromycin (1 mg/L) was added on D1 in fresh DMEM-F12/N2 + doxycycline medium for selection up to 48 h. On D3, differentiating neurons were detached with Accutase and replated on cultured mouse glia, MEFs, or just Matrigel-coated 24-well plates (2 × 10⁵ cells/well), and maintained in Neurobasal-A/B-27 medium with no doxycycline. Lentiviral infection of iN cells was performed on D4 as described below; ApoE incubations were initiated on D10 and maintained until neurons were analyzed for various parameters. For mRNA and synaptic protein measurements, the assays were performed on D12 after ApoE treatments of 2 d, unless otherwise specified in time course studies. For immunoblotting analysis of protein phosphorylation, ApoE was administered for only 2 h, and neuronal cultures were harvested immediately afterward. For synaptic density and morphology analysis, neurons were fixed for immunofluorescence on D16 or D23–D35. Electrophysiological recordings were performed at D23–D25.
Production of recombinant proteins.
Recombinant ApoE2, ApoE3, and ApoE4 were produced in HEK293 (FreeStyle 293-F) cells (Thermo Fisher Scientific; ATCC catalog #PTA-5080, RRID:CVCL_D603) or in bacteria (E. coli BL21 strain) essentially as described previously (Huang et al., 2017; detailed procedures are provided in the extended data). Recombinant proteins of glia-secreted factors for screening experiments (Fig. 4-2C) were produced in HEK293T cells transfected with plasmids encoding human proteins by a standard calcium phosphate protocol; for detailed procedures and cDNA information, please see our previous report (Huang et al., 2017). For production of recombinant RAP, pGEX-KG-RAP (provided by Dr. Joachim Herz, UT Southwestern Medical Center; Herz et al., 1991) was expressed in BL21 bacteria, and GST-RAP was purified as described previously (Burré et al., 2010; see the Materials and Methods in the extended data), except that thrombin cleavage (10 U per milligrams protein, overnight at 4°C) was used instead of rhinovirus 3C protease as a final step. The purity and yields of HEK293 and bacterial ApoE proteins and of RAP were assayed by Coomassie blue staining (Bio-Rad), silver staining (Pierce), and immunoblotting against ApoE with conventional and nondenaturing SDS-PAGE (Fig. 7-2).
Lentivirus-mediated gene expression.
Lentiviruses were produced in HEK293T cells as described previously (Pak et al., 2015), from the following plasmids: (1) lentiviruses to trans-differentiate ES cells into human neurons: TetO-Ngn2-P2A-puromycin and rtTA (Zhang et al., 2013); (2) lentiviruses to induce Apoe knock-out in primary cultures of mouse glia by loxP recombination: FUW-GFP::Cre or inactive form FUWGFP::ΔCre (Yi et al., 2016); (3) lentiviruses for overexpression of human ApoE in mouse glial cultures: pLX304-ApoE2, pLX-ApoE3 and pLX304-ApoE4 (Huang et al., 2017); (4) for overexpression of DLK, MKK7 and MBIP: pLX304-DLK, clone ID: HsCD00413295; pLX304-MBIP, HsCD00420627; pCW45-MKK7, HsCD00298961 (Harvard Medical School); (5) DN-cFos (Olive et al., 1997), DN-CERB (Ahn et al., 1998), DN-MEF2A (Ornatsky et al., 1997) and DP-CREB (Cardinaux et al., 2000): with synthesized human cDNA fragments modified from validated rodent sequences cloned into AgeI and EcoRI sites on lentiviral vector FUGW (Addgene plasmid #14883).
Lipidated ApoE: glia-conditioned media, purified glial lipoproteins, and low-density lipoprotein (LDL).
Primary glial cultures were prepared from Apoe conditional knock-out mice (B6.129S6-Apoetm1.1Mae/MazzJ; The Jackson Laboratory, stock #028530), in which loxP sites flank exon 3 of the Apoe gene. The Apoe knock-out and expression of ApoE variants were mediated by lentiviruses expressing Cre recombinase, human ApoE2, ApoE3, ApoE4, together with inactive Cre (ΔCre) and EGFP as controls, to generate five ApoE conditions: wild-type mouse ApoE (ΔCre+EGFP), ApoE-null (Cre+EGFP), human ApoE2 (Cre+ApoE2), human ApoE3 (Cre+ApoE3), and human ApoE4 (Cre+ApoE4). Serum-free media (Neurobasal-A/B-27) from glial cultures that were treated under these five conditions were harvested 72 h after lentiviral transduction and every three days on medium change thereafter up to four times. These glia-conditioned media were directly added to cultures of human neurons, or used to purify lipoproteins by concentration with spin column (Millipore catalog #UFC900324) followed by reverse precipitation using dextran polymers (MyBioSource catalog #MBS168884; Burstein et al., 1970). Human low-density lipoproteins (LDL) was obtained commercially (Thermo Fisher Scientific catalog #L3486). Glia-conditioned media, purified glial lipoproteins and human LDL were subjected to Coomassie blue staining and immunoblotting to measure the ApoE contents (see Figs. 3, Fig. 4).
Figure 3.

ApoE physiologically secreted from glia stimulates ERK phosphorylation with a similar efficacy as recombinant ApoE produced in HEK293 cells Glia-conditioned, serum-free media were prepared from primary glial cultures of transgenic Apoe floxed mice, subjected to Cre-dependent knock-out of mouse Apoe and expression of human ApoE2, ApoE3, and ApoE4 by lentiviral transduction. The glia-conditioned medium (GCM) of five ApoE conditions, mouse ApoE (ΔCre, inactive Cre, plus EGFP expression), ApoE-null (Cre+EGFP), human ApoE2 (Cre+ApoE2), human ApoE3 (Cre+ApoE3) and human ApoE4 (Cre+ApoE4), were either directly used to treat cultured human neurons, or further purified to enrich glial lipoproteins before use by a protocol of reversible precipitation by dextran polymers. A, Characterization of the ApoE content in HEK293 cell-derived ApoE, GCM, and purified glial lipoproteins as indicated by SDS-PAGE followed by Coomassie blue staining (top) or immunoblotting for ApoE (bottom). The ApoE concentrations of all conditions were quantified by Coomassie blue signal intensities of BSA standards. B, Effects of additions of GCMs containing endogenous mouse ApoE, no ApoE, or human ApoE2, human ApoE3 or human ApoE4 on ERK phosphorylation in human neurons (top, representative immunoblots to assess the levels of phospho-ERK and total ERK; bottom, summary graph of the ratio of phospho-ERK to total ERK). HEK293 ApoE3 (10 μg/ml) was included as a positive control. C, ApoE-containing glial lipoproteins purified from GCMs strongly activate MAP-kinase signaling with an ApoE4>ApoE3>ApoE2 potency rank order. Glial lipoproteins and HEK293 ApoE3 were added to human neurons cultured on MEFs at D10 with the same ApoE concentration (10 μg/ml) calculated by Coomassie blue analysis as shown in A (top, representative immunoblots to assess the levels of phospho-ERK and total ERK; bottom, summary graph of the ratio of phospho-ERK to total ERK). HEK293 ApoE3 (10 μg/ml) was included as a positive control. Data in bar graphs are means ± SEM (n = 4 independent experiments); statistical significance was evaluated by one-way ANOVA with Tukey's multiple-comparisons test (*p < 0.05; **p < 0.01; ***p < 0.001).
Figure 4.

The LDL fraction from human blood that contains high levels of ApoE activates MAP-kinase signaling in human neurons A, Characterization of the ApoE content of human LDL (obtained commercially) by SDS-PAGE followed by Coomassie blue staining (top) or immunoblotting for ApoE (bottom). The ApoE concentration of LDL was quantified by comparison with the Coomassie blue signal of BSA standards and of different amounts of LDL. B, ApoE-containing human LDL potently induces ERK phosphorylation in human neurons. LDL and HEK293 cell-derived ApoE3 (10 μg/ml) were added to D10 human neurons cultured on MEFs (top, representative immunoblots to assess the levels of phospho-ERK and total ERK; bottom, summary graph of the ratio of phospho-ERK to total ERK). Data in bar graph are means ± SEM (n = 3 independent experiments); statistical significance was evaluated by one-way ANOVA with Tukey's multiple-comparisons test (*p < 0.05; ***p < 0.001).
Suppression of gene expression using RNAi or CRISPR/Cas9.
For RNAi of DLK, shRNA to DLK (sequence: ACTCGTATTCCTTGTACATAG, TRC number: TRCN0000231658) and control shRNA (sequence: TAAGGCTATGAAGAGATAC; SHC016) were purchased from Sigma-Aldrich in lentiviral vector pLKO.1-puro. The DLK shRNA targets the 3′UTR of DLK mRNA and does not affect expression of rescue DLK, while the control shRNA contains at least four mismatches to any human or mouse gene and was demonstrated by the manufacturer to target zero gene using microarray analyses. For MKK7 CRISPR, lentiviral CRISPR/Cas9-mediated inhibition of human MKK7 expression was performed using a plasmid (lentiCRISPR v2; Addgene plasmid #52961) that coexpresses Cas9 nuclease with a single guide RNA (sgRNA). The MKK7 sgRNA (sequence: GCTTCAGCTTTGCTTCCAGG) targets exon 1 with a cleavage site at amino acid 13 and was designed using web-based tools. The control sgRNA targets EGFP (EGFP sgRNA4; sequence: GGAGCGCACCATCTTCTTCA; Addgene plasmid #51763) and was cloned into the same Cas9-expressing vector. The efficacy of the inhibition of gene expression by RNAi, or CRISPR/Cas9 was assessed by qRT-PCR as reported previously (Huang et al., 2017).
Immunofluorescence labeling experiments.
Immunofluorescence staining experiments and image acquisition and analyses were performed essentially as described previously (Huang et al., 2017). Briefly, cultured neurons were fixed in 4% paraformaldehyde, 4% sucrose in PBS, permeabilized with 0.2% Triton X-100 in PBS, and blocked with 5% goat serum in PBS. Cells were incubated with primary antibodies diluted in blocking buffer overnight at 4°C, washed 3 times, and incubated with secondary antibodies in blocking buffer for 1 h at room temperature. Samples were then mounted on glass slides for confocal imaging. The following antibodies were used: mouse anti-MAP2 (Sigma-Aldrich catalog #M1406, RRID:AB_477171, 1:1000), rabbit anti-synapsin (E028, 1:1000), rabbit anti-HOMER1 (Synaptic Systems catalog #160 003, RRID:AB_887730; 1:1000), mouse anti-Tuj1 (Covance Research Products catalog #MMS-435P, RRID:AB_2313773, 1:2000); Alexa Fluor 488-, Alexa Fluor-546-, and Alexa Fluor-633-conjugated secondary antibodies (Invitrogen). Immunofluorescence signals were visualized using a Nikon A1 confocal microscope with constant image settings. Neurons were randomly chosen in confocal images. Synapsin-positive or Homer1-positive synaptic puncta were quantified for puncta density per dendritic length, size, and intensity. Total dendritic length and cell body size were quantified based on tracing of MAP2 signals.
Immunoblotting and protein quantifications.
Neurons and cells were lysed in RIPA buffer (50 mm Tris-HCl pH 8.0, 150 mm NaCl, 0.1% SDS, 0.5% sodium deoxycholate, 1% Triton X-100, plus a mixture of protease inhibitors; Roche), and lysates were analyzed by SDS-PAGE in the presence of DTT (0.1 m). Immunoblotting and quantitative analysis were performed with fluorescent-labeled secondary antibodies and an Odyssey Infrared Imager CLX and software Image Studio 5.2.5 (LI-COR Biosciences). Signals were normalized for neuronal TUBB3 probed on the same blots as loading controls. Antibodies used were as follows: GluA1 (Millipore catalog #AB1504, RRID:AB_2113602, 1:500), PSD-95 (L667, 1:1000), synapsin (E028, 1:2000), synaptophysin (K831, 1:1000), synaptotagmin-1 (V216, 1:1000), synaptobrevin-1(T2797, 1:1000), Tuj1 (Covance Research Products catalog #MMS-435P, RRID:AB_2313773, 1:2000), APP (Millipore catalog #MABN380, RRID:AB_2714163, 1:2000), DLK (Sigma-Aldrich catalog #SAB2700169, RRID:AB_2714162, 1:1000), phospho-MKK7 Ser271/Thr275 (Cell Signaling Technology catalog #4171, RRID:AB_2250408, 1:500), MKK7 (Santa Cruz Biotechnology catalog #sc-25288, RRID:AB_627925, 1:500), phosphor-ERK1/2 Thr202/Tyr204 (Cell Signaling Technology catalog #9106, RRID:AB_331768, 1:1000), ERK1/2 (Cell Signaling Technology catalog #4695, RRID:AB_390779, 1:1000), phospho-Akt Ser473 (Cell Signaling Technology catalog #9271, RRID:AB_329825, 1:1000), Akt (Cell Signaling Technology catalog #2966, RRID:AB_823417, 1:1000), phosphor-Src Tyr 418 (Thermo Fisher Scientific catalog #44–660G, RRID:AB_2533714, 1:500), Src (Thermo Fisher Scientific catalog #AHO1152, RRID:AB_2536324, 1:1000), phospho-JNK Thr183/Tyr185 (Cell Signaling Technology catalog #9255, RRID:AB_2307321, 1:250), JNK (Cell Signaling Technology catalog #9252, RRID:AB_2250373, 1:500), phospho-c-Fos Ser374 (Santa Cruz Biotechnology catalog #sc-81485, RRID:AB_1125704, 1:500), phosphor-CREB (Cell Signaling Technology catalog #9198, RRID:AB_2561044, 1:1000), CREB (Cell Signaling Technology catalog #9104, RRID:AB_490881, 1:1000), β-actin (Sigma-Aldrich catalog #A1978, RRID:AB_476692, 1:1000); ApoE (Thermo Fisher Scientific catalog #701241, RRID:AB_2532438, 1:1000).
Gene expression analyses.
To determine the mRNA levels of genes of interest in cultured cells, qRT-PCR measurements were performed on total RNA (isolated with PrepEase RNA Spin Kit, Affymetrix) using TaqMan probes with VeriQuest Probe One-Step qRT-PCR Master Mix (Affymetrix) and an Applied Biosystems 7900HT apparatus. The predesigned TaqMan primer/probe sets were purchased from Integrated DNA Technologies and tested to show no or minimal cross-species reactivity in pure human neuronal and mouse glial cultures (Huang et al., 2017). MAP2 and GAPDH were used as endogenous reference genes. The assay IDs of all TaqMan primer/probe sets used are as follows: human MAP2, Hs.PT.58.20680759; human GAPDH, Hs.PT.58.40035104; human APP, Hs.PT.56a.38768352; human SYN1, Hs.PT.58.4027324; human SYP, Hs.PT.58.27207712; human SYT1, Hs.PT.58.19615550; human SYB1/VAMP1, Hs.PT.58.23319147; human PSD95/DLG4, Hs.PT.58.20575145; human GluA1/GRIA1, Hs.PT.58.40318075; mouse Gapdh, 4352932–0809025; mouse Apoe, Mm.PT.58.33516165.
Electrophysiology.
Whole-cell voltage-clamp recordings were performed at room temperature on human neurons at D23–25, with 3–3.5 MΩ borosilicate patch pipettes filled with an internal solution containing the following (in mm): 135 CsMeSO3, 8 NaCl, 10 HEPES, 0.25 EGTA, 4 MgATP, 0.3, Na3GTP, 2 MgCl2, 5 Na-phosphocreatine, and 2 QX314 (pH adjusted to 7.30 with CsOH). Cells were held at −70 mV in a bath solution containing the following (in mm): 140 NaCl, 10 HEPES, 10 glucose, 5 KCl, 3 CaCl2 and1 MgCl2 (pH adjusted to 7.40 with NaOH). For mEPSC recordings, TTX (1 μm) and picrotoxin (50 μm) were added to the bath solution. All electrophysiological recordings were performed with Multiclamp 700B amplifiers (Molecular Devices) and analyzed using Clampfit 10.4 (Molecular Devices). Details of the electrophysiological recording and analyses were described in (Patzke et al., 2015; Yi et al., 2016).
Results
Physiologically produced lipidated ApoE reproducibly activates MAP-kinase signaling in human neurons
Direct activation of neuronal signaling by ApoE has been reported by us and others (Gotthardt et al., 2000; Ohkubo et al., 2001; Qiu et al., 2004; Huang et al., 2017), but its validity was recently questioned (Wang et al., 2018). Given growing concerns about reproducibility, validation of scientific results is arguably more important than the prominent question of whether a particular result is physiologically relevant. To address this issue directly for the activation of neuronal signaling by ApoE, we embarked on a replication effort using a rigorous experimental design. We first validated that human neurons differentiated from ES cells do not produce ApoE at significant levels, even though the ES cells from which these neurons are derived express surprisingly high levels of ApoE (Fig. 1A,B). Moreover, we analyzed recent mouse brain single-cell RNAseq data (Saunders et al., 2018; Zeisel et al., 2018) and confirmed that in mice ApoE is also expressed at much lower levels in neurons than in astrocytes and microglia (Fig. 1C,D). These results argue against the notion that ApoE functions as a neuronal protein that is pathogenic when misfolded in the cytoplasm of neurons (Wang et al., 2018), but are consistent with the hypothesis that ApoE is produced as a signaling factor by glia.
Figure 1.

Analyses of ApoE mRNA and protein levels in various cell types reveal that ApoE expression is low in neurons but high in astrocytes and microglia. A, ApoE mRNA levels are high in mouse glia and human H1 ES cells, but barely detectable in human neurons (iNs) and mouse embryonic fibroblasts (MEFs) as determined by qRT-PCR using species-specific primers. Levels were normalized to GAPDH as an internal standard. Human neurons were examined at day 10 after induction (D10) with neurons cultured on Matrigel in the absence of glia, MEFs, or serum. B, Immunoblotting detects robust levels of ApoE protein in cultured mouse glia and human H1 ES cells, but not in human neurons (iNs) or MEFs. β-actin was analyzed as an internal standard, and synapsin-1 (Syn1) and synaptobrevin-1 (Syb1) as neuron-specific synaptic proteins. C, D, Single-cell RNAseq data obtained by Saunders et al. (2018) (C) and Zeisel et al. (2018) (D) were analyzed for relative expression levels of the indicated genes. Using the clusters as defined by each of these studies, cell types were grouped into the following populations: neurons, microglia/macrophages, astrocytes, and oligodendrocytes. Gene expression levels were compiled from each dataset with no further processing, using the units as displayed from each database.
We next tested in a 'double blind' fashion the signaling effects of ApoE on human neurons that were cultured on mouse embryonic fibroblasts (MEFs, which produce ApoE only at very low levels; Fig. 1A,B) in the absence of serum. Two scientists (Y.-W.A.H. and A.M.N.) independently produced ApoE2, ApoE3, and ApoE4 proteins in transfected HEK293 cells. These protein preparations were “anonymized” by a third scientist who randomly assigned numbers to the preparations. The original two scientists then used the anonymized samples to test whether the effect of ApoE variants on ERK phosphorylation and APP levels were reproducible.
We found that ApoE2, ApoE3, and ApoE4 proteins synthesized in HEK293 cells are secreted into the supernatant without significant differences in abundance or glycosylation state, and are pelleted by ultracentrifugation by similar g forces, suggesting that recombinant ApoE2, ApoE3, and ApoE4 produced in transfected HEK293 cells are biochemically similar (Fig. 2-1A–C). Double-blinded application of the two separate ApoE preparations by the two experimenters to human neurons yielded essentially the same results as described earlier (Huang et al., 2017), namely a stimulation of ERK1/2 phosphorylation and an increase in the levels of APP and DLK proteins, all of which were induced with a potency rank order of ApoE4>ApoE3>ApoE2 (Fig. 2A,B, and Fig. 2-2). The effect size differed between experimenters, but not between ApoE preparations, probably because of person-to-person variabilities in the technically challenging culture of human neurons on MEFs without serum supplementation. Nevertheless, the effects were significant for both ApoE preparations as performed by both experimenters.
Ultracentrifugation and deglycosylation analyses of HEK293 ApoE2, ApoE3, and ApoE4 fail to detect differences in physical state. A-B, ApoE2, ApoE3, and ApoE4 harvested from the medium of transfected HEK293 cells are pelleted by similarly high ultracentrifugation forces, suggesting that they are components of similarly sized particles and not large aggregates. ApoE2, ApoE3, and ApoE4 as well as control solutions were subjected to ultracentrifugation at the indicated g-forces for 4 hours, and the resulting supernatants and pellets were analyzed by quantitative immunoblotting using fluorescent secondary antibodies. A, representative immunoblot; B, summary graph of soluble ApoE protein. C, Glycosylation state is not different among three ApoE variants. Control and HEK293 ApoE solutions were treated without or with deglycosylase to remove all potential N-linked and common O-linked glycans and then subjected to SDS-PAGE separation and anti-ApoE, as shown in left panel. Right panel, the summary graph of the band shift distance for three variants caused by deglycosylation. The shift distance was calculated by measuring the difference in electrophoresis distance (from the well to the band) for individual ApoE variant between the untreated and deglycosylase-treated conditions, and plotted relative to ApoE2 (=1.0). Data are means ± SEM (n≥3 independent experiments), with no statistical significance among three ApoE variants by one-way ANOVA with Tukey’s multiple comparisons. Download Figure 2-1, EPS file (2.2MB, eps)
Representative immunoblot for dataset B in the independent analyses of the reproducibility of ApoE-induced neuronal signaling shown in Fig. 2. Representative immunoblots from dataset B, performed by one of two independent experimenter notated as A and B. For summary graphs and experimental conditions, see Figure 1. In blinding experimenters to the nature of the reagents as much as possible, experiments were performed such that recombinant ApoE proteins, as well as a control preparation of supernatant from GFP-transfected cells, were harvested from independently transfected FreeStyle HEK 293 cells and diluted to the final concentration in separate preparations by experimenters A and B. These two sets of solutions were then passed to a third researcher, who randomly coded the samples and distributed them back to experimenter A and B. Each experimenter grew separate cultures and began treatment with the randomly coded ApoE solutions at D10 for 48 hours. After ApoE treatment, cells were harvested and were then subjected to immunoblot (Fig. 1A,B; Fig. 1-3) or qRT-PCR analyses (Fig. 1C) to probe for expression of the indicated proteins and genes. Following the completion of all data analysis, the sample identities were decoded and compared. This parallel, blinded testing was repeated three times. Labeling of the immunoblot depicted here and in Figure 1 shows sample identity following de-coding of the data. Download Figure 2-2, EPS file (10.4MB, eps)
In contrast to the more physiological forms of ApoE produced by astrocytes or hepatocytes, HEK293 ApoE proteins have been reported to be poorly lipidated (DeMattos et al., 2001; Huang and Mahley, 2014). As the lipidation status of ApoE may influence its receptor binding, we examined whether ApoE produced by activated glia, which physiologically secrete ApoE, exhibits similar signaling activities as HEK292 cell-derived ApoE when applied to neurons cultured in the absence of glia or serum. We prepared primary cultures of mouse glia devoid of neurons from Apoe conditional knock-out line (ApoE-Flox from the Jackson Laboratory), and infected the glia with lentiviruses expressing Cre recombinase, human ApoE2, ApoE3, ApoE4, together with inactive Cre (ΔCre) and EGFP as controls, to generate five ApoE conditions: wild-type mouse ApoE (ΔCre+EGFP), ApoE-null (Cre+EGFP), human ApoE2 (Cre+ApoE2), human ApoE3 (Cre+ApoE3) and human ApoE4 (Cre+ApoE4). We then harvested and characterized the glia-conditioned medium (GCM) of five ApoE conditions: mouse ApoE, null ApoE, human ApoE2, ApoE3, and ApoE4 (Fig. 3A). The GCMs were used to treat human neurons cultured on MEFs. All GCMs from glia expressing ApoE activated MAP-kinase pathway robustly, whereas the null ApoE condition caused only weak increases in MAP-kinase activity as monitored via ERK phosphorylation (Fig. 3B). The small increase in ERK phosphorylation by GCM from mouse glia lacking ApoE may be due to other soluble factors secreted by glia that may confound the observation of ApoE-induced signals and of differences between ApoE variants. To test this hypothesis, we purified ApoE lipoproteins from the GCMs by dextran precipitation (Burstein et al., 1970). Analysis of purified glial lipoprotein preparations by Coomassie staining and immunoblotting confirmed a high content of ApoE as expected (Fig. 3A). We then tested the efficacy of glial lipoproteins obtained from GCMs under the five conditions described above on activating MAP-kinase signaling in human neurons (Fig. 3C). Strikingly, deletion of endogenous ApoE abolished the ability of glial lipoproteins to stimulate MAP-kinase signaling, demonstrating that endogenous mouse ApoE secreted from glia physiologically activates MAP-kinase signaling (Fig. 3C). Moreover, this phenotype was rescued by expression of exogenous human ApoE2, ApoE3, or ApoE4, which exhibited a significantly different efficacy consistent with a potency rank order of ApoE4>ApoE3>ApoE2 (Fig. 3C). Thus, ApoE physiologically secreted from glia activates MAP-kinase signaling in human neurons similar to HEK293 cell-derived recombinant ApoE.
To further rigorously test the effect of ApoE lipidation on MAP-kinase pathway activation, we used low-density lipoproteins (LDL) commercially prepared from human plasma. Immunoblotting analyses confirmed that LDL was enriched in ApoE (Fig. 4A). We applied human LDL to human neurons at a concentration similar to that used for HEK293 cell-derived ApoE (10 μg/ml) that was tested in parallel (Fig. 4A). LDL robustly activated MAP-kinase signaling in human neurons cultured on MEFs, confirming that even when present in a large lipid-transport particle such as LDL, ApoE can act as a signaling molecule (Fig. 4B). Together, these findings show that physiologically synthesized ApoE proteins exhibit similar properties as HEK293 cell-produced ApoE in activating MAP-kinase signaling in human neurons.
ApoE binding to neuronal receptors stimulates an array of signaling pathways
In some of the replication experiments, we included analyses of synapsin-1 protein as a synaptic marker of human neurons. We were surprised to observe an increase in synapsin-1 levels upon ApoE treatment, suggesting an effect of ApoE signaling on synapse formation (Fig. 2A). To confirm this finding, we measured mRNA levels of APP and of another synaptic marker, PSD95, in a parallel experiment, using the pan-neuronal marker MAP2 as a control. Again, we observed a significant induction of PSD95 levels by ApoE (Fig. 2C). This effect is independent of neuronogenesis since the Synapsin-1 and PSD95 levels were normalized for the neuronal marker MAP2.
These results suggest the possibility that ApoE may produce a broader signal transduction response than we had originally envisioned (Huang et al., 2017). To test this possibility, we surveyed in human neurons the effect of ApoE on the phosphorylation of four key signal transduction proteins, ERK1/2, Akt, Src, and JNK (Fig. 5A). In these experiments, we analyzed both neurons cultured on MEFs and neurons cultured on Matrigel alone in the absence of a cellular support to ensure that the observed effects did not depend on the presence of MEFs. We found that ApoE strongly stimulated phosphorylation of Akt and Src in human neurons in addition to that of ERK, again with a potency rank order of ApoE4>ApoE3>ApoE2, but that phosphorylation of JNK was not affected. All of these effects were observed in a dose-dependent fashion similarly with or without MEFs as a cellular substrate for the neuronal culture (Fig. 5A,C). The effects were abolished by the ApoE receptor blocking protein RAP, demonstrating that they were induced by ApoE receptor binding (Fig. 5B).
Figure 5.

ApoE potently activates multiple signaling pathways in human neurons with an ApoE4>ApoE3>ApoE2 potency rank order but stimulates only ERK phosphorylation in MEFs. Data are from human neurons cultured on MEFs or Matrigel or from only MEFs cultured in the absence of serum; recombinant ApoE (10 μg/ml, produced in HEK293 cells) or control solutions were added for 1 h at D10 before the indicated phosphorylation events were analyzed by immunoblotting. A, ApoE induces phosphorylation of ERK, Akt and Src but not of JNK in human neurons cultured on MEFs or Matrigel with an ApoE4>ApoE3>ApoE2 potency rank order (left, representative immunoblots; right, summary graphs). B, ApoE3-induced ERK-, Akt- and Src-phosphorylation are prevented by the ApoE receptor blocking protein RAP (50 μg/ml, applied 30 min before the 1 h ApoE incubation at D10; left, representative immunoblots; right, summary graphs). C, The ERK phosphorylation in human neurons is induced by ApoE in a dose-dependent fashion for all three ApoE variants. D, ApoE induces phosphorylation of ERK, but not Akt, Src or JNK in MEFs that were cultured in the absence of human neurons and treated with ApoE as in A (left, representative immunoblots; right, summary graphs). Data are shown as means ± SEM (n ≥ 3 independent experiments); statistical significance (*p < 0.05; **p < 0.01; ***p < 0.001) was evaluated with two-way ANOVA (A–C) or one-way ANOVA (C, D) and selected Tukey's post hoc multiple-comparisons test as indicated.
Are the signal transduction responses to ApoE observed in human neurons a general cellular response that is present in other cells as well? To examine this question, we tested ERK, Akt, Src, and JNK phosphorylation as a function of ApoE in MEFs cultured without neurons. Indeed, ApoE also induced ERK phosphorylation in MEFs, again with a rank-potency order of ApoE4>ApoE3>ApoE2, but had no effect on Akt or Src phosphorylation (Fig. 5D). Thus, ApoE may generally stimulate signal transduction in cells consistent with previous studies (Gotthardt et al., 2000; Ohkubo et al., 2001; Qiu et al., 2004), with cell-type-specific differences in the response patterns.
ApoE promotes synapse formation
The unexpected ApoE-induced increase in synaptic markers (Fig. 2) is reminiscent of the observation that ApoE-containing lipoprotein particles stimulate synapse formation (Mauch et al., 2001), prompting us to examine whether synapse formation in human neurons cultured on MEFs is stimulated by ApoE. Compared with neurons cultured on glia, neurons cultured on MEFs exhibit a ∼3-fold decrease in synapse density without a change in neuronal soma size and dendritic arborization, presumably because glia secrete potent synaptogenic factors (Fig. 6A–F; Pfrieger and Barres, 1997). Addition of ApoE to neurons cultured on MEFs in the absence of serum induced a 1.5- to twofold increase in synapse density, with a rank-potency order of ApoE4>ApoE3>ApoE2 (Fig. 6A–F; Fig. 6-1A). This increase was abolished in the presence of the ApoE receptor blocker RAP, whereas RAP had no significant effect on synapse density in neurons cultured on glia, which secrete other synaptogenic factors in addition to ApoE (Fig. 6A–F). In these experiments, we analyzed synapse density by staining the neurons for the presynaptic marker protein synapsin-1, but we observed a similar effect when we analyzed synapse density using Homer1 as a postsynaptic marker (Fig. 6G–J). Moreover, when we performed comparable experiments in neurons cultured for longer periods (DIV23–25), we observed the same effects (Fig. 6-1).
Figure 6.

ApoE increases synapse formation in human neurons in a manner inhibited by the ApoE-receptor blocking protein RAP, with a rank potency order of ApoE4>ApoE3>ApoE2. Data were from human neurons cultured on MEFs in the absence of serum; recombinant ApoE (10 μg/ml, produced in HEK293 cells) or control solutions were added at D10, and neurons were fixed and analyzed at D16. Data acquired at a later time point 23–25 d in vitro in a double-blinded manner are shown in Figure 6-1. A, Representative images of human neurons analyzed by double-immunofluorescence labeling for MAP2 (a dendritic marker) and synapsin (a presynaptic marker). B–F, Summary graphs of the synapse density (B), synaptic puncta size (C), synapsin puncta staining intensity (D), cell body area (E), and total neurite length (F) in human neurons cultured in the absence and presence of ApoE receptor blocking protein RAP (50 μg/ml). G, Representative images of human neurons labeled by dual immunofluorescence staining for MAP2 and Homer1 (a postsynaptic marker). H–J, Summary graphs of the synaptic Homer1 puncta density (H), Homer1 puncta size (I), and Homer1 puncta staining intensity (J). Data are shown as means ± SEM (n≥3 independent experiments); statistical significance (*p < 0.05, **p < 0.01; ***p < 0.001) was evaluated with one-way ANOVA with Tukey's multiple comparisons.
ApoE stimulates synaptogenesis without affecting neuronal dendritic morphology also at later stages of cultured human neurons (A,B), and ApoE3-induced increases in synaptic protein mRNA are dose- and time-dependent (C). A, ApoE’s synaptogenic effect was examined at a later culture time (D23-25) corresponding to the time point of the electrophysiological recordings in Figure 5 (left, representative images of human neurons cultured on MEFs, treated with ApoE from D10 and fixed at D23-25 for immunostaining to label dendrites by MAP2 fluorescence signals and to label synapses by synapsin; right, summary graphs of synapse density, calculated by synapsin puncta number over the length of dendrite, synapse size and synaptic synapsin-staining intensity). B, ApoE does not change neurite morphology even after prolonged culture, as assayed by confocal imaging (left, representative images of human neurons cultured on MEFs, prepared as described in A but stained for Tuj1 and MAP2; right, summary graph of the length ratio of Tuj1- and MAP2-positive processes). Data are means ± SEM (n≥3 independent experiments); statistical significance (*, p<0.05; **, p<0.01; ***, p<0.001) was evaluated with two-way (A) or one-way ANOVA (B,C) with Tukey’s multiple comparisons. Download Figure 6-1, EPS file (975.1KB, eps)
The measurements of synapsin-1 protein and PSD95 mRNA that we performed in the context of the replication experiments (Fig. 2) suggested that ApoE may stimulate synaptic gene expression in promoting synapse formation. Consistent with this hypothesis, we found that ApoE, again with a potency rank order of ApoE4>ApoE3>ApoE2, enhanced expression of all synaptic genes tested both at the mRNA and the protein level (Fig. 7A,B). As for all effects of ApoE on human neurons, this enhancement was abolished by the ApoE receptor blocker RAP, and was dose and time dependent (Fig. 7-1).
Figure 7.

ApoE stimulates synaptic gene transcription independent of its lipidation state or culture substrate, with a rank potency order of ApoE4>ApoE3>ApoE2. Data are from human neurons cultured on MEFs in the absence of serum; recombinant ApoE (10 μg/ml, produced in HEK293 cells or bacteria as indicated) or control solutions were added at D10 with or without RAP (50 μg/ml), and neurons were analyzed at D12. A, ApoE increases synaptic protein mRNA levels with an ApoE4>ApoE3>ApoE2 potency rank order; blocking ApoE receptors with RAP abolishes ApoE-induced synaptic mRNA increases. mRNA levels were measured by human-specific qRT-PCR with MAP2 as internal standard to correct for the progressive neuronal maturation during the experiment, and plotted normalized to controls (abbreviations: GluA1, glutamate receptor subunit-1; Syt1, synaptotagmin-1; Syp, synaptophysin; Syn, synapsin; Syb1, synaptobrevin-1). The dose titration and time course effects of ApoE on the expression of synaptic genes were shown in Figure 7-1. A similar ApoE variant-dependent effect was also detected in neurons derived from two different control lines of human iPS cells, as shown in Figure 7-3A,B. In addition to ApoE, a few glia-secreted factors induced transcription of synaptic genes as well, as shown in Figure 7-3C. B, ApoE increases synaptic protein levels with an ApoE4>ApoE3>ApoE2 potency rank order (left, representative immunoblots; right, summary graphs of protein levels normalized for Tuj1 as an internal standard). C, Recombinant ApoE produced in bacteria (E. coli) and HEK293 cells are equally potent in increasing synaptic protein mRNA levels in neurons cultured in the absence of glia or serum. Analyses were performed as in A. The characterization of bacterial and HEK293 ApoE proteins were shown in Figure 7-2. D, ApoE increases synaptic protein mRNA levels with an ApoE4>ApoE3>ApoE2 potency rank order also when human neurons are cultured on Matrigel without cellular support. Summary graphs show the indicated synaptic protein mRNA levels measured by human-specific quantitative RT-PCR with MAP2 as internal standard, and normalized to the untreated control. mRNA levels are normalized to the control and to MAP2 as an internal standard. Data are shown as means ± SEM (n ≥ 3 independent experiments); statistical significance (**p < 0.01; ***p < 0.001) was evaluated by two-way ANOVA with Tukey's multiple-comparisons test.
ApoE3-induced increases in synaptic protein mRNA are dose- and time-dependent. A, Measurements of the ApoE3-concentration-dependence of the induction of synaptic protein mRNA expression (left) and of the time course of ApoE3-induced synaptic protein mRNA expression (right; at 10 μg/ml ApoE3). Human neurons were cultured on MEFs and treated with ApoE3 at days D10 to D12 after neuronal induction for the dose-response curve, or at the indicated times before D12 for the time course. All qRT-PCR assays were performed at D12 and detected only human transcripts; MAP2 was used as an internal control that relates the synaptic protein mRNA levels to those of an internal neuronal marker to correct for the increasing degree of neuronal differentiation during the course of the experiment. mRNA levels were normalized to the untreated control or the 0 h time point. Data are means ± SEM (n≥3 independent experiments); statistical significance (***, p<0.001) was evaluated with two-way ANOVA with Tukey’s multiple comparisons. Download Figure 7-1, EPS file (15.7MB, eps)
Comparative analysis of ApoE2, ApoE3, and ApoE4 produced in E. coli and in transfected HEK293 cells using denaturing SDS-PAGE (A) and blue-native SDS-PAGE (B) A, SDS-PAGE analysis of recombinant ApoE2, ApoE3, and ApoE4 proteins produced in transfected HEK293 cells and in bacteria (E. coli). Top, Coomassie Blue staining; middle, immunoblotting for ApoE; bottom, silver staining. Bovine serum albumin (BSA) was analyzed on the same gel at different concentrations as a protein standard to calculate ApoE concentrations. B, Analysis of ApoE2, ApoE3 and ApoE4 proteins produced in bacteria (E coli) and HEK293 cells by non-denaturing electrophoresis followed by immunoblotting for ApoE. This blue native polyacrylamide gel electrophoresis (BN PAGE) technique provides a near-neutral operating pH and detergent compatibility for molecular weight estimations. No isoform-specific difference was observed in both bacterial and HEK293 ApoEs, but the apparent size of ApoE particles was dramatically different, suggesting a different physical state. Download Figure 7-2, EPS file (4MB, eps)
ApoE2, ApoE3, and ApoE4 stimulate synaptic gene transcription with the rank-potency order of ApoE4>ApoE3>ApoE2 also observed in human neurons derived from two different iPS cell lines (A,B), and other factors secreted by glia in addition to ApoE also stimulate synaptic gene transcription (C). A-B, ApoE2, ApoE3 and ApoE4 differentially increase mRNA levels of synaptic genes in human neurons that were derived from two different iPSC lines (A, SKC; B, EB)(Sebastiano et al., 2011; Sebastiano et al., 2014) and cultured on MEFs. Experiments were carried out as described in Fig. 7. C, Screening 24 secreted proteins that are abundantly produced by cultured mouse glia reveals three factors (ApoE, IGF2, and IGFBP2) that increased transcription of synaptic genes in human neurons cultured on MEFs. Various factors were produced as human proteins in HEK293 cells (names reflect gene symbols; vectors and procedures are as described in previously in (Huang et al., 2017)) and added to human neurons on MEFs at D10 and incubated for 48 hours, before the harvest at D12 for qRT-PCR on indicated synaptic marker genes. Data are means ± SEM (n≥3 independent experiments); statistical significance (***, p<0.001) was evaluated with two-way ANOVA with Tukey’s multiple comparisons. Download Figure 7-3, EPS file (1.3MB, eps)
Previous experiments suggested that ApoE-containing lipoprotein particles stimulate synapse formation not by virtue of their ApoE content, but by delivering cholesterol (Mauch et al., 2001). To test this hypothesis, we examined whether ApoE produced in bacteria that are incapable of synthesizing cholesterol would also stimulate synapse formation. ApoE was synthesized efficiently in bacteria (Fig. 7-2), and was as efficacious as HEK293 cell-produced ApoE in stimulating synaptic gene expression (Fig. 7C), ruling out cholesterol as a major agent. Moreover, we examined the possibility that the action of ApoE on synaptic gene expression was specific for human neurons generated from H1 ES cells, but detected a similar effect in neurons produced from two different lines of induced pluripotent stem (iPS) cells (SKC and EB lines; Fig. 7-3A,B) (Sebastiano et al., 2011, 2014). Finally, because ApoE stimulates the MAP-kinase pathway in MEFs similar to neurons (Fig. 5D), we investigated whether ApoE-induced synapse formation in neurons cultured on MEFs could be an indirect effect of the activation of MEFs. However, ApoE was as effective at stimulating synaptic gene expression in neurons cultured on an inanimate Matrigel support as neurons cultured on MEFs, indicating that ApoE acts directly on the neurons (Fig. 7D). In all of these experiments, we observed the same differential efficacy of ApoE variants with a potency rank order of ApoE4>ApoE3>ApoE2.
The significant increase in synapse numbers induced by ApoE should cause an increase in synaptic transmission if the synapses are functional. To investigate this conjecture, we recorded from neurons that were cultured on MEFs in the absence of glia or serum and that were incubated either in control medium or in medium containing ApoE2, ApoE3, or ApoE4. None of the ApoE variants had an effect on the capacitance or input resistance of the neurons (Fig. 8A,B), but all variants augmented the amplitude of evoked EPSCs 1.5- to threefold, again with a potency rank order of ApoE4>ApoE3>ApoE2 (Fig. 8C,D). Furthermore, ApoE similarly increased the frequency of spontaneous mEPSCs recorded in the presence of tetrodotoxin without a significant effect on mEPSC amplitudes (Fig. 8E–G). Thus, ApoE promotes formation of functional synapses in neurons cultured in the absence of glia or serum.
ApoE-induced synapse formation is mediated by ERK activation
We previously showed that ApoE enhances APP transcription by activating MAP-kinases, but our present data suggest that ApoE additionally stimulates multiple other signaling pathways (Fig. 5). We thus asked whether ApoE induced synaptic gene expression is sensitive to a general MAP-kinase inhibitor, U0126, or to a PI3-kinase inhibitor, Wortmannin. U0126 blocked the ApoE-induced increase in synaptic gene expression more efficiently than the ApoE receptor blocker RAP (Fig. 9A), whereas Wortmannin had no effect (Fig. 9B). Moreover, ApoE acted via the same MAP-kinases in stimulating synapse formation as in enhancing APP transcription because shRNAs targeting DLK, a MAP-kinase kinase kinase that is essential for the ApoE-induced increase in APP (Huang et al., 2017), also abolished the increase in synaptic gene expression, whereas overexpression of DLK constitutively enhanced synaptic gene expression (Fig. 10A,B). Consistently, overexpression of MBIP, an inhibitor of DLK (Fukuyama et al., 2000), abolished the effect of ApoE on synapse formation and even decreased the baseline expression of synaptic genes (Fig. 10A,B). Furthermore, CRISPR/Cas9 directed at MKK7, a MAP-kinase kinase downstream of DLK, also abolished the effect of ApoE and lowered baseline synaptic gene expression (Fig. 10A,B). Again, overexpression of MKK7 constitutively enhanced synaptic gene expression similar to overexpression of DLK. The inhibition of synapse formation by MBIP overexpression and the increase in synapse formation induced by MKK7 overexpression were similar for synapse formation stimulated by different ApoE variants (Fig. 10C). Thus, the same MAP-kinase pathway is required for both ApoE-induced synapse formation and ApoE-induced enhancement of APP transcription.
Figure 9.

ApoE induction of synaptic gene expression is blocked by the MAP-kinase inhibitor U0126 and the ApoE-receptor blocking protein RAP. Data are from human neurons cultured on MEFs in the absence of serum; recombinant ApoE (10 μg/ml) or control solutions without or with U0126 (50 μm), RAP (50 μg/ml), or Wortmannin (0.1 μm) were added at D10, and neurons were analyzed at D12. A, ApoE3-induced increases in synaptic protein levels is abolished by the MAP-kinase inhibitor U0126 and the ApoE receptor blocking protein RAP (left, representative immunoblots; right, summary graphs of the indicated synaptic protein levels). B, ApoE-induced increases in the levels of mRNAs encoding synaptic proteins is abolished by the MAP-kinase inhibitor U0126 but not by PI-3 kinase inhibitory Wortmannin. mRNA levels are normalized to the control and to MAP2 as an internal standard. Note that the rank potency order of ApoE4>ApoE3>ApoE2 is maintained under all conditions under which ApoE is active. Data are shown as means ± SEM (n ≥ 3 independent experiments); statistical significance (***p < 0.001) was evaluated with two-way ANOVA with Tukey's multiple-comparisons test.
Figure 10.

ApoE induction of synaptic gene expression requires the MAP-kinase kinase kinase DLK and the MAP-kinase kinase MKK7. Data are from human neurons cultured on MEFs in the absence of serum; the indicated molecular manipulations (DLK knockdowns with shRNAs, CRISPR-suppression of MKK7, and/or overexpression of DLK, MMK7 or MBIP) were initiated by lentiviral transduction at D4, recombinant ApoE3 (10 μg/ml) was added at D10, and neurons were analyzed at D12. A, shRNA-mediated knockdown of DLK, CRISPR-mediated suppression of MKK7 expression, or MBIP-mediated blockage of DLK activity abolish the ApoE-induced increase in synaptic protein mRNA levels, whereas DLK or MKK7 overexpression constitutively increase synaptic protein mRNA levels and render them insensitive to ApoE3 (abbreviations: OE, overexpression; shR, shRNAs). mRNA levels are normalized to the control and to MAP2 as an internal standard. B, shRNA-mediated knockdown of DLK, CRISPR-mediated suppression of MKK7 expression, or MBIP-mediated blockage of DLK activity abolish the ApoE-induced increase in synaptic protein mRNA levels, whereas DLK or MKK7 overexpression constitutively increase synaptic protein mRNA levels and render them insensitive to ApoE3 (top, representative immunoblots; bottom, summary graphs of protein levels normalized to Tuj1 as an internal standard). OE, Overexpression; shR, shRNA. C, ApoE variant-dependent effect does not affect the manipulations of DLK MAP-kinase signaling pathway, with MBIP overexpression decreasing and MKK7 overexpression increasing transcription of synaptic genes regardless of ApoE treatments. Data are shown as means ± SEM (n ≥ 3 independent experiments); statistical significance (***p < 0.001) was evaluated with two-way ANOVA with Tukey's multiple-comparisons test. n.s., not significant.
ApoE-induced synapse formation involves CREB but not cFos
ApoE-induced MAP-kinase activation stimulates cFos phosphorylation, which in turn enhances APP transcription (Huang et al., 2017). To investigate whether the same pathway operates for ApoE-induced synaptic gene expression that is also mediated by MAP-kinase activation, we examined the effect of a dominant-negative cFos mutant (Fig. 11). Although dominant-negative cFos blocked the effect of ApoE on APP transcription, it did not alter the effect of ApoE on synaptic gene expression (Fig. 11). We therefore tested dominant-negative mutants of two other transcription factors known to be important for neuronal function, CREB and MEF2A (Marie et al., 2005; Rashid et al., 2014). The mutants of human proteins were designed based on validated rodent sequences (Ornatsky et al., 1997; Ahn et al., 1998). Whereas dominant-negative MEF2A had no significant effect on the ApoE-induced stimulation of synaptic gene expression, dominant-negative CREB not only blocked ApoE-induced stimulation of synaptic gene expression, but also decreased baseline levels of synaptic gene expression (Fig. 11). Dominant-negative CREB did not interfere with the ApoE-induced stimulation of APP expression, but appeared to also decrease baseline transcription of APP as well.
Figure 11.

ApoE3-induced increases in synaptic protein expression require CREB but not cFos. Data are from human neurons cultured on MEFs in the absence of serum; the indicated molecular manipulations (overexpression of dominant-negative [DN] mutants of CREB, cFos, or MEF2A, or of a dominant-positive [DP] mutant of CREB) were initiated by lentiviral transduction at D4, recombinant ApoE3 (10 μg/ml) was added at D10, and neurons were analyzed at D12. A, DN-CREB but not DN-cFos or DN-MEF2A inhibits the ApoE3-induced increase in mRNA levels for synaptic proteins, whereas DN-cFOS but not DN-CREB or DN-MEF2A blocks the ApoE3-induced increase in APP mRNA levels. mRNA levels were quantified by qRT-PCR and are shown normalized for those of MAP2 and of controls. *p < 0.05; **p < 0.01; ***p < 0.001.
To independently confirm these results, we directly compared in a separate set of experiments the effects of dominant-negative and dominant-positive CREB on synaptic gene expression and on APP both at the RNA (Fig. 12A) and protein levels (Fig. 12B,C). Consistent with a central role for CREB in the ApoE-induced stimulation of synaptic gene expression, dominant-negative CREB uniformly decreased synaptic gene expression and blocked the effect of ApoE, whereas dominant-positive CREB constitutively enhanced synaptic gene expression. Again, dominant-negative CREB did not block the effect of ApoE on APP transcription, but decreased overall expression levels. In contrast, dominant-positive CREB (Cardinaux et al., 2000) constitutively increased APP expression levels (Fig. 12A–C). The levels of two control proteins, N-cadherin and Hsc70, were unaffected (Fig. 12B,C). The inhibitory effect of DN-CREB on the expression of synaptic proteins was similarly observed for all three ApoE variants (Fig. 12D,E). Thus, cFos is essential for the ApoE-stimulation of APP expression but not of synapse formation, whereas CREB is likely involved in synapse formation and, to a lesser degree, in APP transcription.
Figure 12.

ApoE3-induced increases in synaptic protein expression require CREB but not cFos. Data are from human neurons cultured on MEFs in the absence of serum; the indicated molecular manipulations (overexpression of dominant-negative [DN] mutants of CREB, or a dominant-positive [DP] mutant of CREB) were initiated by lentiviral transduction at D4, recombinant ApoE3 (10 μg/ml) was added at D10, and neurons were analyzed at D12. A, DN-CREB suppresses baseline levels of synaptic protein and APP mRNAs and abolishes ApoE3-induced increases of synaptic protein but not APP mRNAs; DP-CREB, in contrast, constitutively increases synaptic protein and APP mRNA levels. B, C, DN-CREB suppresses baseline levels of synaptic protein and APP protein, and abolishes ApoE3-induced increases of synaptic protein but not APP protein. DP-CREB, in contrast, constitutively increases synaptic protein and APP protein levels. B, Representative immunoblots. C, Summary graphs of protein levels normalized to Tuj1 and control (EGFP)-ApoE3. NCAD (N-cadherin) and Hsc70 (heat-shock cognate 70) proteins were used as negative controls, and the levels of overexpressed EGFP (used as a molecular manipulation control) or DN- and DP-CREB were also examined as a function of ApoE3 to exclude a possible regulation of the molecular manipulations by ApoE3 itself. D, E, The inhibitory effect of DN-CREB on synaptic protein levels is not affected by different ApoE variants. D, Representative immunoblots and summary graph of normalized synaptic protein levels. Data are shown as means ± SEM (n ≥ 3 independent experiments); statistical significance (**p < 0.01; ***p < 0.001) was evaluated with two-way ANOVA (A, C, and E) or one-way ANOVA (for APP in all panels, NCAD and Hsc70 in C) with Tukey's multiple-comparisons test. n.s., not significant.
How is CREB connected to the MAP-kinase pathway that is essential for ApoE-induced synaptic gene activation? To address this question, we monitored CREB phosphorylation as a function of ApoE treatment (Fig. 13). Strikingly, CREB phosphorylation in human neurons was potently activated by ApoE with a potency rank order of ApoE4>ApoE3>ApoE2. This activation was ablated by the ApoE receptor blocker RAP (Fig. 13A,B). ApoE-induced CREB phosphorylation was also abolished by the MAP-kinase inhibitor U0126 but not by three other kinase inhibitors: Wortmannin, PKI, or KN93 (Fig. 13C). Thus, ApoE binding to its neuronal receptors stimulates MAP-kinases, which in turn appear to phosphorylate CREB to trigger CREB-dependent synaptic gene expression and synapse formation.
Figure 13.
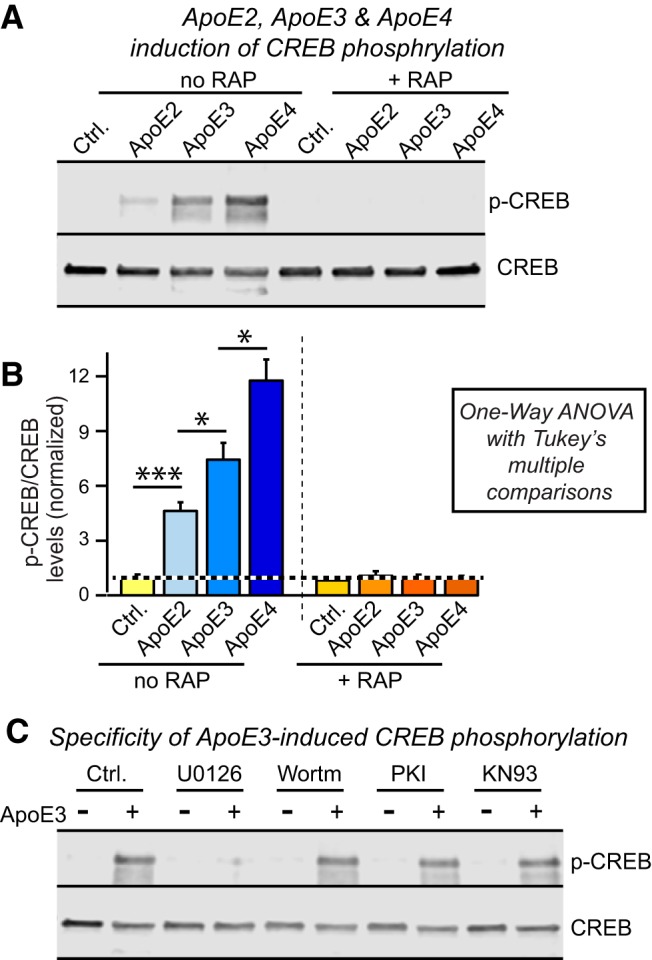
ApoE robustly activates CREB phosphorylation in human neurons grown on MEFs in a MAPK-dependent manner, with ApoE4 being more and ApoE2 being less efficacious than ApoE3. Data are from human neurons cultured on MEFs in the absence of serum; RAP (50 μg/ml), U0126 (50 μm), Wortmannin (0.1 μm), PKI (2 μm) or KN93 (1.0 μm) were added at D10 30 min before recombinant ApoEs (10 μg/ml) or control solutions as indicated, and neurons were analyzed 1 h after ApoE additions. A, B, ApoE activates CREB phosphorylation in human neurons cultured on MEFs with an ApoE4 > ApoE3 > ApoE2 rank potency order, and ApoE-induced CREB phosphorylation is abolished by the ApoE-receptor blocking protein RAP. A, Representative immunoblots. B, Summary graphs of phosphorylation levels normalized for controls). Data are shown as means ± SEM (n ≥ 3 independent experiments); statistical significance (*p < 0.05; ***p < 0.001) was evaluated with one-way ANOVA with Tukey's multiple-comparisons test. C, The MAP-kinase inhibitor U0126 but not the PI3- kinase inhibitor Wortmannin, the protein kinase A inhibitor PKI, or the CaM kinase inhibitor KN93 blocks the ApoE3-induced phosphorylation of CREB.
Discussion
Here, we used neurons trans-differentiated from human ES and iPS cells as a reduced experimental system to investigate the signaling role of ApoE specifically in human neurons. We cultured human neurons in isolation from all glial contributions to examine the differential efficacy of ApoE2, ApoE3, and ApoE4 in inducing neuronal signaling, and tested the reproducibility and extent of such signaling using multiple approaches. Using this experimental strategy, we made five major observations (see summary diagram in Fig. 14). First, we found that ApoE broadly stimulates multiple signal transduction pathways in human neurons in a manner that was inhibited by the ApoE receptor-blocking protein RAP. ApoE2, ApoE3, and ApoE4 exhibited a differential signaling efficacy with a potency rank order of ApoE4>ApoE3>ApoE2 in stimulating neuronal signaling regardless of the ApoE lipidation status. Second, we showed that the ApoE-induced stimulation of the MAP-kinase pathway is not neuron specific, but was similarly detected in MEFs in which the three ApoE variants also exhibited a potency rank order of ApoE4>ApoE3>ApoE2. Third, we observed that a major downstream effect of ApoE signaling in neurons was stimulation of synapse formation that increased the number of functional synapses without changing the size of the neurons or their dendrites. This ApoE-induced stimulation of synapse formation involved increased expression of synaptic genes, suggesting that it involves gene transcription as a basic mechanism, similar to the ApoE-induced increase in APP and Aβ synthesis we had described previously (Huang et al., 2017). Fourth, we showed that the ApoE-induced increase in synapse formation requires MAP-kinase activation similar to ApoE-induced APP transcription, suggesting that the ApoE-stimulated MAP-kinase pathway has multiple downstream readouts. Fifth and finally, we documented that, unlike the ApoE-induced increase in APP transcription that required cFos, the ApoE-induced increase in synapse formation was independent of cFos but required another transcription factor, CREB.
Figure 14.
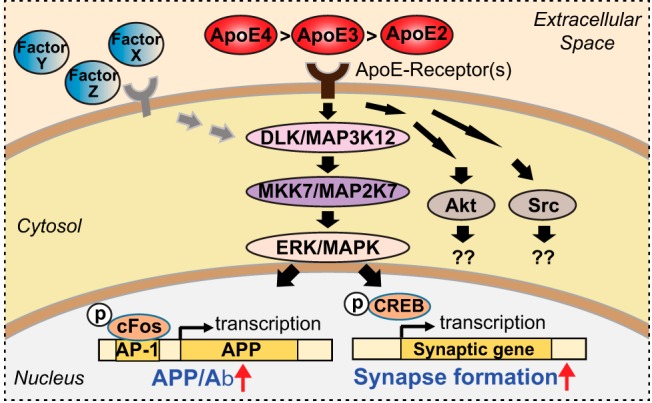
Summary diagram of differential neuronal signaling mediated by ApoE2, ApoE3, and ApoE4. ApoE binding to neuronal receptors activates multiple parallel signaling pathways, including a MAP-kinase cascade that induces both cFos and CREB phosphorylation and stimulates APP transcription and synaptogenesis.
Viewed together with earlier results (Huang et al., 2017), these findings suggest that in brain, one of the biological functions of ApoE is as a signaling molecule that activates diverse messenger pathways in neurons (Fig. 14). Our data indicate that ApoE's signaling functions are broad yet selective. For example, we showed that ApoE stimulates synapse formation but not dendritic arborization, and we found earlier that ApoE stimulates transcription of APP but not of the related genes APLP1 and APLP2 (Huang et al., 2017). These results are compatible with other data suggesting a major signaling role of ApoE in microglia (for review, see Shi and Holtzman, 2018), and support the notion that activation of astrocytes and/or microglia enhances ApoE secretion, which then in turn acts as a signaling molecule to produce diverse effects on neurons. We would like to argue that the proposed signaling role of ApoE could function as a repair signal and injury response, with increased synaptogenesis serving to compensate for potential losses of synaptic function during pathological processes (Masliah et al., 1995).
As always, our conclusions are contingent on the specific conditions of our experiments, which involved human neurons cultured on MEFs or on a noncellular substrate (Matrigel) in the absence of glia or serum. When human neurons are cultured in the presence of glia that are activated by the culture conditions and secrete an array of abundant factors, the application of additional ApoE has no specific effect, most likely because the other glial factors, secreted or presented by physical contact, occlude the effect of ApoE (Fig. 6; Fig. 7-3C; Huang et al., 2017). Our findings based on GCMs that exclude the confounding component of physical glial interactions suggest an essential function of endogenous ApoE in the glial stimulation of MAP-kinase signaling in neurons, as ApoE depletion indeed causes an impairment of MAP-kinase pathway activation (Fig. 3B,C). The purification of glial lipoproteins, which removes most other secreted factors, leads to an ApoE variant-dependent effect with a potency rank order of ApoE4>ApoE3>ApoE2, as observed using HEK293 cell-produced ApoE (Fig. 3C). Moreover, the application of human LDL, which contains naturally lipidated ApoE, activated MAP-kinase signaling with an efficacy similar to HEK293 cell-derived recombinant ApoE and to nonlipidated bacterial ApoE, strongly arguing that the signaling we observed for recombinant ApoE represents a physiological activity that does not require a specific form of lipidation.
However, our study certainly is not immune from the overall caveats associated with experiments that are performed in a reduced culture system, which is necessary to uncover mechanisms but lacks the rich diversity of an organismal context. In fact, all studies in which cultured neurons and glia are removed from their normal three-dimensional organization are likewise nonphysiological. After all, in any experimental condition using cultured neurons, the normal cellular interactions are disrupted, both glia and neurons exist in an abnormal state, and many properties—such as LTP in neurons—are lost. Nevertheless, such reduced systems are valuable and informative. Our specific approach provides high clarity by excluding glial signals, and, as a result, allows defining neuronal responses that would otherwise be blunted or concealed under conventional settings but are likely to be physiologically operating and important in a normal cellular context. This highly defined approach is akin to a biochemical reconstitution experiment of a protein complex, in which the normal cellular complexity is purposely eliminated to allow reconstruction of a specific molecular function.
With these constraints in mind, we posit that the signaling pathways that we define here provide major insight into fundamental properties of ApoE and its receptors in neurons. Our most important finding here is that ApoE binding to its receptors on neurons induces a broad activation of multiple signaling pathways that operate via diverse mechanisms and impact selective downstream processes. Although both synapse formation and APP transcription were induced by ApoE in a manner requiring activation of MAP-kinases, the downstream effectors were different in that the former required CREB, whereas the latter involved cFos. In all of the observed ApoE activities, ApoE variants exhibited a differential efficacy with a potency rank order of ApoE4>ApoE3>ApoE2. In these activities, ApoE acted by binding to classical ApoE receptors because its actions were inhibited by RAP specifically. Because of our reductionist experimental design, these findings were clearly not confounded by signaling via TREM2, a reported alternative ApoE receptor implicated in AD, because TREM2 is not detectably expressed in MEFs or human neurons and, as a noncanonical putative ApoE receptor, TREM2 is not expected to bind to RAP. Neurons express multiple classical ApoE receptors, most prominently LRP1, and the precise ApoE receptor(s) involved in the processes we studied here remains unknown.
How do the present observations relate to the contribution of allelic ApoE variants to AD pathogenesis? It seems counterintuitive that ApoE4, which predisposes to AD and thus presumably to neurodegenerative synapse loss, should be more effective in promoting synapse formation than ApoE2, which protects against AD and synapse loss. However, examination of postmortem AD brains showed that, though synapse loss in the dentate gyrus was observed, it was not correlated with APOE genotypes (Scheff et al., 2006). Moreover, ApoE is not required for overall normal brain function as evidenced by the generally normal cognitive performance of ApoE-deficient human patients (Ghiselli et al., 1981; Lohse et al., 1992; Mak et al., 2014). This fact suggests that the signaling function of ApoE does not contribute an essential component to brain performance under nonpathological conditions, and that it is not required for normal synapse formation. If ApoE signaling kicks in under pathophysiological conditions, the increased efficacy of ApoE4 as a signaling molecule may cause differential effects on neuronal survival over prolonged time periods. Differences in signaling strength between ApoE variants may also be confounded by variant-specific differences in the trafficking and recycling of ApoE and its receptors (Heeren et al., 2004; Chen et al., 2010). The fact that the genetic ApoE variants show such robust and consistent differences in their respective potency of activating neuronal signaling pathways seems to us to be more important than the precise nature of this signaling, because this fact provides a potential explanation for why ApoE4 is deleterious and ApoE2 is protective in AD pathogenesis, even if the specific nature of AD pathogenesis and the role of ApoE-signaling in it remain undefined.
The finding that ApoE2, ApoE3, and ApoE4 exhibit differential efficacies in neuronal signaling that mirrors their ApoE-receptor binding properties has potential therapeutic implications. If ApoE-induced neuronal signaling is involved in AD pathogenesis, decreasing such signaling that is enhanced in ApoE4 carriers would be a viable pathway for therapy. Achieving such a therapy, however, requires not only validating the proposed mechanism of the role of ApoE4 in AD pathogenesis—something that has arguably not yet been achieved for any hypothesis—but also identifying the specific receptor involved in neuronal ApoE signaling. Multiple ApoE receptors are expressed in neurons. Which of these receptors mediates the neuronal ApoE signaling characterized here, however, is unknown. Identification of this receptor is thus the most important next goal toward a development of pharmacological agents that could specifically dampen ApoE4 signaling and thereby ameliorating the increased risk for AD in ApoE4-expressing population. Accomplishing this goal will be a primary focus in forthcoming studies.
Footnotes
This work was supported by the National Institutes of Health (Grant RF1 AG04813101 to T.C.S. and M.W. and Grant K99/R00 AG054616 to Y.-W.A.H.). Y.A. H. is a GFL Translational Professor from Center for Translational Neuroscience in the Brown Institute for Translational Sciences. M.W. is a Tashia and John Morgridge Faculty Scholar from the Child Health Research Institute at Stanford and a Howard Hughes Medical Institute Faculty Scholar. We thank Dr. J. Herz for the RAP expression vector and ApoE antibodies.
The authors declare no competing financial interests.
References
- Ahn S, Olive M, Aggarwal S, Krylov D, Ginty DD, Vinson C (1998) A dominant-negative inhibitor of CREB reveals that it is a general mediator of stimulus-dependent transcription of c-fos. Mol Cell Biol 18:967–977. 10.1128/MCB.18.2.967 [DOI] [PMC free article] [PubMed] [Google Scholar]
- Atagi Y, Liu CC, Painter MM, Chen XF, Verbeeck C, Zheng H, Li X, Rademakers R, Kang SS, Xu H, Younkin S, Das P, Fryer JD, Bu G (2015) Apolipoprotein E is a ligand for triggering receptor expressed on myeloid cells 2 (TREM2). J Biol Chem 290:26043–26050. 10.1074/jbc.M115.679043 [DOI] [PMC free article] [PubMed] [Google Scholar]
- Bailey CC, DeVaux LB, Farzan M (2015) The Triggering Receptor Expressed on Myeloid Cells 2 Binds Apolipoprotein E. J Biol Chem 290:26033–26042. 10.1074/jbc.M115.677286 [DOI] [PMC free article] [PubMed] [Google Scholar]
- Boyles JK, Pitas RE, Wilson E, Mahley RW, Taylor JM (1985) Apolipoprotein E associated with astrocytic glia of the central nervous system and with nonmyelinating glia of the peripheral nervous system. J Clin Invest 76:1501–1513. 10.1172/JCI112130 [DOI] [PMC free article] [PubMed] [Google Scholar]
- Burré J, Sharma M, Tsetsenis T, Buchman V, Etherton MR, Südhof TC (2010) Alpha-synuclein promotes SNARE-complex assembly in vivo and in vitro. Science 329:1663–1667. 10.1126/science.1195227 [DOI] [PMC free article] [PubMed] [Google Scholar]
- Burstein M, Scholnick HR, Morfin R (1970) Rapid method for the isolation of lipoproteins from human serum by precipitation with polyanions. J Lipid Res 11:583–595. [PubMed] [Google Scholar]
- Calandra S, Tarugi P, Speedy HE, Dean AF, Bertolini S, Shoulders CC (2011) Mechanisms and genetic determinants regulating sterol absorption, circulating LDL levels, and sterol elimination: implications for classification and disease risk. J Lipid Res 52:1885–1926. 10.1194/jlr.R017855 [DOI] [PMC free article] [PubMed] [Google Scholar]
- Cardinaux JR, Notis JC, Zhang Q, Vo N, Craig JC, Fass DM, Brennan RG, Goodman RH (2000) Recruitment of CREB binding protein is sufficient for CREB-mediated gene activation. Mol Cell Biol 20:1546–1552. 10.1128/MCB.20.5.1546-1552.2000 [DOI] [PMC free article] [PubMed] [Google Scholar]
- Castellano JM, Kim J, Stewart FR, Jiang H, DeMattos RB, Patterson BW, Fagan AM, Morris JC, Mawuenyega KG, Cruchaga C, Goate AM, Bales KR, Paul SM, Bateman RJ, Holtzman DM (2011) Human apoE isoforms differentially regulate brain amyloid-beta peptide clearance. Sci Transl Med 3:89ra57. 10.1126/scitranslmed.3002156 [DOI] [PMC free article] [PubMed] [Google Scholar]
- Chen Y, Durakoglugil MS, Xian X, Herz J (2010) ApoE4 reduces glutamate receptor function and synaptic plasticity by selectively impairing ApoE receptor recycling. Proc Natl Acad Sci U S A 107:12011–12016. 10.1073/pnas.0914984107 [DOI] [PMC free article] [PubMed] [Google Scholar]
- Colonna M, Wang Y (2016) TREM2 variants: new keys to decipher alzheimer disease pathogenesis. Nat Rev Neurosci 17:201–207. 10.1038/nrn.2016.7 [DOI] [PubMed] [Google Scholar]
- Deane R, Sagare A, Hamm K, Parisi M, Lane S, Finn MB, Holtzman DM, Zlokovic BV (2008) apoE isoform-specific disruption of amyloid beta peptide clearance from mouse brain. J Clin Invest 118:4002–4013. 10.1172/JCI36663 [DOI] [PMC free article] [PubMed] [Google Scholar]
- de Knijff P, van den Maagdenberg AM, Frants RR, Havekes LM (1994) Genetic heterogeneity of apolipoprotein E and its influence on plasma lipid and lipoprotein levels. Hum Mut 4:178–194. 10.1002/humu.1380040303 [DOI] [PubMed] [Google Scholar]
- DeMattos RB, Brendza RP, Heuser JE, Kierson M, Cirrito JR, Fryer J, Sullivan PM, Fagan AM, Han X, Holtzman DM (2001) Purification and characterization of astrocyte-secreted apolipoprotein E and J-containing lipoproteins from wild-type and human apoE transgenic mice. Neurochem Int 39:415–425. 10.1016/S0197-0186(01)00049-3 [DOI] [PubMed] [Google Scholar]
- Fukuyama K, Yoshida M, Yamashita A, Deyama T, Baba M, Suzuki A, Mohri H, Ikezawa Z, Nakajima H, Hirai S, Ohno S (2000) MAPK upstream kinase (MUK)-binding inhibitory protein, a negative regulator of MUK/dual leucine zipper-bearing kinase/leucine zipper protein kinase. J Biol Chem 275:21247–21254. 10.1074/jbc.M001488200 [DOI] [PubMed] [Google Scholar]
- Ghiselli G, Schaefer EJ, Gascon P, Breser HB Jr (1981) Type III hyperlipoproteinemia associated with apolipoprotein E deficiency. Science 214:1239–1241. 10.1126/science.6795720 [DOI] [PubMed] [Google Scholar]
- Goldstein JL, Brown MS (2015) A century of cholesterol and coronaries: from plaques to genes to statins. Cell 161:161–172. 10.1016/j.cell.2015.01.036 [DOI] [PMC free article] [PubMed] [Google Scholar]
- Gotthardt M, Trommsdorff M, Nevitt MF, Shelton J, Richardson JA, Stockinger W, Nimpf J, Herz J (2000) Interactions of the low density lipoprotein receptor gene family with cytosolic adaptor and scaffold proteins suggest diverse biological functions in cellular communication and signal transduction. J Biol Chem 275:25616–25624. 10.1074/jbc.M000955200 [DOI] [PubMed] [Google Scholar]
- Guerreiro R, et al. (2013) TREM2 variants in Alzheimer's disease. N Engl J Med 368:117–127. 10.1056/NEJMoa1211851 [DOI] [PMC free article] [PubMed] [Google Scholar]
- Heeren J, Grewal T, Laatsch A, Becker N, Rinninger F, Rye KA, Beisiegel U (2004) Impaired recycling of apolipoprotein E4 is associated with intracellular cholesterol accumulation. J Biol Chem 279:55483–55492. 10.1074/jbc.M409324200 [DOI] [PubMed] [Google Scholar]
- Heinsinger NM, Gachechiladze MA, Rebeck GW (2016) Apolipoprotein E genotype affects size of ApoE complexes in cerebrospinal fluid. J Neuropathol Exp Neurol 75:918–924. 10.1093/jnen/nlw067 [DOI] [PMC free article] [PubMed] [Google Scholar]
- Herz J, Goldstein JL, Strickland DK, Ho YK, Brown MS (1991) 39-kDa protein modulates binding of ligands to low density lipoprotein receptor-related protein/alpha 2-macroglobulin receptor. J Biol Chem 266:21232–21238. [PubMed] [Google Scholar]
- Hu J, Liu CC, Chen XF, Zhang YW, Xu H, Bu G (2015) Opposing effects of viral mediated brain expression of apolipoprotein E2 (apoE2) and apoE4 on apoE lipidation and abeta metabolism in apoE4-targeted replacement mice. Mol Neurodegener 10:6. 10.1186/s13024-015-0001-3 [DOI] [PMC free article] [PubMed] [Google Scholar]
- Huang Y, Mahley RW (2014) Apolipoprotein E: structure and function in lipid metabolism, neurobiology, and Alzheimer's diseases. Neurobiol Dis 72:3–12. 10.1016/j.nbd.2014.08.025 [DOI] [PMC free article] [PubMed] [Google Scholar]
- Huang YA, Zhou B, Wernig M, Südhof TC (2017) ApoE2, ApoE3, and ApoE4 Differentially Stimulate APP Transcription and Abeta Secretion. Cell 168:427–441.e21. 10.1016/j.cell.2016.12.044 [DOI] [PMC free article] [PubMed] [Google Scholar]
- Jendresen C, Årskog V, Daws MR, Nilsson LN (2017) The Alzheimer's disease risk factors apolipoprotein E and TREM2 are linked in a receptor signaling pathway. J Neuroinflammation 14:59. 10.1186/s12974-017-0835-4 [DOI] [PMC free article] [PubMed] [Google Scholar]
- Jonsson T, et al. (2013) Variant of TREM2 associated with the risk of Alzheimer's disease. N Engl J Med 368:107–116. 10.1056/NEJMoa1211103 [DOI] [PMC free article] [PubMed] [Google Scholar]
- Krasemann S, et al. (2017) The TREM2-APOE pathway drives the transcriptional phenotype of dysfunctional microglia in neurodegenerative diseases. Immunity 47:566–581.e569. 10.1016/j.immuni.2017.08.008 [DOI] [PMC free article] [PubMed] [Google Scholar]
- Lane-Donovan C, Herz J (2017) ApoE, ApoE receptors, and the synapse in Alzheimer's disease. Trends Endocrinol Metab 28:273–284. 10.1016/j.tem.2016.12.001 [DOI] [PMC free article] [PubMed] [Google Scholar]
- Lohse P, Brewer HB 3rd, Meng MS, Skarlatos SI, LaRosa JC, Brewer HB Jr (1992) Familial apolipoprotein E deficiency and type III hyperlipoproteinemia due to a premature stop codon in the apolipoprotein E gene. J Lipid Res 33:1583–1590. [PubMed] [Google Scholar]
- Mak AC, et al. (2014) Effects of the absence of apolipoprotein e on lipoproteins, neurocognitive function, and retinal function. JAMA Neurol 71:1228–1236. 10.1001/jamaneurol.2014.2011 [DOI] [PMC free article] [PubMed] [Google Scholar]
- Mamotte CD, Sturm M, Foo JI, van Bockxmeer FM, Taylor RR (1999) Comparison of the LDL-receptor binding of VLDL and LDL from apoE4 and apoE3 homozygotes. Am J Physiol 276:E553–E557. 10.1152/ajpendo.1999.276.3.E553 [DOI] [PubMed] [Google Scholar]
- Marie H, Morishita W, Yu X, Calakos N, Malenka RC (2005) Generation of silent synapses by acute in vivo expression of CaMKIV and CREB. Neuron 45:741–752. 10.1016/j.neuron.2005.01.039 [DOI] [PubMed] [Google Scholar]
- Martins RN, Taddei K, Kendall C, Evin G, Bates KA, Harvey AR (2001) Altered expression of apolipoprotein E, amyloid precursor protein and presenilin-1 is associated with chronic reactive gliosis in rat cortical tissue. Neuroscience 106:557–569. 10.1016/S0306-4522(01)00289-5 [DOI] [PubMed] [Google Scholar]
- Masliah E, Mallory M, Alford M, Ge N, and Mucke L (1995) Abnormal synaptic regeneration in hAPP695 transgenic and ApoE knockout mice. In: Research advances in Alzheimer's disease and related disorders (Igbal K, Mortimer JA, Winblad B, Wisniewski HM, eds), pp 405–414. New York: Wiley. [Google Scholar]
- Mauch DH, Nägler K, Schumacher S, Göritz C, Müller EC, Otto A, Pfrieger FW (2001) CNS synaptogenesis promoted by glia-derived cholesterol. Science 294:1354–1357. 10.1126/science.294.5545.1354 [DOI] [PubMed] [Google Scholar]
- Nathan BP, Nisar R, Randall S, Short J, Sherrow M, Wong GK, Struble RG (2001) Apolipoprotein E is upregulated in olfactory bulb glia following peripheral receptor lesion in mice. Exp Neurol 172:128–136. 10.1006/exnr.2001.7762 [DOI] [PubMed] [Google Scholar]
- Ohkubo N, Mitsuda N, Tamatani M, Yamaguchi A, Lee YD, Ogihara T, Vitek MP, Tohyama M (2001) Apolipoprotein E4 stimulates cAMP response element-binding protein transcriptional activity through the extracellular signal-regulated kinase pathway. J Biol Chem 276:3046–3053. 10.1074/jbc.M005070200 [DOI] [PubMed] [Google Scholar]
- Olive M, Krylov D, Echlin DR, Gardner K, Taparowsky E, Vinson C (1997) A dominant negative to activation protein-1 (AP1) that abolishes DNA binding and inhibits oncogenesis. J Biol Chem 272:18586–18594. 10.1074/jbc.272.30.18586 [DOI] [PubMed] [Google Scholar]
- Ornatsky OI, Andreucci JJ, McDermott JC (1997) A dominant-negative form of transcription factor MEF2 inhibits myogenesis. J Biol Chem 272:33271–33278. 10.1074/jbc.272.52.33271 [DOI] [PubMed] [Google Scholar]
- Pak C, Danko T, Zhang Y, Aoto J, Anderson G, Maxeiner S, Yi F, Wernig M, Südhof TC (2015) Human neuropsychiatric disease modeling using conditional deletion reveals synaptic transmission defects caused by heterozygous mutations in NRXN1. Cell Stem Cell 17:316–328. 10.1016/j.stem.2015.07.017 [DOI] [PMC free article] [PubMed] [Google Scholar]
- Patzke C, Han Y, Covy J, Yi F, Maxeiner S, Wernig M, Südhof TC (2015) Analysis of conditional heterozygous STXBP1 mutations in human neurons. J Clin Invest 125:3560–3571. 10.1172/JCI78612 [DOI] [PMC free article] [PubMed] [Google Scholar]
- Pfrieger FW, Barres BA (1997) Synaptic efficacy enhanced by glial cells in vitro. Science 277:1684–1687. 10.1126/science.277.5332.1684 [DOI] [PubMed] [Google Scholar]
- Poirier J, Hess M, May PC, Finch CE (1991) Astrocytic apolipoprotein E mRNA and GFAP mRNA in hippocampus after entorhinal cortex lesioning. Brain Res Mol Brain Res 11:97–106. 10.1016/0169-328X(91)90111-A [DOI] [PubMed] [Google Scholar]
- Qiu Z, Hyman BT, Rebeck GW (2004) Apolipoprotein E receptors mediate neurite outgrowth through activation of p44/42 mitogen-activated protein kinase in primary neurons. J Biol Chem 279:34948–34956. 10.1074/jbc.M401055200 [DOI] [PubMed] [Google Scholar]
- Rashid AJ, Cole CJ, Josselyn SA (2014) Emerging roles for MEF2 transcription factors in memory. Genes Brain Behav 13:118–125. 10.1111/gbb.12058 [DOI] [PubMed] [Google Scholar]
- Rebeck GW, Kindy M, LaDu MJ (2002) Apolipoprotein E and Alzheimer's disease: the protective effects of ApoE2 and E3. J Alzheimers Dis 4:145–154. 10.3233/JAD-2002-4304 [DOI] [PubMed] [Google Scholar]
- Robert J, Button EB, Yuen B, Gilmour M, Kang K, Bahrabadi A, Stukas S, Zhao W, Kulic I, Wellington CL (2017) Clearance of beta-amyloid is facilitated by apolipoprotein E and circulating high-density lipoproteins in bioengineered human vessels. eLife 6. [DOI] [PMC free article] [PubMed] [Google Scholar]
- Saunders A, Macosko EZ, Wysoker A, Goldman M, Krienen FM, de Rivera H, Bien E, Baum M, Bortolin L, Wang S, Goeva A, Nemesh J, Kamitaki N, Brumbaugh S, Kulp D, McCarroll SA (2018) Molecular diversity and specializations among the cells of the adult mouse brain. Cell 174:1015–1030.e16. 10.1016/j.cell.2018.07.028 [DOI] [PMC free article] [PubMed] [Google Scholar]
- Saura J, Petegnief V, Wu X, Liang Y, Paul SM (2003) Microglial apolipoprotein E and astroglial apolipoprotein J expression in vitro: opposite effects of lipopolysaccharide. J Neurochem 85:1455–1467. 10.1046/j.1471-4159.2003.01788.x [DOI] [PubMed] [Google Scholar]
- Scheff SW, Price DA, Schmitt FA, Mufson EJ (2006) Hippocampal synaptic loss in early Alzheimer's disease and mild cognitive impairment. Neurobiol Aging 27:1372–1384. 10.1016/j.neurobiolaging.2005.09.012 [DOI] [PubMed] [Google Scholar]
- Schmidt V, Carlo AS, Willnow TE (2014) Apolipoprotein E receptor pathways in Alzheimer disease. Wiley Interdiscip Rev Syst Biol Med 6:255–270. 10.1002/wsbm.1262 [DOI] [PubMed] [Google Scholar]
- Sebastiano V, et al. (2014) Human COL7A1-corrected induced pluripotent stem cells for the treatment of recessive dystrophic epidermolysis bullosa. Sci Transl Med 6:264ra163. 10.1126/scitranslmed.3009540 [DOI] [PMC free article] [PubMed] [Google Scholar]
- Sebastiano V, Maeder ML, Angstman JF, Haddad B, Khayter C, Yeo DT, Goodwin MJ, Hawkins JS, Ramirez CL, Batista LF, Artandi SE, Wernig M, Joung JK (2011) In situ genetic correction of the sickle cell anemia mutation in human induced pluripotent stem cells using engineered zinc finger nucleases. Stem Cells 29:1717–1726. 10.1002/stem.718 [DOI] [PMC free article] [PubMed] [Google Scholar]
- Shi Y, Holtzman DM (2018) Interplay between innate immunity and Alzheimer disease: APOE and TREM2 in the spotlight. Nat Rev Immunol 18:759–772. 10.1038/s41577-018-0051-1 [DOI] [PMC free article] [PubMed] [Google Scholar]
- Smelt AH, de Beer F (2004) Apolipoprotein E and familial dysbetalipoproteinemia: clinical, biochemical, and genetic aspects. Semin Vasc Med 4:249–257. 10.1055/s-2004-861492 [DOI] [PubMed] [Google Scholar]
- Strittmatter WJ, Saunders AM, Schmechel D, Pericak-Vance M, Enghild J, Salvesen GS, Roses AD (1993) Apolipoprotein E: high-avidity binding to beta-amyloid and increased frequency of type 4 allele in late-onset familial Alzheimer disease. Proc Natl Acad Sci U S A 90:1977–1981. 10.1073/pnas.90.5.1977 [DOI] [PMC free article] [PubMed] [Google Scholar]
- Südhof TC, Goldstein JL, Brown MS, Russell DW (1985) The LDL receptor gene: a mosaic of exons shared with different proteins. Science 228:815–822. 10.1126/science.2988123 [DOI] [PMC free article] [PubMed] [Google Scholar]
- Ulrich JD, Ulland TK, Mahan TE, Nyström S, Nilsson KP, Song WM, Zhou Y, Reinartz M, Choi S, Jiang H, Stewart FR, Anderson E, Wang Y, Colonna M, Holtzman DM (2018) ApoE facilitates the microglial response to amyloid plaque pathology. J Exp Med 215:1047–1058. 10.1084/jem.20171265 [DOI] [PMC free article] [PubMed] [Google Scholar]
- Utermann G. (1985) Morgagni lecture: genetic polymorphism of apolipoprotein E: Impact on plasma lipoprotein metabolism. In: Diabetes, obesity and hyperlipidemias (Crepaldi G, Tiengo A, Baggio G, eds.), pp 1–28. Amsterdam: Elsevier. [Google Scholar]
- Verghese PB, Castellano JM, Garai K, Wang Y, Jiang H, Shah A, Bu G, Frieden C, Holtzman DM (2013) ApoE influences amyloid-beta (Abeta) clearance despite minimal apoE/Abeta association in physiological conditions. Proc Natl Acad Sci U S A 110:E1807–E1816. 10.1073/pnas.1220484110 [DOI] [PMC free article] [PubMed] [Google Scholar]
- Wang C, Najm R, Xu Q, Jeong DE, Walker D, Balestra ME, Yoon SY, Yuan H, Li G, Miller ZA, Miller BL, Malloy MJ, Huang Y (2018) Gain of toxic apolipoprotein E4 effects in human iPSC-derived neurons is ameliorated by a small-molecule structure corrector. Nat Med 24:647–657. 10.1038/s41591-018-0004-z [DOI] [PMC free article] [PubMed] [Google Scholar]
- Weisgraber KH. (1994) Apolipoprotein E: structure-function relationships. Adv Protein Chem 45:249–302. 10.1016/S0065-3233(08)60642-7 [DOI] [PubMed] [Google Scholar]
- Weisgraber KH, Innerarity TL, Mahley RW (1982) Abnormal lipoprotein receptor-binding activity of the human E apoprotein due to cysteine-arginine interchange at a single site. J Biol Chem 257:2518–2521. [PubMed] [Google Scholar]
- Yeh FL, Wang Y, Tom I, Gonzalez LC, Sheng M (2016) TREM2 binds to apolipoproteins, including APOE and CLU/APOJ, and thereby facilitates uptake of amyloid-beta by microglia. Neuron 91:328–340. 10.1016/j.neuron.2016.06.015 [DOI] [PubMed] [Google Scholar]
- Yi F, Danko T, Botelho SC, Patzke C, Pak C, Wernig M, Südhof TC (2016) Autism-associated SHANK3 haploinsufficiency causes Ih channelopathy in human neurons. Science 352:aaf2669. 10.1126/science.aaf2669 [DOI] [PMC free article] [PubMed] [Google Scholar]
- Zeisel A, Hochgerner H, Lönnerberg P, Johnsson A, Memic F, van der Zwan J, Häring M, Braun E, Borm LE, La Manno G, Codeluppi S, Furlan A, Lee K, Skene N, Harris KD, Hjerling-Leffler J, Arenas E, Ernfors P, Marklund U, Linnarsson S (2018) Molecular architecture of the mouse nervous system. Cell 174:999–1014.e22. 10.1016/j.cell.2018.06.021 [DOI] [PMC free article] [PubMed] [Google Scholar]
- Zhang Y, Pak C, Han Y, Ahlenius H, Zhang Z, Chanda S, Marro S, Patzke C, Acuna C, Covy J, Xu W, Yang N, Danko T, Chen L, Wernig M, Südhof TC (2013) Rapid single-step induction of functional neurons from human pluripotent stem cells. Neuron 78:785–798. 10.1016/j.neuron.2013.05.029 [DOI] [PMC free article] [PubMed] [Google Scholar]
Associated Data
This section collects any data citations, data availability statements, or supplementary materials included in this article.
Supplementary Materials
Culture of principal cell types a. H1 human ESCs were obtained from WiCell Research Resources (Wicell, WI), maintained in mTeSR1 medium (Stem Cell Technologies) without feeder cells, and used at intermediate passage numbers (∼50-60) to generate human neurons, as described previously (Zhang et al., 2013). iPS cell lines EB and SKC from the Stanford Stem Cell Core (Fig. 4-2A,B)(Sebastiano et al., 2011; Sebastiano et al., 2014). Mycoplasma testing and karyotyping were performed regularly (approximately every 10 passages). The H1 ES cell line is not listed in the database of commonly-misidentified cell lines maintained by ICLAC. b. Mouse glia were cultured from the cortex of newborn CD1 mice. The cortex was dissected, digested with papain (10 U/ml) for 20 minutes at 37oC, and harshly triturated. Cells were plated onto T75 flasks in Dulbecco's Modified Eagle Medium (DMEM) supplemented with 10% fetal bovine serum (FBS). At 80-90% confluence, glial cultures were trypsinized and re-plated at lower density (20-30% confluence) in DMEM + 10% FBS. This re-plating procedure was repeated 2-3 times (typically 3-4 days apart) to remove mouse neurons before cultured glia were used for analysis or co-culture experiments with human neurons. No antibiotics or other drugs were used in glial cultures. c. Murine embryonic fibroblasts (MEFs) were isolated from mouse embryos of CF-1 strain (Harlan Laboratories, Inc.) harvested at 12.5-13.5 postcoitum (p.c.). Briefly, embryos were dissected out of terminally-anesthetized mice. The head and internal organs were removed, and the remaining carcasses were finely minced, trypsinized into single-cell suspensions, and plated onto T75 flasks. The cultured MEFs (P0) were frozen or briefly expanded (a maximum of 3 times, P3) before they were used for experiments. Production of recombinant ApoE proteins Recombinant ApoE2, ApoE3, and ApoE4 were produced in HEK293 (FreeStyle 293-F) cells (ThermoFisher) or bacteria (E. coli BL21 strain). Expression vectors for human ApoE2, ApoE3, and ApoE4 were constructed using ApoE3 cDNA in a pDONR221 vector (Gateway recombination system) obtained from Harvard Medical School (Harvard PlasmID Database, clone ID: HsCD00044600). Site-directed mutagenesis was used to generate ApoE2 (C526T) and ApoE4 (T388C) cDNAs. The ApoE2, ApoE3, and ApoE4 cDNAs were cloned into the lentiviral vector pLX304 (Addgene plasmid # 25890) using Gateway LR Clonase II (Invitrogen); the control plasmid was FUGW (Addgene plasmid # 14883), used to monitor transfection efficiency. 293-F cells were cultured in suspension in serum-free FreeStyle 293 Expression Medium (ThermoFisher, protein-free and chemically defined formulation) and transfected with control or ApoE expression plasmids using lipid-based FreeStyle MAX Reagent (ThermoFisher) following the manufacturer’s instructions. Supernatants from transfected 293-F cells were harvested 6 days after transfection and assessed by SDS-PAGE to determine the purity and yields of recombinant ApoE proteins (Fig. 7-2A). The ApoE supernatants were diluted to proper concentration by fresh NBA/B27 (typically 50-80X) and added into cultured neurons for ApoE stimulation. The supernatant from control- (FUGW-) transfected 293-F cells was diluted the same way and added onto neurons as the control condition, in order to control for effect of other secreted proteins. HEK293 ApoE proteins were used in all ApoE stimulation experiments unless otherwise indicated. In the E. coli BL21 strain, ApoE proteins were expressed as GST fusion proteins in modified pGEX-KG vectors harboring in multiple cloning site (BamHI-EcoRI) a cleavage site recognized by human rhinovirus 3C protease (PreScission Protease): LEVLFQ/GP (DNA sequence: ctggaagttctgttccaggggccc). The cDNAs encoding ApoE2, ApoE3, and ApoE4 (mature, 299 amino acids) for the HEK293 cell expression experiments were cloned into BamHI and HindIII sites. GST-ApoE proteins were purified essentially as described (Burre et al., 2010). Bacteria were grown to OD600 of 0.5 and protein expression was induced with Isopropyl β-D-1-thiogalactopyranoside (IPTG, 0.05 mM) for 6 h at room temperature. Bacteria were then pelleted and resuspended in solubilization buffer (0.5 mg/ml lysozyme in PBS, 1 mM PMSF, 1 mM EDTA, and an EDTA-free protease inhibitor cocktail). Cell were lysed by liquid nitrogen freeze-thaw cycling and sonication. After centrifugation to remove insoluble components of cell lysates, proteins were affinity-purified with glutathione sepharose beads and collected by cleavage with rhinovirus 3C protease (PBS, 16 hours at 4 °C). The purity and yields of both HEK293 and bacterial ApoE proteins were assayed by Coomassie Blue staining (Bio-Rad, Cat# 1610786), silver staining (ThermoFisher, Cat# 24600) and immunoblotting against ApoE with conventional and non-denaturing SDS-PAGE (Fig. 7-2). Deglycosylation was also performed on HEK293 ApoE proteins to assay the glycosylation state of three variants (BioLabs, Cat# P6044S). Download Table 1-1, XML file (1.3MB, xml)
Ultracentrifugation and deglycosylation analyses of HEK293 ApoE2, ApoE3, and ApoE4 fail to detect differences in physical state. A-B, ApoE2, ApoE3, and ApoE4 harvested from the medium of transfected HEK293 cells are pelleted by similarly high ultracentrifugation forces, suggesting that they are components of similarly sized particles and not large aggregates. ApoE2, ApoE3, and ApoE4 as well as control solutions were subjected to ultracentrifugation at the indicated g-forces for 4 hours, and the resulting supernatants and pellets were analyzed by quantitative immunoblotting using fluorescent secondary antibodies. A, representative immunoblot; B, summary graph of soluble ApoE protein. C, Glycosylation state is not different among three ApoE variants. Control and HEK293 ApoE solutions were treated without or with deglycosylase to remove all potential N-linked and common O-linked glycans and then subjected to SDS-PAGE separation and anti-ApoE, as shown in left panel. Right panel, the summary graph of the band shift distance for three variants caused by deglycosylation. The shift distance was calculated by measuring the difference in electrophoresis distance (from the well to the band) for individual ApoE variant between the untreated and deglycosylase-treated conditions, and plotted relative to ApoE2 (=1.0). Data are means ± SEM (n≥3 independent experiments), with no statistical significance among three ApoE variants by one-way ANOVA with Tukey’s multiple comparisons. Download Figure 2-1, EPS file (2.2MB, eps)
Representative immunoblot for dataset B in the independent analyses of the reproducibility of ApoE-induced neuronal signaling shown in Fig. 2. Representative immunoblots from dataset B, performed by one of two independent experimenter notated as A and B. For summary graphs and experimental conditions, see Figure 1. In blinding experimenters to the nature of the reagents as much as possible, experiments were performed such that recombinant ApoE proteins, as well as a control preparation of supernatant from GFP-transfected cells, were harvested from independently transfected FreeStyle HEK 293 cells and diluted to the final concentration in separate preparations by experimenters A and B. These two sets of solutions were then passed to a third researcher, who randomly coded the samples and distributed them back to experimenter A and B. Each experimenter grew separate cultures and began treatment with the randomly coded ApoE solutions at D10 for 48 hours. After ApoE treatment, cells were harvested and were then subjected to immunoblot (Fig. 1A,B; Fig. 1-3) or qRT-PCR analyses (Fig. 1C) to probe for expression of the indicated proteins and genes. Following the completion of all data analysis, the sample identities were decoded and compared. This parallel, blinded testing was repeated three times. Labeling of the immunoblot depicted here and in Figure 1 shows sample identity following de-coding of the data. Download Figure 2-2, EPS file (10.4MB, eps)
ApoE stimulates synaptogenesis without affecting neuronal dendritic morphology also at later stages of cultured human neurons (A,B), and ApoE3-induced increases in synaptic protein mRNA are dose- and time-dependent (C). A, ApoE’s synaptogenic effect was examined at a later culture time (D23-25) corresponding to the time point of the electrophysiological recordings in Figure 5 (left, representative images of human neurons cultured on MEFs, treated with ApoE from D10 and fixed at D23-25 for immunostaining to label dendrites by MAP2 fluorescence signals and to label synapses by synapsin; right, summary graphs of synapse density, calculated by synapsin puncta number over the length of dendrite, synapse size and synaptic synapsin-staining intensity). B, ApoE does not change neurite morphology even after prolonged culture, as assayed by confocal imaging (left, representative images of human neurons cultured on MEFs, prepared as described in A but stained for Tuj1 and MAP2; right, summary graph of the length ratio of Tuj1- and MAP2-positive processes). Data are means ± SEM (n≥3 independent experiments); statistical significance (*, p<0.05; **, p<0.01; ***, p<0.001) was evaluated with two-way (A) or one-way ANOVA (B,C) with Tukey’s multiple comparisons. Download Figure 6-1, EPS file (975.1KB, eps)
ApoE3-induced increases in synaptic protein mRNA are dose- and time-dependent. A, Measurements of the ApoE3-concentration-dependence of the induction of synaptic protein mRNA expression (left) and of the time course of ApoE3-induced synaptic protein mRNA expression (right; at 10 μg/ml ApoE3). Human neurons were cultured on MEFs and treated with ApoE3 at days D10 to D12 after neuronal induction for the dose-response curve, or at the indicated times before D12 for the time course. All qRT-PCR assays were performed at D12 and detected only human transcripts; MAP2 was used as an internal control that relates the synaptic protein mRNA levels to those of an internal neuronal marker to correct for the increasing degree of neuronal differentiation during the course of the experiment. mRNA levels were normalized to the untreated control or the 0 h time point. Data are means ± SEM (n≥3 independent experiments); statistical significance (***, p<0.001) was evaluated with two-way ANOVA with Tukey’s multiple comparisons. Download Figure 7-1, EPS file (15.7MB, eps)
Comparative analysis of ApoE2, ApoE3, and ApoE4 produced in E. coli and in transfected HEK293 cells using denaturing SDS-PAGE (A) and blue-native SDS-PAGE (B) A, SDS-PAGE analysis of recombinant ApoE2, ApoE3, and ApoE4 proteins produced in transfected HEK293 cells and in bacteria (E. coli). Top, Coomassie Blue staining; middle, immunoblotting for ApoE; bottom, silver staining. Bovine serum albumin (BSA) was analyzed on the same gel at different concentrations as a protein standard to calculate ApoE concentrations. B, Analysis of ApoE2, ApoE3 and ApoE4 proteins produced in bacteria (E coli) and HEK293 cells by non-denaturing electrophoresis followed by immunoblotting for ApoE. This blue native polyacrylamide gel electrophoresis (BN PAGE) technique provides a near-neutral operating pH and detergent compatibility for molecular weight estimations. No isoform-specific difference was observed in both bacterial and HEK293 ApoEs, but the apparent size of ApoE particles was dramatically different, suggesting a different physical state. Download Figure 7-2, EPS file (4MB, eps)
ApoE2, ApoE3, and ApoE4 stimulate synaptic gene transcription with the rank-potency order of ApoE4>ApoE3>ApoE2 also observed in human neurons derived from two different iPS cell lines (A,B), and other factors secreted by glia in addition to ApoE also stimulate synaptic gene transcription (C). A-B, ApoE2, ApoE3 and ApoE4 differentially increase mRNA levels of synaptic genes in human neurons that were derived from two different iPSC lines (A, SKC; B, EB)(Sebastiano et al., 2011; Sebastiano et al., 2014) and cultured on MEFs. Experiments were carried out as described in Fig. 7. C, Screening 24 secreted proteins that are abundantly produced by cultured mouse glia reveals three factors (ApoE, IGF2, and IGFBP2) that increased transcription of synaptic genes in human neurons cultured on MEFs. Various factors were produced as human proteins in HEK293 cells (names reflect gene symbols; vectors and procedures are as described in previously in (Huang et al., 2017)) and added to human neurons on MEFs at D10 and incubated for 48 hours, before the harvest at D12 for qRT-PCR on indicated synaptic marker genes. Data are means ± SEM (n≥3 independent experiments); statistical significance (***, p<0.001) was evaluated with two-way ANOVA with Tukey’s multiple comparisons. Download Figure 7-3, EPS file (1.3MB, eps)