

Abstract
Emerging infectious diseases rarely affect all members of a population equally and determining how individuals’ susceptibility to infection is related to other components of their fitness is critical to understanding disease impacts at a population level and for predicting evolutionary trajectories. We introduce a novel state-space model framework to investigate survival and fecundity of Tasmanian devils (Sarcophilus harrisii) affected by a transmissible cancer, devil facial tumour disease. We show that those devils that become host to tumours have otherwise greater fitness, with higher survival and fecundity rates prior to disease-induced death than non-host individuals that do not become infected, although high tumour loads lead to high mortality. Our finding that individuals with the greatest reproductive value are those most affected by the cancer demonstrates the need to quantify both survival and fecundity in context of disease progression for understanding the impact of disease on wildlife populations.
Keywords: Bayesian capture–recapture, disease burden, disease progression, disease risk, fecundity, individual fitness, pathogenesis, transmissible cancer, tumour growth
INTRODUCTION
Infectious diseases rarely affect all individuals in a population equally (Grenfell et al. 2001; Lloyd-Smith et al. 2005). In many cases, it is the weakest, least fit, members of a population that are most impacted by pathogens. Low-ranking individuals or those in overcrowded aggregations have been reported to exhibit lower immune function and higher disease risk owing to a range of factors that can influence survival and fecundity (Sapolsky 2004). Conversely, dominant individuals that typically engage in mating and reproduction more frequently than subordinates may trade-off energetic investment in reproduction at the expense of immune competence, ultimately increasing their disease risk (Sheldon & Verhulst 1996; Lee 2006; Sepil et al. 2013). In either case, higher infection risk is frequently reported in association with stress and immune suppression, implying that the infection of relatively weakened individuals is common place in disease spread and persistence (Beldomenico & Begon 2010).
Predicting the effects of infectious diseases on populations remains challenging due to the intricate interplay of demo-graphic and epidemiological dynamics (Merler & Ajelli 2010; Peel et al. 2014). High disease-induced mortality, for example, does not necessarily imply decline in population growth if increased fecundity can compensate for the loss at the population level (Wells et al. 2015), and/or if surviving individuals benefit from increased survival or reproductive opportunities due to decreased competition (Gaillard et al. 2000; Coulson et al. 2004). Hence, the consequences of disease outbreaks at the population-level ultimately depend on individual fitness outcomes, that is, the relative reproductive potential of individuals that become host to the disease and non-host individuals, i.e. those individuals never affected by the disease. If, for example, a disease mainly affects individuals that are unlikely to contribute to recruitment (e.g. post-reproductive individuals), even a highly lethal disease would have little effect on long-term population growth (see Fig. 1). If, however, the disease impacts those individuals most likely to contribute to recruitment then disease effects on population growth may be more substantial.
Figure 1.

Illustration of possible synergistic effects of host survival and fecundity on long-term population growth in context of disease onset and progression such as increasing tumour load on Tasmanian devils. Horizontal thick lines indicate individual devil survival over time, small devils reproduction and red dots infestation with tumours. Devils may not reproduce because of their physical condition or social status independent of the disease (a) or, because of a highly fatal disease with rapid progression and death (b), promoting population decline. However, host individuals can contribute to the reproductive pool and population growth if they are diseased late in life (c) or if slow disease progression allows reproduction of diseased host individuals (d). Healthy non-host individuals may reproduce several times in their life (e). The outcome of these strongly coupled demographic and epidemiological interactions can only be understood if analysed in a consistent framework.
Here, we examine the fitness consequences of devil facial tumour disease (DFTD) for Tasmanian devils (Sarcophilus harrisii) using 10 years of mark–recapture data. DFTD is a recently emerged infectious disease caused by a clonal cancer, transmitted by direct transfer of live cancer cells when devils bite each other (Hawkins et al. 2006; Pearse & Swift 2006; Jones et al. 2008; Hamede et al. 2013). DFTD is mostly fatal, with large ulcerating tumours leading to metabolic starvation, overgrown oral cavities, or organ failure resulting from metastasis. High contact rates among individuals, often resulting in aggressive interactions including biting, and frequency-dependent disease transmission have been expected to reduce devil populations to very low levels (Lachish et al. 2007; Hamede et al. 2009; McCallum et al. 2009). In contrast, precocial reproduction of devils when the cancer reduces population density and hence intraspecific competition has been suggested as an adaptive host mechanism (Jones et al. 2008; Lachish et al. 2009). However, the extent to which individuals that become host to the cancer exhibit different fitness compared to non-host individuals that never become infected, and the timing and extent of reproduction in relation to individual disease status has not been examined so far. To explore fitness in the context of individual and population-level disease progression, we developed a novel state-space model framework that integrates individual-based survival and fecundity in the context of disease progression and epidemiological dynamics over time.
METHODS
Study system and field data
We analysed mark–recapture data from individually marked Tasmanian devils collected between July 2006 and November 2015 from a population in western Tasmania (West Pencil Pine, 41°31 S, 145°46 E) (Hamede et al. 2015). Devils were captured at 3-month intervals (93 ± SD = 18 days between capture sessions). The timing of capture sessions coincided with key reproductive stages during the annual cycle and were categorised into four seasons: (1) February/March (mating season), (2) May (small pouch young), (3) July/August (large pouch young) and (4) November (females are in late lactation with young in den). We further categorised capture sessions into three 3- to 4-year time periods: (1) 2006–2008, (2) 2009–2011 and (3) 2012–2015. As a compromise between exploring temporal variation and model complexity, we chose these arbitrary intervals rather than fitting a continuous time function. Shifts in tumour strain frequency (Hamede et al. 2015) and host genes related to immune response (Epstein et al. 2016) could cause different DFTD effects on survival rates, but the exact timing of relevant events remains unknown. We classified the reproductive status of females based on pouch appearance (Hesterman et al. 2008) into six categories: (1) immature, (2) oestrous, (3) postovulatory, (4) pouch young presence, (5) lactating and (6) regressing teats. The number of pouch young was counted if present. The size of each DFTD tumour detected was measured with callipers to the nearest 1–5 mm in three dimensions (depth measurements of tumours inside the skin were least accurate) and the per-capita tumour load (tumour volume to the nearest cm3) was calculated. Hamede et al. (2015) provides further descriptions of field methods. See Supplementary Information for sample sizes.
Hierarchical model of individual fitness and disease progression
Survival
We used a Bayesian hierarchical mark–recapture model, in which we integrated an incremental growth model of tumour load to project unknown disease states for all time steps when diseased individuals were likely to be alive but tumour load was not known. We use ‘tumour load’, the total volume of all tumours on an individual at a particular time, rather than modelling each individual tumour separately because some tumours merged together over time and not all tumours were distinguishable. We assume that tumour growth is governed by an underlying ergodic and irreversible Markov process (once diseased, individuals remain diseased until death and tumour load is assumed to continuously increase; the rare events where shrinking tumours have been observed are modelled by the Gamma process as described below). Our model resembles a continuous time Markov chain model for discrete state variables, and we projected all data on a continuous time scale (the first day of the study set to one) to express the time of all events such as individual age, lifetime and the onset of tumour growth as Euclidean temporal distances.
We used the term ‘host’ for all individuals that were known to harbour tumours at any stage during their lifetime and the term ‘non-host’ for individuals never observed with tumours during their lifetime. Host individuals were classified as ‘diseased’ if tumour was present and as ‘non-diseased’ prior to the onset of tumour growth.
For each individual devil i, we noted the encounter at time t (the total number of trapping sessions being T) as a binary vector Yi of length T with y(i, t) = 1 if the individual is encountered and y(i, t) = 0 otherwise. The capture records y(i, t) are assumed to be random observations of the true presence–absence z(i, t) of individual i at time t based on capture probability p(i, t) with
| (1) |
The incompletely known individual states z(i, t) were estimated based on the survival probability Φ(i, t) conditioned that individuals were alive at the previous time step t−1 such that:
| (2) |
The exponential scaling factor δ(t) accounts for unequal time intervals between capture sessions and was calculated as the ratio of the time interval between capture sessions to the average interval (93 days). The binary Boolean indicators Iborn(i, t) and Idied(i, t) indicate whether individuals are born or have died at time step t (i.e. Iborn(i, t) = 1 if already born and 0 otherwise, Idied(i, t) = 1 if already dead and 0 other-wise), derived from the Markov chains of individual states. For most individuals the year of birth was known and uncertainty of the exact birth date fell into a 20-day window around the 1st April; for the few individuals with unknown birthdates (8 of 518), uncertainty in birthdates was assumed to cover the time window of 6 years before first capture according to assumed maximum devil lifespan. For analysis, we drew individual birthdates Π(i) as random variables from a uniform distribution across individual uncertainty intervals; given Π(i) and z(i, t), for any time the individual age can be calculated given the underlying Markov process.
We modelled survival probability Φ(i, t) based on logit-link functions as
| (3) |
Here, µΦ is the intercept, which we allowed to vary among different age classes and time periods. We considered individual age as a categorical variable agecat(i, t) with six levels: (1) 1–365 days, (2) 1–2 years, (3) 2–3 years, (4) 3–4 years, (4) 4–5 years and (5) > 5 years. The coefficient estimate βsex captures variation in survival probability due to devil’s sex. The coefficient βhost allows for variation in survival of mature host vs. non-host individuals ≥ 425 days old; we chose this threshold as this is the earliest age when individuals are expected to engage in reproduction and biting behaviour relevant for disease transmission (Jones et al. 2008). The coefficient βtumour captures variation in survival according to individual tumour load category ωcat(i, t) based on categorising tumour load ω(i, t) (see below) into four different levels: (1) 0.0001–50 cm3, (2) > 50–100 cm3, (3) > 100–200 cm3 and (4) > 200 cm3. XT is a matrix of time steps (t = 1, …, T) of fourth orthogonal polynomial order (for modelling non-linear relationships), and BT is a vector of coefficient estimates for the polynomial model of the time covariate.
Capture probability p(i, t) was modelled with a logit-link functions as
| (4) |
allowing the intercept to vary over season s, depending on whether individuals were diseased or not with DFTD at time t [as given by the Boolean indicator Iinfect(i, t)], and as a polynomial function of time t of fourth order with coefficients GT.
Reproduction
We estimated the reproductive state of female f at time t as ηRepro(f, t), which was unknown when individuals were not captured and pouch appearance could not be classified (note that the double-index notation i[ f ] is used to match individuals i from the overall model framework to female f). Transition probabilities between the different reproductive states r can be summarised into an R × R matrix (R = 6 for the six different reproductive stages) with marginal sums of one. We accounted for a directional transition between reproductive stages, i.e. the probability to be in any reproductive stage is conditioned on the previous states such that individuals once oestrous cannot become immature again but individuals can repeatedly reproduce once matured. We modelled reproductive states for each individual and time step based on the matrix of transition probabilities Ψ(rcurrent, rfuture, s, j); Ψ was allowed to vary among seasons s and for host vs. non-host individuals as indexed by j and was conditional on the individuals’ previous reproductive state (using the sum to unity constraint of the multinomial distribution):
| (5) |
We used indicator variables to distinguish transition probabilities when individuals are alive (z(i[ f ], t) = 1) from those prior to individual birth (z(i[ f ], t) = 0, Idied(i[ f ], t) = 0) to enforce the constraint that unborn individuals (Iborn(i[ f ], t) = 0) are in the immature state ( is a vector of length R with the first value set to 1 and all others to 0).
For each year y a female was alive (z(i[ f ], t) = 1), we calculated individual litter size l( f, y) as the number of pouch young. Random state values of l( f, y) were estimated based on the expected population-level probability p(l, j) of the different litter sizes (with l ε L indexing 1–4 young and ) and conditional that an individual is expected to reproduce. We estimated π(l, j) separately for host vs. non-host individuals as indexed by j. The random variable l( f, y) allowed us also to summarise the expected yearly population-level number of young. As part of preliminary analysis, we also allowed Ψ(rcurrent, rfuture, s, j) and π(l, j) to vary for diseased vs. non-diseased host individuals (i.e. the index j included an additional category conditioned on infection status); as results were similar we ignored this aspect in the final model to increase computational efficiency.
Tumour incremental growth and projection
We fitted an incremental growth model to tumour load measurements m(i, t) based on a logistic growth model which has been found to provide accurate fit to the growth of individual tumours (R.H. unpublished manuscript), and a Gamma process to account for random variation in each incremental growth step independent of the population-level mean growth (Russo et al. 2009; Eaton & Link 2011). For this, we assumed field measures of tumour load m(i, t) to be random draws from the underlying growth process over the time intervals t1 and t2 between consecutive measurements such that
| (6) |
Here, ω(i, t1) is the tumour load at time step t1, ι(i, t2)dt (t2) is the product of the daily increment ι(i, t2) and the length of the time interval dt between t1 and t2, and εω is random Gaussian noise. The increment ι(i, t2) = (ω(i, t2) – ω (i, t1))/dt(t2) is assumed to be a Gamma random variable ι(i, t2) ~ Gamma(P(i, t2), λ) with shape parameter P(i, t2) and scale parameter λ > 0. The shape parameter P(i, t2) is based on the expected mean daily tumour growth according to the underlying logistic growth with
| (7) |
and
| (8) |
where Mmax is the asymptotic tumour load and α is the scale parameter of the logistic curve.
Parameter estimates from the incremental growth model (λ, α, Mmax) enabled forward and backward projection of individual disease burden, which is a Markov process governed by the disease burden ω(i, t−1) at the previous time step and the probability density function over all possible increment values given the growth model (eqn 6).
We used backward projection to estimate the date tumour load was at an assumed minimum mass of ωmin = 0.0001, which we assumed to correspond to an arbitrary initial volume at the onset of tumour growth (note that we cannot further account for the true underlying biological process of latent and incubation period and the emergence of first lesions associated with tumour growth from the given data). We then projected individual tumour loads ωP(i, tP) according to eqns 6–8. Note that the superscript ‘P’ is used to indicate projected values rather than likelihood-based estimates from the data. We were not able to account for individual heterogeneity in growth parameters (λ, α, Mmax) due to a lack of more detailed data; to realistically project individual disease burdens despite this shortcoming, we constrained logistic growth of individual tumours such that any projected value ωP(i, tP) was smaller than any previous data-derived estimate of disease burden and not larger than any future, data-driven estimate, i.e. ω (i, t < tP) ≤ ωP(i, tP) ≥ ω (i, t > tP).
Force of infection
The individual disease state d(i, t) of whether individual i is diseased at time t is another partially known binary state variable, which is known for all times individuals were captured and for projected tumour loads but unknown after the last capture for non-diseased individuals. We modelled d(i, t) based on the infection probability Γ(i, t), that is, the probability that uninfected individual become infected, conditional they are alive.
Γ(i, t) was modelled with a logit-link function as
| (9) |
Equivalent to the model for Φ(i, t), we modelled Γ(i, t) with variation over age classes, sex and time and used the scaling factor δ(t) to take unequal time intervals into account; see Supplementary Information.
The model was fitted in a Bayesian framework with Markov Chain Monte Carlo (MCMC) sampling and the Gibbs Sampler in OpenBUGS 3.2.2 (Lunn et al. 2009). Parameter estimates were calculated as posterior modes and 95% highest posterior density credible intervals (CI) from 5000 MCMC samples. Details of model fit and the model code are presented as Supplementary Information.
We calculated the force of infection FoI(t), that is, the rate at which susceptible individuals acquire DFTD at each time t, as the population average from the infection probability Γ(i, t).
We used the various state and indicator variables described above to calculate summary statistics at the individual (i.e. lifespan, the time until death after the onset of tumour growth or lifetime reproductive output of females) and population level (i.e. disease prevalence, proportion of individuals in different age classes in each capture session).
We explored trends and seasonal effects of transmission rates (derived from prevalence estimated from all individuals and, alternatively, mature individuals only) with linear regression models in R (R Development Core Team 2016), running models for each set of MCMC samples to obtain posterior distribution of coefficient estimates.
RESULTS
Strikingly, we found that the overall fitness of host individuals was significantly higher in terms of both survival and reproduction than those of non-host individuals (devils never hosting tumours during their lifetime). The average survival rates of mature (≥ 425 days old) non-diseased host individuals were estimated to be 0.7–4 times higher than those of mature non-host individuals (odds ratio of 4.7–4.9 and CIs 3.3–9.0 for βhost for the time periods 2006–2008 and 2009–2011; odds ratio of 1.7 and CI 1.4–4.9 for the time period 2012–2015; temporal differences are only tendencies but not significant because of overlapping credible intervals; Fig. 2). Increased tumour loads of diseased host individuals did indeed lead to decreased survival rates, reducing survival of individuals with tumour burdens > 100 cm3 to only 9–20% of that of non-diseased host individuals with similar effects over time (Fig. 2; βtumour, odds ratios of 0.09–0.12, CIs: 0.07–0.21). Nevertheless, devils with tumours in the smallest size class had higher survival rates than those that never became infected. A larger proportion of host individuals had lifespans between 3–4 years compared to non-host individuals, with 56% (CI: 53–59%) of hosts surviving to this age compared to only 38% (CI: 34–40%) of non-hosts (Fig. 3), most having died or dispersed as young before they could get infected.
Figure 2.
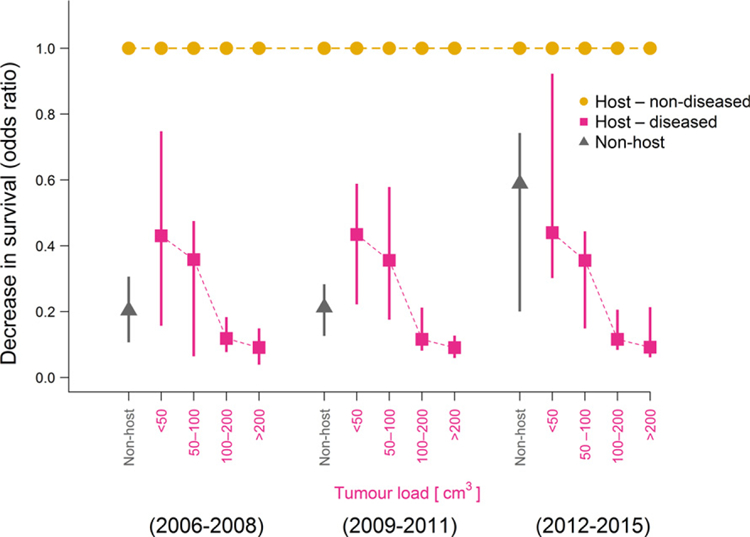
Estimated decrease in survival rates for mature non-host individuals (i.e. those that never become infected; grey triangles) and host individuals with certain tumour loads (red squares) compared to non-diseased host individuals (i.e. prospective host individuals prior to the onset of tumour growth). Triangles and squares are posterior modes of the odds ratios of the survival rates compared to those of non-diseased host individuals (baseline value at 1, shown in orange), vertical bars are 95% credible intervals.
Figure 3.
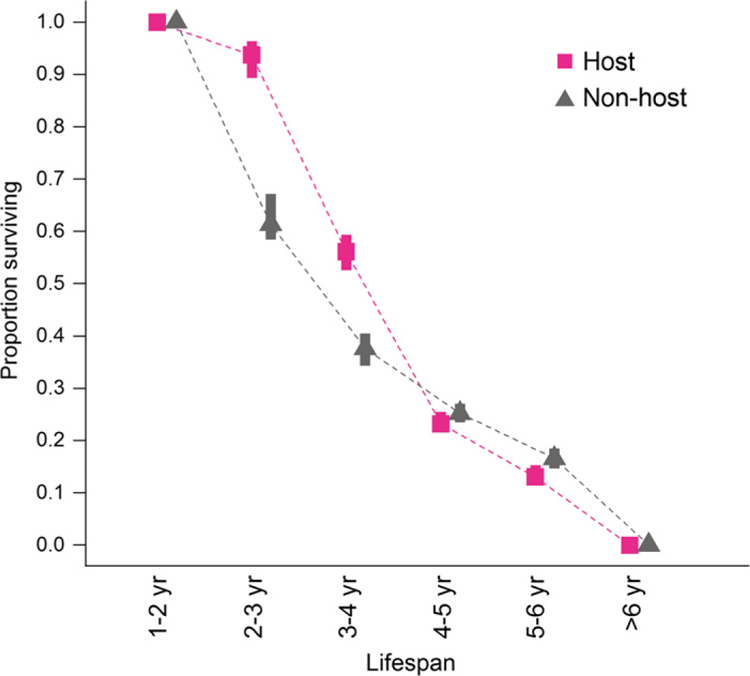
Proportion of Tasmanian devil individuals with different lifespan estimates based on their classifications into host (harbour tumours at any stage during their lifetime) and non-host (no tumours) individuals. Symbols represent the posterior mode estimates of the proportion of individuals in each class of expected lifespans (1–2, 2–3, 3–4, 4–5, 5–6, > 6 years). Vertical bars represent 95% credible intervals based on the uncertainty in individual lifespan estimates from the state-space model.
Mature female host individuals reproduced on average 1.3 times (CI: 1.2–1.4) in their lifetime, whereas mature non-host females reproduced on average only 0.7 times (CI: 0.6–0.9). Moreover, host individuals tended to have larger litter sizes with a 63% (CI: 62–64%) chance of a litter sizes of four young opposed to only 47% (CI: 46–48%) chance for non-host individuals, which more often had litter sizes of two or three young only.
According to our incremental growth model, the average half-life time of tumours (i.e. the progression of individual tumour loads towards half the size of the asymptotic tumour load Mmax) was 148 days (CI: 114–181 days); Mmax was estimated as 202 cm3 (CI: 198–223 cm3) and the scale parameter of the logistic growth curve as α = 0.03 (CI: 0.028–0.043, Fig. S1). The scale parameter of the Gamma process of incremental growth was λ = 0.8 (CI: 0.6–1.4), suggesting that growth of tumour loads was skewed towards relatively small incremental growth, and only occasionally, relatively large increments. Tracking the individual time until death of host individuals after the onset of tumour growth (i.e. a modelled time point prior to the time of first observation), we found that only 11% (CI: 7–15%) of individuals died within 90 days after the back-projected onset of tumour growth; at least 21% (CI: 13–29%) of host individuals were likely to survive > 2 years with tumours (Fig. S2).
Population-level disease prevalence increased from the beginning until mid-term of the study (2006–2012), but we found no consistent trend in disease prevalence in the last time period (2013–2015) (Fig. 4). Disease prevalence and the proportion of non-host individuals did not vary across seasons but exhibited some long-term trends. The proportion of non-host individuals decreased considerably during the first years of the study (2006–2011) and subsequently increased from 2011 to 2014 (Fig. 4).
Figure 4.

Changes in the proportion of individuals with different health status for devil facial tumour disease over 10 years. Disease prevalence, that is, the proportion of individuals that are hosts and are diseased are plotted with pink circles/bars. Individuals without tumours are denoted as ‘host – non-diseased’ (orange circles/bars) if they were expected to acquire tumours later in their life and as ‘non-host’ (grey triangles/bars) if they never hosted tumours. Symbols are posterior mode estimates, and bars present 95% credible intervals. For each time step, the proportions of individuals in the three different states sum to one.
Force of infection was highest in 2012 (posterior mode of 67%, CI 51–80%). Despite considerable uncertainty in these estimates as shown by large CIs (Fig. 5), we found a significant decrease in the force of infection after 2012 as shown by the odds ratio of the temporal effect (Fig. S7). At population level, the number of newly diseased individuals in different capture sessions was positively correlated with the number of diseased individuals in previous capture sessions (Spearmans’ r = 0.51, CI: 0.34–0.65) and disease prevalence in previous capture sessions (Spearmans’ r = 0.45, CI: 0.31–0.57). Changes in disease prevalence over time were positively correlated with the number of diseased individuals (Spearmans’ r = 0.92, CI: 0.88–0.94) and the estimated total mass of all tumour loads at population level (Spearmans’ r = 0.72, CI: 0.28–0.89). The force of infection divided by prevalence would estimate the transmission rate β if transmission was frequency dependent (as previously suggested; McCallum et al. 2009). There was inconclusive evidence that transmission rate estimates from August 2012 (peak in force of infection) until November 2015 declined by approximately 24% (CI: –13 to –29%) during the 3 years of the study with prevalence calculated for all individuals regardless of age, but this trend was not confirmed with prevalence estimates for mature individuals only. There were no clear seasonal differences in transmission rate estimates, which included much uncertainty according to large credible intervals (Fig. S8).
Figure 5.

Estimated force of infection (rate at which susceptible individuals become diseased per year) for devil facial tumour disease over 10 years. Black dots are posterior mode estimates, and bars present 95% credible intervals from sampling possible disease progression at individual level.
Declines in the finite population size estimates over time (Fig. S3) coincided with declines in the population-level total number of pouch young per year after 2010 (Fig. S4). Survival rates differed markedly for different age classes and over time (Fig. S5), as did the demographic structure of the populations (Fig. S6). Capture rates varied over season with 33–35% (both CIs: 31–39%) capture probability in February/March and November and 27% (both CIs: 24–30%) capture probability in May and July/August. Capture probability dropped slightly during the course of the study (Fig. S7) and more than doubled for diseased host individuals (γinfect) compared to uninfected individuals.
Overall model fit was reasonably good with a Bayesian P-value of 0.52. Model fit of the incremental growth models was less precise with a Bayesian P-value of 0.30; we attribute the lack of better fit largely to the limited data on disease progression and also large individual heterogeneity in tumour growth, for which we could not account in this study with a lack of more detailed field data. Results on the variation in survival rates for different age classes, population size estimates and the age composition in each capture session are presented as Supplementary Information.
DISCUSSION
We found an unexpected and novel result – devil facial tumour disease (DFTD), a transmissible and devastating cancer, selectively impacts the otherwise most fit individuals in the population. Despite being affected by disease, host individuals (those that eventually become infected) had both higher survival and greater reproductive output than non-host individuals, in terms of both more annual breeding attempts and larger litter sizes. This challenges the conventional wisdom that infectious disease differentially affects less fit individuals in a population (de Castro & Bolker 2005). We emphasise that the novel insights in terms of individual fitness in relation to disease status gained in this study were only possible by analysing disease progression, survival and reproduction in an integrative model framework that accounts for the most likely disease states of individuals throughout their lifetimes.
Our finding that devils with relatively high fitness are also those most likely to become infected suggests that it is the socially dominant animals that are at highest risk of infection and death from DFTD. These are the individuals that are likely to survive longer than the less fit mature individuals in the population, which most likely die from other causes before they are able to reproduce. This result is consistent with the finding of a previous study showing the most frequent biters (i.e., socially dominant animals) are most likely to become infected (Hamede et al. 2013). If infection selectively removes dominant individuals from a population, there may be important long-term consequences for the social structure and viability of the population, as well as for disease transmission. For example, culling of European badgers (Meles meles) disrupts social organisation and leads to increased movement of badgers and disease transmission to cattle (Donnelly et al. 2006). Likewise, selective animal removal through harvesting can change the demographic structure and population growth of many species (Milner et al. 2007).
Our results also have implications for understanding how disease-induced evolution in Tasmanian devil populations may be occurring. In particular, our model framework provides the opportunity to explore whether devils may evolve resistance to infection or rather tolerance to the impacts of infection, both being important host adaptation strategies (Råberg et al. 2009). Several lines of evidence provide robust support for the assertion that infected devils are under strong selective pressure. First, high mortality of adults from DFTD leads to rapid population declines (McCallum et al. 2009). A recent study provided evidence of substantial changes in the frequency of genes associated with immune function in devil populations that have been infected for as little as 8 years (Epstein et al. 2016). Third, a small number of individuals are able to mount an immune response and, in some, tumours regress (Pye et al. 2016). In this context, the implications of our novel results, that is that the otherwise most fit devils become infected, are intriguing. If adult devils with high fitness are those become infected, the potential for selection for resistant animals would be limited. However, our results also demonstrate a recent decline in the force of infection and transmission rate. This leads to the question of whether devils in this population may have developed resistance to infection. The initial increase in the force of infection from 2006 to 2012 (see Fig. 5) is to be expected as the tumour increased in prevalence within the host population after disease emergence. It may also be a result of the replacement of a tetraploid tumour karyotype with a diploid karyotype which took effect from 2011 onwards (Hamede et al. 2015). The recent decline in the force of infection and transmission rate warrants further investigation, and could be due to a number of factors. There is evidence of selection at West Pencil Pine in chromosomal regions containing genes related to immune and cancer function (Epstein et al. 2016), possibly indicating evolution of resistance, as well as evidence of immune responses to DFTD resulting in tumour regressions and recovery after infection (Pye et al. 2016). Individual heterogeneity in devil behaviour such as physical interaction and biting is another possibility. The recent decline in the force of infection could have resulted from a reduction in the number of socially dominant devils from the population, if these are responsible for most transmission events. Group living and mating strategies can shape social contact networks among individuals that mediate parasite exchange (Liljeros et al. 2003; Cauchemez et al. 2011) and disease risk (Altizer et al. 2003; Drewe 2010; Kappeler et al. 2015). The possibility of synergistic effects between co-evolutionary dynamics of host–pathogen interactions and disease-driven changes in social structure over time necessitates caution when interpreting changes in disease transmission in context of host defence mechanisms. For future studies, it will be desirable to refine estimates of disease transmission rates that are currently blurred by large uncertainty and cannot account for individual heterogeneity in social status and behaviour due to the lack of data.
Disease tolerance might manifest in a number of ways, but one would be longer survival when carrying a tumour burden of a given size. Figure 2 shows no evidence that this has occurred, with the relationship between tumour size and mortality rate being indistinguishable in the three time periods. A confounding factor, however, is the change in the dominant tumour karyotype in the population from tetraploid in the early stages of the epidemic to diploid karyotype during the course of the study (Hamede et al. 2015). Unfortunately, distinguishing diploid from tetraploid karyotypes was not possible for most of the individuals analysed herein, and this information was therefore not included in our study. More-over, recent molecular evidence of a protective immune response of devils against DFTD recorded from our study site (Pye et al. 2016) suggests that immune responses might impact disease tolerance through regression of tumours. Reconciling these facts with our findings of how population-level disease dynamics may change over time requires further analysis of how individual-level heterogeneity in host and tumour genotypes and the behaviour of adult ‘hosts’ and ‘non-hosts’ drive variation in demographic rates and infection risk and how this translates into population-level pattern in disease dynamics.
Our estimates of the time until death following infection are longer than the 6 months previously reported (McCallum et al. 2009; Ujvari et al. 2016). These previous estimates were for time until death after first detection of tumours. Estimation of the incubation period and its frequency distribution is a challenging problem for DFTD (McCallum et al. 2009). Our new, model-based estimation of survival time includes back-projection of growth to a very small initial tumour volume. This may not estimate the actual incubation period fully, but is a substantial improvement over previous approaches, which have relied on anecdotal information on the appearance of tumours in captive animals which had not been exposed to infection for extended periods (Pyecroft et al. 2007).
To determine whether and how disease-induced evolution within the devil population and reciprocal evolution within the tumour population is occurring requires further data and modelling. The modelling and analytical framework we have presented in this study provides a template for performing such analysis, which should be also applicable to a wide range of other emerging infectious diseases in natural populations.
Supplementary Material
ACKNOWLEDGEMENTS
This study was supported by grants from the National Science Foundation (DEB 1316549), the Australian Research Council Discovery (DP110102656) and Linkage (LP0561120) Schemes and the Save the Tasmanian Devil Appeal of the University of Tasmania. MEJ was supported on an Australian Research Council Future Fellowship (FT100100250). RKH is supported by an Australian Research Council DECRA Fellowship (DE170101116). We thank Forico Pty Ltd. for land access and Discovery Holiday Parks – Cradle Mountain for providing logistic support and accommodation during fieldwork. We thank Sarah Peck for veterinary support, and Bobby Hua and Barbara Schönfeld for technical support. We are thankful to everyone involved in volunteer assistance during fieldwork. We thank David Sargent from Queensland College of Art, Griffith University, for preparing the illustration and Alison Peel for discussion. Field work procedures were approved by the University of Tasmania’s Animal Ethics Committee (A0008588, A10296, A0011696, A0013326). We thank two anonymous reviewers and the editor for valuable contributions to the final draft.
Footnotes
DATA ACCESSIBILITY STATEMENT
Data supporting the results are available from the Dryad Digital Repository: http://dx.doi.org/10.5061/dryad.72n14.
SUPPORTING INFORMATION
Additional Supporting Information may be found online in the supporting information tab for this article.
REFERENCES
- Altizer S, Nunn CL, Thrall PH, Gittleman JL, Antonovics J, Cunningham AA et al. (2003). Social organization and parasite risk in mammals: integrating theory and empirical studies. Annu. Rev. Ecol. Syst, 34, 517–547. [Google Scholar]
- Beldomenico PM & Begon M (2010). Disease spread, susceptibility and infection intensity: vicious circles?. Trends Ecol. Evol, 25, 21–27. [DOI] [PubMed] [Google Scholar]
- de Castro F & Bolker B (2005). Mechanisms of disease-induced extinction. Ecol. Lett, 8, 117–126. [Google Scholar]
- Cauchemez S, Bhattarai A, Marchbanks TL, Fagan RP, Ostroff S, Ferguson NM et al. (2011). Role of social networks in shaping disease transmission during a community outbreak of 2009 H1N1 pandemic influenza. Proc. Natl Acad. Sci. USA, 108, 2825–2830. [DOI] [PMC free article] [PubMed] [Google Scholar]
- Coulson T, Guinness F, Pemberton J & Clutton-Brock T (2004). The demographic consequences of releasing a population of red deer from culling. Ecology, 85, 411–422. [Google Scholar]
- Donnelly CA, Woodroffe R, Cox DR, Bourne FJ, Cheeseman CL, Clifton-Hadley RS et al. (2006). Positive and negative effects of widespread badger culling on tuberculosis in cattle. Nature, 439, 843–846. [DOI] [PubMed] [Google Scholar]
- Drewe JA (2010). Who infects whom? Social networks and tuberculosis transmission in wild meerkats. Proc. Biol. Sci, 277, 633–642. [DOI] [PMC free article] [PubMed] [Google Scholar]
- Eaton MJ & Link WA (2011). Estimating age from recapture data: integrating incremental growth measures with ancillary data to infer age-at-length. Ecol. Appl, 21, 2487–2497. [DOI] [PubMed] [Google Scholar]
- Epstein B, Jones M, Hamede R, Hendricks S, McCallum H, Murchison EP et al. (2016). Rapid evolutionary response to a transmissible cancer in Tasmanian devils. Nat. Commun, 7, 12684. [DOI] [PMC free article] [PubMed] [Google Scholar]
- Gaillard J-M, Festa-Bianchet M, Yoccoz NG, Loison A & Toigo C (2000). Temporal variation in fitness components and population dynamics of large herbivores. Annu. Rev. Ecol. Syst, 31, 367–393. [Google Scholar]
- Grenfell BT, Bjørnstad ON & Kappey J (2001). Travelling waves and spatial hierarchies in measles epidemics. Nature, 414, 716–723. [DOI] [PubMed] [Google Scholar]
- Hamede RK, Bashford J, McCallum H & Jones M (2009). Contact networks in a wild Tasmanian devil (Sarcophilus harrisii) population: using social network analysis to reveal seasonal variability in social behaviour and its implications for transmission of devil facial tumour disease. Ecol. Lett, 12, 1147–1157. [DOI] [PubMed] [Google Scholar]
- Hamede RK, McCallum H & Jones M (2013). Biting injuries and transmission of Tasmanian devil facial tumour disease. J. Anim. Ecol, 82, 182–190. [DOI] [PubMed] [Google Scholar]
- Hamede RK, Pearse A-M, Swift K, Barmuta LA, Murchison EP & Jones ME (2015). Transmissible cancer in Tasmanian devils: localized lineage replacement and host population response. Proc. Biol. Sci, 282, 20151468. [DOI] [PMC free article] [PubMed] [Google Scholar]
- Hawkins CE, Baars C, Hesterman H, Hocking GJ, Jones ME, Lazenby B et al. (2006). Emerging disease and population decline of an island endemic, the Tasmanian devil Sarcophilus harrisii. Biol. Conserv, 131, 307–324. [Google Scholar]
- Hesterman H, Jones SM & Schwarzenberger F (2008). Pouch appearance is a reliable indicator of the reproductive status in the Tasmanian devil and the spotted-tailed quoll. J. Zool, 275, 130–138. [Google Scholar]
- Jones ME, Cockburn A, Hamede R, Hawkins C, Hesterman H, Lachish S et al. (2008). Life-history change in disease-ravaged Tasmanian devil populations. Proc. Natl Acad. Sci. USA, 105, 10023–10027. [DOI] [PMC free article] [PubMed] [Google Scholar]
- Kappeler PM, Cremer S & Nunn CL (2015). Sociality and health: impacts of sociality on disease susceptibility and transmission in animal and human societies. Philos. Trans. R. Soc. Lond. B Biol. Sci, 370, 20140116. [DOI] [PMC free article] [PubMed] [Google Scholar]
- Lachish S, Jones M & McCallum H (2007). The impact of disease on the survival and population growth rate of the Tasmanian devil. J. Anim. Ecol, 76, 926–936. [DOI] [PubMed] [Google Scholar]
- Lachish S, McCallum H & Jones M (2009). Demography, disease and the devil: life-history changes in a disease-affected population of Tasmanian devils (Sarcophilus harrisii). J. Anim. Ecol, 78, 427–436. [DOI] [PubMed] [Google Scholar]
- Lee KA (2006). Linking immune defenses and life history at the levels of the individual and the species. Integr. Comp. Biol, 46, 1000–1015. [DOI] [PubMed] [Google Scholar]
- Liljeros F, Edling CR & Amaral LAN (2003). Sexual networks: implications for the transmission of sexually transmitted infections. Microbes Infect, 5, 189–196. [DOI] [PubMed] [Google Scholar]
- Lloyd-Smith JO, Cross PC, Briggs CJ, Daugherty M, Getz WM, Latto J et al. (2005). Should we expect population thresholds for wildlife disease?. Trends Ecol. Evol, 20, 511–519. [DOI] [PubMed] [Google Scholar]
- Lunn D, Spiegelhalter D, Thomas A & Best N (2009). The BUGS project: evolution, critique and future directions. Stat. Med, 28, 3049–3067. [DOI] [PubMed] [Google Scholar]
- McCallum H, Jones M, Hawkins C, Hamede R, Lachish S, Sinn DL et al. (2009). Transmission dynamics of Tasmanian devil facial tumor disease may lead to disease-induced extinction. Ecology, 90, 3379–3392. [DOI] [PubMed] [Google Scholar]
- Merler S & Ajelli M (2010). The role of population heterogeneity and human mobility in the spread of pandemic influenza. Proc. Biol. Sci, 277, 557–565. [DOI] [PMC free article] [PubMed] [Google Scholar]
- Milner JM, Nilsen EB & Andreassen HP (2007). Demographic side effects of selective hunting in ungulates and carnivores. Conserv. Biol, 21, 36–47. [DOI] [PubMed] [Google Scholar]
- Pearse AM & Swift K (2006). Allograft theory: transmission of devil facial-tumour disease. Nature, 439, 549. [DOI] [PubMed] [Google Scholar]
- Peel AJ, Pulliam JRC, Luis AD, Plowright RK, O’Shea TJ, Hayman DTS et al. (2014). The effect of seasonal birth pulses on pathogen persistence in wild mammal populations. Proc. Biol. Sci, 281, 20132962. [DOI] [PMC free article] [PubMed] [Google Scholar]
- Pye R, Hamede R, Siddle HV, Caldwell A, Knowles GW, Swift K et al. (2016). Demonstration of immune responses against devil facial tumour disease in wild Tasmanian devils. Biol. Lett, 12, 20160553 10.1098/rsbl.2016.0553. [DOI] [PMC free article] [PubMed] [Google Scholar]
- Pyecroft SB, Pearse AM, Loh R, Swift K, Belov K, Fox N et al. (2007). Towards a case definition for devil facial tumour disease: what is it? EcoHealth, 4, 346–351. [Google Scholar]
- R Development Core Team (2016). R: A language and environment for statistical computing R Foundation for Statistical Computing, Vienna, Austria. [Google Scholar]
- Råberg L, Graham AL & Read AF (2009). Decomposing health: tolerance and resistance to parasites in animals. Philos. Trans. R. Soc. Lond. B Biol. Sci, 364, 37–49. [DOI] [PMC free article] [PubMed] [Google Scholar]
- Russo T, Baldi P, Parisi A, Magnifico G, Mariani S & Cataudella S (2009). Lévy processes and stochastic von Bertalanffy models of growth, with application to fish population analysis. J. Theor. Biol, 258, 521–529. [DOI] [PubMed] [Google Scholar]
- Sapolsky RM (2004). Social status and health in humans and other animals. Annu. Rev. Anthropol, 33, 393–418. [Google Scholar]
- Sepil I, Lachish S, Hinks AE & Sheldon BC (2013). MHC supertypes confer both qualitative and quantitative resistance to avian malaria infections in a wild bird population. Proc. Biol. Sci, 280, 20130134. [DOI] [PMC free article] [PubMed] [Google Scholar]
- Sheldon BC & Verhulst S (1996). Ecological immunology: costly parasite defences and trade-offs in evolutionary ecology. Trends Ecol. Evol, 11, 317–321. [DOI] [PubMed] [Google Scholar]
- Ujvari B, Papenfuss AT & Belov K (2016). Transmissible cancers in an evolutionary context. Inside Cell, 1, 17–26. [DOI] [PubMed] [Google Scholar]
- Wells K, Brook BW, Lacy RC, Mutze GJ, Peacock DE, Sinclair RG et al. (2015). Timing and severity of immunizing diseases in rabbits is controlled by seasonal matching of host and pathogen dynamics. J. R. Soc. Interface, 12, 20141184. [DOI] [PMC free article] [PubMed] [Google Scholar]
Associated Data
This section collects any data citations, data availability statements, or supplementary materials included in this article.