

SUMMARY
Interleukin-1 (IL-1) signaling is important for multiple potentially pathogenic processes in the central nervous system (CNS), but the cell-type-specific roles of IL-1 signaling are unclear. We used a genetic knockin reporter system in mice to track and reciprocally delete or express IL-1 receptor 1 (IL-1R1) in specific cell types, including endothelial cells, ventricular cells, peripheral myeloid cells, microglia, astrocytes, and neurons. We found that endothelial IL-1R1 was necessary and sufficient for mediating sickness behavior and drove leukocyte recruitment to the CNS and impaired neurogenesis, whereas ventricular IL-1R1 was critical for monocyte recruitment to the CNS. Although microglia did not express IL-1R1, IL-1 stimulation of endothelial cells led to the induction of IL-1 in microglia. Together, these findings describe the structure and functions of the brain’s IL-1R1-expressing system and lay a foundation for the dissection and identification of IL-1R1 signaling pathways in the pathogenesis of CNS diseases.
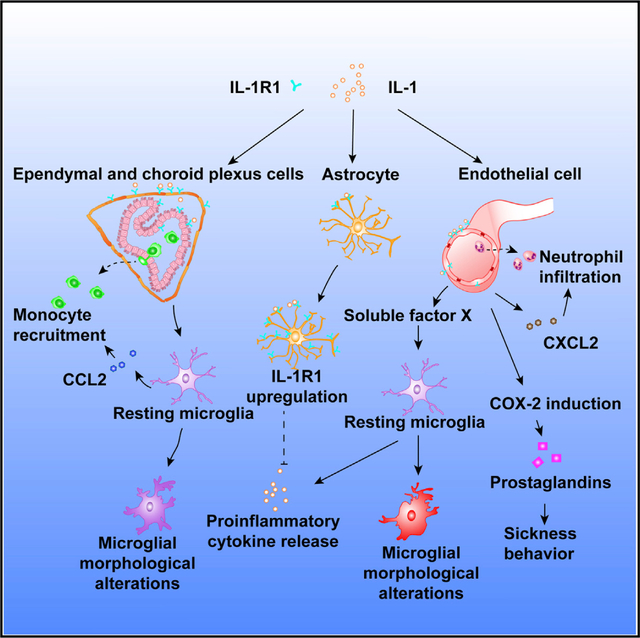
Graphical Abstract
In Brief
Liu et al. employ a genetic knockin reporter system in mice to track and reciprocally delete and/or express IL-1 receptor 1 (IL-1R1) in specific CNS cell types. They define cell-type-specific roles for IL-1 signaling, including an essential role for endothelial IL-1R1 in mediating sickness behavior, and provide a foundation for the dissection of IL-1R1 signaling pathways in the pathogenesis of CNS disease.
INTRODUCTION
Interkeukin-1 (IL-1) plays critical roles in a large array of physiological and pathological processes in the central nervous system (CNS), and these range from sleep regulation (Krueger, 2008) and memory consolidation (Depino et al., 2004) to neurodegeneration (Shaftel et al., 2008) and aberrant mood control (Felger and Lotrich, 2013). The type I IL-1 receptor (IL-1R1) mediates signaling initiated by IL-1. As we have previously reported, IL-1R1 expression is driven by multiple cell-type-specific promoters, allowing cell-type-specific control of IL-1R1 expression (Chen et al., 2009). In addition, it has been reported that neuronal IL-1R1 (nIL-1R1) can employ a different co-receptor for signal transduction and thus allow IL-1 activation of neurons without triggering the transcription of inflammatory cytokines by the canonical NF-kB pathway (Huang et al., 2011). Thus, the diverse actions of IL-1 in the brain are most likely mediated by different cell-type-specific IL-1R1 signaling pathways. Understanding specialized cell-type-specific IL-1R1 functions could lead to the separation of pathogenic IL-1 activities from its physiological counterparts and isolation of the neurotoxic signaling pathways from neuroprotective ones. Thus far, endothelial cells (Liu et al., 2015), astrocytes (Moynagh, 2005), neurons (Hutson et al., 2017), resident microglia (Basu et al., 2004), and perivascular macrophages (Serrats et al., 2010) have been reported to respond to central IL-1. However, in vivo visualization of IL-1R1 in these cells remains challenging because of its low expression. Furthermore, isolating cell-type-specific IL-1R1-mediated effects has been hampered by the lack of sophisticated genetic models capable of precise cell-type-specific restriction of endogenous IL-1R1 expression. Consequently, it is unclear and often disputed which cell types express IL-1R1 and whether cell-type-specific IL-1R1s have specialized roles. For instance, IL-1R1 expression was reported in hippocampal CA1 neurons in one study (French et al., 1999), but not in others (Cunningham and De Souza, 1993; Konsman et al., 2004). Similarly, microglial IL-1R1 was reported in several in vitro studies (Monif et al., 2016; Sato et al., 2012) but was not confirmed in other studies (Krasnow et al., 2017; Parker et al., 2002). Both systemic and central IL-1 can induce sickness behaviors, including fever, reduced locomotion, hypophagia, and reduced social interaction (Bluthé et al., 2000). Endothelial IL-1R1 (eIL-1R1) located at the blood brain barrier (BBB) has been proposed to mediate these responses in some studies (Quan, 2008). In contrast, other studies have suggested that peripheral IL-1 needs to be transported across the BBB to cause sickness behaviors (Banks et al., 1995). Signaling of eIL-1R1 has also been postulated to cause leukocyte infiltration during autoimmune encephalitis (Paré et al., 2017) and prolonged anxiety in response to psychological stress (McKim et al., 2018). Again, the role of IL-1R1 inside the BBB in mediating these phenomena has been questioned. In neuroinflammation-induced depression, the role of IL-1 has been divergently ascribed to its effects on endocrine functions of the hypothalamus (Dantzer et al., 2008), antineurogenic effects on hippocampal neurons (Koo and Duman, 2008), and serotonergic neurotransmission (Zhu et al., 2010). Direct actions of IL-1 on neurons of the paraventricular nucleus of the hypothalamus, neural stem cells in the dentate gyrus, and neurons of the dorsal raphe have been hypothesized in these mechanisms but not definitively demonstrated. Therefore, understanding the roles of cell-type-specific IL-1R1 has been a bottle neck in the field of CNS IL-1 biology.
Previously, we generated a knockin model that allows visualization of IL-1R1-expressing cells in vivo and selective expression of IL-1R1 in pre-targeted cell type(s) (Liu et al., 2015). In the current study, we visualized the cell-type-specific IL-1R1-expressing system in the brain and determined the roles of individual cell-type-specific IL-1R1 in mediating the best-known IL-1-induced CNS effects. The results reveal a structural and functional cytoarchitecture from which diverse CNS IL-1-mediated effects can be analyzed.
RESULTS
The Compartmentalization of IL-1R1 Expression in the Brain
In a previously developed IL-1R1 reporter mouse line, the Il1r1GR/GR mice, IL-1R1-mRNA-expressing cells are tracked by co-expressed knockin tdTomato, and IL-1R1 is tagged by hem-agglutinin (HA) epitope at its C-terminal intracellular domain (Liu et al., 2015). Here, we amplified the tdTomato signal by using a sensitive anti-RFP antibody. A low-magnification Tile Scan image of RFP labeling at the hippocampus, where the strongest neuronal IL-1R1 expression is identified, revealed multiple cell types expressing IL-1R1 mRNA (Figure 1A), including endothelial cells, dentate gyrus (DG) neurons, ependymal cells, astrocytes, and choroid plexus cells (Figure 1, insets a–e). No RFP labeling in the wild-type (WT) sections was found (Figure S1C). To confirm that IL-1R1 mRNA expression in WT mice exhibits expression patterns similar to those from the reporter mice, we performed in situ hybridization histochemistry (ISHH) of IL-1R1 mRNA in WT mice. Results confirmed that IL-1R1 mRNA expression patterns were the same as the RFP-labeling patterns in the Il1r1GR/GR mice (Figures 1D and S1A). ISHH labeling of IL-1R1 mRNA in the IL-1R1-deficient (Il1r1r/r) mice was absent (Figure S1B). In addition, immunohistochemistry (IHC) labeling of the HA-tagged IL-1R1 by tyramide signal amplification showed HA labeling in endothelial cells, DG neurons, and choroid plexus (Figure 1F).
Figure 1. The Compartmentalization of IL-1R1 Expression in the Brain.

(A) A representative Tile Scan image of RFP labeling of hippocampal sections from Il1r1GR/GR mice. Labeling of cell-type-specific IL-1R1s is marked with dashed squares according to their morphological features and shown at higher magnification in insets a–e. Scale bar, 200 μm.
(B) PCR detection of restored amplicon in hippocampal DNA from cell-type-specific IL-1R1 lines.
(C) Hippocampal IL-1R1 mRNA expression in cell-type-specific IL-1R1 lines. n = 5 mice per genotype from three independent experiments. Error bars represent the mean ± SEM. Means with an asterisk (*) are significantly different from the corresponding control group (p < 0.05) according to F-protected post hoc analysis.
(D) Results of ISHH labeling of IL-1R1 of WT DG sections. The black arrow points to dendritic fields. The yellow arrow points to granule-cell-layer neurons. The arrowhead points to mossy fibers. The dashed square marks the area shown at higher magnification on the bottom right. Scale bar, 50 μm.
(E) A representative image of RFP labeling of Vglut2-Cre-Il1r1r/r DG sections. The white arrow points to dendritic fields. The yellow arrow points to granule-cell-layer neurons. The arrowhead points to hilar mossy fibers. Scale bar, 50 μm.
(F) A representative Tile Scan image of HA labeling of Il1r1GR/GR hippocampal sections. The dashed square marks the area shown at higher magnification on the bottom right. Scale bar, 200 μm.
(G) A representative Tile Scan image of RFP labeling of Camk2a-Cre-Il1r1r/r hippocampal sections. The dashed square marks the area shown at higher magnification on the bottom right. Scale bar, 100 μm.
(H) A representative Tile Scan image of RFP labeling of Tie2-Cre-Il1r1r/r hippocampal sections. The dashed lines indicate the outline of the hippocampus proper and choroid plexus. The dashed square marks the area shown at higher magnification on the bottom right. Abbreviation are as follows: CA, Cornu Ammonis; GCL, granule cell layer; ML, molecular layer; H, hilus; and CP, choroid plexus. Scale bar, 200 μm.
(I) Representative images of RFP and CD31 labeling in Tie2-Cre-Il1r1r/r brain sections. The dashed square marks the area shown at higher magnification on the bottom right. Scale bar, 100 μm.
(J) A representative Tile Scan image of RFP labeling of Gfap-Cre-Il1r1r/r hippocampal sections 24 h after an ICV IL-1β injection. The dotted lines indicate the outline of the hippocampus proper. The dashed square marks the area shown at higher magnification on the bottom right. Scale bar, 200 μm.
(K) Representative images of RFP and GFAP labeling of Gfap-Cre-Il1r1r/r brain sections. The dashed square marks the area shown at higher magnification on the bottom right. Scale bar, 50 μm. See also Figure S1.
To study the cell-type-specific IL-1R1-mediated functions, we restricted the protein’s expression by using our Il1r1r/r mouse model. In the Il1r1r/r mice, normal IL-1R1 expression is blocked by an intronic insertion of a loxP flanked disruption sequence, which can be later deleted by Cre recombinase. Cre-mediated excision of the disruption sequence results in restored IL-1R1 expression under its endogenous promoters (Liu et al., 2015). Here, cell-type-specific Cre promotors were used to restrict endogenous IL-1R1 expression to endothelial cells (Tie2-Cre), peripheral myeloid cells (Lysm-Cre), microglia (Cx3cr1-Cre), neurons (Camk2a-Cre and Vglut2-Cre), and astrocytes (Gfap-Cre). Specificity of recombination was confirmed for each Cre line (Figures S1D–S1H). For simplicity, cell-type-specific IL-1R1 mouse lines are hereafter designated as Tie2-Cre-Il1r1r/r, Lysm-Cre-Il1r1r/r, Cx3cr1-Cre-Il1r1r/r, Camk2a-Cre-Il1r1r/r, Vglut2-Cre-Il1r1r/r, and Gfap-Cre-Il1r1r/r. All lines produced efficient cell-type-specific recombination, except that Gfap-Cre also caused sparse recombination in some sub-granular neurons at the DG (Figure S1I). Lysm-Cre expression has been reported on some neurons (Orthgiess et al., 2016). However, we did not detect any neuronal IL-1R1 expression in the brain of Lysm-Cre-Il1r1r/r mice (data not shown). PCR results show that the restored amplicon was detected in all the cell-type-specific IL-1R1 lines (Figure 1B). Compared with that in the brains of WT mice, IL-1R1 mRNA expression was reduced but detectable in the brains of Tie2-Cre-Il1r1r/r, Gfap-Cre-Il1r1r/r, Vglut2-Cre-Il1r1r/r, and Camk2a-Cre-Il1r1r/r mice (Figure 1C). IL-1R1 mRNA was not detected in Il1r1r/r, Lysm-Cre-Il1r1r/r, orCx3cr1-Cre-Il1r1r/r mice. Consistent with our design, IL-1R1 mRNA expression was strictly confined to CD31+ endothelial cells in Tie2-Cre-Il1r1r/r mice (Figures 1H and 1I), GFAP-labeled astrocytes in Gfap-Cre-Il1r1r/r mice (Figures 1J and 1K), and DG neurons in Vglut2-Cre-Il1r1r/r and Camk2a-Cre-Il1r1r/r mice (Figures 1E, 1G, and S1J). The astrocytic IL-1R1 (aIL-1R1) mRNA expression was maintained at low levels under physiological conditions but was significantly induced after central IL-1β administration (Figures 1J, S1K, and S1L). In contrast, microglial IL-1R1 was undetectable in both conditions (Figures 1C and S1M). Because Tie2Cre has been reported to be expressed by pericytes, IHC of a pericyte marker, PDGFRβ, was conducted in the Tie2-Cre-Il1r1r/r mice. The results show that RFP co-localizes with CD31-labeled endothelial cells but not PDGFRβ-labeled pericytes (Figure S1N).
tdTomato-RFP was found in the neuronal cell bodies of the DG granule layer and in the corresponding dendritic fields and mossy fibers (Figures 1A and 1E). To clarify whether IL-1R1 mRNA is a dendritic mRNA in DG neurons, we conducted ISHH. The results show that IL-1R1 mRNA is restricted to the soma of DG neurons (Figure 1D). Collectively, brain IL-1R1 is primarily expressed by endothelial, ependymal, and choroid plexus cells and by DG neurons, is scarcely expressed by astrocytes, and is not expressed by microglia or brain macrophages under physiological conditions.
eIL-1R1 Mediates Sickness via Endothelial COX-2 Expression
An important function of central IL-1 is to trigger a state of sickness (Ching et al., 2007). Here, we assessed the contribution of cell-type-specific IL-1R1 expression to sickness behaviors. Intracerebroventricular (ICV) IL-1β injections reduced locomotion in WT and Tie2-Cre-Il1r1r/r mice, but not in other lines (Figure 2A), suggesting that eIL-1R1 is sufficient to mediate IL-1β-induced sickness. To assess the necessity of eIL-1R1, we crossed Tie2-Cre mice with Il1r1f/f mice that had exons III and IV flanked by loxP sequences (Figure 2B and Robson et al., 2016) to generate Tie2-Cre-Il1r1f/f mice that lacked eIL-1R1. eIL-1R1 expression was present in WT mice (Figure 2C, left) and absent in Tie2-Cre-Il1r1f/f mice (Figure 2C, middle), but choroidal IL-1R1 was maintained in the Tie2-Cre-Il1r1f/f mice (Figure 2C, right). ICV IL-1β failed to induce decreased locomotor activity in the Tie2-Cre-Il1r1f/f mice (Figure 2A). Additionally, reduced social interaction and food consumption, two other sickness behaviors, were found in the Tie2-Cre-Il1r1r/r, but not in the Tie2-Cre-Il1r1f/f, mice (Figures 1E and 1F). Previous literature suggests that central IL-1-induced COX-2 expression in endothelial cells mediates sickness behavior (Ching et al., 2007). ICV IL-1β induced endothelial COX-2 expression only in WT and Tie2-Cre-Il1r1r/r mice (Figures 2G and 2H). Notably, Tie2-Cre-Il1r1r/r COX-2f/f mice that expressed eIL-1R1 and lacked endothelial COX-2 (eCOX-2) exhibited neither sickness behavior (Figure 2D) nor COX-2 induction (Figure 2H). In addition, Tie2-Cre-Il1r1r/r COX-2f/f mice displayed increased inflammatory gene expression in response to central IL-1 (Figure S1O), suggesting that prostaglandins (downstream product of COX-2) have a modest but significant role in suppressing cytokines. Collectively, these findings indicate that sickness behavior is mediated by eIL-1R1-dependent induction of eCOX-2 expression.
Figure 2. eIL-1R1 Mediates Sickness via Endothelial COX-2 Expression.

(A) Total distance traveled by mice of different genotypes in the open field 3 h after ICV sham or IL-1β injections. n = 7–12 mice per genotype from 23 independent experiments.
(B) Diagram of the genetic construct of the IL-1R1 flox mutant allele. Exons III and IV of Il1r1 is flanked by the loxP sequence. Cre-recombinase-mediated excision of exons III and IV results in the deletion of IL-1R1.
(C) IHC labeling of IL-1R1 on endothelial cells and choroid plexus of brain sections from the WT and Tie2-Cre-Il1r1f/f mice. Scale bar, 100 μm.
(D) Total distance traveled by Tie2-Cre-Il1r1r/r and Tie2-Cre-Il1r1r/rCOX2f/f mice in the open field 3 h after ICV sham or IL-1β injections. n = 7 mice per genotype from seven independent experiments.
(E) Time spent in the interaction zone by mice of different genotypes in the social exploration test 3 h after ICV IL-1β injections. n = 10–12 mice per genotype from 12 independent experiments.
(F) Food consumption by mice of different genotypes 6 h after ICV IL-1β injections. n = 10–12 mice per genotype from 12 independent experiments.
(G) IHC labeling of eCOX-2 4 h after ICV IL-1β injections. The dashed square marks the area shown at higher magnification on the bottom right. Scale bar, 100 μm.
(H) Quantification of COX-2+ blood vessels in brain sections from mice of different genotypes after ICV sham or IL-1β injections. n = 4 mice per genotype from four independent experiments. ND denotes not detected.
Error bars represent the mean ± SEM. Means with an asterisk (*) are significantly different from the corresponding control group (p < 0.05) according to F-protected post hoc analysis. See also Figure S1.
eIL-1R1 and Myeloid IL-1R1 Mediate Impairment in Neurogenesis
Next, we investigated which cell-type-specific IL-1R1 mediates chronic IL-1-induced antineurogenic effects. To chronically express IL-1β, we constructed a human IL-1β-expressing adenoviral vector, ad-ssIL-1, which drives the release of mature human IL-1β from infected cells. ad-ssIL-1 was injected into one side of the DG in WT, Il1r1r/r, Tie2-Cre-Il1r1r/r, Lysm-Cre-Il1r1r/r, or Vglut2-Cre-Il1r1r/r mice. Six days later, EdU was injected to label proliferating neural progenitor cells (NPCs). The number of EdU+ cells at the DG was lower on the injection side of the hippocampus than on the contralateral side in WT, Tie2-Cre-Il1r1r/r, and Lysm-Cre-Il1r1r/r mice, but not in Il1r1r/r or Vglut2-Cre-Il1r1r/r mice (Figures 3A and 3B). Separately, the number of cells expressing doublecortin (DCX), an early neuronal marker, in the DG was determined. Figure 3C shows representative images of DCX labeling in the DG after ad-ssIL-1 injections. Reduced numbers of DCX+ neurons were found in WT, Tie2-Cre-Il1r1r/r, and Lysm-Cre-Il1r1r/r mice, but not in Il1r1r/r or Vglut2-Cre-Il1r1r/r mice (Figures 3C and 3D). In addition, double labeling of DCX and RFP revealed that IL-1R1-expressing neurons in the DG of Il1r1GR/GR and Camk2a-Cre-Il1r1r/r mice were DCX negative (Figures 3E and 3F). A trend toward a decrease in the numbers of EdU+ cells and DCX+ neurons was found in Vglut2-Cre-Il1r1r/r mice compared with WT mice (Figures 3B and 3D). Altogether, these results indicate that eIL-1R1 and myeloid IL-1R1 rather than nIL-1R1 mediate chronic IL-1-induced reduction of neurogenesis.
Figure 3. eIL-1R1 and Myeloid IL-1R1 Mediate Impairment in Neurogenesis.

(A) Representative images of EdU and DAPI double labeling on the injection and contralateral sides of DG from WT, Il1r1r/r, Tie2-Cre-Il1r1r/r, Vglut2-Cre-Il1r1r/r, and Lysm-Cre-Il1r1r/r mice. Scale bar, 100 μm.
(B) Quantification of average differences of EdU+ cell numbers between the injection and contralateral sides (injection side − contralateral side). n = 8 mice per genotype from two independent experiments.
(C) Representative images of DCX labeling on the injection and contralateral sides of DG from WT, Il1r1r/r, Tie2-Cre-Il1r1r/r, Vglut2-Cre-Il1r1r/r and Lysm-Cre-Il1r1r/r mice. Scale bar, 100 μm.
(D) Quantification of average differences of DCX+ cell numbers between the injection and contralateral side (injection side – contralateral side). n = 6 mice per genotype from two independent experiments.
(E and F) IHC labeling of RFP and DCX of DG sections from Il1r1GR/GR (E) and Camk2a-Cre-Il1r1r/r (F) mice. The dashed square marks the area shown at higher magnification on the bottom right. Scale bar, 100 μm.
Error bars represent the mean ± SEM. Means with an asterisk (*) are significantly different from the corresponding control group (p < 0.05) according to F-protected post hoc analysis. See also Figure S2.
eIL-1R1 and nIL-1R1 Cause Distinct Neuroinflammatory Responses
Previous in vitro studies have reported different sensitivities of brain cell types to IL-1 (Liu and Quan, 2018). Because IL-1R1 mRNA is highly expressed in endothelial cells and neurons, we investigated IL-1R1-mediated neuroinflammatory responses to different amounts of chronic IL-1 in these cell types. Injections of ad-ssIL-1 at the antineurogenic dose (Figure 3) increased microglial Iba1 expression and induced leukocyte infiltration in WT mice (Figures S2A–S2C). In contrast, no inflammation was found in Il1r1r/r mice. ad-ssIL-1 also increased Iba1+ expression in Tie2-Cre-Il1r1r/r mice, which showed fewer recruited CD45+ leukocytes than the WT mice. In Vglut2-Cre-Il1r1r/r mice, Iba1+ expression was significantly increased without evidence of CD45+ leukocyte trafficking, indicating a distinct nIL-1R1-mediated response. Next, we reduced the dose of ad-ssIL-1 2,000-fold. At this dose, very few CD45+ leukocytes were found at the injection site in the mice of all four genotypes (Figure S2D). In addition, Iba1+ expression was increased significantly in WT and Vglut2-Cre-Il1r1r/r mice, but not in Il1r1r/r or Tie2-Cre-Il1r1r/r mice (Figure S2E). Thus, nIL-1R1-mediated microglial activation can be induced by lower amounts of IL-1.
Microglial Activation and Leukocyte Recruitment Occur Independently in Response to IL-1
Central IL-1-induced leukocyte infiltration precedes microglial morphological changes (Proescholdt et al., 2002). To test the role of leukocyte infiltration in the development of microglial morphological changes, we administered vinblastine or cyclophosphamide to deplete peripheral leukocytes. Both drugs effectively ablated circulating leukocytes (Figures S4A and S4B). Consequently, only a few CD45+ cells were found in the brain parenchyma after ICV IL-1β injections (Figures S3A and S3E). The reduction of infiltrating leukocytes, however, did not affect central IL-1-induced microglial morphological changes. After ICV IL-1β injections, similar to those in the saline-treated mice, microglia in the vinblastine- or cyclophosphamide-treated mice exhibited deramified morphology (Figure S3A) with increased Iba1 expression (Figure S3B), reduced process length (Figure S3C), and increased cell soma size (Figure S3D) in the hippocampus, medial orbital cortex (Figure S4D), and septal area (Figure S4E). These morphological alterations were not due to vinblastine or cyclophosphamide treatment alone because microglial morphology in sham-injected control mice was unaltered by either treatment (Figure S4C). Thus, central IL-1-induced microglial morphological changes are independent of leukocyte recruitment.
Induction of microglial cytokine expression often precedes peripheral immune cell infiltration (Norden et al., 2016). It is possible that IL-1-induced leukocyte trafficking is a consequence of microglial cytokine induction. To test this, we depleted brain microglia with the CSF1R antagonist PLX5622 (PLX). Two weeks of dietary administration of PLX eliminated >90% of microglia (Figures S3F and S3G). Depletion of microglia did not prevent leukocyte infiltration (Figure S3H); in fact, monocyte infiltration was increased by PLX, whereas neutrophil infiltration was maintained (Figures S3G and S3H). Similarly, PLX treatment did not interfere with leukocyte recruitment to the brain after peripheral lipopolysaccharide (LPS) treatment (Figure S4F). Collectively, leukocyte recruitment and microglial morphological alterations are independently induced by central IL-1.
Multiple Cell Types Mediate IL-1-Induced Leukocyte Recruitment via Distinct Chemokines
To determine the cell types that mediate IL-1-induced leukocyte recruitment, we tested nine different genotypes 15 h after ICV IL-1β injections. CD45+ leukocytes were recruited to the brain in WT and Tie2-Cre-Il1r1r/r mice, but not to any other Il1r1r/r genotypes (Figure 4A). Because IL-1R1 is expressed by both endothelial cells and hematopoietic cells in the Tie2-Cre-Il1r1r/r mice, we generated bone marrow chimera (BMIl1r1r/r/→Tie2-Cre-Il1r1r/r) mice in which IL-1R1 is exclusively expressed in the endothelial cells (Figure S5A). ICV IL-1β injections induced robust CD45+ cell trafficking in the BMIl1r1r/r/→Tie2-Cre-Il1r1r/r mice, but not in the BMIl1r1r/r/→Il1r1r/r mice (Figures S5B and S5C). In the Tie2-Cre-Il1r1r/rCOX-2f/f mice, deletion of eCOX-2 did not abrogate IL-1-induced leukocyte recruitment (data not shown). Leukocyte recruitment was also observed in Tie2-Cre-Il1r1f/f mice after IL-1β injection in both septal regions (Figure 4A) and the hippocampus (Figure S5D). Thus, IL-1-induced leukocyte infiltration can occur without eIL-1R1, and it is not mediated by microglial, astrocytic, or neuronal IL-1R1. On the basis of the compartmentalization of IL-1R1 (Figure 1), we hypothesized that IL-1R1 in ependymal and choroid plexus cells at the brain ventricles, which we termed the “ventricular IL-1R1 system” (vIL-1R1), mediated this process.
Figure 4. Multiple Cell Types Mediate IL-1-Induced Leukocyte Recruitment via Distinct Chemokines.

(A) Representative images of CD45 labeling of the septal nuclei from different cell-type-specific IL-1R1 lines. Scale bar, 100 μm.
(B) Representative flow bivariate dot plots of CD11b and CD45 labeling and gating for infiltrating leukocytes. Gated CD11b+CD45hi cells were further analyzed with Ly6C and Ly6G labeling.
(C–E) Cell counts of infiltrating Ly6ChiLy6G−monocytes (C), Ly6CintLy6G+ neutrophils (D), and CD11b−CD45+ lymphocytes (E) relative to microglia in whole brains from WT, Il1r1r/r, Tie2-Cre-Il1r1r/r, and Tie2-Cre-Il1r1f/f mice 15 h after ICV IL-1β injections. n = 5 or 6 mice per genotype from five independent experiments.
(F and G) CCL2 (F) and CXCL2 (G) mRNA expression in brain tissues from WT, Il1r1r/r, Tie2-Cre-Il1r1r/r, and Tie2-Cre-Il1r1f/f mice. n = 5 or 6 mice per genotype from two independent experiments.
(H) Cell counts of infiltrating monocytes and neutrophils relative to microglia in whole brains from WT and CCL2KO mice. n = 5 mice per genotype from two independent experiments.
Error bars represent the mean ± SEM. Means with different letters (a–d) show groups that are significantly different (p < 0.05). Means with an asterisk (*) are significantly different from the corresponding control group (p < 0.05) according to F-protected post hoc analysis. See also Figure S5.
We examined the composition of recruited cells in the Tie2-Cre-Il1r1r/r and Tie2-Cre-Il1r1f/f mice (Figure 4B). Compared with WT mice, Tie2-Cre-Il1r1r/r mice showed significantly dampened recruitment of monocytes (CD11b+CD45highLy6Chigh), but recruitment was unaffected in Tie2-Cre-Il1r1f/f mice (Figure 4C). In contrast, recruitment of neutrophils (CD11b+CD45highLy6G+) was reduced in both lines (Figure 4D). In both Tie2-Cre-Il1r1r/r and Tie2-Cre-Il1r1f/f mice, the amounts of infiltrating lymphocytes (CD11b−CD45high) were similar to those in the WT mice (Figure 4E). Collectively, vIL-1R1 mediates monocyte infiltration, whereas both eIL-1R1 and vIL-1R1 mediate neutrophil infiltration.
We then determined the induction of chemokines in Tie2-Cre-Il1r1r/r and Tie2-Cre-Il1r1f/f mice. Monocyte chemokine CCL2 was induced in Tie2-Cre-Il1r1f/f, but not in Tie2-Cre-Il1r1r/r, mice (Figure 4F), whereas neutrophil chemokine CXCL2 was induced in both lines (Figure 4G). These data indicate that eIL-1R1 partially mediates chemoattraction of neutrophils, whereas vIL-1R1 mediates monocyte chemoattraction. The role of CCL2 in mediating IL-1β-induced monocyte recruitment was further examined with CCL2-deficient mice. Recruitment of monocytes, but not neutrophils, was compromised in these mice after ICV IL-1β injection (Figure 4H). To identify the CCL2-producing cells, we injected IL-1β into CCL2RFPflox mice, in which CCL2 was tagged by RFP. Results revealed IL-1-induced CCL2 expression in GFAP+ astrocytes, Iba1+ microglia, CD206+ perivascular macrophages, and meningeal macrophages, but not CD31+ endothelial cells (Figure S5E). ICV IL-1β significantly increased brain CCL2 mRNA expression in WT mice (>120-fold), but not in microglial or neuronal IL-1R1 lines (Figure S5F). A partial induction of CCL2 mRNA was observed in Gfap-Cre-Il1r1r/r mice (<20-fold) and in WT mice treated with PLX (<80-fold). This suggests that vIL-1R1 is primarily responsible for the induction of CCL2 mRNA and recruitment of monocytes.
eIL-1R1 and vIL-1R1 Recruit Leukocytes via Different Routes
Next, we examined the routes of leukocyte recruitment mediated by eIL-1R1 and vIL-1R1. We selected Tie2-Cre-Il1r1f/f mice for our study of vIL-1R1-mediated leukocyte recruitment. Deletion of eIL-1R1 in Tie2-Cre-Il1r1f/f mice should isolate the effect of vIL-1R1 because IL-1R1 on other non-endothelial cell types failed to trigger significant cell trafficking (Figure 4A). Five hours after ICV IL-1β injection, CD45+ leukocytes were associated with both blood vessels and brain ventricles in the WT mice. In contrast, CD45+ leukocytes were mostly associated with vasculatures in the Tie2-Cre-Il1r1r/r mice, whereas CD45+ leukocytes were found in brain ventricles in the Tie2-Cre-Il1r1f/f mice (Figure 5A). Thus, eIL-1R1 and vIL-1R1 use anatomically distinct routes to recruit leukocytes to the brain. In addition, ICV IL-1β induced cell adhesion molecules (CAMs) ICAM-1 and VCAM-1 on IL-1R1+ vascular cells (Figures S6A and S6B, top) and ventricular cells (Figures S6A and S6B, bottom). The majority of VCAM-expressing cells were IL-1R1 positive, whereas most ICAM-expressing cells were IL-1R1-negative capillaries (Figure S6C). Ventricular CAM induction occurred independently of eIL-1R1. Furthermore, eIL-1R1 was necessary and sufficient for vascular CAM induction (Figures 5B, 5C, S6D, and S6E). Thus, through spatial regulation of CAM expression, eIL-1R1 mediates vascular, but vIL-1R1 mediates ventricular, entry of infiltrating leukocytes.
Figure 5. eIL-1R1 and vIL-1R1 Recruit Leukocytes via Different Routes.

(A) IHC labeling of CD45 and CD31 at brain blood vessels (top) and lateral ventricles (bottom) of sections from the WT, Tie2-Cre-Il1r1r/r, and Tie2-Cre-Il1r1f/f mice 5 h after ICV IL-1β injections. LV denotes the lateral ventricle. The dotted line demarcates the lateral ventricle. The dashed square marks the area shown at higher magnification on the top right. Scale bar, 100 μm.
(B and C) IHC labeling of ICAM (B) and VCAM (C) at vasculature and ventricles of sections from sham-treated WT mice and ICV-IL-1β-injected WT, Tie2-Cre-Il1r1r/r, and Tie2-Cre-Il1r1f/f mice. Images were cropped from Tile Scan images in Figures S6D and S6E, which show that selections for high-magnification images in this figure are unbiased. Scale bar, 100 μm. See Figure S6.
IL-1 Stimulates eIL-1R1 and vIL-1R1 rather Than Microglial IL-1R1 to Induce Microglial Activation
Next, we determined which cell-type-specific IL-1R1 contributes to IL-1-induced microglial activation. Central IL-1 induced microglial morphological alteration in the WT, Tie2-Cre-Il1r1r/r, and Tie2-Cre-Il1r1f/f mice (Figure 6A). Increased Iba1 immunoreactivity was found in WT mice and most IL-1R1-restored genotypes (Figure 6B), whereas increased microglia soma size and decreased process length were found only in WT, Tie2-Cre-Il1r1r/r, and Tie2-Cre-Il1r1f/f mice (Figures 6C and S7A). ICV IL-1β did not cause microglial proliferation (Figure S7B). Deletion of eCOX-2 did not abrogate IL-1-induced microglial morphological changes (data not shown).
Figure 6. IL-1 Stimulates eIL-1R1 and vIL-1R1 Rather Than Microglial IL-1R1 to Induce Microglial Activation.

(A) Representative images of Iba1 labeling of DG sections from cell-type-specific IL-1R1 lines 24 h after ICV IL-1β injections. Insets show enlarged images of representative microglial morphology. Scale bar, 100 μm.
(B and C) Quantification of Iba1+ expression (B) and microglial soma size (C) in DG sections from cell-type-specific IL-1R1 lines 24 h after ICV IL-1β injections. n = 4 or 5 mice per genotype from five independent experiments.
(D–F) qPCR analysis of inflammatory proteins IL-1β (D), TNF-α (E), and IL-6 (F) in hippocampal samples of cell-type-specific IL-1R1 lines and PLX-treated WT mice 3 h after ICV sham or IL-1β injections. n = 4 or 5 mice per genotype from six independent experiments.
(G) Quantification of mean fluorescence intensity (MFI) of CD45 in microglia from WT, Tie2-Cre-Il1r1r/r, and Tie2-Cre-Il1r1f/f mice by flow-cytometric analysis 24 h after ICV IL-1β injections. n = 4 or 5 mice per genotype from four independent experiments.
(H) Representative images of ICAM and Iba1 labeling of sections from ICV-IL-1-injected WT, Tie2-Cre-Il1r1r/r, and Tie2-Cre-Il1r1f/f mice. Insets show enlarged images of representative microglia and endothelial cells. Scale bar, 100 μm.
Error bars represent the mean ± SEM. Means with different letters (a–e) show groups that are significantly different (p < 0.05) according to F-protected post hoc analysis. See also Figure S7.
We then tested the sufficiency of cell-type-specific IL-1R1 to induce cytokine expression. eIL-1R1 expression was sufficient to restore cytokine expression after ICV IL-1β injection. Induction of IL-1β, TNF-α, and IL-6 was restored in Tie2-Cre-Il1r1r/r mice (Figures 6D–6F), and NOS2 induction was partially restored (Figure S7C). Modest inductions of IL-1β and TNF-α were observed in Cx3cr1-Cre-Il1r1r/r and Gfap-Cre-Il1r1r/r mice (Figures 6D and 6E). Robust induction of NOS2 was seen in Gfap-Cre-Il1r1r/r, Vglut2-Cre-Il1r1r/r, and Camk2a-Cre-Il1r1r/r mice (Figure S7C). Microglia depletion with PLX prevented the induction of IL-1β and TNF-α (Figures 6D and 6E), whereas partially preventing the induction of IL-6 (Figure 6F) and NOS2 (Figure S7C). The necessity of cell-type-specific IL-1R1 for cytokine induction was also assessed. eIL-1R1 expression was found necessary for robust induction of IL-1β, TNF-α, NOS2, and IL-6 after ICV IL-1β injection (Figure S7D) because they were abolished in the Tie2-Cre-Il1r1f/f mice. ICV IL-1β induced higher expression of IL-1β, TNF-α, and NOS2 mRNA in Gfap-Cre-Il1r1f/f mice, in which IL-1R1 expression was abolished in astrocytes, than in Il1r1f/f mice. We further investigated the cytokine-inhibitory activity of aIL-1R1 to avoid potential confounding caused by different genetic backgrounds. Astrocyte-targeting AAV2/5Cre was used to restore or delete aIL-1R1 on one side of the striatum (Ortinski et al., 2010). We first injected AAV2/5Cre into Il1r1r/r mice to verify that this method specifically targets aIL-1R1. IHC results showed RFP (IL-1R1) in GFAP-labeled astrocytes (Figure S7E). AAV2/5Cre was then injected into the Il1r1f/f mice to abolish the aIL-1R1 on one side of the striatum. qPCR results showed that ICV IL-1β induced higher IL-6 expression on the aIL-1R1-deficient side of the striatum than on the control side (Figure S7F), confirming that aIL-1R1 modestly inhibits IL-1-induced inflammatory cytokine expression.
Additional cell-surface markers of activated microglia were examined in the Tie2-Cre-Il1r1r/r and Tie2-Cre-Il1r1f/f mice 24 h after ICV IL-1β injections. Microglia in the Tie2-Cre-Il1r1r/r and Tie2-Cre-Il1r1f/f mice upregulated CD45 (Figure 6G) and co-stimulatory molecule CD86 and showed a trend toward an increase in CD11b (Figures S7G and S7H). IHC labeling of ICAM showed an increase in microglial ICAM expression in the WT and Tie2-Cre-Il1r1f/f mice, but not in the Il1r1r/r or Tie2-Cre-Il1r1r/r mice (Figure 6H). Collectively, both eIL-1R1 and vIL-1R1 indirectly mediate central IL-1-induced microglial activation, and eIL-1R1 mediates microglial production of inflammatory mediators.
IL-1-Stimulated Endothelial Cells Activate Microglia via a Soluble Factor
To gain insight into the mechanism of eIL-1R1-mediated microglial cytokine expression, we created an in vitro cell-culture model to reproduce the phenomenon observed in vivo. A murine microglial cell line (BV-2) was co-cultured with a murine brain endothelial cell line (bEnd.3). As they did in vivo, microglial BV-2 cells showed little IL-1R1 expression in comparison with bEnd.3 cells (Figure 7A). The induction of IL-1β mRNA expression in the co-cultured cells was examined after IL-1β stimulation (Figure 7B). Increased IL-1β mRNA expression after IL-1β stimulation was detected only when both bEnd.3 and BV-2 cells were present (Figure 7C). A moderate increase in IL-1β mRNA expression was found in the co-cultured bEnd.3-BV-2 cells without IL-1β stimulation. Next, BV-2 cells were treated with conditioned media from IL-1β-stimulated endothelial cells (Figure 7D). Conditioned media from IL-1β-stimulated endothelial cells increased mRNA expression of IL-1β, IL-6, CCL2, and COX-2 in BV-2 cells (Figure 7E). IL-1β alone had no effect on BV-2 gene expression. To exclude the possibility that BV-2 cell activation is due to a non-specific stimulatory effect of bEnd.3 cells, we tested an IL-1R1-expressing astrocyte cell line, C8D1A cells. Results showed that conditioned media from IL-1β-stimulated C8D1A cells failed to induce IL-1β mRNA expression in the BV-2 cells (Figure 7F). We then tested whether the supernatant from IL-1-stimulated endothelial cells can activate primary microglia from Il1r1r/r mice. Conditioned media from IL-1β-stimulated bEnd.3 cells increased IL-1β mRNA expression in the IL-1R1-deficient microglia (Figure 7G). Therefore, IL-1-stimulated endothelial cells activate microglia via cell-contact-independent signaling.
Figure 7. IL-1-Stimulated Endothelial Cells Activate Microglia via Soluble Factor(s).

(A) IL-1R1 mRNA expression of BV-2 cells and bEnd.3 cells. n = 4 samples per cell type from two independent experiments.
(B) Schematic of experimental design of BV-2 cell and bEnd.3 cell co-culture.
(C) IL-1β mRNA expression of co-cultured cells after IL-1β stimulation. n = 4 samples per group from two independent experiments.
(D) Schematic of experimental design of BV-2 cell culture with bEnd.3-cell-conditioned media.
(E) IL-1β, IL-6, CCL2, and COX-2 mRNA expression of BV-2 cells after stimulation with bEnd.3-cell-conditioned media. n = 4 samples per group from two independent experiments.
(F) IL-1β mRNA expression of BV-2 cells after stimulation with C8D1A-cell-conditioned media. n = 4 samples per group from two independent experiments.
(G) IL-1β mRNA expression of primary microglia after stimulation with bEnd.3-cell-conditioned media. n = 4 samples per group from one independent experiment. Error bars represent the mean ± SEM. Means with an asterisk (*) are significantly different from the corresponding control group (p < 0.05) according to F-protected post hoc analysis.
DISCUSSION
The current study employed a system with several significant advantages to demonstrate the structural and functional cytoarchitecture of the cell-type-specific IL-1R1 system in the CNS. The knockin tdTomato tracer in Il1r1 obviates the need to use ISHH to label IL-1R1 mRNA, readily allowing double labeling of IL-1R1-expressing cells with cell-type-specific markers. In addition, the expression of this tracer is controlled by the selective restoration of IL-1R1 expression by cell-type-specific Cre, adding a validation method to confirm whether IL-1R1 is indeed expressed in the investigated cell type. In the CNS, expression of IL-1R1 in different cell types has been controversial. Several previous ISHH studies have reported IL-1R1 in blood vessels (Cunningham and De Souza, 1993; Yabuuchi et al., 1994). In another study, IL-1R1 mRNA detection in hippocampal neurons was interpreted as non-specific binding of riboprobes (Ericsson et al., 1995). IL-1R1 was also reported in hippocampal CA1 neurons without its simultaneous detection in blood vessels (French et al., 1999), contradicting the majority of the findings in the literature. Only one previous study showed detection of aIL-1R1 in a rat model of epilepsy, but not in the normal brain (Ravizza et al., 2008). Most previous studies have failed to find microglial IL-1R1 in vivo, and very low amounts of IL-1R1 have been detected in microglia in vitro, yet direct stimulation of microglia by IL-1 has been postulated by many studies. In the current study, IL-1R1 mRNA and protein were clearly visualized in three major cell types of the brain: endothelial cells, choroidal cells, and DG neurons. This is the first demonstration of concordant IL-1R1 mRNA and protein labeling of DG neurons. Low IL-1R1 mRNA expression was also visualized in astrocytes. Restoring IL-1R1 expression in brain endothelial, astrocytic, or neuronal cells recapitulated the corresponding cell-type-specific IL-1R1 expression patterns found in mice with global IL-1R1 expression (Il1r1GR/GR), validating these cell-type-specific expression patterns. No microglial IL-1R1 mRNA was found by IHC or qRTPCR in either WT or Cx3cr1-Cre-Il1r1r/r mice, in which IL-1R1 had been restored specifically in microglia. These results therefore clarify the previous controversies and establish the structural basis of cell-type-specific IL-1R1 expression in the CNS.
Sickness behaviors are well-known outcomes of IL-1 signaling in the brain. Several pathways have been proposed to explain how peripheral IL-1 could trigger these effects (Quan, 2008). In the current study, we demonstrated that IL-1 induces sickness behavior comparable to that in WT mice in the eIL-1R1 mice. Therefore, eIL-1R1 is sufficient to cause sickness behaviors. Previous studies have implicated endothelial COX-2 expression in the induction of sickness behavior (Konsman et al., 2002). Here, we demonstrated that sickness behavior is mediated by eCOX-2 through eIL-1R1, suggesting a key role for prostaglandin production at the BBB. In contrast, restoring IL-1R1 on neurons, microglia, or astrocytes failed to restore IL-1-induced sickness behavior. Therefore, IL-1 does not need to act on IL-1R1-expressing cell types inside the brain parenchyma to cause sickness behavior. This conclusion is consistent with previous studies that found that eCOX-2 expression triggers endothelial prostaglandin PGE2 release, which then acts on its receptors on the neurons of the autonomic nervous system to cause sickness behavior (Saper et al., 2012).
Another major neuromodulatory function of IL-1 is the inhibition of adult neurogenesis, which has been linked with the pathogenesis of depression and cognitive impairment (Koo and Duman, 2009). Direct IL-1 action on neural progenitor cells has been proposed as a mechanism for this effect on the basis of in vitro experiments (Koo and Duman, 2008). We found that chronic IL-1 expression in the hippocampus indeed reduced neurogenesis in vivo but via eIL-1R1 and myeloid IL-1R1 rather than nIL-1R1. Moreover, DCX+ NPCs did not express IL-1R1 despite being in close proximity to IL-1R1+ granule neurons. Together, our data suggest that IL-1 acts on eIL-1R1 (possibly through recruited peripheral immune cells) or myeloid IL-1R1 to elicit antineurogenic factors rather than directly suppressing neurogenesis via nIL-1R1. This is consistent with a recent report showing that sustained IL-1 expression impairs neurogenesis independently of IL-1 signaling in nestin+ NPCs (Wu et al., 2013). It remains possible, however, that nIL-1R1 can contribute to chronic IL-1-induced antineurogenic effects under certain conditions, e.g., longer IL-1 stimulation. More importantly, our results reveal a striking difference in the sensitivity to IL-1 in eIL-1R1 versus nIL-1R1 in vivo. Although concentrations of both 250 plaque-forming units (PFU) and 5 × 10⁵ PFU of adssIL-1 induced microglial morphological changes in WT mice, 250 PFU of ad-ssIL-1 induced this change in the nIL-1R1, but not eIL-1R1, mice (Figure S2). Thus, nIL-1R1 might have a lower response threshold to IL-1. Previous studies have shown that a physiological concentration (pM) of IL-1 induces fast activation of the Src pathway and thus leads to cell depolarization and production of nerve growth factor (Davis et al., 2006; Khairova et al., 2009). This concentration of IL-1 can also induce slow-wave sleep and increased synaptic plasticity (Tobler et al., 1984). In contrast, a pathological concentration (nM) of IL-1 induces classical NFκB and MAPK signaling pathways in nonneuronal cells, leading to production of inflammatory mediators (Pinteaux et al., 2009). Thus, it is possible that prolonged expo sure to low concentrations of IL-1 (induced by chronic variable stress, for example) can reduce neurogenesis through nIL-1R1, whereas higher concentrations of IL-1 reduce neurogenesis via eIL-1R1 acutely.
An important discovery in this study is the signaling system of the ependymal and choroid plexus IL-1R1, which we termed vIL-1R1. vIL-1R1 signaling selectively drives monocyte trafficking into the CNS through CCL2. In addition, whereas eIL-1R1 signaling is associated with the expression of adhesion molecules on blood vessels, vIL-1R1 signaling is associated with their induction on the ependymal cells of the ventricular wall. Further, vIL-1R1-recruited leukocytes traveled across the ventricular wall to reach brain parenchyma, whereas those recruited via eIL-1R1, mostly neutrophils, extravasated to the brain through blood vessels. These findings reveal three key insights: (1) eIL-1R1 is sufficient, but not necessary, for central IL-1 induced leukocyte recruitment; (2) leukocyte infiltration can occur through a vasculature-independent pathway; and (3) the compositions of leukocytes recruited by eIL-1R1 and vIL-1R1 are different because of distinct chemokine expressions. Significant proinflammatory cytokines were produced only in the eIL-1R1 mice in which more neutrophils than monocytes had been recruited. Previous literature has shown that amplification of inflammation in the brain is associated with neutrophils recruited into the CNS, whereas neutrophil elimination and tissue repair are associated with the recruited monocytes (Jin et al., 2010; Trahanas et al., 2015). Therefore, it is possible that eIL-1R1-recruited leukocytes are related to the initiation, whereas vIL-1R1-recruited leukocytes are related to the resolution, of the inflammation. Related to affective disorders, aberrant neutrophil recruitment induced by peripheral LPS treatment has been reported to trigger depressive-like behavior, whereas monocyte recruitment induced by repeated social disruption stress causes anxiety (Aguilar-Valles et al., 2014; McKim et al., 2018); both are IL-1R1 dependent. Our results suggest that vIL-1R1- and eIL-1R1-mediated effects might provide distinguishing mechanisms for these psychopathologies.
Changes in microglial morphology and enhanced microglial activities have been used as a hallmark of neuroinflammation. Current results show that either eIL-1R1 or vIL-1R1 signaling led to altered microglial morphology and upregulation of microglial surface markers involved in phagocytosis (CD11b) and antigen presentation (CD86), but only eIL-1R1 caused inflammatory cytokine expression. nIL-1R1 signaling was unable to trigger microglial morphological changes after acute IL-1 stimulation but was able to cause microglial morphological changes after chronic low levels of IL-1 stimulation. Thus, vIL-1R1 and nIL-1R1 appear to mediate microglial activation phenotypes without overt production of inflammatory mediators. Recent studies have demonstrated a spectrum of different microglial activation types ranging from the inflammatory M1 type to the anti-inflammatory M2 type (Cherry et al., 2014). Our results reveal that cell-type-specific IL-1R1 signaling is a determinant of the types of microglial activation.
Although multiple studies have shown that microglia express little IL-1R1, direct IL-1 action on brain microglia to amplify CNS inflammation is still a prevalent concept. Another notion in the literature is that IL-1 stimulates the production of inflammatory cytokines primarily from brain endothelial cells because of their high IL-1R1 expression (Proescholdt et al., 2002). Our results refute both notions because IL-1-stimulated inflammatory cytokine expression was largely abolished after the depletion of microglia, but the restoration of IL-1R1 on endothelial, but not microglial, cells restored IL-1-induced inflammatory gene expression. IL-1 in the brain stimulates eIL-1R1 to produce factor(s) to drive microglial inflammatory gene expression. In addition, our results show that eIL-1R1-stimulation-conditioned media contained novel non-IL-1 factor(s) that triggered microglial inflammatory gene expression. Therefore, this bi-cellular paracrine system constitutes a CNS inflammatory amplifier. It should be noted, however, that extremely low amounts of microglial IL-1R1 and its attendant functions should not be ruled out. Indeed, microglial IL-1R1 has been found to be important for maintaining microglial numbers during microglial repopulation (Bruttger et al., 2015). In addition, conditional deletion of microglial IL-1R1 in juvenile mice affects microglial morphology. In contrast, we did not observe any significant changes in microglia number or morphology in mice lacking microglial IL-1R1. This discrepancy could partially be explained by a genetic compensation during early development because in Bruttger’s model, deletion of microglial IL-1R1 is induced at adolescence, whereas microglial IL-1R1 is absent throughout development in our model.
Our results on astrocytic IL-1R1 functions should also be interpreted with caution because a few neurons in the DG showed off-target expression of IL-1R1 in the Gfap-Cre-Il1r1r/r mice. Therefore, the influence of these few non-astrocyte IL-1R1+ cells might have contributed to the observed phenotype in this line.
The overall significance of this study is the demonstration that discrete cell-type-specific IL-1R1 systems are involved in distinct immunological, neural, and physiological activities in vivo. Past studies have treated the diverse IL-1-mediated effects as the results of different levels of inflammation induced by IL-1. For example, mild or acute IL-1-induced inflammation was thought to cause sickness behaviors, whereas severe or prolonged IL-1-induced inflammation was thought to cause depressive behaviors (Dantzer et al., 2008). Our results show that IL-1 induces sickness behaviors through eIL-1R1-mediated COX-2 expression. Deletion of eCOX-2 prevented IL-1-induced sickness behavior, but not IL-1 induced inflammatory cytokine expression, leukocyte recruitment, or microglial activation, all of which have been implicated in the pathogenesis of neurodegenerative diseases, affective disorders, and acute CNS-injury-initiated neural damage. Indeed, although COX-2 inhibitors (e.g., conventional non-steroidal anti-inflammatory drugs) are effective for treating sickness behavior in patients, these anti-inflammatory drugs are not effective antidepressants (Eyre and Baune, 2015). Therefore, qualitative rather than quantitative differences mediated by different cell-type-specific IL-1R1 signaling could account for the diverse role of this cytokine in different diseases. The non-inflammatory vIL-1R1-, aIL-1R1-, and nIL-1R1-mediated neuromodulatory activities discovered in this study should be considered potential mechanisms contributing to the pathogenesis of a large group of diseases in which IL-1 signaling has been implicated but in which conventional anti-inflammatory therapy has limited efficacy.
STAR★METHODS
Detailed methods are provided in the online version of this paper and include the following:
CONTACT FOR REAGENTS AND RESOURCE SHARING
Further information and requests for resources and reagents should be directed to and will be fulfilled by the Lead Contact, Ning Quan (quan.14@osu.edu).
EXPERIMENTAL MODELS AND SUBJECT DETAILS
Mice
Male C57BL/6 (6–8 weeks old) mice were purchased from Charles River Breeding Laboratories (Wilmington, MA), and allowed to acclimate to the vivarium for 7–10 days prior to experiments. CCL2KO (B6.129S4-Ccl2tm1Rol/J) and CCL2RFPflox (B6.Cg-Ccl2tm1.1Pame/J) mice were purchased from Jackson Laboratories (Bar Harbor, ME). All other mouse lines were bred in-house. The IL-1R1-deficient Il1r1r/r mice and IL-1R1 globally restored Il1r1GR/GR mice were created by our lab previously (Liu et al., 2015). Cell-type-specific IL-1R1 restored mouse lines, designated as Tie2-Cre-Il1r1r/r, Lysm-Cre-Il1r1r/r, Cx3cr1-Cre-Il1r1r/r, Gfap-Cre-Il1r1r/r, Camk2a-Cre-Il1r1r/r and Vglut2-Cre-Il1r1r/r mice were generated by crossbreeding Il1r1r/r mice with Tie2-Cre mice (B6.Cg-Tg(Tek-cre)12Flv/J), Lysm-Cre mice (B6N.129P2(B6)-Lyz2tm1(cre)Ifo/J), Cx3cr1-Cre mice (STOCK Tg(Cx3cr1-cre) MW126Gsat/Mmucd), Gfap-Cre mice (B6.Cg-Tg(Gfap-cre)77.6Mvs/2J), Camk2a-Cre mice (B6.Cg-Tg(Camk2a-cre)T29–1Stl/J) or Vglut2-Cre mice (Slc17a6tm2(cre)Lowl/J). Based on the references where these transgenic mouse lines were originally generated, the expression pattern is summarized as follows: Tie2-Cre mice have Cre expression in endothelial cells and hematopoietic cells; Lysm-Cre have Cre expression in the peripheral myeloid cells, in neurons in the motor cortex, CA3, cerebellum and other brain regions (Orthgiess et al., 2016); Cx3cr1-Cre mice have Cre expression in brain microglia and macrophages; Gfap-Cre mice (line 77.6) have Cre expression in most astrocytes throughout the brain and spinal cord, with a subpopulation of adult neural stem cells in the subventricular zone; Vglut2-Cre mice have Cre expression in excitatory glutamatergic neurons in motor cortex, thalamus, paraventricular nucleus and other brain regions; Camk2a-Cre mice have Cre expression in the forebrain, hippocampus, olfactory lobe and scattered cells in hypothalamus. When breeding these mice, Cre expression was found in the male germline of Gfap-Cre mice and Camk2a-Cre mice, and female germline of the Tie2-Cre mice. Therefore, only Gfap-Cre females, Camk2a-Cre females and Tie2-Cre males were bred with floxed mice to ensure non-germline transmission of the Cre.
The Tie2-Cre, Lysm-Cre, Gfap-Cre, Camk2a-Cre and Cx3cr1-Cre mice were also crossed to ROSA26-tdT mice (B6.Cg-Gt(ROSA) 26Sortm14(CAG-tdTomato)Hze/J) in which the transcription of a CAG promoter-driven RFP variant tdTomato (tdT) is prevented by a loxP-flanked STOP cassette. The Vglut2-Cre mice were crossed to ROSA26-ZsGreen mice (B6.Cg-Gt(ROSA)26Sortm6(CAG-ZsGreen1)Hze/J) in which the transcription of a CAG promoter-eGFP is prevented by a loxP-flanked STOP cassette. The resulting offspring were termed Tie2-Cre-R26tdT mice, Lysm-Cre-R26tdT mice, Gfap-Cre-R26tdT mice, Camk2a-Cre-R26tdT mice, Cx3cr1-Cre-R26tdT mice and Vglut2-Cre-R26zsGreen mice. The Tie2-Cre-Il1r1r/rCOX-2f/f mice were generated by crossbreeding Tie2-Cre-Il1r1r/r mice with COX-2f/f mice (An et al., 2014). Previously, a mouse line containing a floxed IL-1R1 gene (Il1r1f/f) was generated (Robson et al., 2016). In the present study, the Il1r1f/f mouse line was crossed to the abovementioned transgenic Tie2-Cre mouse line and Gfap-Cre mouse line. The resulting offspring were termed Tie2-Cre-Il1r1f/f mice and Gfap-Cre-Il1r1f/f mice. All mice were group housed in polypropylene cages, with food and water available ad libitum, in rooms maintained at 21°C under a 12 h light/dark cycle. All procedures were in accordance with the National Institute of Health Guidelines for the Care and Use of Laboratory Animals and were approved by the Ohio State University Institutional Laboratory Animal Care and Use Committee.
Cell lines and primary microglia
The murine brain endothelial cell line (bEnd.3, ATCC), murine astrocyte cell line (C8-D1A, ATCC) and murine microglial cell line (BV-2) were cultured in Dulbecco’s modified eagle medium (DMEM) (supplemented with 10% fetal bovine serum, 100 U/mL penicillin G, 100 μg/mL streptomycin). Cultures were maintained at 37°C with 95% humidity and 5% CO2. Cells were used at approximately 90% confluency. For primary culture, microglia were aseptically collected from male neonatal Il1r1r/r mouse pups on P1–P3.
METHOD DETAILS
Identification of Cre-mediated restoration of the IL-1R1-restore allele
Genomic DNA was purified from mouse brain tissue using a protocol described previously (Liu et al., 2015). Briefly, a 5 mg mouse hippocampal tissue was incubated in 500 μl lysis buffer overnight at 56°C. The lysis buffer contained 10 mM Tris-HCl (pH 8.0), 100 mM EDTA, 0.5% SDS, 1 mg/mL proteinase K. Samples were centrifuged at 13,000 rpm for 10 min to remove tissue residue. Supernatants were transferred and gently mixed with 500 μl of isopropanol. Genomic DNA was then pelleted and washed with ice-cold 70% ethanol. DNA pellets were air-dried and dissolved in 50 μl of DNase-free water. The primers for detection of the restored IL-1R1 allele (Il1r1GR) were: 5′-ACAGTCTCTGCAGATAACTTCGTATA-3′ and 5′-ACCGCTCGAGATCAGAGATGAAATGACTACAAGCTGTC-3′.
Leukocyte depletion
Vinblastine was first dissolved in DMSO (50 mg/mL) and diluted in saline (0.625 mg/mL) prior to use. Vinblastine was administered intravenously at the dose of 5 mg/kg body weight at 24 and 72 h before ICV IL-1β injection. Cyclophosphamide was diluted in saline (37.5 mg/mL) and administered intraperitoneally at the dose of 100 mg/kg body weight 2 and 5 days before the IL-1β injection.
Construction of human IL-1β-overexpressing adenoviral vectors
An IL-1β-overexpressing, replication-deficient (dE1/E3) adenoviral vector was generated by SignaGen Laboratories (Rockville, MD). In brief, the signal sequence from the human IL-1 receptor antagonist was fused to human IL-1β cDNA (Wingren et al., 1996). The joint construct sequence, denoted as ssIL-1β, allows the production of a mature, secreted human IL-1β which does not require caspase-1 cleavage. The ssIL-1β sequence was synthesized and packaged into serotype 5 adenoviral vectors under the control of CMV promoter. The recombinant adenoviral vector containing the ssIL-1β sequence is denoted as ad-ssIL-1.
Surgical procedures
Mice were anesthetized with 5% isoflurane induction, placed in the stereotaxic frame (David Kopf Instruments), and maintained at 1.0% - 1.5% isoflurane during surgery. The skin was cut open and coordinates for craniotomy were precisely located by a motorized stereotaxic instrument (David Kopf Instruments). The following coordinates were used: for lateral ventricle injections, AP, −0.6; ML, −1.0; DV, −2.5; for intra-hippocampus injections, AP, −1.8; ML, +/− 1.8; DV, −1.7; for intrastriatal injections, AP, +0.5; ML, +/− 2.0; DV, −4.0. Using a microinjection system (Picospritzer II, Parker Hannifin Company), 20 ng recombinant mouse IL-1β, 250 PFU or 5 × 10⁵ PFU ad-ssIL-1 in 1 μl of saline was slowly injected with a glass pipette (100 μm diameter, World Precision Instruments). The glass pipette was left in place for 5 additional minutes and then slowly withdrawn. Wounds were closed with surgical staples (for IL-1β injected mice) or sutures (for ad-ssIL-1 injected mice). Mice in the ad-ssIL-1 group were kept 6 days post-injection before sacrifice.
To create striatal aIL-1R1 deletion mice, 1 × 10⁸ GC AAV2/5CreGFP in 1 μl of saline was injected into one side of the striatum of the Il1r1r/r or Il1r1f/f mice and AAV2GFP as vehicle control at the same titer into the contralateral striatum. These mice were designated as AAVCre-Il1r1r/r and AAVCre-Il1r1f/f mice, respectively. 7 days later, these mice received ICV IL-1β injections.
Open field test
Locomotion (open field test) was determined as a measure of sickness behavior as previously described (Liu et al., 2016). Three hours after ICV IL-1β injections, mice were placed individually in the corner of the open field apparatus (40 × 40 × 25 cm Plexiglas box) and activity was recorded for 10 min using an automated digital beam break system attached to a computer containing an open field software template (Omnitech Electronics; Columbus, OH). After each test, the open field box was cleaned with H2O and 70% ethanol to reduce odor cues.
Social exploratory behavior
Social exploratory behavior was determined using the same beam break system for the open field test. A 3–5 weeks old male mouse was put into an 18 × 8 × 8 cm metal wire enclosure, placed on one side of the open field arena. Three hours after ICV IL-1β injections, the experimental mouse was placed into the arena and its activity was recorded for 5 min. The time of social investigation of the juvenile by the experimental subject was determined using Fusion software (Omnitech Electronics; Columbus, OH). After each test, both the wire enclosure cage and the open field box were cleaned with H2O and 70% ethanol to reduce odor cues.
Food intake measurement
Food intake was measured as a part of sickness behaviors. Mice were food deprived for 2 h prior to ICV IL-1β injections. After the IL-1β injections, standard rodent chow was weighed and placed on the food hopper. 6 h later, the chow was measured again for calculation of food consumption.
Immunohistochemistry
Mice were euthanized with carbon dioxide and perfused transcardially with cold 1 × PBS (pH 7.4), followed by 4% paraformaldehyde in phosphate buffer. Brains were removed, postfixed in 4% paraformaldehyde for 24 h and equilibrated in a cryoprotective solution of 20% sucrose at 4°C for 24 h. Brains were frozen at−80°C. Later, 30-μm-thick coronal sections were generated with a cryostat. Sections were placed free-floating in the cryoprotectant until staining. Sections were washed in PBS, blocked with 5% normal donkey serum (1% BSA, 0.1%TritonX in PBS), and incubated with primary antibodies anti-Iba1 (1:1000; rabbit anti-mouse), anti-Iba1 (1:500; goat anti-mouse), anti-CD45 (1:2000); anti-CD31 (1:1000; rat anti-mouse); anti-CD31 (1:200; Armenian hamster anti-mouse); anti-IL-R1 (1:500); anti-GFAP (1:500), anti-ICAM-1 (1:500), anti-VCAM-1 (1:500), anti-DCX (1:200), anti-NeuN (1:1000), anti-CD206 (1:1000), anti-RFP (1:1000), anti-PDGFRβ (1:500) or anti-Ly6C antibody (1:500). Primary antibody incubations were completed overnight at 4°C. Sections were then washed in PBS and incubated with a fluorochrome-conjugated secondary antibody (Alexa Fluor 488 or Alexa Fluor 594, Thermofisher Scientific). Sections were mounted on slides and coverslipped with Vectashield (Vector Laboratories). For HA labeling, IHC was conducted using commercially available Tyramide SuperBoost™ Kit (Thermofisher Scientific) for signal amplification.
For COX-2 labeling, mice brains were collected at 4 h after ICV IL-1β injections and frozen in isopentane at −80°C. Fresh frozen coronal sections were fixed in acetone/alcohol mixture, followed by incubation in a glucose oxidase and sodium azide solution. After incubation with anti-COX-2 primary antibody and biotinylated secondary antibody (Vector Laboratories), labeling was amplified using an ABC solution (Vector Laboratories) and then visualized with a diaminobenzidine (DAB) peroxidase substrate kit (Vector Laboratories).
For examination of neurogenesis, mice in ad-ssIL-1 groups were administrated 5-ethynyl-2′-deoxyuridine (EdU) (Carbosynth) at the dose of 40 mg/kg 4 h before sacrifice. Mice were perfusion fixed and brains were processed as mentioned above. Hippocampal sections were incubated in the labeling mastermix for 1 h. The labeling mastermix contained 1 mM CuSO4, 20 μm sulfo-Cyanine 3 azide (Lumiprobe), 100 mM Tris and 100 mM (+)-sodium L-ascorbate. Sections were co-stained with DAPI when coverslipped with DAPI-Vectashield.
Immunofluorescence imaging and processing
IHC results were examined using different microscopes. For sections visualized by DAB peroxidase substrate kit, results were obtained using a Leica DM5000B microscope connected to a Leica DFC300 FX camera and imaging software (LAS X). For all of the immunofluorescence imaging, confocal images were captured using a Leica TCS SP8 confocal microscope. Multiple-channel images were overlaid and each stack was z-projected using ImageJ software (National Institute of Health, Bethesda, MD). For large area imaging, series of confocal images were acquired by tile scans and stitched by the Leica Application Suite X software to produce a collage of brain sections. Cell counting, colocalization calculation, area quantification and microglial morphological analyses were conducted using ImageJ. CD45, Iba1 or EdU positive cells were counted in the areas of interest. RFP and ICAM-1/VCAM-1 colocalized area were calculated using the colocalization analysis plugin. Iba1 labeled area was measured using a digital image analysis. In brief, a threshold for positive staining was determined for representative images. Based on the threshold, images were processed by densitometric scanning and calculated as positive area size. For microglial morphological analyses, microglial soma size was calculated, summed and averaged; microglial processes length was analyzed using the skeleton plugin (Morrison and Filosa, 2013).
RNA Isolation and Real-Time PCR
Brains were collected 3 h after ICV IL-1β injections. Hippocampus or striatum was dissected from the brains on ice. Tissues were transferred to sterile Eppendorf tubes, suspended in the TRIzol reagent (Invitrogen), and homogenized with a sonicator. Total RNA was isolated following the manufacture’s instruction. For cultured cells, the RNeasy kit (QIAGEN) was used to isolate RNA. RNA concentration and purity were determined with a Nanodrop spectrophotometer (Denville; S. Plainfield, NJ). RNAs were reverse transcribed into cDNAs using a Reverse Transcription Kit (Promega). qPCR was performed using the Assay-on-Demand Gene Expression protocol as previously described (Liu et al., 2016). In brief, the amount of cDNA was measured on an ABI PRISM 7500 sequence detection system (Applied Biosystems, Foster, CA) by real-time PCR and normalized based on reference cDNA levels (GAPDH). Relative gene expression was analyzed using the ΔΔCT method and results are expressed as fold difference from GAPDH.
A separate PCR protocol was used for detection of the restored IL-1R1 mRNA. To detect the restored IL-1R1 mRNA, SYBR qPCR was performed using the following primers, which detect RNA sequence between IL-1R1 Exon IX and Exon X: EX-F, 5′-CCTCACGGCTACAATTGTATGC-3′ and EX-R, 5′-CAAACTGTCCCTCCAAGACC-3′.
Plexxikon treatment
PLX5622 was provided by Plexxikon Inc. (Berkley, CA) and formulated in standard AIN-76A rodent chow by Research Diets at a concentration of 1200 mg/kg. Control diet consisted of the standard AIN-76A rodent chow. Mice were provided ad libitum access to PLX5622 or control diet for 14 days to deplete microglia prior to ICV injections or LPS challenges. To study the effects of Plexxikon treatment on LPS induced leukocyte trafficking, mice received intraperitoneal injections of 1 mg/kg LPS or saline after PLX5622 or control diet treatment.
Isolation of microglia and brain-infiltrating leukocytes
Microglia and brain-infiltrating leukocytes were enriched using a modified protocol described previously (McKim et al., 2018). Mice were euthanized 5 h (early time point for leukocyte infiltration), 15 h (peak leukocyte infiltration time point (Ching et al., 2005)) or 24 h (time point for microglial analysis) after ICV injections and perfused transcardially with cold 1 × PBS (pH 7.4) to flush circulating leukocytes away from the brain. Brains were dissected, homogenized with Potter-Elvehjem Tissue Grinders (Wheaton) and centrifuged at 900 × g for 6 min. Supernatants were removed and cell pellets were re-suspended in 35% isotonic Percoll (GE-Healthcare) and centrifuged for 20 min at 2000 × g. Supernatants were removed and cell pellets were re-suspended in 1 × PBS for cell surface antigen labeling.
Flow cytometry
Labeling of cell surface antigens was performed as previously described (McKim et al., 2018). In brief, Fc receptors were blocked with anti-CD16/CD32 antibody for 10 min. Cells were washed and then incubated with the appropriate antibodies (CD45, CD11b, Ly6G, Ly6C and CD68) for 1 h at 4°C. Cells were washed and then re-suspended in FACS buffer for analysis. In Plexxikon or control diet-treated mice, cell numbers were estimated using counting beads (eBioscience). Non-specific binding was assessed using isotype-matched antibodies. Antigen expression was determined using a Cytek DxP9 FACSCalibur (Cytek). Data were analyzed using FlowJo software (Tree Star) and positive labeling for each antibody was determined based on isotype stained controls.
Il1r1r/r bone marrow-chimera
Recipient Il1r1r/r and Tie2-Cre-Il1r1r/r male mice (6 weeks old) were injected intraperitoneally once daily for two consecutive days with busulfan in a 1:1 solution of DMSO and deionized water (30 mg/kg/100 μl). Previous literature suggests that this dose of busulfan results in effective myeloid ablation without overt blood brain barrier disruption (Kierdorf et al., 2013). Donor bone marrow-derived cells were isolated from the femur of Il1r1r/r female mice and passed through a 70 μm nylon cell strainer. Cells (1 × 10⁶) were transferred to recipient mice by tail vein injection (100 μl) 48 h after the second dose of busulfan. Mice were left undisturbed for 4 weeks to allow engraftment. Engraftment was verified by determining the percentage of chimerism by qPCR of Y chromosome specific gene Zfy1, using bone marrow cell DNA from the recipients.
Immortalized cell line culture
For cell co-culture study, BV-2 cells (sex: female) were seeded at 1.5 × 10⁵ cells/well in 12-well plates. bEnd.3 cells (sex info unknown) were seeded at 1.5 × 10⁵ cells/well in the same plates. The plates were incubated for 4 h to allow the co-cultured cells to adhere to the plate surface. Recombinant mouse IL-1β (10 ng/mL, R&D Systems) was used to stimulate the co-cultured cells for 2 or 4 h. Culture medium was used as a control. For conditioned media study, bEnd.3/C8D1A cells (sex info unknown) and BV-2 cells were cultured separately at 1.0 × 10⁵ cells/well in 12-well plates overnight. IL-1β was added to stimulate bEnd.3/C8D1A cells for 4 h. The IL-1β or culture medium stimulated bEnd.3/C8D1A cell-conditioned media were then transferred onto PBS washed BV-2 cells for 4 h.
Primary microglia culture
Microglia-enriched cultures were derived from mixed glia cultures as previously described (McKim et al., 2018). In brief, whole brains were aseptically collected from male neonatal Il1r1r/r mouse pups on P1–P3, rinsed with Hank’s Balanced Salt Solution (HBSS) and minced into small pieces. The brain mixture was then digested with 0.25% trypsin at 37°C for 15 min, neutralized with culture medium and passed through a 70 μm nylon cell strainer. The homogenates were spun at 900 × g for 6 min, washed twice with HBSS and plated on poly-L-lysine coated culture flasks in growth medium (DMEM supplemented with 20% FBS, 3.7 g/L sodium bicarbonate, 200 mM glutamine, 100 U/mL penicillin G, 100 μg/mL streptomycin, 0.25 μg/mL fungizone, 50 μg/mL gentamicin). Mixed glia cultures were maintained at 37°C with 95% humidity and 5% CO2 and growth medium was replaced every three days. Between days in vitro (DIV) 10-DIV 20, mixed glia cultures were shaken at 120 rpm at 37°C for 2 h to harvest microglia from the supernatant. Microglia were plated at a density of 5 × 10⁴ cells/well on poly-L-lysine coated 24-well plates overnight prior to incubation with IL-1β and bEnd.3 cell-conditioned media.
In situ hybridization
WT and Il1r1r/r mice were perfusion fixed and brains were frozen at −80°C as described above. Then 10-μm-thick coronal sections were generated with a cryostat. Sections were placed onto glass slides until use. ISHH for IL-1R1 mRNA was conducted using the commercially available RNAscope® 2.5 HD Reagent Kit-RED (Advanced Cell Diagnostics). Antisense cRNA probes for IL-1R1 were synthesized based on exon X and XI sequences of mouse IL-1R1 mRNA by Advanced Cell Diagnostics.
Statistical Analysis
All data are expressed as treatment means ± standard error of the mean (SEM). Standard one-way or two-way ANOVA was used to analyze data. When appropriate, significant main and interaction effects were subjected to F-protected LSD test for post hoc analyses for further comparison. Observations more than three interquartile ranges from the first and third quartile were excluded from analyses. An alpha level of p < 0.05 was used as the criterion for the rejection of the null hypothesis. All data were analyzed using StatView statistical software (SAS Institute, Cary, NC).
Supplementary Material
KEY RESOURCES TABLE
| REAGENT or RESOURCE | SOURCE | IDENTIFIER |
|---|---|---|
| Antibodies | ||
| Rabbit anti-lba1 | Wako Chemicals | Cat# 019-19741; RRID: AB_839504 |
| Goat anti-lba1 | Abeam | Cat# ab5076; RRID: AB_2224402 |
| Rat anti-CD45 | Abd Serotec | Cat# MCA1388; RRID: AB_321729 |
| Rat anti-CD31 | Biolegend | Cat# 102502; RRID: AB_312909 |
| Armenian hamster anti-CD31 | DSHB | Cat#: 2H8; RRID: AB_2161039 |
| Goatanti-IL-1R1 | R&D system | Cat# AF771; RRID: AB_355587 |
| Goat anti-GFAP | Abeam | Cat# ab53554; RRID: AB_880202 |
| Goat anti-VCAM | R&D system | Cat# AF643; RRID: AB_355499 |
| Goat anti-ICAM | R&D system | Cat# AF796; RRID: AB_2248703 |
| Goat anti-DCX | Santa Cruz Biotechnology | Cat# sc-8066; RRID: AB_2088494 |
| Rat anti-CD206 | Bio-Rad | Cat# MCA2235; RRID: AB_324622 |
| Rabbit anti-RFP | Abeam | Cat# ab124754; RRID: AB_10971665 |
| Rabbit anti-HA | Cell Signaling Technology | Cat# 3724; RRID: AB_1549585 |
| Rat anti-Ly6C | Abeam | Cat# ab54223; RRID: AB_881384 |
| Rabbit anti-COX-2 | Cayman Chemicals | Cat# 160106; RRID: AB_10077935 |
| Rabbit anti-NeuN | Sigma-Aldrich | Cat# ABN78; RRID: AB_10807945 |
| Rabbit anti-PDGFRβ | Abeam | Cat# ab32570; RRID: AB_777165 |
| Donkey anti-rabbit Alexa Fluor 594 | Thermofisher Scientific | Cat# A-21207; RRID: AB_141637 |
| Donkey anti-rabbit Alexa Fluor 488 | Thermofisher Scientific | Cat# A-21206; RRID: AB_141708 |
| Donkey anti-rat Alexa Fluor 594 | Thermofisher Scientific | Cat# A-21209; RRID: AB_2535795 |
| Donkey anti-rat Alexa Fluor 488 | Thermofisher Scientific | Cat# A-21208; RRID: AB_141709 |
| Donkey anti-goat Alexa Fluor 488 | Thermofisher Scientific | Cat# A-11055; RRID: AB_142672 |
| Donkey anti-armenian hamster Alexa Fluor 488 | Abeam | Cat# ab173003; RRID: N/A |
| Biotinylated Goat anti-rabbit | Vector Laboratories | Cat# BA-1000; RRID: AB_2313606 |
| Ratanti-CD16/CD32 | BD Biosciences | Cat# 553142; RRID: AB_394657 |
| Rat anti-CD45, PerCP | eBioscience | Cat# 45-0452-82; RRID: AB_1107006 |
| Ratanti-CD11b, FITC | eBioscience | Cat# 11-0112-82; RRID: AB_464935 |
| Rat anti-Ly6G, PE-Cy7 | eBioscience | Cat# 25-5931-82; RRID: AB_469663 |
| Rat anti-Ly6C, APC-Cy7 | BD Biosciences | Cat# 560596; RRID: AB_1727555 |
| Bacterial and Virus Strains | ||
| ad-ss-IL-1 | This paper | N/A |
| AAV5.CMV.HI.eGFP-Cre.WPRE.SV40 | AddGene | Cat# 105545-AAV5; RRID: N/A |
| AAV2.CMV.HI.eGFP.WPRE.bGH | AddGene | Cat# 105530-AAV2; RRID: N/A |
| Chemicals, Peptides, and Recombinant Proteins | ||
| Vinblastine | Sigma-Aldrich | Cat# V1377 |
| Cyclophosphamide | Sigma-Aldrich | Cat# C0768 |
| PLX5622 | Plexxikon Inc. | N/A |
| Proteinase K | Thermofisher Scientific | Cat# 25530049 |
| Recombinant mouse IL-β | R&D system | Cat# 401-ML-005 |
| Critical Commercial Reagents and Assays | ||
| 123count eBeads™ Counting Beads | eBioscience | Cat# 01-1234-42 |
| Tyramide SuperBoost™ Kit | Thermofisher Scientific | Cat# B40943 |
| Experimental Models: Cell Lines | ||
| Mouse: bEnd.3 cells | ATCC | Cat# CRL-2299; RRID: CVCL_0170 |
| Mouse: C8D1A cells | ATCC | Cat# CRL-2541; RRID: CVCL_6379 |
| Mouse: BV-2 cells | Laboratory of J.P.G. | N/A |
| Experimental Models: Organisms/Strains | ||
| Mouse: C57BL/6 | Charles River Laboratories | Mouse strain: C57BL/6NCrl; RRID: IMSR_CRL:27 |
| Mouse: B6.Cg-Tg(Tek-cre)12Flv/J | Jackson Laboratory | Mouse Strain: JAX 004128; RRID: IMSR_JAX:004128 |
| Mouse: B6N.129P2(B6)-Lyz2tm1(cre)ifo/J | Jackson Laboratory | Mouse Strain: JAX 018956; RRID: IMSR_JAX: 018956 |
| Mouse: STOCK Tg(Cx3cr1-cre)MW126Gsat/Mmucd | MMRRC | Mouse Strain: 036395-UCD; RRID: MMRRC_036395-UCD |
| Mouse: B6.Cg-Tg(Gfap-cre)77.6Mvs/2J | Jackson Laboratory | Mouse Strain: JAX 024098; RRID: IMSR_JAX: 024098 |
| Mouse: B6.Cg-Tg(Camk2a-cre)T29-1 Stl/J | Jackson Laboratory | Mouse Strain: JAX 005359; RRID: IMSR_JAX: 005359 |
| Mouse: Slc17a6tm2(cre)Lowl/J | Jackson Laboratory | Mouse Strain: JAX 016963; RRID: IMSR_JAX: 016963 |
| Mouse: B6.Cg-Ccl2tm1 1Pame/J | Jackson Laboratory | Mouse Strain: JAX 016849; RRID: IMSR_JAX: 016849 |
| Mouse: B6.129S4-Ccl2tm1Rol/J | Jackson Laboratory | Mouse Strain: JAX 004434; RRID: IMSR_JAX: 004434 |
| Mouse: B6.Cg-Gt(ROSA)26Sortm14(CAG-tdTomato)Hze/J | Jackson Laboratory | Mouse Strain: JAX 007914; RRID: IMSR_JAX: 007914 |
| Mouse: B6.Cg-Gt(ROSA)26Sortm6(GAG-ZsGreen1)Hze/J | Jackson Laboratory | Mouse Strain: JAX 007906; RRID: IMSR_JAX: 007906 |
| Mouse: COX-2f/f | Laboratory of N.Q. | N/A |
| Mouse: IL-1R1f/f | Laboratory of R.D.B. | N/A |
| Software and Algorithms | ||
| Flowjo software | Treestar | RRID: SCR_008520 |
| Statview software | SAS Institute Inc. | N/A |
| ImageJ software | NIH | RRID: SCR_003070 |
Highlights.
Brain IL-1R1 is found in endothelial and ventricular cells, astrocytes, and DG neurons
Ventricular IL-1R1 regulates monocyte recruitment
Endothelial and ventricular IL-1R1 regulates IL-1-induced microglial activation
Endothelial IL-1R1 mediates sickness behavior, leukocyte recruitment, and neurogenesis
ACKNOWLEDGMENTS
This study was supported by National Institute of Mental Health grant R01-MH-109165 to N.Q. and National Institute of Dental and Craniofacial Research training grant 2T32DE01432016 to D.J.D. We gratefully acknowledge the contribution of Tamara N. Kolli for help with in situ hybridization.
Footnotes
SUPPLEMENTAL INFORMATION
Supplemental Information includes seven figures and can be found with the article online at https://doi.org/10.1016/j.immuni.2018.12.012.
DECLARATION OF INTERESTS
The authors declare no competing interests.
REFERENCES
- Aguilar-Valles A, Kim J, Jung S, Woodside B, and Luheshi GN (2014). Role of brain transmigrating neutrophils in depression-like behavior during systemic infection. Mol. Psychiatry 19, 599–606. [DOI] [PubMed] [Google Scholar]
- An Y, Belevych N, Wang Y, Zhang H, Herschman H, Chen Q, and Quan N (2014). Neuronal and nonneuronal COX-2 expression confers neurotoxic and neuroprotective phenotypes in response to excitotoxin challenge.J. Neurosci. Res 92, 486–495. [DOI] [PMC free article] [PubMed] [Google Scholar]
- Banks WA, Kastin AJ, and Broadwell RD (1995). Passage of cytokines across the blood-brain barrier. Neuroimmunomodulation 2, 241–248. [DOI] [PubMed] [Google Scholar]
- Basu A, Krady JK, and Levison SW (2004). Interleukin-1: a master regulator of neuroinflammation. J. Neurosci. Res 78, 151–156. [DOI] [PubMed] [Google Scholar]
- Bluthé RM, Layé S, Michaud B, Combe C, Dantzer R, and Parnet P (2000). Role of interleukin-1beta and tumour necrosis factor-alpha in lipopolysaccharide-induced sickness behaviour: a study with interleukin-1 type I receptor-deficient mice. Eur. J. Neurosci 12, 4447–4456. [PubMed] [Google Scholar]
- Bruttger J, Karram K, Wörtge S, Regen T, Marini F, Hoppmann N, Klein M, Blank T, Yona S, Wolf Y, et al. (2015). Genetic cell ablation reveals clusters of local self-renewing microglia in the mammalian central nervous system. Immunity 43, 92–106. [DOI] [PubMed] [Google Scholar]
- Chen Q, Zhang H, Li Q, An Y, Herkenham M, Lai W, Popovich P, Agarwal S, and Quan N (2009). Three promoters regulate tissue- and cell type-specific expression of murine interleukin-1 receptor type I. J. Biol. Chem 284, 8703–8713. [DOI] [PMC free article] [PubMed] [Google Scholar]
- Cherry JD, Olschowka JA, and O’Banion MK (2014). Neuroinflammation and M2 microglia: the good, the bad, and the inflamed. J. Neuroinflammation 11, 98. [DOI] [PMC free article] [PubMed] [Google Scholar]
- Ching S, He L, Lai W, and Quan N (2005). IL-1 type I receptor plays a key role in mediating the recruitment of leukocytes into the central nervous system. Brain Behav. Immun 19, 127–137. [DOI] [PubMed] [Google Scholar]
- Ching S, Zhang H, Belevych N, He L, Lai W, Pu XA, Jaeger LB, Chen Q, and Quan N (2007). Endothelial-specific knockdown of interleukin-1 (IL-1) type 1 receptor differentially alters CNS responses to IL-1 depending on its route of administration. J. Neurosci 27, 10476–10486. [DOI] [PMC free article] [PubMed] [Google Scholar]
- Cunningham ET Jr., and De Souza EB (1993). Interleukin 1 receptors in the brain and endocrine tissues. Immunol. Today 14, 171–176. [DOI] [PubMed] [Google Scholar]
- Dantzer R, O’Connor JC, Freund GG, Johnson RW, and Kelley KW (2008). From inflammation to sickness and depression: when the immune system subjugates the brain. Nat. Rev. Neurosci 9, 46–56. [DOI] [PMC free article] [PubMed] [Google Scholar]
- Davis CN, Tabarean I, Gaidarova S, Behrens MM, and Bartfai T (2006). IL-1beta induces a MyD88-dependent and ceramide-mediated activation of Src in anterior hypothalamic neurons. J. Neurochem 98, 1379–1389. [DOI] [PubMed] [Google Scholar]
- Depino AM, Alonso M, Ferrari C, del Rey A, Anthony D, Besedovsky H, Medina JH, and Pitossi F (2004). Learning modulation by endogenous hippocampal IL-1: blockade of endogenous IL-1 facilitates memory formation. Hippocampus 14, 526–535. [DOI] [PubMed] [Google Scholar]
- Ericsson A, Liu C, Hart RP, and Sawchenko PE (1995). Type 1 inter-leukin-1 receptor in the rat brain: distribution, regulation, and relationship to sites of IL-1-induced cellular activation. J. Comp. Neurol 361, 681–698. [DOI] [PubMed] [Google Scholar]
- Eyre HA, and Baune BT (2015). Anti-inflammatory intervention in depression. JAMA Psychiatry 72, 511. [DOI] [PubMed] [Google Scholar]
- Felger JC, and Lotrich FE (2013). Inflammatory cytokines in depression: neurobiological mechanisms and therapeutic implications. Neuroscience 246, 199–229. [DOI] [PMC free article] [PubMed] [Google Scholar]
- French RA, VanHoy RW,Chizzonite R, Zachary JF, Dantzer R, Parnet P, Bluthé RM, and Kelley KW (1999). Expression and localization of p80 and p68 interleukin-1 receptor proteins in the brain of adult mice. J. Neuroimmunol 93, 194–202. [DOI] [PubMed] [Google Scholar]
- Huang Y, Smith DE, Ibáñez-Sandoval O, Sims JE, and Friedman WJ (2011). Neuron-specific effects of interleukin-1β are mediated by a novel isoform of the IL-1 receptor accessory protein. J. Neurosci 31, 18048–18059. [DOI] [PMC free article] [PubMed] [Google Scholar]
- Hutson LW, Lebonville CL, Jones ME, Fuchs RA, and Lysle DT (2017). Interleukin-1 signaling in the basolateral amygdala is necessary for heroin-conditioned immunosuppression. Brain Behav. Immun 62, 171–179. [DOI] [PMC free article] [PubMed] [Google Scholar]
- Jin R, Yang G, and Li G (2010). Inflammatory mechanisms in ischemic stroke: role of inflammatory cells. J. Leukoc. Biol 87, 779–789. [DOI] [PMC free article] [PubMed] [Google Scholar]
- Khairova RA, Machado-Vieira R, Du J, and Manji HK (2009). A potential role for pro-inflammatory cytokines in regulating synaptic plasticity in major depressive disorder. Int. J. Neuropsychopharmacol 12, 561–578. [DOI] [PMC free article] [PubMed] [Google Scholar]
- Kierdorf K, Katzmarski N, Haas CA, and Prinz M (2013). Bone marrow cell recruitment to the brain in the absence of irradiation or parabiosis bias. PLoS ONE 8, e58544. [DOI] [PMC free article] [PubMed] [Google Scholar]
- Konsman JP, Parnet P, and Dantzer R (2002). Cytokine-induced sickness behaviour: mechanisms and implications. Trends Neurosci. 25, 154–159. [DOI] [PubMed] [Google Scholar]
- Konsman JP, Vigues S, Mackerlova L, Bristow A, and Blomqvist A (2004). Rat brain vascular distribution of interleukin-1 type-1 receptor immunoreactivity: relationship to patterns of inducible cyclooxygenase expression by peripheral inflammatory stimuli. J. Comp. Neurol 472, 113–129. [DOI] [PubMed] [Google Scholar]
- Koo JW, and Duman RS (2008). IL-1beta is an essential mediator of the antineurogenic and anhedonic effects of stress. Proc. Natl. Acad. Sci. USA 105, 751–756. [DOI] [PMC free article] [PubMed] [Google Scholar]
- Koo JW, and Duman RS (2009). Evidence for IL-1 receptor blockade as a therapeutic strategy for the treatment of depression. Curr. Opin. Investig. Drugs 10, 664–671. [PMC free article] [PubMed] [Google Scholar]
- Krasnow SM, Knoll JG, Verghese SC, Levasseur PR, and Marks DL (2017). Amplification and propagation of interleukin-1β signaling by murine brain endothelial and glial cells. J. Neuroinflammation 14, 133. [DOI] [PMC free article] [PubMed] [Google Scholar]
- Krueger JM (2008). The role of cytokines in sleep regulation. Curr. Pharm. Des 14, 3408–3416. [DOI] [PMC free article] [PubMed] [Google Scholar]
- Liu X, and Quan N (2018). Microglia and CNS interleukin-1: beyond immuno-logical concepts. Front. Neurol 9, 8. [DOI] [PMC free article] [PubMed] [Google Scholar]
- Liu X, Yamashita T, Chen Q, Belevych N, Mckim DB, Tarr AJ, Coppola V, Nath N, Nemeth DP, Syed ZW, et al. (2015). Interleukin 1 type 1 receptor restore: a genetic mouse model for studying interleukin 1 receptor-mediated effects in specific cell types. J. Neurosci 35, 2860–2870. [DOI] [PMC free article] [PubMed] [Google Scholar]
- Liu X, Nemeth DP, Tarr AJ, Belevych N, Syed ZW, Wang Y, Ismail AS, Reed NS, Sheridan JF, Yajnik AR, et al. (2016). Euflammation attenuates peripheral inflammation-induced neuroinflammation and mitigates immune-to-brain signaling. Brain Behav. Immun 54, 140–148. [DOI] [PMC free article] [PubMed] [Google Scholar]
- McKim DB, Weber MD, Niraula A, Sawicki CM, Liu X, Jarrett BL, Ramirez-Chan K, Wang Y, Roeth RM, Sucaldito AD, et al. (2018). Microglial recruitment of IL-1β-producing monocytes to brain endothelium causes stress-induced anxiety. Mol. Psychiatry 23, 1421–1431. [DOI] [PMC free article] [PubMed] [Google Scholar]
- Monif M, Reid CA, Powell KL, Drummond KJ, O’Brien TJ, and Williams DA (2016). Interleukin-1β has trophic effects in microglia and its release is mediated by P2X7R pore. J. Neuroinflammation 13, 173. [DOI] [PMC free article] [PubMed] [Google Scholar]
- Morrison HW, and Filosa JA (2013). A quantitative spatiotemporal analysis of microglia morphology during ischemic stroke and reperfusion. J. Neuroinflammation 10, 4. [DOI] [PMC free article] [PubMed] [Google Scholar]
- Moynagh PN (2005). The interleukin-1 signalling pathway in astrocytes: a key contributor to inflammation in the brain. J. Anat 207, 265–269. [DOI] [PMC free article] [PubMed] [Google Scholar]
- Norden DM, Trojanowski PJ, Villanueva E, Navarro E, and Godbout JP (2016). Sequential activation of microglia and astrocyte cytokine expression precedes increased Iba-1 or GFAP immunoreactivity following systemic immune challenge. Glia 64, 300–316. [DOI] [PMC free article] [PubMed] [Google Scholar]
- Orthgiess J, Gericke M, Immig K, Schulz A, Hirrlinger J, Bechmann I, and Eilers J (2016). Neurons exhibit Lyz2 promoter activity in vivo: Implications for using LysM-Cre mice in myeloid cell research. Eur. J. Immunol 46, 1529–1532. [DOI] [PubMed] [Google Scholar]
- Ortinski PI, Dong J, Mungenast A, Yue C, Takano H, Watson DJ, Haydon PG, and Coulter DA (2010). Selective induction of astrocytic gliosis generates deficits in neuronal inhibition. Nat. Neurosci 13, 584–591. [DOI] [PMC free article] [PubMed] [Google Scholar]
- Paré A, Mailhot B, Lévesque SA, and Lacroix S (2017). Involvement of the IL-1 system in experimental autoimmune encephalomyelitis and multiple sclerosis: Breaking the vicious cycle between IL-1β and GM-CSF. Brain Behav. Immun 62, 1–8. [DOI] [PubMed] [Google Scholar]
- Parker LC, Luheshi GN, Rothwell NJ, and Pinteaux E (2002). IL-1 beta signalling in glial cells in wildtype and IL-1RI deficient mice. Br. J. Pharmacol 136, 312–320. [DOI] [PMC free article] [PubMed] [Google Scholar]
- Pinteaux E, Trotter P, and Simi A (2009). Cell-specific and concentration-dependent actions of interleukin-1 in acute brain inflammation. Cytokine 45, 1–7. [DOI] [PubMed] [Google Scholar]
- Proescholdt MG, Chakravarty S, Foster JA, Foti SB, Briley EM, and Herkenham M (2002). Intracerebroventricular but not intravenous inter-leukin-1beta induces widespread vascular-mediated leukocyte infiltration and immune signal mRNA expression followed by brain-wide glial activation. Neuroscience 112, 731–749. [DOI] [PubMed] [Google Scholar]
- Quan N (2008). Immune-to-brain signaling: how important are the blood-brain barrier-independent pathways? Mol. Neurobiol 37, 142–152. [DOI] [PMC free article] [PubMed] [Google Scholar]
- Ravizza T, Gagliardi B, Noé F, Boer K, Aronica E, and Vezzani A (2008). Innate and adaptive immunity during epileptogenesis and spontaneous seizures: evidence from experimental models and human temporal lobe epilepsy. Neurobiol. Dis 29, 142–160. [DOI] [PubMed] [Google Scholar]
- Robson MJ, Zhu CB, Quinlan MA, Botschner DA, Baganz NL, Lindler KM, Thome JG, Hewlett WA, and Blakely RD (2016). Generation and characterization of mice expressing a conditional allele of the interleukin-1 receptor type 1. PLoS ONE 11, e0150068. [DOI] [PMC free article] [PubMed] [Google Scholar]
- Saper CB, Romanovsky AA, and Scammell TE (2012). Neural circuitry engaged by prostaglandins during the sickness syndrome. Nat. Neurosci 15, 1088–1095. [DOI] [PMC free article] [PubMed] [Google Scholar]
- Sato A, Ohtaki H, Tsumuraya T, Song D, Ohara K, Asano M, Iwakura Y, Atsumi T, and Shioda S (2012). Interleukin-1 participates in the classical and alternative activation of microglia/macrophages after spinal cord injury. J. Neuroinflammation 9, 65. [DOI] [PMC free article] [PubMed] [Google Scholar]
- Serrats J, Schiltz JC, García-Bueno B, van Rooijen N, Reyes TM, and Sawchenko PE (2010). Dual roles for perivascular macrophages in immune-to-brain signaling. Neuron 65, 94–106. [DOI] [PMC free article] [PubMed] [Google Scholar]
- Shaftel SS, Griffin WS, and O’Banion MK (2008). The role of interleukin-1 in neuroinflammation and Alzheimer disease: an evolving perspective. J. Neuroinflammation 5, 7. [DOI] [PMC free article] [PubMed] [Google Scholar]
- Tobler I, Borbély AA, Schwyzer M, and Fontana A (1984). Interleukin-1 derived from astrocytes enhances slow wave activity in sleep EEG of the rat. Eur. J. Pharmacol 104, 191–192. [DOI] [PubMed] [Google Scholar]
- Trahanas DM, Cuda CM, Perlman H, and Schwulst SJ (2015). Differential activation of infiltrating monocyte-derived cells after mild and severe traumatic brain injury. Shock 43, 255–260. [DOI] [PMC free article] [PubMed] [Google Scholar]
- Wingren AG, Björkdahl O, Labuda T, Björk L, Andersson U, Gullberg U, Hedlund G, Sjögren HO, Kalland T, Widegren B, and Dohlsten M (1996). Fusion of a signal sequence to the interleukin-1 beta gene directs the protein from cytoplasmic accumulation to extracellular release. Cell. Immunol 169, 226–237. [DOI] [PubMed] [Google Scholar]
- Wu MD, Montgomery SL, Rivera-Escalera F, Olschowka JA, and O’Banion MK (2013). Sustained IL-1β expression impairs adult hippocampal neurogenesis independent of IL-1 signaling in nestin+ neural precursor cells. Brain Behav. Immun 32, 9–18. [DOI] [PMC free article] [PubMed] [Google Scholar]
- Yabuuchi K, Minami M, Katsumata S, and Satoh M (1994). Localization of type I interleukin-1 receptor mRNA in the rat brain. Brain Res. Mol. Brain Res 27, 27–36. [DOI] [PubMed] [Google Scholar]
- Zhu CB, Lindler KM, Owens AW, Daws LC, Blakely RD, and Hewlett WA (2010). Interleukin-1 receptor activation by systemic lipopolysaccharide induces behavioral despair linked to MAPK regulation of CNS serotonin transporters. Neuropsychopharmacology 35, 2510–2520. [DOI] [PMC free article] [PubMed] [Google Scholar]
Associated Data
This section collects any data citations, data availability statements, or supplementary materials included in this article.