Abstract
We present a gas-generating solid nanoparticle as a new concept of the ultrasound contrast agent. The developed nanoparticles are sufficiently small (less than 100 nm in diameter) to escape vasculature and yet, upon external pulsed laser light activation, release nitrogen gas for the enhanced contrast in ultrasound imaging. The gas-generating nanoconstructs combine the photocatalytic function of gold nanoparticles and photolysis of azide compounds. Using ultrasound imaging, we demonstrate the controlled, on-demand generation of nitrogen gas from nanoparticles due to the decomposition of azide groups trigggered by pulsed laser irradiation. The resulting gas forms bubbles that cause backscattered ultrasound signals and, therefore, modulate the contrast in ultrasound imaging.
Graphical Abstract
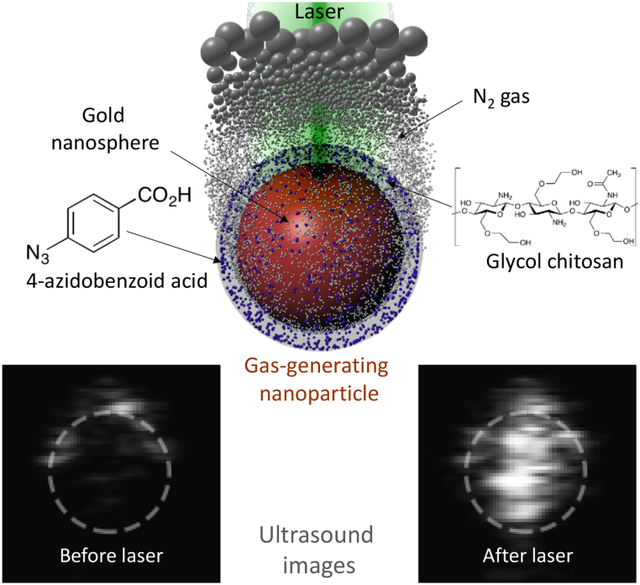
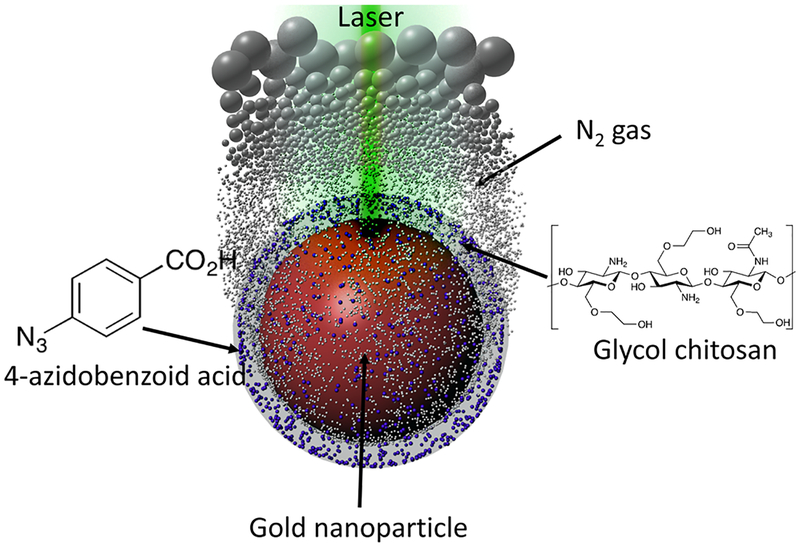
New concept in contrast-enhanced ultrasound imaging: on-demand laser-triggered gas-generating nanoparticles.
Compared with other imaging modalities, ultrasound imaging has several advantages such as portability, cost-effectiveness, and real-time imaging. Despite these advantages, the low contrast in ultrasound imaging results in decreased sensitivity thus limiting the diagnostic applications of ultrasound imaging.1 To overcome this limitation, contrast-enhanced ultrasound (CEUS) utilizes microbubbles (MBs) that are typically 1 ~ 10 μm in diameter. Given their size, MBs cannot escape through endothelial barriers and are primarily used in imaging of microcirculation and vascular targets.2 To infiltrate into disease sites, the size of contrast agents should be in nanometer range. Thus, downsizing microbubbles to nanobubbles (NBs) seems to be a straightforward solution. However, the synthesis of NBs is challenging because of their low stability.3 More importantly, NBs may not have sufficient echogenicity because they are too small to efficiently scatter ultrasonic waves at the frequencies used in clinical applications. To generate sufficient ultrasound contrast while maintaining the nanometer scale size, we introduce gas-generating nanoparticles as an ultrasound imaging contrast agent.
Previously, several gas-generating particles have been developed for imaging and therapy. For example, calcium carbonate (CaCO3) nanoparticles were designed to dissolve at an accelerated rate in the acidic condition thus generating CO2.4 Also, copolymer nanoparticles utilized carbonate bonds in the polymer backbone to produce CO2 through the hydrolysis of carbonate bonds.5 Even though these nanoparticles significantly reduced the size of ultrasound contrast agents while maintaining echogenicity from generated gas bubbles, their 150 ~ 200 nm size is still too large for efficient extravasation. Recently, hydrogen-generating PdH0.2 nanocrystals with 30 nm size were developed for photoacoustic image-guided photothermal therapy.6 However, these particles may undergo a nonspecific gas release because stimuli for the gas generation, such as acidity and aqueous environment, exist outside of target sites. Finally, near-infrared (NIR) laser-triggered nitric oxide generating nanoparticles have been demonstrated for cancer therapy but these particles have not been used as contrast agents for ultrasound imaging.7–9
Our approach is based on the nanoagent consisting of a surface-modified gold nanoparticle (AuNP) as a photocatalyst and azide compounds as gas-generating precursors (Scheme 1). Upon ultraviolet (UV) irradiation, azide groups produce nitrogen gas (N2) through photolysis.10 However, UV light is not an appropriate energy source for biomedical applications because the penetration depth is extremely short as most light in UV range is blocked by skin.11 The penetration depth can be increased by using AuNPs as a photocatalyst and visible/NIR light because AuNPs can cause the photolysis of azide groups.12 In addition, AuNPs can function as a delivery vehicle and maintain the high local concentration of azide groups. The increased local concentration of azides is needed for an efficient generation of sufficient amount of nitrogen gas and, consequently, formation of echogenic N2 microbubbles.2 The chemical conjugation between azide compounds and AuNP surface is also a critical factor for the gas generation because the proximity of azides to AuNP surface ensures the photocatalytic reaction by the short-lived charge separation from the laser-irradiated AuNPs.12 Therefore, by conjugating 4-azidobenzoic acid (AzBA) onto amine groups of glycol-chitosan-coated AuNPs (GC-AuNPs), we developed a novel ultrasound contrast agent – a laser-triggered gas-generating nanoparticles (AzGC-AuNPs).
Scheme 1.
A scheme (not to scale) of gas-generating nanoparticles for an ultrasound imaging contrast agent, triggered by pulsed laser irradiation.
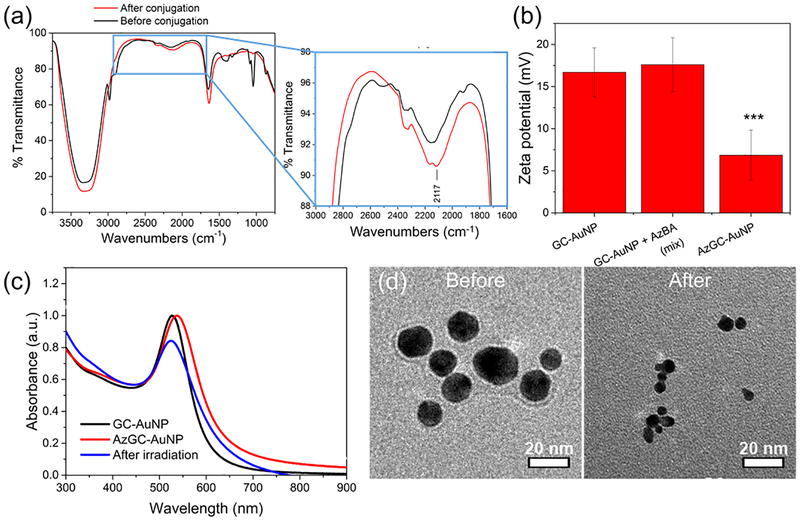
The successful synthesis of AzGC-AuNPs was confirmed through Fourier-transform infrared (FTIR) spectroscopy, zeta potential measurement, UV-vis-NIR spectrophotometry, and transmission electron microscopic (TEM) imaging. After the chemical conjugation of azide compounds, the FTIR spectrum showed the new peak at 2117 cm−1, which indicated the asymmetric vibration of -N3 (Fig. 1a, inset).13 In addition, zeta potentials changed from 16.72 ± 2.93 mV to 6.86 ± 2.96 mV (Fig. 1b). Because amine groups mainly contributed to the positive values of zeta potentials, the substitution of amine groups with azide compounds resulted in the lower values of zeta potentials.14 In contrast, simple mixture of AzBA with GC-AuNPs did not cause significant changes in zeta potentials (17.59 ± 3.19 mV). Through ANOVA analysis, we found that the zeta potentials of AzGC-AuNPs were significantly different from other two groups. (ANOVA, F2,33 = 47.71, p=1.83×10⁻¹⁰, Tukey’s post-hoc: AzGC-AuNP vs. GC-AuNP p<0.00005). The UV-vis-NIR spectrum showed the red-shift of surface plasmon resonance (SPR) peak of AuNPs from 527 nm to 539 nm (Fig. 1c). The red-shift is an indicator of successful chemical conjugation and enhanced stability of nanoparticles.15 Additionally, the spectrum was used for the quantification of AzBA molecules per GC-AuNP. From the UV absorbance of AzBA solutions at 285 nm (Fig. S1a), we produced a standard curve for the concentration (Fig. S1b). By measuring the UV absorbance of unreacted AzBA molecules in the supernatant of AzGC-AuNP after centrifugation, we calculated the concentration of AzBA molecules bonded on GC-AuNPs. According to the calculation, each particle accommodated about 6 × 10³ AzBA molecules (see Methods). Moreover, the TEM images proved that the chemical conjugation of AzBA did not change the morphology of GC-AuNPs because of their enhanced stability (Fig. 1d, “before”).16 The comparison of TEM images of AzGC-AuNPs (Fig. 1d, “before”) and uncoated AuNPs (Fig. S2) also demonstrated that the surface of each AzGC-AuNP was coated with AzBA.
Fig. 1.
Characterization of AzGC-AuNPs. (a) FTIR spectra before (black line) and after (red line) azide conjugation. A new transmittance peak appeared at 2117 cm−1 (inset), which was a characteristic of azide groups (–N3). (b) Zeta potentials of GC-AuNPs (left) and simple mixture of GC-AuNPs/AzBA (middle) were not statistically significant. In contrast, the values of AzGC-AuNPs (right) were significantly different from other two groups. (ANOVA, F2,33 = 47.71, P=1.83 × 10⁻¹⁰, Tukey’s post-hoc: AzGC-AuNP vs. GC-AuNP P<0.00005). (c) UV-vis-NIR spectrum of GC-AuNPs (black line), as prepared AzGC-AuNPs (red line), and AzGC-AuNPs after laser irradiation (blue line). (d) TEM images of AzGC-AuNPs before (left) and after (right) laser irradiation.
Laser irradiation changed the properties of AzGC-AuNPs. In contrast with the chemical conjugation, pulsed laser irradiation at 532 nm wavelength caused the blue-shift of the SPR peak from 539 to 527 nm as well as reduced amplitude of optical absorption peak (Fig. 1c). These changes suggested the formation of smaller AuNPs as a result of the photofragmentation.17, 18 Indeed, TEM images reveal the decrease of particle size from 35.72 ± 8.83 nm to 17.45 ± 5.07 nm after high energy laser irradiation (Fig. 1d, “after”). These TEM results were consistent with UV-vis-NIR spectrum of the particles. In addition, zeta potentials decreased from 6.86 ± 2.96 mV to −14.37 ± 0.72 mV after laser irradiation because of the changes in chemical structure of azide compounds after photolysis.14, 19 Size reduction of nanoparticles and negative zeta-potentials are known to be advantageous for renal clearance20 and reduced non-specific protein adsorption,21 respectively. Therefore, the changes in properties of AzGC-AuNPs after laser irradiation are advantageous if AzGC-AuNPs are to be used as an ultrasound contrast agent in biomedical applications. Furthermore, the biodistribution and toxicity of AzGC-AuNPs is expected to be the same as reported for gold nanospheres and similar gold nanoparticles further suggesting that utility of AzGC-AuNPs as ultrasound contrast agent.22, 23
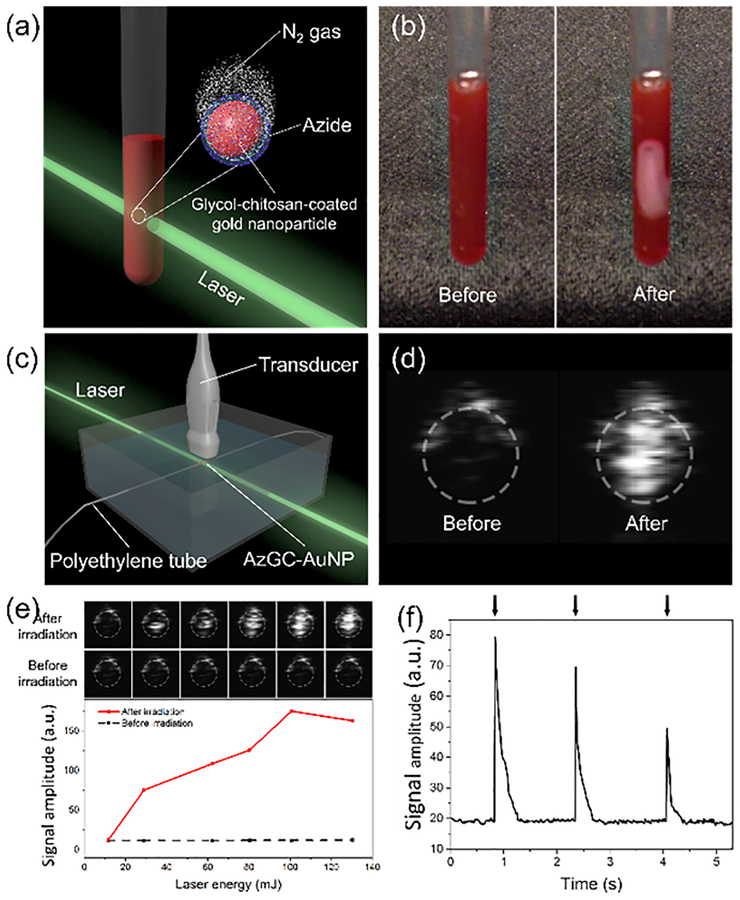
After the chemical conjugation, the photolysis of azide groups on AzGC-AuNPs and N2 generation was tested. For visual demonstration, we placed AzGC-AuNP colloid in a glass tube and irradiated it with 532-nm laser (Fig. 2a). To produce large quantity of N2 gas bubbles visible to the unaided eye, a single high energy laser pulse was used (Fig. 2b and Movie S1). According to the gas chromatography–mass spectrometry (GC-MS) analysis, the gas generated by AzGC-AuNPs mainly consisted of nitrogen (Fig. S3). Also, the possibility that the bubbles were formed with vapour was excluded because the single laser pulse used in our experiments did not increase temperature of colloid, and the lifetime of laser-induced vapour bubbles from AuNPs is typically only 0.1 ~ 0.2 μs.24 In addition, no bubbles were observed under the same experimental conditions in control groups, such as solvent (water:ethanol = 2:1), AzBA solution (2 mM), and GC-AuNP colloid without AzBA (Movie S2). Therefore, the gas bubbles were formed from N2 that originated from the azide groups photolyzed by laser-induced electrons from AuNPs.12, 25 The formation of visible N2 bubbles from AzGC-AuNPs indicates the feasibility of AzGC-AuNPs as a contrast agent for ultrasound imaging because changes in acoustic impedance caused by generated gas bubbles would produce ultrasound contrast enhancement.
Fig. 2.
Contrast enhancement of ultrasound imaging with laser-induced N2 bubbles. (a) Illustration of an experimental setup for gas-generation test. (b) Images of AzGC-AuNP colloid in a glass tube before laser irradiation (left) and N2 generation after the laser irradiation (right, high energy laser pulse at 532 nm wavelength). (c) Experimental setup for CEUS imaging with AzGC-AuNPs. (d) Ultrasound images with enhanced contrast after the laser irradiation. AzGC-AuNPs were injected in a polyethylene tube with a 0.28 mm-inner diameter and irradiated by high energy laser pulse. (e) Correlation between laser energy and averaged US signal intensity. (f) On-demand gas generation by irradiation of AzGC-AuNPs with low energy laser pulses at 532 nm wavelength.
The discovery of photocatalytic function of AuNPs for the photo-induced reduction of azide compounds is important, and out results is the first demonstration of the photolysis of azide groups caused by a laser light above UV wavelength range. Previously, quantum dots were used as a photocatalyst for the reduction of azides with light.26 However, the quantum dots are only efficient with UV light (360 ~ 450 nm wavelength) and, therefore, could not be used for imaging of deep structures. Also, vapour bubble generation from AuNPs after pulsed laser irradiation were reported.24 However, this approach cannot be applied to the CEUS imaging, because the bubble lifetime is too short (0.6 μs or less depending on laser irradiation fluence) making it difficult to visualize the vapour bubbles. Compared with the previous studies, AzGC-AuNPs have potentials for biomedical imaging applications because AzGC-AuNPs efficiently generate gas bubbles with light outside of UV range. Moreover, materials constituting the gas-generating nanoparticles (e.g., AzBA, AuNPs, GC) or produced during the laser irradiation (e.g., N2) have low toxicity.27–29
The feasibility of AzGC-AuNPs as an ultrasound contrast agent was investigated. AzGC-AuNP colloid was injected into a tube and irradiated with the 532-nm laser light (Fig. 2c). An ultrasound imaging system successfully visualized laser-induced N2 bubbles with high contrast (Fig. 2d). The ultrasound measurements also revealed that laser properties, such as laser pulse energy and number of laser pulses, affected N2 gas generation. Ultrasound signal gradually increased as the excitation energy increased (Fig. 2e). These results indicated that more N2 gas was generated with increased laser energy, and accordingly, more ultrasound was backscattered from laser-induced N2 bubbles. The concentration of AzGC-AuNPs did not affect the contrast enhancement once the concentration was sufficient to accommodate laser energy. Moreover, multiple low energy laser pulses repeatedly generated contrast enhancement, as each single laser pulse of low energy reduced only portion of azide groups (Fig. 2f and Movie S3). We observed that the peak values of ultrasound intensities decreased as subsequent laser pulses were applied because of gradual depletion of the azide groups.
The advantages of AzGC-AuNPs as a photocatalyst was that the gas generation and the ultrasound contrast enhancement were controlled by laser irradiation. Unlike conventional MBs that have low stability and short imaging time,30 AzGC-AuNPs did not present increased ultrasound signals until they reached an imaging site and were exposed to laser light irradiation. In addition, the gas generation was repeated multiple times by controlling laser irradiation parameters such as laser energy. The flash-like behaviour, i.e., repeated increase-decrease of ultrasound signals and the decreasing peak value of ultrasound intensity can be used in the background-free ultrasound imaging.31, 32 The repeated generation of N2 bubbles also indicated that the gas-generating nanoparticles were stable; the nanoconstructs did not lose their photocatalytic functionality all at once and underwent gradual photofragmentation as they produced N2 bubbles. Therefore, AzGC-AuNPs were a versatile imaging agent platform that provided controllable, on demand contrast enhancement in ultrasound imaging.
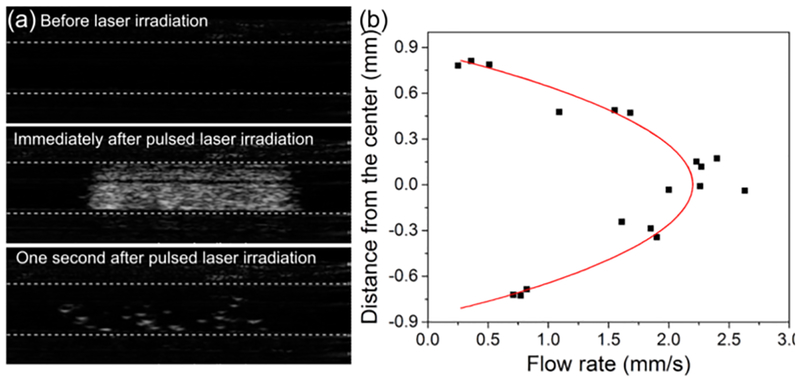
Finally, AzGC-AuNPs were used to image flow in a tube with 1.6-mm inner diameter. Using a syringe pump, we created a laminar flow of AzGC-AuNP colloid in a tube connected with a syringe. The ultrasound images of the tube were obtained during the flow formation to measure the average flow velocity, and then, once the flow was established, the images were obtained before and after laser pulse irradiated the tube with AzGC-AuNPs. The ultrasound images of flowing AzGC-AuNPs in the tube before laser pulse showed no signal because AzGC-AuNPs are too small to backscatter the ultrasound waves (Fig. 3a, top panel). Once the laser pulse irradiated the tube, the gas bubbles were formed (Fig. 3a, middle panel) and then gradually disappeared over time (Fig. 3a, bottom panel). The sequence of B-mode images captured the movement of laser-generated N2 bubbles (Movie S4). Using open source video analysis software,33 we analysed the motion in 18 regions within the tube where the gas bubbles were generated. It was found that the measured velocity distribution matched the velocity profile of fully developed laminar flow. The radial distribution of the flow rate (Fig. 3b) was approximated with the second order polynomial fitting (V(r) = A + B × r + C × r2, where V is a flow velocity, r is the radial distance from the tube centre, A = 2.22 ± 0.08 mm/s, B = 0.00 ± 0.11 s−1, C = −2.95 ± 0.23 mm−1·s−1, and R2 = 0.9196).
Fig. 3.
Flow measurement with CEUS imaging. (a) Ultrasound images of a tube with AzGC-AuNPs under the laminar flow condition before (upper panel), at (middle panel), and after (lower panel) laser irradiation. Static background was removed by taking the difference between the the current frame and frame right before the laser irradiation. (b) Flow rate distribution of selected bubbles and their second order polynomial curve fitting (R2 = 0.9196).
We compared the curve fitting parameters with independent flow velocity measurements. Specifically, the overall velocity of the flow within the tube, measured using ultrasound images of the flow before laser irradiation (see Methods), was vmean = 1.16 ± 0.17 mm/s. For the fully developed laminar flow in a tube, mean velocity vmean and velocity distribution v(r) are given by
| (1) |
| (2) |
where vmax is a maximum velocity, R is the radius of the tube, and r is the radial distance from the centre. Therefore, vmax =2.32 ± 0.34 mm/s (Eq. 1) and v(r) = 2.32 − 3.63r2 (Eq. 2). In contrast, the values obtained from the curve fitting (Fig. 3b) were vmax =2.22 mm/s and v(r) = 2.22 − 2.95r2. The small differences between the curve fitting coefficients and measured values may be due to several factors. For example, ultrasound imaging plane has finite thickness thus the flow velocity was averaged in the out-of-plane dimension which included slower-moving bubbles. Also, the buoyancy of gas bubbles can influence the results. Finally, the imaging plane could be slightly off-centre. Nevertheless, the fitted curve showed expected parabolic flow profile described by Eq. (2), and good correlation between ultrasonic and independently measured values. This B-mode flow study suggests that laser-triggered gas-generating AzGC-AuNPs provide contrast in ultrasound imaging.
Using AzGC-AuNPs, we demonstrated a novel concept in design and synthesis of contrast agent for ultrasound imaging. Importantly, the developed nanoparticles are below 100 nm, which are at least an order of magnitude smaller than conventional MBs. Given the nanometer size of the AzGC-AuNPs, we expect that the developed contrast agent would penetrate the endothelial barrier2 and, therefore, be used for the diagnosis of a wide variety of diseases that conventional MBs cannot reach and detect. Moreover, AzGC-AuNPs have smaller particle size and negative zeta potentials after gas generation facilitating blood residency and clearance. Current spherical AzGC-AuNPs have limited applications in vivo because the optical absorption of individual AzGC-AuNPs is in 520 ~ 530 nm range. However, the same synthesis method can be applied to gold nanorods or other particles absorbing in near infrared range. Therefore, AzGC-AuNPs have great potentials as an ultrasound contrast agent platform within broad range of wavelength. In addition, the applications of gas-generating nanoparticles are not limited to ultrasound imaging. The N2 bubbles from AzGC-AuNPs along with unique properties of gold nanoparticles can be utilized in multimodal imaging contrast such as optical coherence tomography and MRI.34, 35 Overall, AzGC-AuNPs may significantly expand the applications of ultrasound and other medical imaging technologies where gas bubbles produce change of the signal and, therefore, contrast.
Supplementary Material
Acknowledgements
This work was supported in part by grants from Breast Cancer Research Foundation under grant BCRF-18–043 and National Institutes of Health under grants EB008101 and CA149740.
Footnotes
Electronic Supplementary Information (ESI) available: Experimental details, videos of nitrogen gas generation from gas-generating nanoparticles or control groups after laser irradiation, B-mode ultrasound imaging of gas-generating nanoparticles with laser irradiation in a stationary or flow condition. See DOI: 10.1039/x0xx00000x
Conflicts of interest
There are no conflicts to declare.
Notes and references
- 1.Mostbeck G, Adam EJ, Nielsen MB, Claudon M, Clevert D, Nicolau C, Nyhsen C and Owens CM, Insights into Imaging, 2016, 7, 255–263. [DOI] [PMC free article] [PubMed] [Google Scholar]
- 2.Hernot S and Klibanov AL, Advanced Drug Delivery Reviews, 2008, 60, 1153–1166. [DOI] [PMC free article] [PubMed] [Google Scholar]
- 3.Perera RH, Hernandez C, Zhou HY, Kota P, Burke A and Exner AA, Wiley Interdisciplinary Reviews-Nanomedicine and Nanobiotechnology, 2015, 7, 593–608. [DOI] [PMC free article] [PubMed] [Google Scholar]
- 4.Min KH, Min HS, Lee HJ, Park DJ, Yhee JY, Kim K, Kwon IC, Jeong SY, Silvestre OF, Chen XY, Hwang YS, Kim EC and Lee SC, Acs Nano, 2015, 9, 134–145. [DOI] [PMC free article] [PubMed] [Google Scholar]
- 5.Min HS, Son S, You DG, Lee TW, Lee J, Lee S, Yhee JY, Lee J, Han MH, Park JH, Kim SH, Choi K, Park K, Kim K and Kwon IC, Biomaterials, 2016, 108, 57–70. [DOI] [PubMed] [Google Scholar]
- 6.Zhao PH, Jin ZK, Chen Q, Yang T, Chen DY, Meng J, Lu XF, Gu Z and He QJ, Nature Communications, 2018, 9. [DOI] [PMC free article] [PubMed] [Google Scholar]
- 7.Garcia JV, Yang JP, Shen DK, Yao C, Li XM, Wang R, Stucky GD, Zhao DY, Ford PC and Zhang F, Small, 2012, 8, 3800–3805. [DOI] [PubMed] [Google Scholar]
- 8.Guo RR, Tian Y, Wang YJ and Yang WL, Advanced Functional Materials, 2017, 27. [DOI] [PMC free article] [PubMed] [Google Scholar]
- 9.Zhang X, Tian G, Yin WY, Wang LM, Zheng XP, Yan L, Li JX, Su HR, Chen CY, Gu ZJ and Zhao YL, Advanced Functional Materials, 2015, 25, 3049–3056. [Google Scholar]
- 10.Budruev AV, Karyakina LN and Oleinik AV, High Energy Chemistry, 2004, 38, 20–24. [Google Scholar]
- 11.Meinhardt M, Krebs R, Anders A, Heinrich U and Tronnier H, Journal of Biomedical Optics, 2008, 13, 044030. [DOI] [PubMed] [Google Scholar]
- 12.Alvaro M, Aprile C, Ferrer B, Sastre F and Garcia H, Dalton Transactions, 2009, DOI: 10.1039/b906326a, 7437–7444. [DOI] [PubMed] [Google Scholar]
- 13.Lieber E, Rao CNR, Chao TS and Hoffman CWW, Analytical Chemistry, 1957, 29, 916–918. [Google Scholar]
- 14.Das M, Mishra D, Maiti TK, Basak A and Pramanik P, Nanotechnology, 2008, 19, 415101. [DOI] [PubMed] [Google Scholar]
- 15.Sun IC, Na JH, Jeong SY, Kim DE, Kwon IC, Choi K, Ahn CH and Kim K, Pharm Res, 2014, 31, 1418–1425. [DOI] [PubMed] [Google Scholar]
- 16.Sun IC, Eun DK, Koo H, Ko CY, Kim HS, Yi DK, Choi K, Kwon IC, Kim K and Ahn CH, Angewandte Chemie-International Edition, 2011, 50, 9348–9351. [DOI] [PubMed] [Google Scholar]
- 17.Abdelhamid S, Saleh H, Abdelhamid M, Gohar A and Youssef T, Journal of Biomedical Optics, 2012, 17, 068001. [DOI] [PubMed] [Google Scholar]
- 18.Amendola V and Meneghetti M, Journal of Physical Chemistry C, 2009, 113, 4277–4285. [Google Scholar]
- 19.Bou-Hamdan FR, Levesque F, O’Brien AG and Seeberger PH, Beilstein Journal of Organic Chemistry, 2011, 7, 1124–1129. [DOI] [PMC free article] [PubMed] [Google Scholar]
- 20.Alric C, Miladi I, Kryza D, Taleb J, Lux F, Bazzi R, Billotey C, Janier M, Perriat P, Roux S and Tillement O, Nanoscale, 2013, 5, 5930–5939. [DOI] [PubMed] [Google Scholar]
- 21.Patil S, Sandberg A, Heckert E, Self W and Seal S, Biomaterials, 2007, 28, 4600–4607. [DOI] [PMC free article] [PubMed] [Google Scholar]
- 22.Daniel MC and Astruc D, Chemical Reviews, 2004, 104, 293–346. [DOI] [PubMed] [Google Scholar]
- 23.Murphy CJ, Gole AM, Stone JW, Sisco PN, Alkilany AM, Goldsmith EC and Baxter SC, Accounts of Chemical Research, 2008, 41, 1721–1730. [DOI] [PubMed] [Google Scholar]
- 24.Kitz M, Preisser S, Wetterwald A, Jaeger M, Thalmann GN and Frenz M, Biomedical Optics Express, 2011, 2, 291–304. [DOI] [PMC free article] [PubMed] [Google Scholar]
- 25.Warrier M, Lo MKF, Monbouquette H and Garcia-Garibay MA, Photochemical & Photobiological Sciences, 2004, 3, 859–863. [DOI] [PubMed] [Google Scholar]
- 26.Radhakrishnan C, Lo MKF, Warrier MV, Garcia-Garibay MA and Monbouquette HG, Langmuir, 2006, 22, 5018–5024. [DOI] [PubMed] [Google Scholar]
- 27.Fan JH, Hung WI, Li WT and Yeh JM, 13th International Conference on Biomedical Engineering, Vols 1–3, 2009, 23, 870–873. [Google Scholar]
- 28.Yeo Y, Burdick JA, Highley CB, Marini R, Langer R and Kohane DS, Journal of Biomedical Materials Research Part A, 2006, 78a, 668–675. [DOI] [PubMed] [Google Scholar]
- 29.Kim JH, Kim YS, Kim S, Park JH, Kim K, Choi K, Chung H, Jeong SY, Park RW, Kim IS and Kwon IC, J Control Release, 2006, 111, 228–234. [DOI] [PubMed] [Google Scholar]
- 30.Yang F, Gu A, Chen Z, Gu N and Ji M, Materials Letters, 2008, 62, 121–124. [Google Scholar]
- 31.Luke GP, Hannah AS and Emelianov SY, Nano Letters, 2016, 16, 2556–2559. [DOI] [PMC free article] [PubMed] [Google Scholar]
- 32.Yoon H, Yarmoska SK, Hannah AS, Yoon C, Hallam KA and Emelianov SY, Med Phys, 2017, 44, 3444–3449. [DOI] [PMC free article] [PubMed] [Google Scholar]
- 33.Brown D, Available from http://physlets.org/tracker/, 2017.
- 34.Assadi H, Demidov V, Karshafian R, Douplik A and Vitkin IA, Journal of Biomedical Optics, 2016, 21, 076014. [DOI] [PubMed] [Google Scholar]
- 35.Peng SL, Wang FN, Wang CH, Peng HH, Lu CT and Yeh CK, NMR in Biomedicine, 2013, 26, 1540–1546. [DOI] [PubMed] [Google Scholar]
Associated Data
This section collects any data citations, data availability statements, or supplementary materials included in this article.


