

Abstract
The extensive range of chemical structures, wide range of abundances, and chemical instability of metabolites present in the metabolome pose major analytical challenges that are difficult to address with existing technologies. To address these issues, one approach is to target a subset of metabolites that share a functional group, such as ketones and aldehydes, using chemoselective tagging. Here we report a greatly improved chemoselective method for the quantitative analysis of hydrophilic and hydrophobic carbonyl-containing metabolites directly in biological samples. This method is based on direct tissue or cells extraction with simultaneous derivatization of stable and labile carbonylated metabolites using N-[2-(aminooxy)ethyl]-N,N-dimethyl-1-dodecylammonium (QDA) and 13CD3 labeled QDA. We combined innovations of direct quenching of biological sample with frozen derivatization conditions under the catalyst N,N-Dimethyl-p-phenylenediamine, which facilitated the formation of oxime stable-isotope ion pairs differing by m/z 4.02188 while minimizing metabolite degradation. The resulting oximes were extracted by HyperSep C8 tips to remove interfering compounds, and the products were detected using nano-electrospray ionization interfaced with a Thermo Fusion mass spectrometer. The quaternary ammonium tagging greatly increased electrospray MS detection sensitivity and the signature ions pairs enabled simple identification of carbonyl compounds. The improved method showed the lower limits of quantification for carbonyl standards to be in the range of 0.20–2 nM, with linearity of R2 > 0.99 over 4 orders of magnitude. We have applied the method to assign 66 carbonyls in mouse tumor tissues, many of which could not be assigned solely by accurate mass and tandem MS. Fourteen of the metabolites were quantified using authentic standards. We also demonstrated the suitability of this method for determining 13C labeled isotopologues of carbonyl metabolites in 13C6-glucose-based stable isotope-resolved metabolomic (SIRM) studies.
Keywords: carbonyl, ketone, aldehyde, mass spectrometry, stable isotope-resolved metabolomics, 13C isotopologues, nanoelectrospray
Entry for Table of Contents
The investigators report a dramatically improved chemoselective analysis for carbonyls in crude biological extracts by turning to a catalyst and freezing conditions for derivatization.
1. Introduction
Metabolite analysis has provided new insights into the metabolic status and pathway dynamics in cells, tissues and biofluids. Biological interpretation is extremely complex, as each metabolite may participate in multiple interconnecting pathways. Measurement of steady-state metabolite concentrations alone cannot definitively discriminate pathway activities 1, 2. Resolving pathways with an estimation of their flux is a prerequisite for gaining mechanistic understanding of perturbed organismal homeostasis 3. In situ biochemical reaction tracer approaches, such as stable isotope resolved metabolomics (SIRM), utilize stable isotope-enriched precursors, and trace isotopes at the atomic level from the source molecules through their metabolic transformation using mass spectrometry (MS) and nuclear magnetic resonance spectroscopy (NMR). The resulting data contains information on differential and total stable-isotope incorporation into metabolites, and is thus able to distinguish parallel and interacting pathways 1, 4. SIRM is distinct from other in situ isotopic introduction methods, such as isotopic ratio outlier analysis (IROA) 5 that is designed to introduce isotope tags for internal standards on MS-based metabolic profiling, and thus not about pathway disambiguation or flux analysis. Although advances in MS and NMR have made large-scale analysis of the metabolome possible 6, numerous challenges remain regarding metabolite coverage, identification, and reliable quantification. The problem is exacerbated in SIRM studies as multiple isotopologues or isotopomers of the same metabolite are produced due to multiple parallel pathways underlying the biosynthesis, which greatly increases spectral complexity 4, 7–9.
Metabolomes comprise a large number of carbonyl-containing metabolites (CCM) that are intermediates in a wide range of biochemical pathways and are critically important for pathway elucidation. Many CCM are non-ideal MS analytes because of: (i) low ionization efficiency, (ii) biochemical instability,10, 11 (iii) exhibiting wide range of physicochemical properties, from hydrophilic to extremely hydrophobic, and (iv) a vast concentration range between different carbonyl metabolites, all of which present difficult challenges for simultaneous determination of CCM on a single analytical platform. Some α-keto acids are intrinsically unstable and readily decarboxylate, or react with nucleophiles. In these cases, stabilization by derivatization is a viable, proven strategy for quantitative analysis 12, 13. Pre-concentration of analytes in biological samples using magnetic beads and various adsorbents is becoming increasingly used 14; however, stability of analytes during processing is a concern, especially for liable carbonyls. Other carbonyls may degrade under certain analytical conditions 10. For example, ion chromatography (IC)-MS has recently passed an ion-suppression performance threshold to emerge as powerful separation tool for MS-based metabolomic analysis 15, 16, though glyceraldehyde-3-phosphate (GAP) and dihydroxyacetonephosphate (DHAP) decompose in IC due to the KOH gradient in the mobile phase 17. Further complicating the carbonyl analyses is the high sensitivity requirement, as CCM are often low in abundance, particularly in SIRM studies where detection limits are further challenged by the distribution of ion signals across numerous, multiply labeled isotopologues of metabolites.
Various methods have been developed to analyze different CCM 18, 19. Liquid chromatography (LC) coupled to MS represents one of the most sensitive analytical platforms 13, 17, 20. Chemical derivatization combined with LC-MS analysis also has shown analytical benefits by enhancing MS sensitivity, increasing reversed-phase liquid chromatographic retention, facilitating CCM extraction from biological samples, and stabilizing labile analytes 21–25. However, LC-MS has low sample throughput, and SIRM studies require ultra high resolution (UHR) MS since the goal is to determine all possible isotopologues. The term UHR is used here to distinguish the Thermo Fusion (resolution =370,000 at m/z=400) used in this study from most other instruments, even some other Orbitraps, because it achieves: (a) an order of magnitude higher resolution than many other “high resolution” instruments such as time-of-flight MS (resolution <50,000 at m/z=400); (b) it represents a resolution range necessary for accurate-mass values to generate a reasonably short list of molecular formulae when analyzing a complex, multiply isotope-enriched mixture of metabololites; and (c) achieves in real samples, sufficient resolving power to distinguish among thousands of m/z values representing multiple isotopologues of hundreds of metabolites 26. This requirement for UHR-MS results in long spectral cycle time that in turn negates advantages of combined high-resolution and high-speed chromatography. As single methods are often insufficient to cover the wide chemical diversity of CCM required for metabolomics, multiple LC analyses for sufficient carbonyl metabolome coverage further slows analytical throughput.
We have previously reported a chemoselective (CS) derivatization method using an isotopic pair of N-[2-(aminooxy)ethyl]-N,N-dimethyl-1-dodecylammonium (QDA, Figure. 1) and 13CD3 labeled QDA (*QDA) to profile CCM in crude cell extracts using direct nanoelectrospray ionization (nESI) coupled with UHR-Fourier transform MS (FT-MS) 27, 28. This method has the advantages of simple removal of matrix ion interference (by the hydrophobic property of the derivative products), high analytical throughput (by direct infusion), capability of extensive MSn experiments or trees on targeted or data-dependent modes, high sensitivity (by the permanent positively charged quaternary ammonium group in the derivatives), and ease of carbonyl-class assignment (by discerning a characteristic pair of derivatives that differed by 4.02188 Da, i.e. mass of 13CD3). However, our QDA method previously called for 23 hours of incubation at 40 °C and n-butanol extraction, which was not optimal in terms of convenience, sample throughput, maintenance of metabolite stability, high recovery, and robust quantification. Thus, we continued to develop the method to dramatically improve all of the chemoselective aspects. Our key strategies were based on goals to accelerate the reaction rate using aniline or derivatives as a catalyst 29, 30 and incorporating innovation inspired by a recent demonstration that freezing the reaction mixture led to increased oxime production by 2 orders of magnitude 31. We also improved the biological relevance of the quantification by reducing degradation losses, achieved by directly quenching biological samples with the chemoselective cocktail.
Figure 1.

Chemical reaction scheme between QDA/*QDA and carbonyls. DMP: N,N-Dimethyl-p-phenylenediamine
Here we report our investigations of the effects of freezing during derivatization and the use of aniline as a catalyst to boost the reaction between CCM and QDA/*QDA to optimize product formation while minimizing the consumption of the CS probes. We have also drastically improved the sample cleanup procedure by utilizing C8 Ziptip instead of n-butanol extraction. These improvements resulted in rapid, sensitive, and robust quantification of 14 standard-verified ketone and aldehyde metabolites in mammalian cells and tissues, and detection of many more. These metabolites included reactive carbonyl species, reducing sugars and their phosphates, and metabolites involved in central carbon metabolism. We also demonstrate a workflow for untargeted analysis of carbonyls and their labeled isotopologues in SIRM studies, based on the accurate mass and characteristic fragment ions of QDA derivatives.
2. Experimental
2.1. Reagents
N-[2-(Aminooxy)ethyl]-N,N-dimethyl-1-dodecylammonium iodide (QDA) and *QDA (13CD3-labeled QDA) were prepared according to our previously published method 32. Acetoacetate lithium, pyruvate sodium, glyceraldehyde-3-phosphate (GAP), malondialdehyde (MDA) tetrabutylammonium, adenosine 5’-diphosphoribose (ADP-ribose) sodium, glucose-6-phosphate (Glc-6P), D-(−)-ribose, 2-deoxy-D-ribose, D-ribose-5-phosphate (Ribose-5P) barium, glucose, 13C6-glucose (13C6-Glc), and deuterated acetone (acetone-d6) were purchased from Sigma-Aldrich (St. Louis, MO, USA), while α-ketoglutarate (α-KG), pyridoxal phosphate (PLP) monohydrate, D-(+)-galacturonic acid monohydrate were purchased from ACROS Organics (Geel, Belgium), and 4-hydroxynonenal (4-HNE) was purchased from Cayman Chemical Company (Ann Arbor, MI, USA). N,N-Dimethyl-p-phenylenediamine (DMP) oxalate was purchased from Eastman Kodak Company (Rochester, NY, USA). All other reagents were of analytical grade and were obtained from Sigma-Aldrich (St. Louis, MO, USA). Deionized water was obtained from a Milli-Q gradient water purification system (Millipore, Billerica, MA, USA). Acetone-d6 was reacted with QDA/*QDA under the conditions reported previously 27, the resulting solution containing 1 μM acetone-d6-QDA/*QDA, which was used as an internal standard (IS).
2.2. Derivatization and extraction of cell cultures and patient-derived mouse xenografts
Human lung adenocarcinoma A549 cells were cultured as previously reported 27. For 13C tracer experiments, three replicates of A549 cells were grown in glucose-free DMEM medium supplemented with dialyzed FBS (Life Technologies, Carlsbad, CA) to 10% and 10 mM 13C6-Glc for 24 h as previously described 33. When cells became 70% confluent, the medium was removed and the cells were washed quickly three times with ice-cold phosphate buffered saline (PBS), followed immediately by addition of 1 mL of cold acetonitrile (−20 °C) containing 20 μM each of QDA and *QDA to quench metabolism by denaturing proteins. Then, 1 mL of nanopure water was added before the cells were scraped from the plate and collected into a 15 mL polypropylene conical centrifuge tube (Sarstedt, Newton, NC). These steps were repeated once to collect any remaining cells. Ten microliter of the catalyst DMP solution (prepared by dissolving 5.0 mg DMP in 180 μL acetonitrile) was added to the cell lysate to reach a final concentration of 0.2 mM in each sample. The samples were then mixed for 30 sec and stored at −80 °C for 3 h to allow the reactions between QDA and CCM to complete. After the reaction and centrifugation to remove cell debris, 400 μL of the extract was aliquoted into a tube containing 10 μL of acetone-d6-QDA/*QDA as internal standard. A blank cell culture plate was treated similarly for use as a control. The extracts were lyophilized and stored at −80 °C prior to UHR FT-MS analysis. The metabolite data were normalized to the total protein content in each cell sample as determined by a Pierce BCA Protein Assay Kit (23225, Pierce Thermo Fisher Scientific).
For the SIRM study in animal models, we introduced [13C6]-glucose via a liquid diet to NOD/SCID/Gamma (NSG) mice bearing non-small cell lung cancer patient-derived xenograft according to our protocol (manuscript submitted to Nature Communication). At the end of the 18 h feeding period, mice were sacrificed and tumors were harvested and snap-frozen in liquid nitrogen. Four frozen tissues were pulverized in liquid nitrogen using a Spex freezer mill (SPEX Sampleprep, Metuchen, NJ, USA). Fine powder of each tumor sample (ca. 20 mg) was weighted into a 15 mL polypropylene conical centrifuge tube and reacted with QDA/*QDA in acetonitrile as described above.
2.3. Extraction of derivatized ketones and aldehydes
Lyophilized samples were reconstituted in 80 μL water containing 0.1% formic acid. After vortex mixing, the sample was loaded onto the HyperSep C8 tip (Thermo Fisher Scientific, Waltham, MA USA), which was prewashed with methanol and conditioned with 0.1% formic acid before use. Sample loading was accomplished by approximately fifteen up-down pipette draws. After washing with 0.1% formic acid, derivatized carbonyls were eluted from the tip into the 96-well plate with 40 μL of methanol containing 0.1% formic acid.
2.4. UHR FT-MS analysis of carbonyl-QDA/*QDA derivatives
UHR FT-MS analysis was carried out using a Thermo Fusion Tribrid Orbitrap mass spectrometer (Thermo Fisher Scientific, San Jose, CA, USA) equipped with TriVersa Nanomate (Advion Bioscience Ltd., Ithaca, NY, USA). Ion source voltage of +1.6 kV and gas pressure of 0.6 psi on the Nanomate were employed for the analysis of CCM-QDA/*QDA derivatives. The Nanomate system includes a cooling unit to keep the sample tray at 4 °C, which helped reduce sample evaporation and maintain analyte stability. The Nanomate was controlled by Chipsoft 7.2.0 software. All UHR FT-MS data were recorded in profile mode using a maximum injection time of 100 ms, automated gain control target of 2.5 × 10⁵ and five microscans. The Fusion was tuned and calibrated according to the manufacturer’s standard recommendations to achieve a mass accuracy of about 0.5 ppm or better. Typically, 10-min of signal averaging in the profile mode was employed for each mass spectrum. During method development when derivatization reactions were performed using chemical standards, data were acquired for 2 min to quickly estimate the reaction efficiency. In the data-dependent TopN MS/MS analysis, the targeted mass difference at 4.0219 Da was used as a data-dependent filter with a higher-energy C-trap dissociation at 40% normalized energy and a 2- to 5-min of signal averaging in the profile mode. The isolation window of precursor ion for MS/MS analysis was 1 Da. All of MS and MS/MS spectra were automatically acquired by a customized sequence subroutine operated under Orbitrap 2.2 (Thermo Fisher Scientific, Inc.). Data processing including m/z correction and assignment were conducted using an in-house software Precalculated Exact Mass Isotopologue Search Engine (PREMISE), as described previously 34. The fractional 13C enrichment in metabolites was obtained after natural abundance correction using the procedure described previously 35. Quantification was performed by normalizing MS signal intensity of CCM-QDA derivatives to the internal standard acetone-d6-QDA.
2.5. Method validation
The reliability of nanoESI(+)-UHR-FT-MS for the quantification of CCM in biological samples was validated by investigations of linearity, lower limit of quantification (LLOQ), upper limit of quantification (ULOQ), lower limit of detection (LLOD), precision, extraction recovery, and stability. Solid and liquid chemical standards were weighed, dissolved, and diluted in methanol or water to yield stock solutions of 100 mM (per analyte, respectively). The stock solutions were aliquoted and stored at −80 °C until use. For the construction of calibration curves, aliquots were thawed and mixed to obtain a single 14-analyte stock solution at 6.25 mM each. Since our biological extracts were high in matrix salts, we employed a pseudo-matrix matching calibration approach as suggested by Panuwet et al. 36 by using a pooled cell lysate as surrogate matrix. Eight point calibration curves were prepared by fortifying cell lysate with the standard solutions in concentrations ranging from 0.68 nM to 5.49 μM for ribose-5P, 1.00 nM to 8.06 μM for Glc-6P, glucose, and ribose, 1.99 nM to 1.61 μM for ADP-ribose, and 0.199 nM to 1.61 μM for the other analytes, The LLODs and LLOQs were defined as the concentrations that led to MS peak intensities with signal-to-noise ratios (S/N) of 3 and 10, respectively, according to the US FDA Guideline for Bioanalytical Method Validation 37. The precision of the quantification was measured as the intra-day coefficient of variation (CV), which was determined by injecting analytical replicates (n = 3 for each matrix) prepared from aliquots of cell lysates and mouse tumor tissue extracts every 3 h in a single day.
The HyperSep C8 tip extraction recovery was estimated for the 14 carbonyl-QDA derivatives at two concentrations (i.e. the lower (LLOQ) and upper limit of quantification (ULOQ)), by comparing peak area ratios of the analytes to IS in samples that were spiked with the analytes prior to HyperSep C8 tip extraction with those in samples to which the analytes were added post-extraction. Spiked-post-extraction samples represented 100% recovery.
For the stability test of the derivatives, the C8-tip eluant from cell and tissue samples (3 replicates for each matrix) were kept in the 96-well plate in the Nanomate at 6 °C for 12 h with Teflon-faced sealing film (BioTech Solutions, Vineland, NJ). These results were compared with those obtained from T0 samples. The analytes were considered to be stable when 85–115% of the initial concentration was recovered.
3. Results and discussion
3.1. Accelerated Derivatization of Carbonyls Under Frozen Conditions
The reaction between ketones and aldehydes with an aminooxy group to form oxime derivatives is reported to be slow, especially at neutral pH 38. In our previous report, we adopted 23 hours at 40°C to achieve acceptable reaction between CCM and QDA 27. Although chemical reaction rates typically decrease with decreasing temperature, Agten et al. 31 recently demonstrated that freezing accelerated the aminooxy reaction with carbonyls and three freeze/thaw cycles resulted in increased yields of oxime products.
We therefore investigated the effect of freezing on the oxime formation between QDA and CCM using the 14 standards. This standard mixture was reacted with QDA/*QDA (molar ratio 1:1) in water:methanol (1:1, v/v) at −80 °C for 23 hours. The molar ratio of QDA and *QDA was approximately 20 relative to the standards in the reaction mixture. A parallel reaction was carried out under 40 °C for 23 hours. We found that the yields of oxime products using the freezing method ranged from 40 to 100% of the yields obtained at 40 °C with the lowest yields observed for sugars and sugar phosphates, possibly due to the low concentration of the reactive open chain forms under these conditions. In an attempt to increase the oxime yield, we carried out three freeze/thaw cycles, which was reported to increase the oxime yield 31. In each cycle, the samples were frozen at −80 °C for 12 h and subsequently thawed. We found little improvement for the yield of oxime for 4-HNE and MDA. In the case of PLP, a significant decrease of derivatives was observed, which could be indicative of degradation during repetitive freeze-thaw cycles (data not shown).
We then tested the aniline reagent N,N-dimethyl-p-phenylenediamine (DMP) for its ability to catalyze the formation of oximes from carbonyl standards and QDA/*QDA. These standards were reacted with QDA/*QDA in the presence of 0, 0.2 or 2 mM DMP for 23 h at −80 °C. We found that, compared with the samples without DMP, 0.2 mM DMP increased the oxime yields for most of the tested standards by about 1.5- to 4-fold and achieved comparable or better (e.g. for 4-HNE and MDA) UHR FT-MS detection than heating at 40 °C for 23 hours (Figure. 2). For the samples with 2 mM DMP, considerable suppression of UHR FT-MS ion intensities was observed for the target analytes, which most likely resulted from interference in the nanoESI(+) from the large excess of DMP. We also tested the effect of DMP on the reaction at 40°C, which showed DMP oxidation after heating, resulting in a purple solution with no enhancement of the oxime yield (data not shown). Taken together, these results indicated that 0.2 mM DMP plus freezing were superior conditions for adduct formation between QDA and carbonyls.
Figure 2.

UHR FT-MS analysis results of the adducts of QDA with a mixture of 14 carbonyl standard compounds under different conditions. The ordinate is normalized peak intensity from the UHR FT-MS as defined Methods. The reactions conditions are described in the method section. Blue bar: frozen at −80 °C for 18 h without DMP. Red bar: reaction at 40 °C for 23 h without DMP. Black bar: frozen at −80 °C for 18 h with DMP.
We then investigated the reaction time course using the 14 carbonyl standards to establish QDA derivative yield and reaction linearity. Mixed standard solutions were reacted with QDA/*QDA in the presence of 0.2 mM DMP at −80 °C from 30 min to 18 h. The reaction time course is shown in Figure 3. The reactions appeared complete well before 18 h, and the original aldehydes or ketones were undetectable at the time point (data not shown). Since QDA was in excess, the reaction is pseudo first-order, and the time course of the product, p, formation is given by:
| (1) |
where k is the pseudo first order rate constant and a is the amplitude. We fit Eq. (1) to the data using non-linear regression, and the optimal values of the two parameters were determined with their standard errors and overall fitting statistics (Table S-1 and Figure S-3). For most of the carbonyl standards tested, the reaction was approximately 80–100 % complete within 3 h. Therefore, a 3 h reaction time was considered practical for the QDA derivatization.
Figure 3.

Time-dependent reaction efficiency of QDA with carbonyl standards. Mixed standard solutions were reacted with QDA/*QDA using d6-acetone as the internal standard in the presence of 0.2 mM DMP at −80 °C for different time period, followed by UHR FT-MS analysis.
We also optimized the QDA/*QDA reagent molar ratio to carbonyl analytes for derivatization. The optimum ratio is critical since a large excess of the reagent may result in irreproducible recovery of derivatives from C8-tip due to its binding to the C8 material, and ion suppression from the large excess of QDA/*QDA could be detrimental to quantification by UHR FT-MS. A cell lysate sample spiked with carbonyl standards at 100 nM with varying amounts of QDA/*QDA (mole ratio from 1:1 to 1:1000 times of the spiked carbonyl level) was tested using extraction with C8 tips. Because the CCM concentrations are not known a priori, we empirically settled on 20 μM QDA/*QDA reagent. In practice, this amount represented an addition of 80 nmol each of QDA and *QDA to cells samples that contain approximately 0.5 mg of total proteins.
3.2. Optimization of Sample Cleanup
Our previous method for the cleanup of QDA derivatives from biological extracts used n-butanol extraction 27, which is suboptimal in terms of the yield and ease of operation. To improve these aspects, we explored solid-phase microextraction methods based on different reversed-phase tips, as the hydrophobic QDA is expected to increase the retention of small carbonyl derivatives in reversed-phase tips. However, for those hydrophobic metabolites that already interact strongly with the C18 stationary phase, C8 or C4 tips may be preferred. The extraction efficiency of the three types of reversed-phase tips was compared using QDA/*QDA derivatized cell samples (supporting information, Figure S-1). For hydrophilic metabolites such as sugars and sugar phosphates, the highest extraction recovery was observed with the C18 tip, whereas for MDA/methylglyoxal with two QDA-adducted aldehyde groups, the recovery with C4 tips was at least twice that of the other tips. Similarly, for hydrophobic metabolite 4-HNE, the recovery using the C4 and C8 tips was higher than that using the C18 tip. Thus, in order to cover a broad spectrum of CCM, C8 tips was chosen in the current study, which provide a good compromise in the recovery of both hydrophilic and hydrophobic analytes. This choice allowed for combined cleanup and concentration of derivatized metabolites, which will be more amenable for high-throughput applications. For applications favoring hydrophilic or hydrophobic analytes, the analyst should investigate the efficacy of different tips suited to the experimental needs.
3.3. Sensitivity, Linearity and Precision of the QDA Method
In the present study, about 1/10 (ca. 2.0×10⁵ cells) of a 10 cm plate cell lysate and ca. 2 mg (wet weight) of the mouse tissue were consumed for the method described above, that is, consisting of 20 μM QDA/*QDA with 0.2 mM DMP at −80 °C for 3 h, with extraction using C8 tips. This illustrates the high sensitivity of this method for CCM analysis, which translates into low sample consumption. The precision of quantification is demonstrated by intraday coefficients of variation (CVs) from three analytical replicates of cell and tissue extracts listed in Table 1. The data were normalized to cell protein contents and tissue weight and all of the CVs were <11% with many <5%. The stability of the derivatives in the C8-tip eluent was also evaluated; no changes in the analyte/IS intensity ratio were observed for any analytes when the samples were kept at 4 °C in the Advion autosampler for 12 h (data not shown). This demonstrated the capacity of QDA derivatization in stabilizing labile CCM (e.g. 4-HNE, MDA). Changes in analyte/IS intensity ratio and large intraday CV (>15%) was observed in samples kept at 4 °C in the autosampler for more than 24 h. This could be because of the QDA derivatives degradation and unevenly solvent evaporation. Therefore, we would suggest a maximum of 12 h storage in autosampler at 4°C for large cohort study.
Table 1.
Performance summary of the QDA method using nanoESI(+) UHR FT-MS.
| Analyte | LLOD (nM) | LLOQ (nM) | Linearity range | R2 | Intraday CV% | |
|---|---|---|---|---|---|---|
| Cell lysate | Tissue | |||||
| Pyruvate | 0.07 | 0.20 | 0.20 nM-1.61 μM | 0.9991 | 4.8 | 9.6 |
| α-KG | 0.07 | 0.20 | 0.20 nM-1.61 μM | 0.9998 | 7.4 | 6.7 |
| GAP | 0.07 | 0.20 | 0.20 nM-1.61 μM | 0.9981 | 3.1 | 6.4 |
| PLP | 0.07 | 0.20 | 0.20 nM-1.61 μM | 0.9990 | 1.7 | 4.8 |
| Glc-6P | 0.33 | 1.00 | 1.00 nM-8.06 μM | 0.9986 | 5.5 | 5.6 |
| Ribose-5P | 0.23 | 0.68 | 0.68 nM-5.49 μM | 0.9977 | 7.1 | 8.0 |
| Glucose | 0.33 | 1.00 | 1.00 nM-8.06 μM | 0.9983 | 1.4 | 10.7 |
| ADP-ribose | 0.66 | 1.99 | 1.99 nM-1.61 μM | 0.9973 | 6.0 | 5.0 |
| Acetoacetate | 0.07 | 0.20 | 0.20 nM-1.61 μM | 0.9997 | 3.9 | 10.4 |
| Deoxyribose | 0.07 | 0.20 | 0.20 nM-1.61 μM | 0.9988 | 8.8 | 9.5 |
| Ribose | 0.33 | 1.00 | 1.00 nM-8.06 μM | 0.9962 | 3.5 | 9.8 |
| Galacturonic acid | 0.07 | 0.20 | 0.20 nM-1.61 μM | 0.9989 | 10.1 | 5.3 |
| MDA | 0.07 | 0.20 | 0.20 nM-1.61 μM | 0.9993 | 2.4 | 7.8 |
| 4-HNE | 0.07 | 0.20 | 0.20 nM-1.61 μM | 0.9994 | 3.3 | 3.3 |
Table 1 shows the linearity of the response of the QDA derivatives, which was excellent in the concentration ranges shown for the target analytes. This represents an analytical dynamic range of 1000 fold or more, and in practice appeared to cover the concentration ranges of these CCM in both cell and tumor tissue extracts. However, sugars and sugar phosphates generally had higher LLOQ (Table 1). Possible reasons included the previously discussed requirement of ring opening for oxime formation with QDA and the relatively low extraction recovery of those metabolites from C8-tips, which were 22–37% (Figure 4). Figure 4 also illustrates the consistent extraction recovery at both LLOQ and ULOQ, further indicating the overall precision of the method.
Figure 4.

The extraction recovery of carbonyl standard compounds using HyperSep C8 tips.
Standards were derivatized with QDA and the amount recovered after extraction using the known input was determined as described in the Methods. The recovery was determined at both the lower limit of quantification (LLOQ) and at the upper limit of quantification (ULOQ) as defined in Table 1. Black bars: LLOQ sample; blue bars: ULOQ sample.
3.4. Stable Isotope-Resolved Metabolic (SIRM) Profiling and Quantification in cancer cells
Stable isotope tracing is a foundation approach widely applied for metabolic pathway and flux analysis, and historically rich with individual biochemical pathway analyses. When coupled with high metabolome coverage techniques, this becomes SIRM, that enables rigorous mapping of metabolic networks both qualitatively and quantitatively in a biological system 1, 39. To achieve this, sensitive and reliable determination of the isotope incorporation into numerous individual metabolites is required. This has been a challenge for low abundance and/or labile CCM, which can suffer from analytical problems ranging from non-detection, substantial degradation during extraction (e.g. MDA, 4-HNE, GAP, α-KG, data not shown), and reactions with each other. We thus utilized the simultaneous quenching and derivatization advantage of the QDA method coupled with UHR FT-MS analysis to determine the isotopic distribution patterns of carbonyl metabolites in A549 cells cultured in 13C6-Glc as carbon source.
Figure 5 shows the isotopic distribution patterns (as % mole fractions) and abundances of major isotopologues of CCM involved in central carbon metabolism, including glycolysis, the pentose phosphate pathway (PPP), and the Krebs cycle. It is important to note that the data are corrected for natural abundance contributions, as stated. The QDA method rapidly yielded data which we can readily interpret, for example that the dominant 13C isotopologues of glycolytic intermediates were the fully 13C labeled species 13C6-glucose-6-phosphate (Glc-6P) (M+6), 13C3-glyceraldehyde-3-phosphate (GAP)/dihydroxyacetone-3-phosphate (DHAP)) (M+3), and 13C3-pyruvate. These species reflected mainly the glycolytic activity 7 with little contribution from gluconeogenesis or PPP since the latter would lead to the production of 13C scrambled isotopologues such as 13C3-Glc-6P. Likewise, the key 13C labeled species of the PPP intermediates were 13C5-ribose-5P (M+5) and 13C4-erythrose-4P (M+4), which suggested the prevalence of the oxidative branch activity of the PPP since the non-oxidative branch would lead to 13C scrambling of these two metabolites 15. The observed pattern is consistent with the dominance of the 13C5- and 13C10-isotopologues of ADP-ribose, which likely resulted from one and two 13C5-ribose incorporation into ADP-ribose, respectively 40. This metabolite is derived from nicotinamide adenine dinucleotide (NAD+) via the activity of poly ADP-ribose polymerase and glycohydrolase 41, which are involved in modulating cell survival, death, and metabolism 42. In addition, we observed the presence of 13C2- to 13C4-α-KG and 13C2-/13C4-acetoacetate, which reflected the Krebs cycle activity with ( ) and/or without (
 ) the input of anaplerotic pyruvate carboxylase activity 43. Moreover, we found considerable 13C incorporation into MDA principally as the 13C3-species in A549 cells. MDA is a major lipid peroxidation product of ω−6 polyunsaturated fatty acids (PUFA) and a marker of oxidative stress 37. To the best of our knowledge, this is the first time that MDA production from newly synthesized fatty acids is demonstrated. The presence of 13C3-species in labeled MDA, while lacking the M+1 and M+2 species (natural abundance contributions are removed from the data), is consistent with the peroxidation of the conjugated unsaturation site (–13CH=13CH–13CH=) in polyunsaturated fatty acids. This experiment demonstrated the rapid and relatively easy applicability of the QDA method in quantifying analytically challenging isotope-resolved CCM in biological matrix.
Figure 5.

Atom-resolved map of 13C6-glucose-derived carbonyl metabolites, their abundances relative to total protein, and their 13C fractional enrichment in A549 cells; the latter is corrected for natural abundance contributions. A549 cells were grown in the presence of 13C6-Glc for 24 h before polar metabolites were extracted as described in the Methods. The detected carbonyl metabolites are labeled with blue numerals (indicating the atom number). Solid arrows indicate single-step reactions; dashed arrows indicate multiple reaction steps. All reactions are of course bidirectional, but single arrows are use to illustrate the observed net flow of 13C. The * indicate metabolites with mass isomers that are not resolved under the current methods. The levels of major isotopologues were determined using the calibration curves constructed with unlabeled standards. Unless indicated otherwise, the levels are expressed as nmol/mg protein (n = 3).  : 12C;
  ,
,  : 13C from pyruvate dehydrogenase and pyruvate carboxylase-initiated Krebs cycle reactions, respectively; N1’: 1’-ribose attached to the nicotinamide ring.
3.5. Untargeted carbonyl analysis in patient-derived tumor xenografts
In order to demonstrate applicability to tissues, we also applied the QDA method to profile CCM in patient-derived tumor xenografts (PDTX) in mice fed with a 13C6-glucose liquid diet, as described 44. The UHR FT-MS data of derivatized PDTX tissue showed a total of 107 signature ion pairs differing by 4.02188 Da (mass difference of mono QDA and *QDA or 12C1H3 and 13C2H3) and by 2.01094 Da (mass difference of di-QDA and di-*QDA) from 280–1200 m/z (Table S-2). As stated above, these indicate derivative formation of 107 compounds with respectively singly charged mono QDA and *QDA, and doubly charged di-QDA and di-*QDA. Compared with the blank reagent, 41 ion pairs were assigned to interferences originating from solvents, labware, or ambient air, and the remaining 66 ion pairs exclusively observed in the tumor sample were attributed to derivatized CCM, which were selected for further interrogation (Table 2).
Table 2.
CCM detected in a patient-derived mouse tumor xenograft.
| Measured m/z | Mass Error (mDa) | Intensity | Molecular formula of carbonyl compound | Compound assignmentsa | Adduct |
|---|---|---|---|---|---|
| 291.2899 | −0.11 | 1.27E+04 | C3H4O2 | Malondialdehydeb; methylglyoxal | di-QDA |
| 314.3166 | 0.03 | 1.90E+03 | C2H5NO | Aminoacetaldehyde | QDA |
| 328.3323 | 0.02 | 5.26E+03 | C3H7NO | Aminoacetone; Aminopropanal; Amino propanone | QDA |
| 329.2798 | −0.03 | 8.33E+04 | C2H2O3 | Glyoxylate | QDA |
| 341.3162 | −0.05 | 3.25E+04 | C4H6O2 | Oxolan-3-one; Diacetyl; Succindialdehyde; Diacetyl; Dimethylglyoxal; Butanedione | QDA |
| 342.3479 | −0.03 | 8.87E+03 | C4H9NO | Aminobutanal | QDA |
| 343.2955 | −0.02 | 3.80E+06 | C3H4O3 | Pyruvateb | QDA |
| 345.3111 | −0.05 | 3.10E+06 | C3H6O3 | Glyceraldehyde; Dihydroxyacetone | QDA |
| 357.3111 | −0.11 | 7.76E+05 | C4H6O3 | Acetoacetateb | QDA |
| 359.2903 | −0.14 | 2.43E+03 | C3H4O4 | Tartronate semialdehyde; Hydroxypyruvate; 2-Hydroxy-3-oxopropanoate | QDA |
| 369.3475 | −0.09 | 3.78E+05 | C6H10O2 | Hydroxycyclohexanone; Adipoin | QDA |
| 372.3219 | −0.18 | 4.75E+03 | C4H7NO3 | Aspartate-semialdehyde; 2-Amino-3-oxobutanoate; Amino-acetoacetate | QDA |
| 375.3216 | −0.09 | 2.83E+05 | C4H8O4 | Tetroses | QDA |
| 386.3376 | −0.11 | 5.65E+04 | C5H9NO3 | Glutamate semialdehyde | QDA |
| 389.3373 | −0.12 | 2.64E+05 | C5H10O4 | Deoxyriboseb | QDA |
| 400.3169 | −0.12 | 3.00E+04 | C5H7NO4 | Ketoglutaramate | QDA |
| 401.3009 | −0.12 | 3.15E+05 | C5H6O5 | α-KGb | QDA |
| 402.3325 | −0.11 | 1.76E+04 | C5H9NO4 | Hydroxyglutamate semialdehyde; 2-Oxo-4-hydroxy-5-aminovalerate | QDA |
| 405.3322 | −0.14 | 1.20E+06 | C5H10O5 | Riboseb; Ribulose; Xylulose; Threo-2-pentulose; Apiose; Arabinose | QDA |
| 406.3063 | −0.16 | 2.44E+04 | C7H5NO3 | 6-Imino-5-oxocyclohexa-1,3-dienecarboxylate | QDA |
| 409.3787 | −0.17 | 8.60E+04 | C9H14O2 | 4-Oxo-nonenal | QDA |
| 411.3943 | −0.16 | 2.90E+05 | C9H16O2 | 4-HNEb | QDA |
| 417.3474 | −0.17 | 1.57E+04 | C10H10O2 | Methoxycinnamaldehyde; Hydroxycinnamoylmethane; Hydroxybenzalacetone; | QDA |
| 419.3267 | −0.17 | 1.61E+05 | C9H8O3 | Phenylpyruvate; Caffeic aldehyde; Dihydroxycinnamaldehyde; Ketohydrocinnamic acid; keto-Phenylpyruvate; 3-Phenyl-2-oxopropanoate; Benzoyl acetate; Ubisemiquinone | QDA |
| 419.3478 | −0.16 | 2.05E+05 | C6H12O5 | Rhamnulose; Fuculose | QDA |
| 422.3376 | −0.15 | 7.60E+04 | C8H9NO3 | Pyridoxal | QDA |
| 425.2773 | −0.18 | 6.10E+05 | C3H7O6P | GAPb; Dihydroxyacetone phosphate | QDA |
| 433.3270 | −0.18 | 2.27E+04 | C6H10O6 | Dehydro-fructose; 2-Keto-3-deoxy-gluconate; 3-Keto-b-galactose; Deoxyglucuronate; galacto-Hexodialdose; 3-Dehydro-2-deoxy-gluconate; 2-Dehydro-3-deoxy-gluconate;2-Keto-3-deoxy-gluconate; 3-Keto-β-galactose; 5-Dehydro-2-deoxy-gluconate; 2-Dehydro-3-deoxy-galactonate | QDA |
| 435.3216 | −0.15 | 4.01E+05 | C9H8O4 | Hydroxyphenylpyruvate | QDA |
| 435.3427 | −0.12 | 1.60E+07 | C6H12O6 | Glucoseb, Hexose | QDA |
| 437.3736 | −0.22 | 4.29E+04 | C10H14O3 | Iridotrial; 5-oxo-7-decynoic acid | QDA |
| 439.3892 | −0.23 | 3.53E+05 | C10H16O3 | Isopropenyl oxoheptanoate; 4,5-Dihydro-5,5-dimethyl-4-(3-oxobutyl)furan-2(3H)-one | QDA |
| 443.3477 | −0.24 | 1.17E+04 | C8H12O5 | Oxosuberate; Oxooctanedionate | QDA |
| 447.3063 | −0.21 | 2.80E+06 | C6H8O7 | 2-Dehydro-3-deoxy-D-glucarate; 5-Dehydro-4-deoxy-D-glucara | QDA |
| 449.3219 | −0.24 | 1.14E+05 | C6H10O7 | Galacturonic acidb; Iduronic acid; 3-Dehydro-gulonate; Keto-gluconate; Glucuronic acid; 2-Dehydro-galactonate; 2-Dehydro-idonate; 2-Dehydro-idonic acid; Sorbosonate; Sorbosonic acid; Ketoidonate; Ketoidonic acid; 2-Keto-gluconic acid; Dehydro-gluconate | QDA |
| 455.2878 | −0.31 | 6.90E+03 | C4H9O7P | Erythrose phosphate; Tetrose phosphate | QDA |
| 461.3219 | −0.25 | 1.75E+05 | C7H10O7 | Unknown | QDA |
| 465.3168 | −0.22 | 7.65E+05 | C6H10O8 | Unknown | QDA |
| 469.3034 | −0.29 | 7.38E+03 | C5H11O7P | Deoxy-xylulose 5-phosphate | QDA |
| 475.3892 | −0.25 | 1.15E+04 | C13H16O3 | Flossonol | QDA |
| 476.3692 | −0.23 | 4.90E+05 | C8H15NO6 | N-Acetyl-mannosamine | QDA |
| 479.3268 | −0.07 | 2.60E+03 | C14H8O3 | Hydroxyanthraquinone | QDA |
| 479.3324 | −0.25 | 1.57E+06 | C7H12O8 | O-Carboxy-D-glucose | QDA |
| 479.3590 | −0.14 | 4.59E+03 | C10H12N2O4 | Hydroxykynurenine | QDA |
| 490.3151c | −0.04 | 7.52E+05 | C5H11O8P | Ribose phosphateb; pentose phosphate | QDA |
| 492.3640 | −0.32 | 9.47E+04 | C8H15NO7 | N-glycolyl-D-mannosamine | QDA |
| 495.5245 | −0.31 | 1.36E+03 | C16H32O | Hexadecanal | QDA |
| 497.4673 | −0.37 | 4.49E+03 | C14H26O3 | 3-Oxotetradecanoate | QDA |
| 502.3038 | −0.25 | 1.26E+03 | C8H10NO6P | Pyridoxal phosphateb | QDA |
| 515.3089 | −0.29 | 3.78E+05 | C6H13O9P | Hexose-phosphate | QDA |
| 520.3602 | −0.41 | 3.85E+03 | C10H11N5O4 | Dehydroadenosine | QDA |
| 523.3585 | −0.37 | 4.54E+04 | C9H16O9 | 2(α-D-Mannosyl)-D-glycerate | QDA |
| 529.3243 | −0.50 | 2.14E+03 | C7H15O9P | 1-Deoxy-altro-heptulose 7-phosphate | QDA |
| 553.5299 | −0.37 | 4.07E+03 | C18H34O3 | Oxostearate | QDA |
| 556.3353 | −0.43 | 4.06E+04 | C8H16O9NP | N-acetyl-D-glucosamine 6-phosphate; N-acetyl-D-mannosamine 6-phosphate | QDA |
| 564.3851 | −0.41 | 1.21E+05 | C11H19NO9 | N-acetylneuraminic acid | QDA |
| 577.4933 | −0.63 | 5.75E+03 | C19H30O4 | Rapanone; Decylubiquinone;2,3-Dimethoxy-5-methyl-6-decyl-benzoquinone | QDA |
| 580.3799 | −0.49 | 3.50E+04 | C11H19NO10 | N-Glycolylneuraminic acid | QDA |
| 597.3953 | −0.44 | 3.91E+06 | C12H22O11 | 3-β-Galactopyranosyl glucose; kojibiose; turanose | QDA |
| 613.4576 | 0.12 | 2.84E+05 | C21H26O5 | Unknown | QDA |
| 622.4278 | 0.44 | 2.81E+03 | C14H25NO10 | 2-Acetamido-2-deoxy-6-O-a-fucopyranosyl-glucose; 3-O-fucopyranosyl-2-acetamido-2-deoxyglucopyranose; N-Acetyl-6-O-fucosyl-glucosamine | QDA |
| 638.4217 | −0.56 | 1.56E+04 | C14H25NO11 | Poly-N-acetyllactosamine | QDA |
| 759.4478 | −0.72 | 2.45E+06 | C18H32O16 | Galactosyllactose | QDA |
| 800.4743 | −0.72 | 4.15E+03 | C20H35NO16 | Lacto-N-triaose | QDA |
| 814.3504 | −0.76 | 1.95E+05 | C15H23N5O14P2 | ADP riboseb | QDA |
| 921.5005 | −0.80 | 5.72E+05 | C24H42O21 | Glycogen (G4) | QDA |
All compounds were assigned based on their molecular formulae determined by the exact mass acquired from FTMS, the isotopic distributions, and the number of carbonyls present according to the QDA derivatization.
Compounds were further confirmed by using standards and MS/MS.
The M+0 was not detected and M+5 was detected as major isotopologue species which was reported here.
We used the Xcalibur 3.1 software to determine the molecular formulae of the 64 singly charged ion pairs by applying the following criteria: (a) 12C161H3514N2 as the minimal formula input, which corresponds to the QDA substructure, (b) 13C12H312C151H3214N2 as the minimal formula input for the *QDA substructure, (c) the nitrogen rule of ions with even electrons and (d) mass window no more than 1.5 ppm. Taking the ion pair of m/z 447.30648/451.32836 as an example, the formula search yielded multiple hits for each ion, however searching for the matched formula that differed by 13C2H3 resulted in a single hit of C22H43O7N2 and 13C2H3C21H40O7N2 for the QDA and *QDA derivatives, respectively. Subtraction of C16H35N2 yielded the tentative analyte formula C6H8O7. A search of the METLIN database 45 yielded 10 hits with this formula, and five structures were excluded due to the lack of a carbonyl group (Figure 6A). MS/MS analysis of the QDA and *QDA derivative ions yielded the corresponding pairs of mass fragments that were consistent with those of 2-dehydro-3-deoxy-D-glucarate or 5-dehydro-4-deoxy-D-glucarate (Figure 6B).
Figure 6.

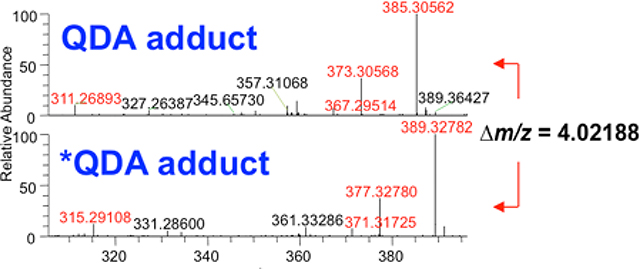
Example application of the QDA method to untargeted analysis of carbonyl metabolites in patient-derived mouse tumor xenograft (PDTX). A mouse PDTX extract was reacted with QDA/*QDA at −80°C as described in the Methods. Full-scan UHR FT-MS analysis of the derivatized extract and blank sample (A) showed sample-specific ion pairs at m/z 447/451 with the QDA/*QDA pair signature of Δm/z = 4.02188, which signals the presence of a carbonyl group and yielded the molecular formula C6H8O7 for the metabolite. Search of this formula against the METLIN database gave five carbonyl metabolites. MS/MS analysis of the precursor ion pairs (B) reduced the number of degenerate assignments to 2-dehydro-3-deoxy-D glucarate and/or 5-dehydro-4-deoxy-D glucarate (DDG).
These two isomeric metabolites can be biosynthesized from pyruvate and tartronate semialdehyde (KEGG pathway map 00053). The QDA derivative ions were well-resolved from the *QDA derivative ions for all of their 13C isotopologues (e.g. the minor M+4 ion of QDA derivative 451.31969 and the major M+0 ion of *QDA derivative 451.32815) (Figure 7). Isotopologue profiling showed that M+6 was the major 13C isotopologue, which was enriched at about 6.0% of the total (Figure 7). This example demonstrated the combined ability of the QDA/*QDA derivatization and UHR FT-MS in the untargeted analysis of 13C labeled CCM directly in crude tissue extracts. Namely, filtering for accurate, high resolution m/z of QDA precursor ion pairs led to unambiguous determination of the molecular formula of the untargeted CCM, while mass fragmentation analysis along with the presence of carbonyl group afforded by the derivatization greatly reduced the number of candidate structures of given molecular formula. This in turn enabled determination of 13C isotopologue distribution for the assigned metabolites, which revealed the likely conversion of 13C6-glucose to dehydro-deoxy-glucarate in PDTX. The use of PDTX is rapidly rising; we note that there is no appropriate non-tumor control in the current study because generally non-transformed human lung does not grow in the mouse model. Therefore, in this demonstration, it could not be determined whether this is unique to the PDTX tumor.
Figure 7.

UHR FT-MS profile of 13C labeled QDA adduct ion of DDG (m/z 447). A: full scan MS spectrum with expanded region to show the resolution of M+4 QDA adduct from the M+0 *QDA adduct. B: fractional distribution of 13C labeled isotopologues of DDG after natural abundance correction.
3.6. Limitations and future perspectives
The extraction recovery results indicate substantial sample losses for some metabolites during HyperSep C8 cleanup (Figure 4). Further investigation is needed to improve extraction recovery for higher detection sensitivity. It was found that unpredictable reactions can occur between reagent and metabolites besides carbonyls due to a large variety of metabolites present in biological samples, for example, NADH (data not shown). Therefore, if the same derivatized sample is being analyzed for other purposes, caution is needed in data interpretation. A shortcoming of direct infusion-UHR-FTMS analysis is the inability to resolve isomers (which are isobaric and thus yield identical m/z), which occurred for many detected metabolites in the present study, such as acetoacetate/oxybutyrate, MDA/methylglyoxal, hexoses, pentoses, tetroses, etc. The MS/MS analysis can resolve some of these isomers, as illustrated by the distinct mass fragment patterns for the QDA derivatives of acetoacetate and oxybutyrate (Figure S-2). However, not all isobaric compounds give unique fragmentation patterns. The QDA-derivatization with UHR FT-MS can be combined with chromatographic techniques to separate and quantify isomers that do not display distinct mass fragmentation patterns; this report indicates that a C4 or C8 LC column may be useful for development of LC-based technique. Moreover, as the QDA method is compatible with both MS and NMR analysis, ambiguities in metabolite assignment by the MS analysis can be resolved by parallel NMR analysis such as 15N-edited NMR that we showed previously for the selective detection of 15N-QDA adducted CCM 28. In the current study, in-house software PREMISE34, 46 was used to identify QDA/*QDA ion pairs and isotopologues. This software is being extended to incorporate MS2 information of QDA/*QDA derivatives, which will further facilitate the characterization of unknown metabolites. As with all metabolomics studies, it can be difficult to classify or discriminate samples accurately. Robust tools are needed to quantify the variation in the compounds of the samples, and appropriate multivariate analyses applied for accurate classification, such as Lasso and Random Forest techniques 47, 48.
4. Conclusions
We have dramatically improved our previous QDA-based derivatization method in terms of reaction conditions (−80 °C/3 h versus 40 °C/23 h) and sample cleanup (C8 versus n-butanol extraction), which resulted in an order of magnitude lower detection limits (to sub-nM) and higher linearity of quantification (> 3 orders of magnitude) for targeted analysis of carbonyl metabolites in complex cell extracts. We also demonstrated the value of the high mass resolution and sub-ppm mass accuracies of UHR FT-MS with the use of QDA/*QDA pairs for assigning 66 CCM in untargeted analysis of 13C-labeled PDTX extracts. Furthermore, we demonstrated the advantage of extended acquisition with direct infusion analysis, which is instrumental in obtaining high quality UHR FT-MS with sufficient time for numerous MS/MS experiments to resolve very closely spaced mass ions due to the additions of numerous 13C labeled species. Because of the paired derivatives, strategic programming of data-dependent or even data-independent MSn experiments can yield isotope labeling patterns in both targeted and untargeted metabolites tailored to a specific biological experimental design. These advances in the QDA methodology not only expand metabolite coverage but also facilitate stable isotope resolved metabolomic analysis for elucidating biochemical networks.
Supplementary Material
Acknowledgements
We acknowledge financial support from NIH 1R01CA118434-01A2 (TWMF), 3R01CA118434-02S1 (TWMF), 1P01CA163223-01A1 (to ANL and TWMF), 1U24DK097215-01A1 (to RMH, TWMF, and ANL), and P30CA177558 (to B.M. Evers). R.C. Sun was supported by a T32 5T32ES007266-25 (M. Vore) and R.C. Bruntz by a T32 CA165990 (V. Ragnekar).
Footnotes
Conflicts of Interest
There are no conflicts of interest to declare.
References
- 1.Fan TWM, Lorkiewicz PK, Sellers K, Moseley HNB, Higashi RM and Lane AN, Pharmacol. Ther, 2012, 133, 366–391. [DOI] [PMC free article] [PubMed] [Google Scholar]
- 2.Sauer U, Mol. Syst. Biol, 2006, 2, 62. [DOI] [PMC free article] [PubMed] [Google Scholar]
- 3.Johnson CH, Ivanisevic J and Siuzdak G, Nat. Rev. Mol. Cell Biol, 2016, 17, 451–459. [DOI] [PMC free article] [PubMed] [Google Scholar]
- 4.Lane AN, Tan J, Wang Y, Yan J, Higashi RM and Fan TW, Metab. Eng, 2017, 43, 125–136. [DOI] [PMC free article] [PubMed] [Google Scholar]
- 5.Stupp GS, Clendinen CS, Ajredini R, Szewc MA, Garrett T, Menger RF, Yost RA, Beecher C and Edison AS, Anal. Chem, 2013, 85, 11858–11865. [DOI] [PMC free article] [PubMed] [Google Scholar]
- 6.Bingol K, Bruschweiler-Li L, Li D, Zhang B, Xie M and Bruschweiler R, Bioanalysis, 2016, 8, 557–573. [DOI] [PMC free article] [PubMed] [Google Scholar]
- 7.Le A, Lane AN, Hamaker M, Bose S, Gouw A, Barbi J, Tsukamoto T, Rojas CJ, Slusher BS, Zhang H, Zimmerman LJ, Liebler DC, Slebos RJ, Lorkiewicz PK, Higashi RM, Fan TW and Dang CV, Cell Metab, 2012, 15, 110–121. [DOI] [PMC free article] [PubMed] [Google Scholar]
- 8.Chokkathukalam A, Kim DH, Barrett MP, Breitling R and Creek DJ, Bioanalysis, 2014, 6, 511–524. [DOI] [PMC free article] [PubMed] [Google Scholar]
- 9.Yang Y, Fan TWM, Lane AN and Higashi RM, Anal. Chim. Acta, 2017, 976, 63–73. [DOI] [PMC free article] [PubMed] [Google Scholar]
- 10.Gil A, Siegel D, Permentier H, Reijngoud DJ, Dekker F and Bischoff R, Electrophoresis, 2015, 36, 2156–2169. [DOI] [PubMed] [Google Scholar]
- 11.Siegel D, Permentier H, Reijngoud D-J and Bischoff R, J. Chromatogr. B, 2014, 966, 21–33. [DOI] [PubMed] [Google Scholar]
- 12.Zimmermann M, Sauer U and Zamboni N, Anal. Chem, 2014, 86, 3232–3237. [DOI] [PubMed] [Google Scholar]
- 13.Nguyen D-T, Lee G and Paik M-J, J. Chromatogr. B, 2013, 913–914, 48–54. [DOI] [PubMed] [Google Scholar]
- 14.Bylda C, Thiele R, Kobold U and Volmer DA, Analyst, 2014, 139, 2265–2276. [DOI] [PubMed] [Google Scholar]
- 15.Fan TWM, Warmoes MO, Sun Q, Song H, Turchan-Cholewo J, Martin JT, Mahan A, Higashi RM and Lane AN, Cold Spring Harb Mol. Case. Stud, 2016, 2, a000893. [DOI] [PMC free article] [PubMed] [Google Scholar]
- 16.Wang J, Christison TT, Misuno K, Lopez L, Huhmer AF, Huang Y and Hu S, Anal. Chem, 2014, 86, 5116–5124. [DOI] [PubMed] [Google Scholar]
- 17.van Dam JC, Ras C and ten Pierick A, Methods Mol. Biol, 2011, 708, 131–146. [DOI] [PubMed] [Google Scholar]
- 18.Milic I, Hoffmann R and Fedorova M, Anal. Chem, 2013, 85, 156–162. [DOI] [PubMed] [Google Scholar]
- 19.Buescher JM, Moco S, Sauer U and Zamboni N, Anal. Chem, 2010, 82, 4403–4412. [DOI] [PubMed] [Google Scholar]
- 20.Tan B, Lu Z, Dong S, Zhao G and Kuo MS, Anal. Biochem, 2014, 465, 134–147. [DOI] [PubMed] [Google Scholar]
- 21.Wang C, Wu C, Zhang L and Zhang J, Anal. Chem, 2016, 88, 7878–7884. [DOI] [PubMed] [Google Scholar]
- 22.Siegel D, Meinema AC, Permentier H, Hopfgartner G and Bischoff R, Anal. Chem, 2014, 86, 5089–5100. [DOI] [PubMed] [Google Scholar]
- 23.Yuan W, Li S and Edwards JL, Anal. Chem, 2015, 87, 7660–7666. [DOI] [PubMed] [Google Scholar]
- 24.Deng P, Zhan Y, Chen X and Zhong D, Bioanalysis, 2012, 4, 49–69. [DOI] [PubMed] [Google Scholar]
- 25.Zhu Y, Deng P and Zhong D, Bioanalysis, 2015, 7, 2557–2581. [DOI] [PubMed] [Google Scholar]
- 26.Higashi RM, in The Handbook of Metabolomics, eds. Fan TW-M, Lane AN and Higashi RM, Humana Press, Totowa, NJ, 2012, DOI: 10.1007/978-1-61779-618-0_4, pp. 61–97. [DOI] [Google Scholar]
- 27.Mattingly SJ, Xu T, Nantz MH, Higashi RM and Fan TW, Metabolomics, 2012, 8, 989–996. [DOI] [PMC free article] [PubMed] [Google Scholar]
- 28.Lane AN, Arumugam S, Lorkiewicz PK, Higashi RM, Laulhe S, Nantz MH, Moseley HN and Fan TW, Magn. Reson. Chem, 2015, 53, 337–343. [DOI] [PMC free article] [PubMed] [Google Scholar]
- 29.Wendeler M, Grinberg L, Wang X, Dawson PE and Baca M, Bioconjug. Chem, 2014, 25, 93–101. [DOI] [PubMed] [Google Scholar]
- 30.Thygesen MB, Munch H, Sauer J, Clo E, Jorgensen MR, Hindsgaul O and Jensen KJ, J. Org. Chem, 2010, 75, 1752–1755. [DOI] [PubMed] [Google Scholar]
- 31.Agten SM, Suylen DP and Hackeng TM, Bioconjug. Chem, 2016, 27, 42–46. [DOI] [PubMed] [Google Scholar]
- 32.Biswas S, Huang X, Badger WR and Nantz MH, Tetrahedron Lett, 2010, 51, 1727–1729. [DOI] [PMC free article] [PubMed] [Google Scholar]
- 33.Xie H, Hanai J, Ren JG, Kats L, Burgess K, Bhargava P, Signoretti S, Billiard J, Duffy KJ, Grant A, Wang X, Lorkiewicz PK, Schatzman S, Bousamra M 2nd, Lane AN, Higashi RM, Fan TW, Pandolfi PP, Sukhatme VP and Seth P, Cell Metab, 2014, 19, 795–809. [DOI] [PMC free article] [PubMed] [Google Scholar]
- 34.Lane AN, Fan TW, Xie Z, Moseley HN and Higashi RM, Anal. Chim. Acta, 2009, 651, 201–208. [DOI] [PMC free article] [PubMed] [Google Scholar]
- 35.Moseley H, BMC Bioinformatics, 2010, 11, 139. [DOI] [PMC free article] [PubMed] [Google Scholar]
- 36.Panuwet P, Hunter RE Jr., D’Souza PE, Chen X, Radford SA, Cohen JR, Marder ME, Kartavenka K, Ryan PB and Barr DB, Crit. Rev. Anal. Chem, 2016, 46, 93–105. [DOI] [PMC free article] [PubMed] [Google Scholar]
- 37.US Department of Health and Human Services, Food and Drug Administration. Guidance for Industry: Bioanalytical Method Validation, 2001. http://www.fda.gov/downloads/Drugs/GuidanceComplianceRegulatoryInformation/Guidances/UCM070107.pdf).
- 38.Dirksen A, Hackeng TM and Dawson PE, Angew. Chem. Int. Ed, 2006, 45, 7581–7584. [DOI] [PubMed] [Google Scholar]
- 39.Zamboni N, Saghatelian A and Patti GJ, Mol. Cell, 2015, 58, 699–706. [DOI] [PMC free article] [PubMed] [Google Scholar]
- 40.Lorkiewicz P, Higashi RM, Lane AN and Fan TW, Metabolomics, 2012, 8, 930–939. [DOI] [PMC free article] [PubMed] [Google Scholar]
- 41.Dolle C, Rack JG and Ziegler M, FEBS J, 2013, 280, 3530–3541. [DOI] [PubMed] [Google Scholar]
- 42.Schreiber V, Dantzer F, Ame JC and de Murcia G, Nat. Rev. Mol. Cell Biol, 2006, 7, 517–528. [DOI] [PubMed] [Google Scholar]
- 43.Fan TW, Yuan P, Lane AN, Higashi RM, Wang Y, Hamidi AB, Zhou R, Guitart X, Chen G, Manji HK and Kaddurah-Daouk R, Metabolomics, 2010, 6, 165–179. [DOI] [PMC free article] [PubMed] [Google Scholar]
- 44.Sun RC, Fan TWM, Deng P, Higashi RM, Lane AN, Scott TL, Sun QS, Warmoes MO and Yang Y, Nat. Commun, 2017, in press. [DOI] [PMC free article] [PubMed] [Google Scholar]
- 45.Tautenhahn R, Cho K, Uritboonthai W, Zhu Z, Patti GJ and Siuzdak G, Nat. Biotechnol, 2012, 30, 826–828. [DOI] [PMC free article] [PubMed] [Google Scholar]
- 46.Lane AN, Fan TW, Bousamra M 2nd, Higashi RM, Yan J and Miller DM, OMICS, 2011, 15, 173–182. [DOI] [PMC free article] [PubMed] [Google Scholar]
- 47.Bergersen LC, Glad IK and Lyng H, Stat. Appl. Genet. Mol. Biol, 2011, 10. [DOI] [PubMed] [Google Scholar]
- 48.Qi Y, in Ensemble Machine Learning: Methods and Applications, eds. Zhang C and Ma Y, Springer US, Boston, MA, 2012, DOI: 10.1007/978-1-4419-9326-7_11, pp. 307–323. [DOI] [Google Scholar]
Associated Data
This section collects any data citations, data availability statements, or supplementary materials included in this article.