

Abstract
Objective
To assess the immediate impact of the introduction of minimum unit pricing in Scotland on household alcohol purchases.
Design
Controlled interrupted time series analysis.
Setting
Purchase data from Kantar Worldpanel’s household shopping panel for 2015-18.
Participants
5325 Scottish households, 54 807 English households as controls, and 10 040 households in northern England to control for potential cross border effects.
Interventions
Introduction of a minimum price of 50p (€0.55; $0.61) per UK unit (6.25p per gram) for the sale of alcohol in Scotland on 1 May 2018.
Main outcome measures
Price per gram of alcohol, number of grams of alcohol purchased from off-trade by households, and weekly household expenditure on alcohol.
Results
The introduction of minimum unit pricing in Scotland was associated with an increase in purchase price of 0.64p per gram of alcohol (95% confidence interval 0.54 to 0.75), a reduction in weekly purchases of 9.5 g of alcohol per adult per household (5.1 to 13.9), and a non-significant increase in weekly expenditure on alcohol per household of 61p (−5 to 127). The increase in purchase price was higher in lower income households and in households that purchased the largest amount of alcohol. The reduction in purchased grams of alcohol was greater in lower income households and only occurred in the top fifth of households by income that purchased the greatest amount of alcohol, where the reduction was 15 g of alcohol per week (6 to 24). Changes in weekly expenditure were not systematically related to household income but increased with increasing household purchases.
Conclusions
In terms of immediate impact, the introduction of minimum unit pricing appears to have been successful in reducing the amount of alcohol purchased by households in Scotland. The action was targeted, in that reductions of purchased alcohol only occurred in the households that bought the most alcohol.
Introduction
Alcohol is the seventh leading risk factor for ill health and premature death globally, and causally related to a wide range of acute and chronic health outcomes.1 2 3 In the United Kingdom, alcohol is the sixth most important risk factor after tobacco, dietary risks, high body mass index, high blood pressure, and high fasting plasma glucose.4 As part of a comprehensive strategy to tackle the adverse consequences of heavy drinking, a series of systematic reviews and meta-analyses has confirmed the effectiveness of policies that regulate the price and availability of alcohol.5 6 7 8 9 10 Importantly, these policies are also the most cost effective.11
In particular, empirical and econometric modelling studies have shown that minimum unit pricing (MUP) is an effective means of reducing alcohol consumption and increasing health gains among the heaviest drinkers.12 13 14 15 16 17 MUP works by setting a mandatory lowest retail price (floor price) at which alcohol products can be sold, which is based on alcohol content. A model based appraisal has estimated that the introduction of the 50p MUP in Scotland on 1 May 2018 would reduce alcohol consumption on average by 3.5% per drinker per year (26.3 UK units or 210.5 g of ethanol, where one UK unit contains eight grams of pure alcohol). During its first 20 years, the policy was estimated to result in 2036 fewer deaths and 38 859 fewer hospital admissions in Scotland as a whole.18 Findings from empirical evaluations of the impact of MUP on mortality and hospital admissions in the Canadian provinces of British Columbia and Saskatchewan suggest that these model based estimates for Scotland are likely to be conservative.13 19
Given that the heaviest drinkers typically consume greater quantities of the strongest, cheapest alcoholic beverages,20 MUP could represent a more targeted intervention than the increasing of alcohol duty only, because MUP mostly affects those drinking in the most harmful ways.16 21 Heavy drinkers also consume a greater quantity of their alcohol in the off-trade, where prices are comparatively much lower than the on-trade (£0.52 (€0.58; $0.63) v £1.74 per UK unit in Scotland in 2015 before MUP).22 Yet, while MUP has been introduced in Scotland,23 with implementation planned for Wales in early 2020,24 the UK government withdrew its commitment to introduce MUP in England in 2013.25 Concerns over the potential adverse impact of MUP on moderate (less heavy) drinkers, particularly those in lower socioeconomic status groups with less disposable income, have underpinned political debates around its introduction in England.26 Econometric modelling has indicated that most moderate drinkers in Scotland will spend on average only around £1.88 more per year on alcohol following MUP.18 On average, although individuals in lower socioeconomic status groups report consuming less alcohol, they have more alcohol related problems than those with higher socioeconomic status. However, evidence also indicates that some individuals in low socioeconomic status groups are more likely to report extreme heavy drinking.27 28 Thus, by targeting the low cost, high strength alcohol that is purchased disproportionately by the poorest heavy drinkers, MUP has the potential to reduce health inequalities.29 30 31
NHS Health Scotland is leading a comprehensive evaluation to assess the impact of MUP on a range of outcomes, the complete findings of which will be reported in 2023.32 Here, we sought to assess the immediate impact of the introduction of MUP on household expenditure, adjusted for number of adults in the household and amount of alcohol (in grams) purchased in Scotland, using a large household panel dataset covering the period 2015-18. Secondary objectives were to identify whether changes in alcohol purchases differed by either type of alcoholic beverage or household income.
Methods
Study design
We undertook controlled, interrupted time series regression analyses of the impact of MUP on Scottish household purchases, using purchases made by English households as control,33 and purchases in northern England to control for potential cross border effects.34 We inferred that MUP would result in a significant reduction in total grams of alcohol purchased in Scotland following implementation.
Data source
Our data source was Kantar Worldpanel’s (KWP) household shopping panel. The KWP panel comprises about 30 000 British households at any one time, recruited via stratified sampling, with targets set for region, household size, age of main shopper, and occupational group. KWP offers vouchers from high street retailers as compensation for participation. Households provide demographic information when joining the panel, followed by annual updates. Households record all purchases (from all store types) brought back into the home using barcode scanners. To be included in KWP’s final datasets, households must meet quality control criteria (meeting thresholds for data recording and purchasing volume or spend (based on household size) every four weeks). Panellists also upload digital images of checkout receipts, which KWP use to verify the accuracy of scanner data. Households report the age of the main shopper, number of adults in the household, income, social class, and life stage.
We obtained KWP data on take-home purchasing of alcohol products, including non-alcoholic and low alcohol products, for the four years covering 2015-18. Because only items purchased and taken home are recorded, only off-trade alcohol is included—that is, alcohol bought in supermarkets or other shops for consumption off the premises. Off-trade sales of alcohol by volume of pure alcohol accounted for between 74% (2015) and 73% (2017) of total alcohol sales by volume of pure alcohol in Scotland.35 Alcohol purchases are recorded daily. A detailed product description identifies the type and volume of the purchase using 19 drink categories, the brand, the price paid, and whether the purchases were on price promotion. For purchased products, the alcohol by volume is included in the product description. For the less than 2% of purchases where no alcohol by volume was identifiable, the averages of the 19 different drink categories were used. Volume was combined with alcohol by volume to calculate grams of alcohol purchased.
We prepared data for the interrupted time series analyses by summing up daily records of purchases to weekly records of purchases across all households for 208 weeks, and then calculating means per household for each week. With UK Office for National Statistics classifications, we used truncated postcode data to group households into Scotland, England, and northern England categories. Northern England in this study represented Hartlepool, Stockton on Tees, County Durham, Tyne and Wear, Northumberland, Redcar and Cleveland, Middlesbrough, Cumbria, Lancashire, Merseyside, Greater Manchester, and Cheshire. Compared with English households, Scottish households had a lower weekly income and a higher proportion in National Readership Survey social grades D and E.36 The differences between Scotland and northern England were smaller (supplementary table 1). We also compared household composition of KWP participants against available Scottish government data (supplementary table 2).37 The Scottish households in the KWP dataset displayed similar characteristics to national population estimates, except that KWP households had a lower proportion of single adult households (23% v 37%). The distribution of household sociodemographic characteristics were stable across each week for 2015-18 (data not shown) and thus were not used as covariates in the analyses.
Statistical analyses
To conduct the main interrupted time series analyses, we generated a new series of dependent variables representing the difference between Scotland and England at every week.33 38 The dependent variables were:
Differences between Scotland and England in means of weekly price per gram purchased of all alcohol (for the 2.2% of purchases with an alcohol by volume of ≤3.5%, prices per gram of alcohol were adjusted upwards by setting the alcohol by volume at 3.6% to avoid spurious high prices per gram for low alcohol and non-alcoholic products)
Differences between Scotland and England in means of weekly purchase of grams of all alcohol across all households, adjusted per adult in the household
Differences between Scotland and England in means of weekly expenditure on alcohol across all households, adjusted per adult in the household.
By creating the new series of dependent variable data of the differences, we removed seasonal variation in the data. Owing to minimal autocorrelation of the data, as measured by the Durbin Watson (1951) test (range 1.5-2.5),39 we used a linear regression model. The independent variables were the event (introduction of MUP in Scotland on 1 May 2018, week 174), and the time trends per week before and after the event. Coefficients with 95% confidence intervals are reported.
Robustness of the data was checked by three further analyses. Firstly, we looked at a simple before and after introduction of MUP analyses for Scottish and English household purchases, using a generalised linear model. Dependent variables were price per gram purchased of all alcohol and household purchases of grams of alcohol adjusted per adult in the household. The independent variables were time (dichotomised as before and after the introduction of MUP) and country (Scotland or England). The interaction term “time by country” provided the coefficient for the change in Scotland, controlling for any changes in England.
Secondly, we looked at uncontrolled, interrupted time series regression analyses33 40 for purchases by all households in Scotland only, with dependent variables price per gram purchased of all alcohol and household purchases of grams of alcohol adjusted per adult in the household. We checked for seasonal differences (for example, peak purchases during the second and third weeks of December) by calculating partial autocorrelations,41 found some differences present for purchases of grams, and subsequently adjusted for these with the ratio-to-moving-average method.42 Owing to minimal residual autocorrelation of the data, as measured by the Durbin Watson test,39 we used a linear regression model. For the third analysis, we repeated controlled interrupted time series analyses with northern England as the comparator, to control for potential cross border effects.34
We repeated the controlled interrupted time series regression analyses separately for the prices and purchases of beer, wine, spirits, fortified wines, cider, and ready-to-drink beverages. Before aggregating the data per week, we also split the file using data before the introduction of MUP by fifths (that is, every 20%) of overall purchase in grams by household, adjusted per adult (≤28, >28 to ≤47, >47 to ≤84, >84 to ≤158, and >158 g); and by fifths of household income, adjusted per adult in the household (≤£7500, >£7500 to ≤£12 500, >£12 500 to ≤17 500, >£17 500 to ≤£25 000, and >£25 000). For each split file, we undertook the controlled interrupted time series regressions with the same dependent variables as the main analyses.
Sensitivity analysis
We undertook two sensitivity analyses. Firstly, we repeated the controlled interrupted time series regression analyses excluding households with no purchases during seven months before or no purchases seven months after the introduction of MUP. Secondly, we repeated the controlled interrupted time series regression analyses using time lags of between one and eight weeks after the introduction of MUP. We did this second analysis by deleting the first week after the introduction of MUP, and shifting the subsequent dependent variables backwards in time by one week, repeating the procedure separately with lags of one to eight weeks.40
Patient and public involvement
This research was done without patient involvement. Patients were not consulted to develop the research question, nor were they involved in identifying the study design or outcomes. We did not invite any patients to participate in the interpretation of results, nor in the writing or editing of this document. There are no plans to directly involve patients in the dissemination of these research findings.
Results
During 2015-18, 0.29 million separate purchases of alcoholic beverages from 5325 households in Scotland, 2.83 million purchases from 54 807 households in England, and 0.58 million purchases from 10 040 households in northern England were recorded. Before the introduction of MUP, the mean price of pure alcohol in Scotland was 8.11p per gram (95% confidence interval 8.08 to 8.14; 65p per UK unit containing 8 g of alcohol), and the amount of alcohol purchased per individual per household aggregated by week was 124.8 g (122.9 to 126.8; 15.6 UK units). Of the alcohol amount purchased, 46.3 g (45.3 to 47.4) was in the form of spirits, 46.5 g (45.9 to 47.1) was wine, 19.0 g (18.6 to 19.4) was beer, 6.5 g (6.1 to 6.9) was fortified wines, 6.4 g (6.2 to 6.6) was cider, and 0.12 g (0.11 to 0.12) was ready-to-drink products. Supplementary table 3 shows data before and after the introduction of MUP, of price per gram of alcohol purchased, grams purchased per adult per household aggregated by week, and money spent on alcohol purchases by beverage type and household income fifths for England, northern England, and Scotland.
The main controlled interrupted time series analysis found that the introduction of MUP was followed by a price increase in Scotland of 0.64p per gram (95% confidence interval 0.54 to 0.75; 5.1p per UK unit; 7.9% increase) and a reduction of 9.5 g (5.1 to 13.9; 1.2 UK units; 7.6% decrease) in purchased grams of alcohol per adult per household (aggregated by week; table 1, fig 1, and fig 2). The three further robust analyses and first sensitivity analysis found similar results (table 1). The trends after MUP implementation for reduction in price (coefficient −0.004, −0.009 to 0.001) and for increase in purchases (0.12, −0.08 to 0.32) in the main analysis were not significant (fig 1, fig 2, and table 1).
Table 1.
Coefficients (95% CI) for immediate impact of introduction of minimum unit pricing in Scotland on price per gram of alcohol purchased (pence) and on grams of alcohol purchased per adult per household aggregated by week. Robust and sensitivity analyses are detailed in the Methods
| Coefficient for impact of change* | Price per gram of alcohol (pence) | Grams of alcohol purchased per individual per household/week |
|---|---|---|
| Controlled interrupted time series analysis for Scotland, controlling for England (main analysis) | ||
| Durbin Watson statistic | 1.75 (linear regression model) | 1.70 (linear regression model) |
| Level change | 0.64 (0.54 to 0.75) | −9.50 (−13.89 to −5.11) |
| Slope before change | 0.0003 (−0.0001 to 0.001) | −0.026 (−0.045 to −0.008) |
| Slope after change | −0.004 (−0.009 to 0.001) | 0.122 (−0.079 to 0.324) |
| Before-and-after analysis: change after introduction of MUP in Scotland, controlling for changes in England (robust analysis 1) | ||
| Level change | 0.61 (0.51 to 0.70) | −9.71 (−15.86 to −3.56) |
| Uncontrolled interrupted time series analysis for Scotland (robust analysis 2) | ||
| Durbin Watson statistic | 1.57 (linear regression model) | Post-seasonal adjustment: 1.96 (linear regression model) |
| Level change | 0.78 (0.62 to 0.94) | −9.13 (−14.29 to −3.97) |
| Slope before change | 1.68−5 (1.14−5 to 2.23−5) | −0.022 (−0.038 to −0.007) |
| Slope after change | 1.52−5 (−7.56−5 to 4.52−5) | −0.082 (−0.250 to 0.086) |
| Controlled interrupted time series analysis for Scotland, controlling for northern England (robust analysis 3)† | ||
| Durbin Watson statistic | 1.80 (linear regression model) | 1.63 (linear regression model) |
| Level change | 0.71 (0.56 to 0.85) | −9.00 (−16.26 to −1.75) |
| Slope before change | −0.00014 (−0.00067 to 0.00040) | −0.028 (−0.047 to −0.008) |
| Slope after change | −0.007 (−0.013 to −0.001) | 0.0002 (−0.215 to 0.216) |
| Exclusion of households with no purchases during seven months before change or no purchases seven months after change (sensitivity analysis 1) | ||
| Durbin Watson statistic | 2.00 (linear regression model) | 1.72 (linear regression model) |
| Level change | 0.66 (0.53 to 0.78) | −10.14 (−16.59 to −3.69) |
| Slope before change | 0.001 (−0.003 to 0.006) | 0.030 (−0.195 to 0.256) |
| Slope after change | −0.004 (−0.008 to 0.001) | 0.122 (−0.103 to 0.348) |
Change is the introduction of minimum unit pricing in Scotland on 1 May 2018.
Northern England in this study represents Hartlepool, Stockton on Tees, County Durham, Tyne and Wear, Northumberland, Redcar and Cleveland, Middlesbrough, Cumbria, Lancashire, Merseyside, Greater Manchester, and Cheshire.
Fig 1.

Plot of price per gram of ethanol purchased (pence), difference Scotland minus England, by week (1=first week of 2015; 208=last week of 2018). Vertical line=introduction of minimum unit price, week 174
Fig 2.

Plot of grams of alcohol purchased per adult per household aggregated by week, difference Scotland minus England, by week (1=first week of 2015; 208=last week of 2018). Vertical line=introduction of minimum unit price, week 174
The change in price was similar across beers, wines, and spirits; higher for cider and fortified wines; and non-existent for ready-to-drink products (table 2). We saw a similar drop in consumption for beer, spirits, and cider (by grams), a non-significant drop in consumption of wine, and no change for fortified wines and ready-to-drink products.
Table 2.
Coefficients (95% CI) for immediate impact of introduction of minimum unit pricing in Scotland on price per gram of drink groups purchased (pence) and on grams of drink groups purchased per adult per household aggregated by week
| Coefficient and drink group | Price | Grams |
|---|---|---|
| Beer | ||
| Level change | 0.594 (0.403 to 0.785) | −2.92 (−4.29 to −1.55) |
| Pre-change slope | 0.000 (−0.001 to 0.001) | 0.000 (−0.006 to 0.006) |
| Post-change slope | 0.002 (−0.006 to 0.011) | 0.087 (0.024 to 0.150) |
| Wine | ||
| Level change | 0.420 (0.297 to 0.542) | −1.67 (−3.99 to 0.66) |
| Pre-change slope | 0.000 (0.000 to 0.001) | 0.008 (−0.001 to 0.018) |
| Post-change slope | 0.001 (−0.004 to 0.007) | −0.001 (−0.108 to 0.106) |
| Spirits | ||
| Level change | 0.670 (0.596 to 0.744) | −2.89 (−5.76 to −0.02) |
| Pre-change slope | 0.000 (0.000 to 0.000) | −0.034 (−0.046 to −0.022) |
| Post-change slope | −0.004 (−0.008 to −0.001) | 0.064 (−0.068 to 0.196) |
| Fortified wines | ||
| Level change | 0.911 (0.602 to 1.220) | 0.32 (−0.64 to 1.28) |
| Pre-change slope | −0.001 (−0.003 to 0.000) | 0.003 (−0.001 to 0.007) |
| Post-change slope | −0.015 (−0.029 to 0.000) | −0.069 (−0.113 to −0.025) |
| Cider | ||
| Level change | 1.448 (1.070 to 1.826) | −2.34 (−3.06 to −1.62) |
| Pre-change slope | 0.000 (−0.001 to 0.002) | −0.004 (−0.007 to −0.001) |
| Post-change slope | −0.014 (−0.031 to 0.004) | 0.042 (0.009 to 0.075) |
| Ready-to-drink products | ||
| Level change | −0.31 (−1.54 to 0.93) | −0.010 (−0.033 to 0.013 |
| Pre-change slope | −0.003 (−0.008 to 0.003) | 0.000 (0.000 to 0.000) |
| Post-change slope | 0.013 (−0.044 to 0.070) | −0.001 (−0.002 to 0.000) |
The second sensitivity analysis, examining lag effects, found no lags in price increases following the introduction of MUP. We saw some tail-off of the impact of MUP in reducing purchased grams of alcohol from a lag of three to eight weeks, but this change was not significant. In the regression model, the mean drop in consumption across the lags 0-8 weeks was 8.6 g (95% confidence interval 6.6 to 10.7), and the interaction between the introduction of MUP (the event) and the lag weeks 0-8 was not significant (B=0.18 (95% confidence interval −0.13 to 0.49; supplementary fig I).
Price increases occurred across all purchasing fifths. Increases were greater in higher purchasing households than in lower purchasing households, and were greater in lower income than in higher income households (fig 3). Reductions in grams of alcohol purchased only occurred in the highest purchasing fifth (reduction of 15 g alcohol per week, 95% confidence interval 6 to 24), and reductions were greater in lower income than in higher income households (fig 4).
Fig 3.
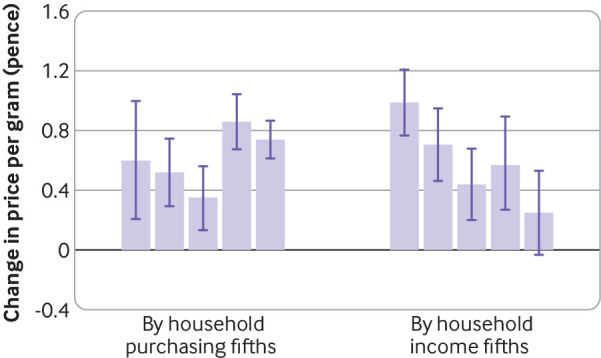
Coefficients for changes in price per gram of alcohol purchased (main analysis, Scotland minus England), by purchasing fifths (lowest to highest from left to right) and income fifths (lowest to highest from left to right). Whiskers=95% confidence intervals
Fig 4.
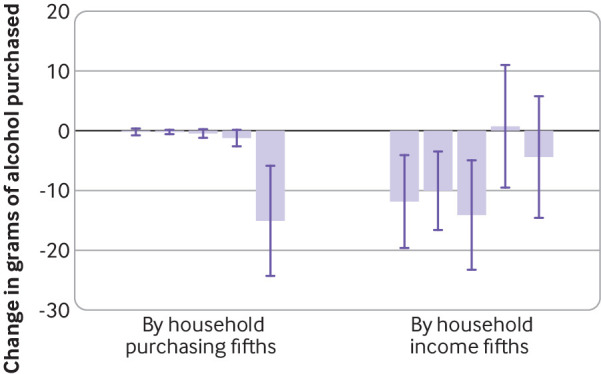
Coefficients for changes in grams of alcohol purchased per adult per household, aggregated by week (main analysis, Scotland minus England), by purchasing fifths (lowest to highest from left to right) and income fifths (lowest to highest from left to right). Whiskers=95% confidence intervals
Analysis of income fifths within purchasing fifths showed that price increases tended to occur in the higher rather than lower purchasing households, and among lower rather than higher income groups (supplementary fig II). The wide 95% confidence intervals in the lowest purchasing fifths were due to smaller numbers of purchases. Consumption decreases were restricted to the highest purchasing fifth, being greater among lower rather than higher income groups (supplementary fig III).
Across all Scottish households, the introduction of MUP was associated with a non-significant increase in weekly expenditure of 61p (95% confidence interval −5 to 127) per adult per household (Scotland minus England). Changes in weekly expenditure were not systematically associated with household income, but increased with amount of alcohol purchased (fig 5).
Fig 5.
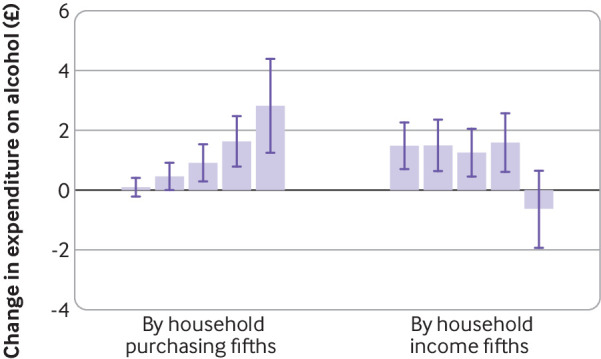
Changes in weekly expenditure (£; main analysis, Scotland minus England), by household purchasing fifths (lowest to highest from left to right) and household income fifths (lowest to highest from left to right). Whiskers=95% confidence intervals
Analysis of changes in weekly expenditure by income fifths within purchasing fifths followed a similar pattern to changes in price, with changes in weekly expenditure increasing with the amount of alcohol purchased (supplementary fig IV). We saw no evidence of stockpiling in the highest income groups of the top two purchasing fifths (which showed non-significant reductions in weekly expenditure); by looking for peaks in numbers of grams of alcohol purchased for 4, 8, 12, and 16 weeks before the introduction of MUP, we found none.
Discussion
Principal findings
Our analysis of KWP household purchase data for 2015-18 found an immediate impact of the introduction of MUP on reductions in total off-trade alcohol purchases in grams of ethanol in Scotland. The largest reductions in consumption were found for beer, spirits, and cider. Given that these categories include the own-brand spirits and high strength white ciders that MUP sought to target, our data suggest that the policy has achieved its ambition to make relatively cheap and strong alcohol less affordable, which in turn should positively impact public health over time.43 Although the impact of MUP was greater on lower as opposed to higher income households, changes in weekly expenditure were not systematically related to household income but rather increased with increasing household purchases of alcohol. Thus, our data also indicate that MUP was a targeted policy, because it predominantly reduced purchases in the top fifth of alcohol purchasing households.
Comparison with other studies
We found that the introduction of MUP led to a 7.6% reduction in purchases, 2.2 times as much as previous model based work.18 This change is equivalent to a reduction in purchases of 328 g (41 UK units) per adult per household per year (adjusted for exclusion of on-sales, by dividing by 0.735, the proportion of total alcohol sales by volume of pure alcohol in Scotland that are due to off-trade sales35), 1.6 times as much as previous estimates. The only other comparable empirical evidence of the real world impact of MUP on off-trade alcohol purchases used longitudinal data from 20 years of off-trade purchases in two Canadian provinces. These studies found that the introduction of a 10% increase in MUP of any given alcoholic product in British Columbia reduced its per capita alcohol consumption by between 14.6% and 16.1%.44 A reduction of 8.4% was reported for total volume of pure alcohol sales or purchases in Saskatchewan province (where MUP was implemented across all beverage types) following the same percentage price increase, with larger effect sizes observed in off-trade versus on-trade alcohol sales.45 Both the Saskatchewan and British Columbia analyses drew on a more extended period of post-intervention data than our study, and relate to a markedly different drinking culture than that found in Scotland, but the direction of effects are consistent with the results presented here.
NHS Health Scotland has published a briefing based on initial alcohol purchase data released by market research company Nielsen, comparing the three months following MUP implementation with the same period for 2017.46 They report a 14% increase in total value purchases in Scotland (in part due to a 10% increase in average prices), and an increase of 4% in volume purchases. These data contrast with those from England and Wales, which saw an increase of 8% in total value purchases, and 7% in volume purchases, but a decline in average prices during the same period. Our results, which include an additional five months of data compared to those published by NHS Health Scotland, indicate that off-trade purchases were reduced for the remainder of 2018. We also show that before the introduction of MUP, Scottish purchasing in terms of grams of alcohol was marginally cheaper than in England. Econometric modelling studies suggest that the 50p MUP for Scotland would result in an average increase of £5 in annual spending across the population.18 Across all households, we found a non-significant weekly increase in off-licence expenditure on alcohol of 61p per adult per household following the introduction of MUP. Expenditure increased with the amount of alcohol purchased, being just under £3 per adult per household per week in the top fifth of purchasing households.
Strengths and limitations of study
Our analyses had several important strengths. Data were obtained from a large number of households, with a large number of weekly data points before and after the introduction of MUP. Further, data on price and purchases were objective, based on product bar codes, and verified via digital receipts. By reporting changes in both the price per gram of alcohol purchased and in grams of alcohol purchased per individual per household, for all alcohol products, our analyses provide a balanced assessment of the initial impact of MUP. In contrast, simply reporting the total value of purchases does not offer a good measure of the impact of MUP, because this is influenced by the increase in average price.46
By comparison with purchase data from England, we were able to control for possible time varying confounders that occurred during the study period.33 Although northern England is arguably a more appropriate control in terms of its socioeconomic characteristics and geographical proximity to Scotland, we applied England as a whole to ensure sufficient data were available for robust analyses. The coefficients for the impact of introducing MUP were similar in size when using either all of England as a control or just northern England as a control, providing reassurance of no major dilution in effect due to cross border purchases. Additionally, although the randomised controlled trial remains the ideal research standard, interrupted time series analysis provides a strong alternative where an experimental study design is infeasible or unethical, such as the evaluation of policy initiatives in healthcare.47 Moreover, our study adheres to recognised appropriate quality criteria48 (supplementary table 4).
One key limitation concerns our use of off-trade purchase data only to assess the impact of MUP, meaning that we have no information about the effect on on-trade sales. As low income groups are more likely to buy more of their alcohol off-trade than high income populations, the restricting of our analyses to off-trade data could have resulted in an inflated overall level of impact.49 However, evidence suggests that the implementation of a 50p MUP will have limited impact on revenue in the on-trade, and that heavier drinkers consume a greater proportion of their alcohol in the off-trade.18 Additionally, and as NHS Health Scotland highlighted when publishing the Nielsen data, this period of analysis included a particularly hot summer in the UK and the 2018 World Cup, both of which could have increased alcohol purchases.46 However, our use of England as a control in our time series, with additional analyses conducted using northern England as a comparator, partially offsets the impact of any unusual seasonal trends or events on our findings.50
Another limitation of our study concerns our findings relating to the differential impact of MUP by income group, and by level of consumption. Although we identified a greater increase in the weekly price per gram of alcohol purchased for lower income groups, and a correspondingly larger decrease in the grams of alcohol purchased per week, we had no information on the actual drinking levels of panel respondents. When considering the equity implications of MUP, it is important to be able to separate heavier rather than lighter drinkers living in poverty.18
Although we partially controlled for lack of actual consumption data by looking at mean number of purchases over time,30 we acknowledge that heavy drinkers, particularly male drinkers or those with no fixed address or living in communal establishments, are likely to be under-represented in household panel data,51 52 and that alcohol purchases are under-reported in general in these datasets.53 For example, compared with the UK Living Costs and Food Survey, KWP households tend to have lower incomes, are more likely to be female headed (as main or primary shoppers), and their expenditure on certain commodity items, including alcohol, tends to be lower.54 KWP households also include fewer single adult households than national population estimates for Scotland.37 At the same time, while these groups of heavy drinkers were likely less well represented in our dataset, they represent a small proportion of the population affected by MUP in Scotland. As such, our findings still have important implications for public health policy.
We also did not include any data to illustrate changes in health outcomes, which is crucial in order to fully evaluate the impact of MUP. As individuals in lower socioeconomic status experience the highest rates of alcohol attributable ill health and premature death,55 they are likely to benefit most from the policy implementation.29 Empirical published data relating to the Canadian provinces that have implemented and evaluated MUP, report impacts on reduced alcohol related morbidity,56 mortality,12 crime,57 and healthcare use,13 58 particularly for lower income groups. NHS Health Scotland’s commissioned evaluation will focus specifically on assessing the impact of MUP on harmful drinkers, and will use primary qualitative and quantitative data collection from users and providers of alcohol treatment services, as well as secondary analyses of KWP data.34 This evaluation should permit additional scrutiny of any adverse impacts on this group of drinkers. Although very heavy drinkers, who are already experiencing severe economic deprivation, might respond to price increases by reducing their drinking, they might also respond to price increases by forgoing essentials, such as by rebudgeting to purchase alcohol instead of food.59 60 As such, there is a risk that MUP could intensify the economic hardships experienced by both economically deprived very heavy drinkers and their families.61 A final limitation of our study was that we only had data for the eight months after the introduction of MUP. Future analyses should evaluate longer term effects.
Conclusion and policy implications
Our study is an empirical assessment of the immediate impact of MUP on the price and purchases of off-trade alcohol in Scotland. Our analyses indicate that MUP is an effective policy option to reduce alcohol purchases, particularly affecting higher purchasers, and with no evidence of a significant differential negative impact on expenditure by lower income groups. Our data supports the introduction of MUP as an effective policy option in other jurisdictions.
What is already known on this topic
Scotland introduced a minimum price of 50p per UK unit (6.25p per gram) for the sale of alcohol in May 2018
The only empirical evidence for the impact of minimum prices of alcohol sales so far come from Canadian provinces, which showed that increases in existing minimum prices were associated with reduced alcohol related harm
The present controlled study analyses the impact of the introduction of a minimum price per gram of alcohol sold in Scotland, based on a large household panel dataset and using objective data obtained from bar codes of sold products
What this study adds
This study compared data from Scottish households with those from English households to conduct a controlled interrupted time series analysis, and used data from households in northern England to control for potential cross border purchasing effects
Minimum unit pricing appeared to be effective at reducing alcohol purchases and, by inference, consumption in Scotland
Effects were greatest in households who purchased the most alcohol, with no evidence of a differential negative impact on expenditure by lower income groups
Acknowledgments
We thank Kantar Worldpanel for providing the raw data and reviewing the method description as it describes the purchase data.
Web extra.
Extra material supplied by authors
Web appendix: Supplementary material
Contributors: PA conceptualised the paper and analyses, undertook the analyses, and wrote the methods and results sections. AOD wrote the introduction and discussion, and was responsible for the full submission process. All the authors refined the various versions of the full paper and approved the final manuscript. The corresponding author attests that all listed authors meet authorship criteria and that no others meeting the criteria have been omitted. PA and AOD are the guarantors.
Funding: No funding was received in support of this study. Kantar Worldpanel provided the raw data but had no role in the study design, data analysis, data interpretation, or writing of the manuscript.
Competing interests: All authors have completed the ICMJE uniform disclosure form at www.icmje.org/coi_disclosure.pdf and declare: no support from any organisation for the submitted work; PA declares receipt of funds from AB InBev Foundation; the remaining authors declare no financial relationships with any organisations that might have an interest in the submitted work in the previous three years; all authors declare no other relationships or activities that could appear to have influenced the submitted work.
Ethical approval: Not required.
Data sharing: No additional data available. Kantar Worldpanel data cannot be shared due to licensing restrictions.
AOD and PA affirm that the manuscript is an honest, accurate, and transparent account of the study being reported; that no important aspects of the study have been omitted; and that any discrepancies from the study as planned have been explained.
References
- 1. Wood AM, Kaptoge S, Butterworth AS, et al. Emerging Risk Factors Collaboration/EPIC-CVD/UK Biobank Alcohol Study Group Risk thresholds for alcohol consumption: combined analysis of individual-participant data for 599 912 current drinkers in 83 prospective studies. Lancet 2018;391:1513-23. 10.1016/S0140-6736(18)30134-X [DOI] [PMC free article] [PubMed] [Google Scholar]
- 2. GBD 2017 Risk Factor Collaborators Global, regional, and national comparative risk assessment of 84 behavioural, environmental and occupational, and metabolic risks or clusters of risks for 195 countries and territories, 1990-2017: a systematic analysis for the Global Burden of Disease Study 2017. Lancet 2018;392:1923-94. 10.1016/S0140-6736(18)32225-6 [DOI] [PMC free article] [PubMed] [Google Scholar]
- 3. Rehm J, Gmel GE, Sr, Gmel G, et al. The relationship between different dimensions of alcohol use and the burden of disease-an update. Addiction 2017;112:968-1001. 10.1111/add.13757 [DOI] [PMC free article] [PubMed] [Google Scholar]
- 4.GBD 2017 Risk Factor Collaborators. GBD Country Profile: United Kingdom Washington DC, USA: The Institute for Health Metrics and Evaluation; 2018 [cited 5 February 2019]. www.healthdata.org/united-kingdom.
- 5. Anderson P, Chisholm D, Fuhr DC. Effectiveness and cost-effectiveness of policies and programmes to reduce the harm caused by alcohol. Lancet 2009;373:2234-46. 10.1016/S0140-6736(09)60744-3 [DOI] [PubMed] [Google Scholar]
- 6. Martineau F, Tyner E, Lorenc T, Petticrew M, Lock K. Population-level interventions to reduce alcohol-related harm: an overview of systematic reviews. Prev Med 2013;57:278-96. 10.1016/j.ypmed.2013.06.019 [DOI] [PubMed] [Google Scholar]
- 7. Wagenaar AC, Salois MJ, Komro KA. Effects of beverage alcohol price and tax levels on drinking: a meta-analysis of 1003 estimates from 112 studies. Addiction 2009;104:179-90. 10.1111/j.1360-0443.2008.02438.x [DOI] [PubMed] [Google Scholar]
- 8. Elder RW, Lawrence B, Ferguson A, et al. Task Force on Community Preventive Services The effectiveness of tax policy interventions for reducing excessive alcohol consumption and related harms. Am J Prev Med 2010;38:217-29. 10.1016/j.amepre.2009.11.005 [DOI] [PMC free article] [PubMed] [Google Scholar]
- 9. Patra J, Giesbrecht N, Rehm J, Bekmuradov D, Popova S. Are alcohol prices and taxes an evidence-based approach to reducing alcohol-related harm and promoting public health and safety? A literature review. Contemp Drug Probl 2012;39:7-48 10.1177/009145091203900103. [DOI] [Google Scholar]
- 10. Burton R, Henn C, Lavoie D, et al. A rapid evidence review of the effectiveness and cost-effectiveness of alcohol control policies: an English perspective. Lancet 2017;389:1558-80. 10.1016/S0140-6736(16)32420-5 [DOI] [PubMed] [Google Scholar]
- 11. Chisholm D, Moro D, Bertram M, et al. Are the “best buys” for alcohol control still valid? An update on the comparative cost-effectiveness of alcohol control strategies at the global level. J Stud Alcohol Drugs 2018;79:514-22. 10.15288/jsad.2018.79.514 [DOI] [PubMed] [Google Scholar]
- 12. Zhao J, Stockwell T, Martin G, et al. The relationship between minimum alcohol prices, outlet densities and alcohol-attributable deaths in British Columbia, 2002-09. Addiction 2013;108:1059-69. 10.1111/add.12139 [DOI] [PubMed] [Google Scholar]
- 13. Stockwell T, Zhao J, Martin G, et al. Minimum alcohol prices and outlet densities in British Columbia, Canada: estimated impacts on alcohol-attributable hospital admissions. Am J Public Health 2013;103:2014-20. 10.2105/AJPH.2013.301289 [DOI] [PMC free article] [PubMed] [Google Scholar]
- 14. Booth A, Meier P, Stockwell T, et al. Independent review of the effects of alcohol pricing and promotion. Part A: systematic reviews. University of Sheffield, 2008. [Google Scholar]
- 15. Ludbrook A, Petrie D, McKenzie L, Farrar S. Tackling alcohol misuse: purchasing patterns affected by minimum pricing for alcohol. Appl Health Econ Health Policy 2012;10:51-63. 10.2165/11594840-000000000-00000 [DOI] [PubMed] [Google Scholar]
- 16. Purshouse RC, Meier PS, Brennan A, Taylor KB, Rafia R. Estimated effect of alcohol pricing policies on health and health economic outcomes in England: an epidemiological model. Lancet 2010;375:1355-64. 10.1016/S0140-6736(10)60058-X [DOI] [PubMed] [Google Scholar]
- 17. Boniface S, Scannell JW, Marlow S. Evidence for the effectiveness of minimum pricing of alcohol: a systematic review and assessment using the Bradford Hill criteria for causality. BMJ Open 2017;7:e013497. 10.1136/bmjopen-2016-013497 [DOI] [PMC free article] [PubMed] [Google Scholar]
- 18.Angus C, Holmes J, Pryce R, Meier P, Brennan A. Model-based appraisal of the comparative impact of Minimum Unit Pricing and taxation policies in Scotland. An adaptation of the Sheffield Alcohol Policy Model version 3. Sheffield: ScHARR, University of Sheffield 2016.
- 19. Stockwell T. Minimum unit pricing for alcohol. BMJ 2014;349:g5617. 10.1136/bmj.g5617 [DOI] [PubMed] [Google Scholar]
- 20. Black H, Gill J, Chick J. The price of a drink: levels of consumption and price paid per unit of alcohol by Edinburgh’s ill drinkers with a comparison to wider alcohol sales in Scotland. Addiction 2011;106:729-36. 10.1111/j.1360-0443.2010.03225.x [DOI] [PMC free article] [PubMed] [Google Scholar]
- 21. Gruenewald PJ, Ponicki WR, Holder HD, Romelsjö A. Alcohol prices, beverage quality, and the demand for alcohol: quality substitutions and price elasticities. Alcohol Clin Exp Res 2006;30:96-105. 10.1111/j.1530-0277.2006.00011.x [DOI] [PubMed] [Google Scholar]
- 22. Scotland NH. Monitoring and Evaluating Scotland’s Alcohol Strategy: annual update of alcohol sales and price band analyses. NHS Health Scotland, 2016. [Google Scholar]
- 23. Christie B. Minimum alcohol pricing goes ahead in Scotland after drinks industry loses legal battle. BMJ 2017;359:j5302. 10.1136/bmj.j5302 [DOI] [PubMed] [Google Scholar]
- 24.Welsh Government. Written statement: Welsh Government update: minimum unit pricing of alcohol. 2019 [access date 29 May 2019] https://gov.wales/written-statement-welsh-government-update-minimum-unit-pricing-alcohol
- 25. O’Dowd A. Government drops plans for minimum alcohol pricing in England and Wales. BMJ 2013;347:f4622. 10.1136/bmj.f4622 [DOI] [PubMed] [Google Scholar]
- 26. Gilmore I, Daube M. How a minimum unit price for alcohol was scuppered. BMJ 2014;343:g23. [DOI] [PubMed] [Google Scholar]
- 27. Lewer D, Meier P, Beard E, Boniface S, Kaner E. Unravelling the alcohol harm paradox: a population-based study of social gradients across very heavy drinking thresholds. BMC Public Health 2016;16:599. 10.1186/s12889-016-3265-9 [DOI] [PMC free article] [PubMed] [Google Scholar]
- 28. Beard E, Brown J, West R, et al. Deconstructing the alcohol harm paradox: a population based survey of adults in England. PLoS One 2016;11:e0160666. 10.1371/journal.pone.0160666 [DOI] [PMC free article] [PubMed] [Google Scholar]
- 29. Holmes J, Meng Y, Meier PS, et al. Effects of minimum unit pricing for alcohol on different income and socioeconomic groups: a modelling study. Lancet 2014;383:1655-64. 10.1016/S0140-6736(13)62417-4 [DOI] [PMC free article] [PubMed] [Google Scholar]
- 30. Ejebu O-Z, McKenzie L, Ludbrook A. Household purchasing of cheap alcohol: Who would be most affected by minimum unit pricing? Nordic Journal of Health Economics, 2018. [Google Scholar]
- 31. Meier PS, Holmes J, Angus C, Ally AK, Meng Y, Brennan A. Estimated Effects of Different Alcohol Taxation and Price Policies on Health Inequalities: A Mathematical Modelling Study. PLoS Med 2016;13:e1001963. 10.1371/journal.pmed.1001963 [DOI] [PMC free article] [PubMed] [Google Scholar]
- 32.NHS Health Scotland. Minimum unit pricing (MUP) evaluation Edinbugh NHS Health Scotland; 2017. www.healthscotland.scot/publications/minimum-unit-pricing-mup-evaluation.
- 33. Lopez Bernal J, Cummins S, Gasparrini A. The use of controls in interrupted time series studies of public health interventions. Int J Epidemiol 2018;47:2082-93. 10.1093/ije/dyy135 [DOI] [PubMed] [Google Scholar]
- 34. Sheffield Alcohol Research Group Evaluating the impact of minimum unit pricing in Scotland on harmful drinkers. School of Health and Related Research, The University of Sheffield, 2017. [Google Scholar]
- 35.NHS Health Scotland. MESAS alcohol sales and price update May 2016 Edinburgh: NHS Health Scotland; 2016. www.healthscotland.scot/publications/mesas-alcohol-sales-and-price-update-may-2016
- 36.National Readership Survey. Social Grade London: National Readership Survey; 2019 [cited 10 July 2019]. http://www.nrs.co.uk/nrs-print/lifestyle-and-classification-data/social-grade/.
- 37. National Records of Scotland Estimates of Households and Dwellings in Scotland, 2017. National Records of Scotland, 2018. [Google Scholar]
- 38. Fretheim A, Soumerai SB, Zhang F, Oxman AD, Ross-Degnan D. Interrupted time-series analysis yielded an effect estimate concordant with the cluster-randomized controlled trial result. J Clin Epidemiol 2013;66:883-7. 10.1016/j.jclinepi.2013.03.016 [DOI] [PubMed] [Google Scholar]
- 39. Durbin J, Watson GS. Testing for serial correlation in least squares regression. II. Biometrika 1951;38:159-78. 10.1093/biomet/38.1-2.159 [DOI] [PubMed] [Google Scholar]
- 40. Bhaskaran K, Gasparrini A, Hajat S, Smeeth L, Armstrong B. Time series regression studies in environmental epidemiology. Int J Epidemiol 2013;42:1187-95. 10.1093/ije/dyt092 [DOI] [PMC free article] [PubMed] [Google Scholar]
- 41.Box GEP, Jenkins GM. Time series analysis: Forecasting and control. Revised ed. San Francisco: Holden-Day; 1976. [Google Scholar]
- 42. Makridakis S, Wheelwright SC, McGee VE. Forecasting: Methods and applications. John Wiley and Sons, 1983. [Google Scholar]
- 43. Adams J, Beenstock J. Price discounts on alcohol in a city in Northern England. Alcohol Alcohol 2012;47:187-90. 10.1093/alcalc/agr159 [DOI] [PMC free article] [PubMed] [Google Scholar]
- 44. Stockwell T, Auld MC, Zhao J, Martin G. Does minimum pricing reduce alcohol consumption? The experience of a Canadian province. Addiction 2012;107:912-20. 10.1111/j.1360-0443.2011.03763.x [DOI] [PubMed] [Google Scholar]
- 45. Stockwell T, Zhao J, Giesbrecht N, Macdonald S, Thomas G, Wettlaufer A. The raising of minimum alcohol prices in Saskatchewan, Canada: impacts on consumption and implications for public health. Am J Public Health 2012;102:e103-10. 10.2105/AJPH.2012.301094 [DOI] [PMC free article] [PubMed] [Google Scholar]
- 46. Giles L, Robinson M, Beeston C. Six months on from the implementation of MUP, what can we say about changes in alcohol sales in Scotland? NHS Health Scotland, 2018. [Google Scholar]
- 47. Shadish WR, Cook TD, Campbell DT. Experimental and quasi-experimental designs for generalized causal inference. Houghton Mifflin Company, 2002. [Google Scholar]
- 48. Ramsay CR, Matowe L, Grilli R, Grimshaw JM, Thomas RE. Interrupted time series designs in health technology assessment: lessons from two systematic reviews of behavior change strategies. Int J Technol Assess Health Care 2003;19:613-23. 10.1017/S0266462303000576 [DOI] [PubMed] [Google Scholar]
- 49. Vandenberg B, Sharma A. Are alcohol taxation and pricing policies regressive? Product-level effects of a specific tax and a minimum unit price for alcohol. Alcohol Alcohol 2016;51:493-502. 10.1093/alcalc/agv133 [DOI] [PubMed] [Google Scholar]
- 50. Biglan A, Ary D, Wagenaar AC. The value of interrupted time-series experiments for community intervention research. Prev Sci 2000;1:31-49. 10.1023/A:1010024016308 [DOI] [PMC free article] [PubMed] [Google Scholar]
- 51. Gill J, Black H, Rush R, O’May F, Chick J. Heavy drinkers and the potential impact of minimum unit pricing-no single or simple effect? Alcohol Alcohol 2017;52:722-9. 10.1093/alcalc/agx060 [DOI] [PubMed] [Google Scholar]
- 52. Gorman E, Leyland AH, McCartney G, et al. Assessing the representativeness of population-sampled health surveys through linkage to administrative data on alcohol-related outcomes. Am J Epidemiol 2014;180:941-8. 10.1093/aje/kwu207 [DOI] [PMC free article] [PubMed] [Google Scholar]
- 53. Pechey R, Jebb SA, Kelly MP, et al. Socioeconomic differences in purchases of more vs. less healthy foods and beverages: analysis of over 25,000 British households in 2010. Soc Sci Med 2013;92:22-6. 10.1016/j.socscimed.2013.05.012 [DOI] [PMC free article] [PubMed] [Google Scholar]
- 54. Leicester A. How might in-home scanner technology be used in budget surveys? Institute for Fiscal Studies, 2012. 10.1920/wp.ifs.2012.1201. [DOI] [Google Scholar]
- 55. Mäkelä P, Paljärvi T. Do consequences of a given pattern of drinking vary by socioeconomic status? A mortality and hospitalisation follow-up for alcohol-related causes of the Finnish Drinking Habits Surveys. J Epidemiol Community Health 2008;62:728-33. 10.1136/jech.2007.065672 [DOI] [PubMed] [Google Scholar]
- 56. Zhao J, Stockwell T. The impacts of minimum alcohol pricing on alcohol attributable morbidity in regions of British Colombia, Canada with low, medium and high mean family income. Addiction 2017;112:1942-51. 10.1111/add.13902 [DOI] [PubMed] [Google Scholar]
- 57. Stockwell T, Zhao J, Sherk A, Callaghan RC, Macdonald S, Gatley J. Assessing the impacts of Saskatchewan’s minimum alcohol pricing regulations on alcohol-related crime. Drug Alcohol Rev 2017;36:492-501. 10.1111/dar.12471 [DOI] [PubMed] [Google Scholar]
- 58. Sherk A, Stockwell T, Callaghan RC. The effect on emergency department visits of raised alcohol minimum prices in Saskatchewan, Canada. Drug Alcohol Rev 2018;37(Suppl 1):S357-65. 10.1111/dar.12670 [DOI] [PubMed] [Google Scholar]
- 59. Erickson RA, Stockwell T, Pauly BB, et al. How do people with homelessness and alcohol dependence cope when alcohol is unaffordable? A comparison of residents of Canadian managed alcohol programs and locally recruited controls. Drug Alcohol Rev 2018;37(Suppl 1):S174-83. 10.1111/dar.12649 [DOI] [PubMed] [Google Scholar]
- 60. O’May F, Gill J, Black H, Rees C, Chick J, McPake B. Heavy drinkers’ perspectives on minimum unit pricing for alcohol in Scotland: a qualitative interview study. SAGE Open 2016;6: 10.1177/2158244016657141. [DOI] [Google Scholar]
- 61. Forsyth AJM, Ellaway A, Davidson N. How might the alcohol minimum unit pricing (MUP) impact upon local off-sales shops and the communities which they serve? Alcohol Alcohol 2014;49:96-102. 10.1093/alcalc/agt175 [DOI] [PMC free article] [PubMed] [Google Scholar]
Associated Data
This section collects any data citations, data availability statements, or supplementary materials included in this article.
Supplementary Materials
Web appendix: Supplementary material