

Abstract
Background
There exists a wide interindividual variability in blood pressure (BP) response to β1‐blockers. To identify the genetic determinants of this variability, we performed a pharmacogenomic genome‐wide meta‐analysis of genetic variants influencing β1‐blocker BP response.
Methods and Results
Genome‐wide association analysis for systolic BP and diastolic BP response to β1‐blockers from 5 randomized clinical trials consisting of 1254 patients with hypertension of European ancestry were combined in meta‐analysis and single nucleotide polymorphisms (SNPs) with P<10−4 were tested for replication in 2 independent randomized clinical trials of β1‐blocker–treated patients of European ancestry (n=1552). Regions harboring the replicated SNPs were validated in a β1‐blocker–treated black cohort from 2 randomized clinical trials (n=315). A missense SNP rs28404156 in BST1 was associated with systolic BP response to β1‐blockers in the discovery meta‐analysis (P=9.33×10⁻⁵, β=−3.21 mm Hg) and replicated at Bonferroni significance (P=1.85×10⁻⁴, β=−4.86 mm Hg) in the replication meta‐analysis with combined meta‐analysis approaching genome‐wide significance (P=2.18×10⁻⁷). This SNP in BST1 is in linkage disequilibrium with several SNPs with putative regulatory functions in nearby genes, including CD38,FBXL5, and FGFBP1, all of which have been implicated in BP regulation. SNPs in this genetic region were also associated with BP response in the black cohort.
Conclusions
Data from randomized clinical trials of 8 European ancestry and 2 black cohorts support the assumption that BST1 containing locus on chromosome 4 is associated with β1‐blocker BP response. Given the previous associations of this region with BP, this is a strong candidate region for future functional studies and potential use in precision medicine approaches for BP management and risk prediction.
Keywords: blood pressure, hypertension, meta‐analysis, pharmacogenomics, β1‐blocker, β‐blocker
Subject Categories: Genetic, Association Studies; Hypertension; High Blood Pressure; Clinical Studies
Clinical Perspective
What Is New?
Although multiple genome‐wide association studies have attempted to investigate the genetic determinants of the large interindividual variability observed in the blood pressure (BP) response to β1‐blockers, most of these studies have been plagued by small sample sizes and lack of replication.
Using genome‐wide association study data from 8 distinct cohorts of β1‐blocker–treated participants, we performed the largest genome‐wide meta‐analysis to identify the genetic determinants of BP response to β1‐blockers and identified a locus near BST1 on chromosome 4p15.32 that was significantly associated with BP response with multiple levels of evidence.
What Are the Clinical Implications?
These findings indicate that the BST1 locus is involved in the BP response to β1‐blockers with multiple genes in this region having been previously implicated in pathways related to BP regulation and hypertension.
Additional investigations to understand the exact mechanism of this locus and the genes involved in mediating BP response can aid in the advancement of personalized β1‐blocker therapy for improved BP control and management.
Hypertension is a preventable risk factor for stroke, chronic heart failure, coronary artery disease, and kidney disease resulting in premature death and disability.1 Hypertension remains a global burden with an estimated direct cost of ≈$200 billion by 2030.2 More than 1.3 billion people worldwide are estimated to have hypertension and this estimate is expected to increase to 1.56 billion people globally by 2025.1, 3 Moreover, ≈4 in 10 adults older than 25 years have hypertension, and 9 of 10 adults living up to 80 years will develop hypertension.4
β‐Blockers, one of the many available pharmacotherapeutic interventions, have been used for the past 45 years and previously were recommended as first‐line agents for treating uncomplicated hypertension. However, over recent years, β‐blockers have fallen out of favor as first‐line therapy because of results of large meta‐analyses documenting poorer outcomes when compared with other drug classes such as diuretics, angiotensin‐converting enzyme inhibitors, angiotensin receptor blockers, or calcium channel blockers, for treating hypertension.5 Based on findings from these large studies, recent guidelines including American College of Cardiology/American Heart Association and National Institute for Health and Care Excellence no longer recommend β‐blockers as a first line of treatment in all or in a subset of patients.6, 7 While β‐blockers are not recommended as first‐line agents, they are still a preferred choice for treating patients with hypertension who have comorbid cardiovascular conditions such as angina, chronic heart failure, and arrhythmias, and as part of combination therapy for resistant hypertension.8, 9 As a result of this continued use of β‐blockers, there remains a need for individualizing β‐blocker–based antihypertensive therapy for better hypertension management, blood pressure (BP) control, and improved outcomes of patients who require β‐blocker therapy.
Studies have documented that patients of white ancestry usually respond favorably to β‐blocker therapy compared with other antihypertensive medications such as diuretics that result in better BP control in patients of black ancestry.10 However, there exists a wide interindividual variability in BP response to β‐blockers among patients of white ancestry, suggesting a need to understand related factors (genetic and nongenetic) that contribute to variability in BP response to β‐blockers, with an ultimate goal of optimizing BP management.11 Furthermore, β1‐selective blockers are the β‐blocker of choice for patients with hypertension who require β‐blocker therapy.16, 17 Identification of genetic factors of β1‐selective blocker therapy response through pharmacogenomics analyses could have the potential to achieve some of the goals for individualizing therapy among individuals with hypertension. To this end, several genome‐wide analyses conducted through individual studies have identified a few replicated signals of β1‐selective blocker therapy response.12, 13, 14, 15 To the best of our knowledge, there are no genome‐wide analyses for nonselective β‐blockers, which are not currently recommended as first line for treatment of hypertension. In this article, we aimed to perform the largest 2‐stage genome‐wide meta‐analysis using data from randomized clinical trials with genome‐wide data, as part of the ICAPS (International Consortium for Antihypertensive Pharmacogenomics Studies). However, as mentioned before, ICAPS only had pharmacogenomics trials with whole genome data for β1‐selective blocker–centered studies. Based on the phenotype of interest, our meta‐analysis study reported in this article focused on BP response to β1‐selective blockers, which comprised a total of 8 cohorts of hypertensive patients of white ancestry treated with β1‐blockers to identify pharmacogenetic markers associated with BP response.
Methods
Study Participants and Inclusion Criteria
The discovery genome‐wide association study (GWAS) meta‐analysis consisted of 5 study cohorts: PEAR (Pharmacogenomic Evaluation of Antihypertensive Responses),18 PEAR‐2 (Pharmacogenomic Evaluation of Antihypertensive Responses 2),19 LIFE‐Fin (Finnish arm of the Losartan Intervention For Endpoint Reduction in Hypertension Study),20 GENRES (Genetics of Drug Responsiveness in Essential Hypertension)13 and BB‐SS (Pharmacogenomics of Beta‐Blockers Sardinian Study). Detailed information of each of these cohorts is described in Data S1. For all participating cohorts, patients with uncomplicated hypertension and untreated systolic BP (SBP) >140 mm Hg or diastolic BP (DBP) >90 mm Hg were included in the study. Patients from all participating studies in the discovery cohort underwent an antihypertensive medication washout before starting the study, after which they were treated with β1‐blocker monotherapy for varying lengths of time according to each study‐specific protocol.
For replication, a meta‐analysis consisting of 3 study cohorts (INVEST [International Verapamil SR‐Trandolapril Study],21 ASCOT‐UK [Anglo‐Scandinavian Cardiac Outcomes Trial‐United Kingdom],22 and ASCOT‐SC [Anglo‐Scandinavian Cardiac Outcomes Trial‐Scandinavian]22) was used. ASCOT‐UK, ASCOT‐SC, and INVEST did not have a hypertensive medication washout period before starting the β1‐blocker therapy. Black participants from PEAR and PEAR‐2 were used for ethnic validation.
All of the studies were approved by institutional review committee, all of the participants signed informed consent, and studies were conducted in accordance with the regulations set forth by the Declaration of Helsinki. The data for PEAR have been made publicly available in the database of Genotypes and Phenotypes (dbGaP)23 (Accession: phs000649.v1.p1). The PEAR‐2 and INVEST data are currently in the process of being uploaded and will soon be available to other researchers in dbGaP. Clinical Trials included in this meta‐analysis can be found at: URL: https://www.clinicaltrials.gov. Unique identifiers: PEAR (Pharmacogenomic Evaluation of Antihypertensive Responses): NCT00246519; PEAR‐2 (Pharmacogenomic Evaluation of Antihypertensive Responses 2): NCT01203852; INVEST (International Verapamil SR Trandolapril Study): NCT00133692; GENRES (A Study on Molecular Genetics of Drug Responsiveness in Essential Hypertension): NCT03276598; and LIFE (Losartan Intervention For Endpoint Reduction in Hypertension): NCT00338260.
BP Response Phenotype
Multiple measures of BP response were available for each study and the most accurate BP measurement available for each study was used to determine the phenotype. PEAR‐219 used home BP measurements, whereas GENRES,24 BB‐SS, LIFE‐Fin,20 INVEST,21 ASCOT‐UK, and ASCOT‐SC used office BP measurements to define response to β1‐blockers. PEAR used a composite weighted average of BP response from office, home, and ambulatory day and nighttime values.25
For all studies, using the above‐mentioned BP measurements, β1‐blocker BP responses (diastolic and systolic BP response) were calculated as the difference between the start to the end of the β1‐blocker treatment.
Genotyping and Imputation
For each study, participants were genotyped on either an Illumina or an Affymetrix panel. Each study underwent standard quality control (QC) protocols for their genotype data to obtain high‐quality single nucleotide polymorphisms (SNPs) for their study, which were then imputed to the 1000G phase 3 reference panel for a total number of ≈47 million SNPs.
Statistical Analysis
Continuous variables are presented as mean±SD and categorical variables are presented as numbers and percentages.
We performed a 2‐stage genome‐wide meta‐analysis. The first stage comprised of a discovery GWAS meta‐analysis, which was followed by testing the top signals in a meta‐analysis replication cohort. The second stage was a combined meta‐analysis of the findings from both discovery and replication meta‐analysis. The detailed flowchart outlining the steps in the study is presented in Figure 1.
Figure 1.
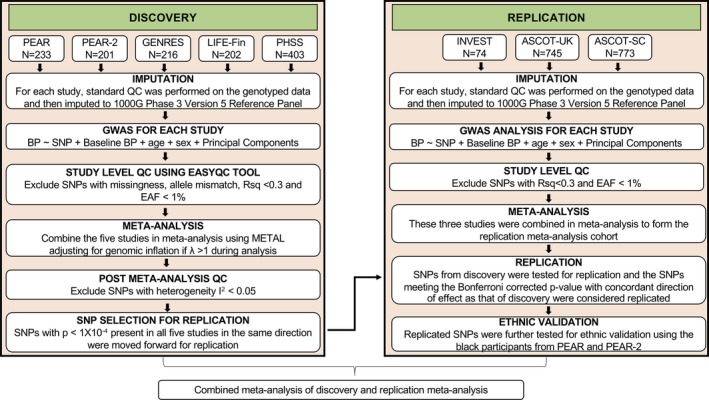
Overall design framework for the discovery and replication meta‐analysis. ASCOT‐SC indicates Anglo‐Scandinavian Cardiac Outcomes Trial‐Scandinavian; ASCOT‐UK, Anglo‐Scandinavian Cardiac Outcomes Trial‐United Kingdom; BB‐SS, Pharmacogenomics of Beta‐Blockers Sardinian Study; BP, blood pressure; EAF, effect allele frequency; GENRES, Genetics of Drug Responsiveness in Essential Hypertension; GWAS, genome‐wide association study; INVEST, International Verapamil SR‐Trandolapril Study; LIFE‐Fin, Finnish arm of the Losartan Intervention For Endpoint Reduction in Hypertension Study; METAL, Meta‐Analysis Helper; PEAR, Pharmacogenomic Evaluation of Antihypertensive Responses; QC, quality control; Rsq, imputation quality; SNPs, single nucleotide polymorphisms.
GWAS Per Study
A total of 1254 individuals from 5 cohorts (PEAR, PEAR‐2, LIFE‐Fin, GENRES, and BB‐SS) were included as part of the discovery GWAS meta‐analysis for BP response to β1‐blocker treatment. First, a GWAS for imputed SNPs was performed separately in each study for association with SBP and DBP response using linear regression adjusting for age, sex, pretreatment BP, and principal components for ancestry. Regression analysis was conducted using either EPACTS or SNPTEST. Each study filtered the tested SNPs at a minor allele frequency cutoff of >1% and imputation QC (Rsq) of >0.30.
QC Per Study
Results from each study further underwent stringent standard QC procedures using the EasyQC package as per protocol described by Winkler et al,26 to account for heterozygosity, missingness, and allele mismatches. Quantile‐quantile plots, P‐Z test, and allele frequency mismatch plots were generated using EasyQC.
Discovery GWAS Meta‐Analysis
After QC, the GWAS results from each cohort were combined in a meta‐analysis using the inverse variance method with fixed effect model performed using Meta‐Analysis Helper (METAL).27 A genomic inflation (λ) correction was applied if genomic inflation was deemed to exist (λ >1) for any of the studies. As mentioned previously, each of the studies in the discovery meta‐analysis GWAS were imputed to the same reference panel. However, each of the GWAS results from the study was subjected to stringent QC and a different number of SNPs were removed from each study based on the QC criteria. However, for the purpose of discovery meta‐analysis we focused only on the 6596214 SNPs that were present in all 5 studies. After meta‐analysis, we applied a stringent prioritization criterion to select SNPs from the discovery meta‐analysis and focused only on SNPs with the same direction of association across all 5 studies in the discovery meta‐analysis and deemed SNPs that met the conventionally acceptable P<5×10⁻⁸ as genome‐wide significant. The suggestive level of association was set at a threshold of P=1×10⁻⁴. SNPs that met the suggestive level of association with a concordant direction of association across all 5 studies were further linkage disequilibrium (LD) pruned at r 2>0.2 using LD Link,28 to obtain single independent SNPs representative of each associated locus that were tested for replication. The number of independent signals were used to calculate a Bonferroni‐corrected α level (0.05/# of independent signals), to determine whether SNPs were replicated for SBP and DBP responses in the replication cohort.
Replication GWAS Meta‐Analysis
A total of 1592 individuals from 3 study cohorts (INVEST, ASCOT‐UK, and ASCOT‐SC) were included in the replication meta‐analysis. Since replication cohorts did not have a hypertensive medication washout before starting the β1‐Blocker therapy, the analysis was adjusted for a dummy variable indicative of patient treatment status (yes=1, no=0), if patients were or were not treated, respectively, with any antihypertensive medication at the start of their β1‐blocker therapy. Summary statistics for SNPs meeting the suggestive level of significance from the discovery GWAS meta‐analysis were looked up in each study of the defined replication cohorts, which were then combined in meta‐analysis to form the replication meta‐analysis cohort. SNPs were deemed replicated if they met the Bonferroni‐corrected P value for association with SBP (3.4×10⁻⁴) and DBP (4.3×10⁻⁴) response, with concordant direction of association as in the discovery meta‐analysis.
Combined Discovery and Replication Meta‐Analysis
Summary statistics of discovery and replication GWAS and meta‐analyses were further combined in a meta‐analysis. Genome‐wide significance for this combined meta‐analysis was set at P=5×10⁻⁸.
Secondary Validation
The SBP and DBP association results for black participants with hypertension from PEAR‐2 and PEAR were combined in a meta‐analysis and used for ethnic validation of SNPs that were successfully replicated in an INVEST/ASCOT‐UK/ASCOT‐SC replication cohort. Given the differences in LD between the genome of people with white and African ancestry, we did not expect the same SNPs to be necessarily validated. Hence, we scanned the genetic region surrounding the index SNP (±500 kb) for any SNPs that were associated with the SBP or DBP response in the same direction as that of the index SNP at a Bonferroni‐corrected P value.
In Silico Analysis
In an attempt to identify the putative functional SNP, all SNPs in high LD (r 2>0.8) with the replicated SNP (rs28404156 of BST1 locus) based on the 1000G phase 3 reference panel were extracted using the rAggar.29 RegulomeDB30 was used to annotate and score these SNPs to identify potentially regulatory SNPs in LD with the index SNP using a stringent score of ≤4.30 The expression Quantitative Trait Locus (eQTL) of all of these SNPs in LD with the replicated SNPs was evaluated using HaploReg v4.1 databases.31
Results
Clinical characteristics of all 8 participating cohorts in the β1‐blocker discovery and replication meta‐analysis are summarized in Table 1. All participants were of European ancestry. Men and women were similarly represented in all of the studies, with the exceptions of GENRES, which was composed of men only, and ASCOT, which was composed of predominantly men. The clinical characteristics of the black patients from PEAR‐2 and PEAR treated with a β1‐blocker, and included in the secondary validation, are summarized in Table S1.
Table 1.
Clinical Characteristics of all White Participants for the 8 Studies in the Discovery and Replication Meta‐Analysis
| Discovery Meta‐Analysis | Replication Meta‐Analysis | |||||||
|---|---|---|---|---|---|---|---|---|
| PEAR | PEAR‐2 | GENRES | LIFE‐Fin | BB‐SS | ASCOT‐UK | ASCOT‐SC | INVEST | |
| No. | 233 | 201 | 216 | 202 | 403 | 745 | 773 | 74 |
| β‐Blocker | Atenolol | Metoprolol | Bisoprolol | Atenolol | Atenolol | Atenolol | Atenolol | Atenolol |
| Treatment duration | 8 wk | 8 wk | 4 wk | 61 d (average) | 4 wk | 6 wk | 6 wk | 6 wk |
| Age, y | 49±9.52 | 51±8.99 | 50.5±6.3 | 64.0±6.5 | 51.7±11.4 | 63.1±8.3 | 60.8±8.9 | 68.35±9.21 |
| Women, No. (%) | 109 (46.78) | 65 (48.14) | 0 | 97 (48.0) | 214 (53.1) | 114 (15.2) | 177 (22.9) | 41 (54.66) |
| Body mass index, kg/m2 | 30.30±4.90 | 30.66±4.95 | 26.7±2.7 | 27.1±3.6 | 26.9±4.08 | 28.4±4.6 | 28.4±4.2 | 29 ± 6 |
| Baseline SBP, mm Hg | 145.46±9.68 | 147.49±10.83 | 151.9±13.1 | 166.4±13.2 | 159.3±15.3 | 159.7±14.9 | 164.8±16.5 | 146.41±15.43 |
| Baseline DBP, mm Hg | 93.20±5.54 | 93.94±5.63 | 100.0±7.2 | 97.6±6.4 | 102.5±10.7 | 92.6±9.1 | 96.3±9.8 | 84.01±10.21 |
| Post‐treatment SBP, mm Hg | 136.11±11.46 | 137.32±12.82 | 138.9±15.2 | 145.1±13.1 | 136.3±16.5 | 148.8±20.7 | 156.4±22.1 | 136.82±15.48 |
| Post‐treatment DBP, mm Hg | 86.05±7.75 | 84.90±7.45 | 90.2±8.7 | 84.8±6.4 | 84.9±10.9 | 83.9±10.1 | 89.6±10.5 | 77.53±8.63 |
| ∆SBP, mm Hg | −12.67±8.61 | −10.19±9.20 | −13.0±10.5 | −21.3±12.8 | −23.0±17.7 | −10.8±19.7 | −8.4±20.7 | −9.59±16.96 |
| ∆DBP, mm Hg | −10.50±5.77 | −9.05±6.07 | −9.8±6.9 | −12.8±6.6 | −17.7±11.2 | −8.5±10.6 | −6.7±10.4 | −6.47±10.84 |
Values are presented as mean±SD unless otherwise noted. ASCOT‐SC indicates Anglo‐Scandinavian Cardiac Outcomes Trial‐Scandinavian; ASCOT‐UK, Anglo‐Scandinavian Cardiac Outcomes Trial‐United Kingdom; BB‐SS, Pharmacogenomics of Beta‐Blockers Sardinian Study; DBP, diastolic blood pressure; GENRES, Genetics of Drug Responsiveness in Essential Hypertension; INVEST, International Verapamil SR‐Trandolapril Study; LIFE‐Fin, Finnish arm of the Losartan Intervention For Endpoint Reduction in Hypertension Study; PEAR, Pharmacogenomic Evaluation of Antihypertensive Responses; SBP, systolic blood pressure.
Discovery GWAS Meta‐Analysis
GWAS discovery meta‐analysis for SBP and DBP responses to β1‐blockers was performed using 5 cohorts (PEAR, PEAR‐2, LIFE‐Fin, GENRES, and BB‐SS). Manhattan and QQ plots for association are shown in Figure 2. The QQ plots for both SBP and DBP do not exhibit any inflation indicative of population substructure beyond that expected by chance alone. None of the SNPs reached genome‐wide significance for either SBP or DBP response. However, 1207 SNPs for SBP and 842 SNPs for DBP met the suggestive level of significance (P<1×10⁻⁴). With LD pruning (r 2>0.2), a total of 280 and 218 independent signals associated with SBP and DBP, respectively, were identified and tested for replication.
Figure 2.
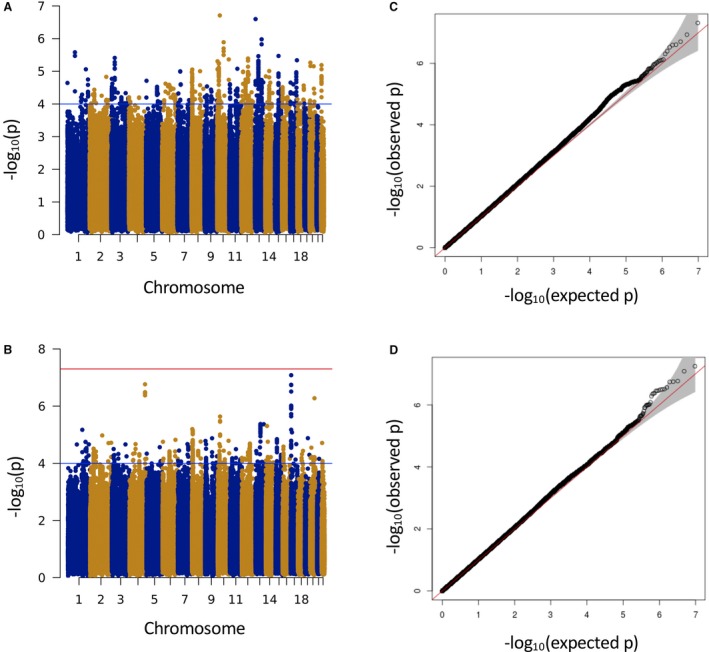
Manhattan (A and B) and quantile‐quantile (C and D) plots from meta‐analysis of genome‐wide association for systolic (A and C) and diastolic (B and D) blood pressure responses to β1‐blocker treatment. The blue line refers to the suggestive level of significance (P<1×10⁻⁴). The red line refers to the genome‐wide significance (P=5×10⁻⁸).
Replication GWAS Meta‐Analysis
For association with SBP response, the SNP rs28404156 was successfully replicated with a Bonferroni‐corrected P value and was associated in the same direction as in the discovery meta‐analysis. (Discovery: P=9.33×10⁻⁵ and β=−3.21±0.82; replication: P=1.85×10⁻⁴ and β=−4.86±1.3) (Table 2). rs28404156 (G‐>A) is a missense variant that causes an arginine to histidine (Arg153His) amino acid change in BST1 and is an eQTL31 for FAM200B(Artery_Tibial). The regional plot for rs28404516 for the white population is presented in Figure 3A.
Table 2.
Discovery Meta‐Analysis Association Result and Replication Meta‐Analysis and Combined Meta‐Analysis of Discovery and Replication Meta‐Analysis
| SNP | CHR | BP | EA | OA | Gene/Region | Discovery Meta‐Analysis | Replication Meta‐Analysis | Combined Meta‐Analysis | ||||||||
|---|---|---|---|---|---|---|---|---|---|---|---|---|---|---|---|---|
| EAF | Effect | SE | P Value | EAF | Effect | SE | P Value | Effect | SE | P Value | ||||||
| rs28404156 | 4 | 1573732 | A | G | BST1 | 0.080 | −3.21 | 0.82 | 9.33×10−05 | 0.072 | −4.86 | 1.30 | 1.8×10⁻⁴ | −3.60 | 0.69 | 2.18×10−07 |
β indicates regression coefficient for effect allele; BP, base pair position (hg19); CHR, chromosome; EA, effect allele; EAF, effect allele frequency; OA: other allele; SE, standard error of the beta coefficient; SNP, single nucleotide polymorphism.
Figure 3.
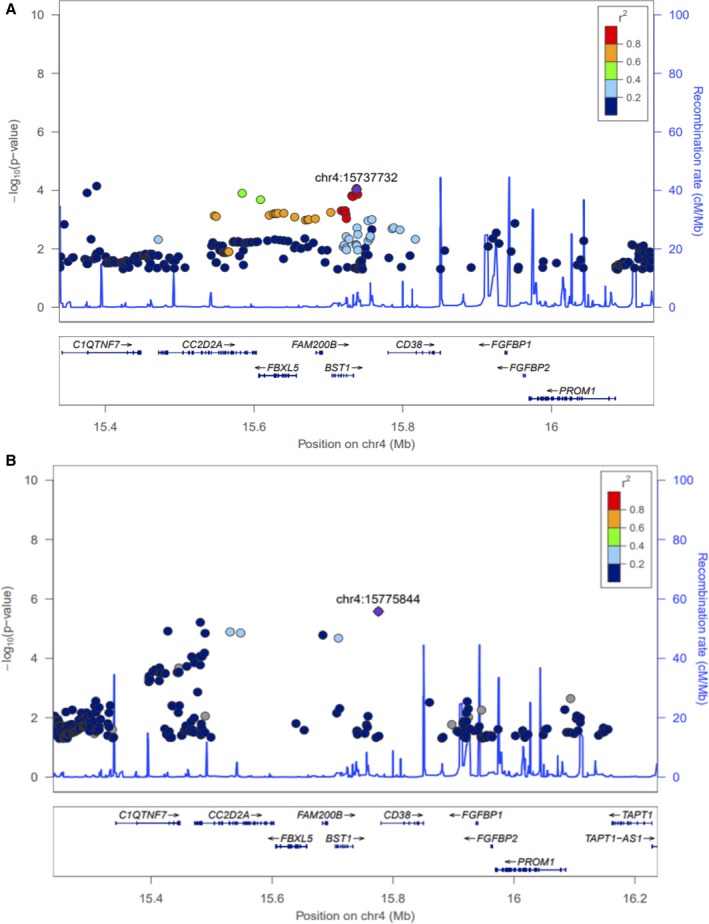
Regional plot of the BST1 locus in white (A) and blacks (B).
The least square adjusted means for SBP response by genotype for rs28404156 was plotted for the studies that were part of the discovery meta‐analysis (PEAR, PEAR‐2, LIFE‐Fin, GENRES, and BB‐SS) as these were the only studies for which this analysis was available. Given the low minor allele frequency of rs28404156 (0.08), only heterozygotes but no homozygotes for the minor allele were available in all of the discovery studies except BB‐SS. Among the 5 studies, the A allele carriers had better SBP response compared with the noncarriers (Figure S1).
In contrast, for association with DBP responses, none of the SNPs that were tested met the Bonferroni‐corrected P value for replication.
Combined Discovery and Replication Meta‐Analysis
None of the SNPs met genome‐wide significance in the combined discovery‐replication meta‐analysis and the association of the replicated SNP rs28404156 with SBP response reached a meta‐analysis P value of 1.15×10⁻⁷.
Ethnic Validation
The black cohort from PEAR and PEAR‐2 were used for ethnic validation of the replicated SNP rs28404156. rs28404156 was not significantly associated in the black cohort. However, considering the region (±500 kb) surrounding the SNP rs28404156, another SNP, rs193131744, was found to be significantly associated with reduction in SBP in response to β1‐blocker treatment with a concordant direction as that of discovery meta‐analysis (discovery: P=2.64×10⁻⁶ and β=−16.87) (Figure 3B).
In Silico Analysis
A total of 12 SNPs in high LD (r 2>0.8) with the replicated SNP (rs28404156) were extracted using rAggar. Of these, the functional prediction performed using regulome DB identified 3 variants that met the stringent cutoff threshold of <4. We also investigated the eQTL traits of these 12 SNPs using HaploReg v4.1, and 10 of these variants were also eQTLs for either BST1 or other nearby genes of this locus such as CD38, FBXL5, and FAM200B. The details of the LD (r 2 and D’), eQTLs and the correlated genes and tissues, the RegulomeDB scores, and the potential regulatory functions have been outlined in Table S2. There were 3 variants that were positively predicted by both tools used (RegulomeDB and Haplroreg v4.1), further strengthening their putative roles as functional/regulatory variants (Table S2).
Discussion
To our knowledge, this is the largest genome‐wide meta‐analysis for antihypertensive response to β1‐blocker treatment, consisting of 5 randomized controlled trials for discovery and 3 randomized clinical trials for replication, followed by ethnic validation of the replicated SNPs among a cohort of black patients from 2 randomized clinical trials. We successfully identified and replicated a missense variant, rs28404156 in the BST1 locus, which was significantly associated with SBP response to β1‐blockers. The carriers of the A allele of this SNP had a significantly better SBP response in both discovery and the replication meta‐analysis. Given LD differences across race groups, even though the exact SNP did not replicate in the black cohort, we were able to validate the genomic region by identifying other SNPs that were significantly associated with BP response to β1‐blockers. This further points towards the potential importance of this locus in β1‐blocker BP responsiveness.
The SNP rs28404156 is present in the BST1 gene and represents a missense SNP along with being an eQTL for FAM200B. This SNP results in an arginine to histidine substitution. Arginines are usually involved in formation of salt bridges needed for protein stability and, accordingly, its replacement could have implication on the BST1 protein function. BST1, also known as CD157, encodes for ADP‐ribosyl cyclase 2, which is a cell surface receptor expressed in bone marrow stromal cells and is primarily involved in regulation of pre–B‐cell growth. It is now known that BST1 is also expressed in multiple other cell types including vascular endothelial stem cells, monocytes, and mast cells.32 Although no direct association between BST1 and BP regulation has been reported, there are various pathways and signaling components that BST1 may interact with to influence the pathophysiology of hypertension. For example, BST1/CD157 influences the phosphorylation of focal adhesion kinase33 and calcium homeostasis34 which are known to be involved in the hypertension‐vascular signaling cascade. BST1/CD157 is also involved in various immune and inflammation responses, including regulation of motility and transendothelial migration of monocytes and their adhesion to extracellular matrix proteins.32 The fact that BST1 is expressed in a larger number of tissue subtypes was only recently discovered, implying that the interaction of BST1 with these signaling cascades with respect to hypertension may warrant further study.
This replicated SNP is located on chromosome 4p15.32 on the distal part of the small segment of chromosome 4. Multiple previous studies have identified and reported the distal region of chromosome 4p to be involved with BP regulation, which further highlights the importance of this locus in BP response.35, 36 There are several genes present in this locus, with variants in high LD with our successfully replicated index SNP (±500 kb) such as CD38, FAM200B, FBXL5, FGFBP1, and FGFBP2. Many of these genes have been implicated in various physiological and pathophysiological components of hypertension signaling. To further investigate the plausible involvement of this locus in BP response, we used in silico approaches and identified several SNPs in high LD with the replicated SNP in BST1 as well as in other genes in this genomic locus (±500 kb). Further investigation using in silico analysis revealed that several of these SNPs were predicted to have regulatory function and are eQTLs for the genes in the same locus.
Some of these SNPs with potential regulatory function were found to be in high LD with our index replicated SNP and were present in CD38. Interestingly, CD38 is a transmembrane protein that shares 33% homology with BST1 and has both ADP‐ribosyl cyclase and cyclic adenosine 5′‐diphosphate ribose hydrolase activities.37 CD38 has been shown to be involved in multiple key processes such as vascular contraction, apoptosis, and neural signaling via its involvement in calcium regulation, which plays a key role in hypertension as well as cardiovascular diseases, renal regulation, and energy metabolism.38 Studies have also shown that elimination of CD38 prevents mice from gaining weight and becoming obese while on a high‐fat diet via a SIRT‐dependent mechanism.39 Some recent human studies have found a similar association between CD38 and metabolic syndrome in which high BP is an important factor.40 Of note, one study has shown that CD38‐deficient mice have increased plasma renin activity.41 This could have implications for β1‐blocker BP response given that higher plasma renin activity has been reported to be associated with better BP responses to β1‐blocker monotherapy as well as to various add‐on therapies.42 Several studies have reported the direct activation of CD38 by angiotensin II (Ang II), endothelin‐1, and norepinephrine, as well as indirect activation via the generation of reactive oxygen species.43, 44 Upon activation, CD38 generates the endogenous calcium secondary messengers, ie, cyclic adenosine 5′‐diphosphate ribose and nicotinic acid adenosine dinucleotide phosphate, which modulate the intracellular calcium transients resulting in vasoconstriction.38, 45 These studies indicate that CD38 plays an important role in the modulation of agonist‐induced vascular smooth muscle cell responses. These responses might have an important implication in the regulation of BP by β1‐blockers and need further elucidation.
FBXL5 is another gene harboring SNPs in LD with the index SNPs. FBXL5 belongs to the F‐box family of proteins and encodes for F‐box and leucine‐rich repeat protein 5. It acts as an iron sensor and has been reported to be a tumor suppressor.46 One of the meta‐analyses of data from 6 global whole blood gene expression studies for BP and hypertension found FBXL5 to be one of the differentially expressed genes and to be significantly associated with DBP.47 The index SNP as well as several other SNPs in LD with the index SNP were also eQTLs for FAM200B. However, not much information is available in the literature regarding FAM200B in relation to the BP phenotype or related pathways.
FGFBP1 is among other genes in this associated locus. Even though we could not find SNPs in FGFBP1 that were in LD with the rs28404156 SNP, the importance of this gene in hypertension and BP response cannot be overlooked. FGFBP1 encodes for fibroblast growth factor (FGF)–binding protein 1 (FGFBP1) and is involved in the modulation of the FGF signaling. FGFs are a family of proteins, many of which have been implicated in pathways related to hypertension.48, 49 Specifically, FGFBP1 is a precursor protein that releases FGF1 from the extracellular matrix and has been investigated for its role in modulating BP. Cuevas et al50, 51 reported a decrease in the endothelial FGF in the blood vessels of spontaneously hypertensive rats and further showed that systemic administration of FGF improves the impaired endothelial cells and nitric oxide synthase resulting in improvement in hypertension. Similarly, studies in hypertensive rats have deemed the FGFBP1 locus to be important in the development of glomerular damage and hypertension.52 Further, a recent family‐based study from Poland reported a novel association between variants in the FGFBP1 and familial hypertension. This report also showed an increased expression of the FGFBP1 in the kidneys of these patients with hypertension.51, 53 More recently, studies in transgenic mice have shown that increased expression of FGFBP1 resulted in an increase of >30 mm Hg in arterial pressure by increasing the sensitivity of the blood vessels to Ang II.54 The investigators of this study postulated that targeted inhibition of the FGF signaling using FGF inhibitors, which are conventionally used for cancer treatment, might help in controlling hypertension as well. They tested this theory by using an FGF inhibitor in transgenic mice overexpressing FGFBP1 and found that Ang II sensitivity of the vasculature was reversed, resulting in decreased BP.54 Given the fact that β1‐blockers are known to suppress the renin system and Ang II levels in the plasma,55 it is important to consider the cross‐talk between β1‐blockers, Ang II, and FGFBP1. Additional investigations to better understand this cross‐talk is needed to further elucidate the possible contribution of FGFBP1 to β1‐blocker BP response.
Study Strengths and Limitations
Overall, this study has certain noteworthy strengths. To our knowledge, this is the largest pharmacogenomic GWAS assessing the underlying genetic variants contributing to variable BP response. Through our discovery, replication, and ethnic validation efforts we were able to identify and thoroughly validate the association of the BST1‐containing locus with β1‐blocker BP response. Although various genes in this locus have been previously implicated in BP‐related signaling, this is the first time a direct association with response to β1‐blocker treatment has been identified. Furthermore, our criteria for selecting markers from the discovery meta‐analysis for testing in replication were stringent, which ensured the consistency of direction across the data sets for the identified association.
We acknowledge the limitations of our study as well. While this is considered the largest pharmacogenomics analysis of β1‐blockers response including 8 cohorts (5 discovery and 3 replication) and consisted of >2000 participants, our results did not identify genome‐wide significance, which may be partly attributed to reduced power driven by variants with low‐modest effect size. Additionally, subtle heterogeneity in BP response phenotype across the different studies may have led to failure to identify genome‐wide significant signals. Nevertheless, the association of SNPs in the replication cohort at a Bonferroni‐corrected P value, as well as ethnic validation of the region, suggest the importance of the genomic locus. Another limitation is the use of different β1‐blockers across studies included in this meta‐analysis. Although the majority of the studies used atenolol in their design, GENRES and PEAR‐2 used bisoprolol and metoprolol, respectively. Bisoprolol was used at 5 mg/d, which is equivalent to 50 mg/d as that of atenolol56 and is the dose that was used in the majority of the atenolol studies in this article, except for PEAR, in which the target atenolol dose was 100 mg/d upon titration. Likewise, for metoprolol, the patients were started on 50 mg/d with uptitration to 100 mg twice per day in PEAR‐2; in this case, the equivalent atenolol doses are ≈100 mg once per day.57 Hormones are known to play a role in modulating BP, and hormone replacement therapy can interfere with BP levels. Another limitation of this study is that exclusion of women taking any kind of hormone replacement therapy was not consistently across all of the studies that are part of this meta‐analysis. While some studies excluded women taking oral contraceptives or hormone replacement therapy, others did not. This precludes the ability to include hormone replacement therapy, which may influence BP, as a covariate in our association analysis. However, using our stringent thresholds and multistage GWAS efforts, we were able to identify a strong association with multiple levels of evidence. This article leverages the power of collaborative efforts within ICAPS to investigate genetic determinants of BP response, and showcases potential opportunities to investigate other important related phenotypes such as heart rate reduction response to β‐blockers in future
Conclusions
We performed the largest genome‐wide meta‐analysis of BP response to β1‐blockers and successfully identified and replicated an SNP in the BST1 locus that was significantly associated with BP response to β1‐blockers. We were further able to gather additional evidence in support of the region containing this SNP using in silico approaches, and further identified SNPs in high LD with the index SNP with putative regulatory and functional effects. These data collectively suggest the importance of this region in mediating BP response to β1‐blockers, warranting further studies to understand the exact underlying mechanism(s). Deeper insights about such pharmacogenomic markers and loci can ultimately pave the way for personalized β1‐blocker use with optimum BP control and outcomes.
Sources of Funding
Both PEAR‐2 and PEAR studies were supported by the National Institutes of Health (NIH) Pharmacogenomics Research Network grant U01‐GM074492 and the National Center for Advancing Translational Sciences. Award numbers UL1 TR000064 (University of Florida); UL1 TR000454 (Emory University), and UL1 TR000135 (Mayo Clinic). PEAR was also supported by funds from the Mayo Foundation. LIFE‐Fin and GENRES were supported by the Sigrid Juselius Foundation, The Finnish Foundation for Cardiovascular Research, and the Helsinki University Central Hospital. BB‐SS studies were supported by the HYPERGENES project (FP7‐HEALTHF4‐2007‐201550), InterOmics (PB05 MIUR‐CNR Italian Flagship Project), and the ‘Associazione per lo sviluppo della ricerca sull'ipertensione arteriosa e sulle malattie cardiovascolari—ONLUS’. ASCOT was funded by the National Institutes for Health Research (NIHR) as part of the portfolio of translational research of the NIHR Barts Biomedical Research Unit and the NIHR Biomedical Research Centre at Imperial College, the International Centre for Circulatory Health Charity, and the Medical Research Council through G952010. INVEST was funded by NIH grants HL074730, HL69758, and RR017568; a grant from Abbott Pharmaceuticals; and an American Heart Association Postdoctoral Fellowship 0625619B.
Disclosures
None.
Supporting information
Data S1. Supplemental Methods.
Table S1. Clinical Characteristics of Black Participants From PEAR and PEAR‐2
Table S2. In Silico Analysis of the SNPs in LD With the Replicated SNP rs28404156 Using RegulomeDB and HaploReg v4.1
Figure S1. Change in systolic blood pressure post β1‐blocker treatment by rs28404156 genotype.
Acknowledgments
We would like to thank the participants, staff, and study physicians of the PEAR, PEAR‐2, LIFE‐Fin, GENRES, BB‐SS INVEST, and ASCOT studies for their contributions.
(J Am Heart Assoc. 2019;8:e013115 DOI: 10.1161/JAHA.119.013115.)
References
- 1. Mills KT, Bundy JD, Kelly TN, Reed JE, Kearney PM, Reynolds K, Chen J, He J. Global disparities of hypertension prevalence and control: a systematic analysis of population‐based studies from 90 countries. Circulation. 2016;134:441–450. [DOI] [PMC free article] [PubMed] [Google Scholar]
- 2. DePalma SM, Himmelfarb CD, MacLaughlin EJ, Taler SJ. Hypertension guideline update: a new guideline for a new era. JAAPA. 2018;31:16–22. [DOI] [PubMed] [Google Scholar]
- 3. Kearney PM, Whelton M, Reynolds K, Muntner P, Whelton PK, He J. Global burden of hypertension: analysis of worldwide data. Lancet. 2005;365:217–223. [DOI] [PubMed] [Google Scholar]
- 4. Campbell NR, Khalsa T, Lackland DT, Niebylski ML, Nilsson PM, Redburn KA, Orias M, Zhang XH, Burrell L, Horiuchi M, Poulter NR, Prabhakaran D, Ramirez AJ, Schiffrin EL, Touyz RM, Wang JG, Weber MA; World Stroke Organization; International Diabetes Federation; International Council of Cardiovascular Prevention and Rehabilitation; International Society of Nephrology . High Blood Pressure 2016: Why Prevention and Control Are Urgent and Important. The World Hypertension League, International Society of Hypertension, World Stroke Organization, International Diabetes Foundation, International Council of Cardiovascular Prevention and Rehabilitation, International Society of Nephrology. J Clin Hypertens (Greenwich). 2016;18:714–717. [DOI] [PMC free article] [PubMed] [Google Scholar]
- 5. Wiysonge CS, Bradley HA, Volmink J, Mayosi BM. Cochrane corner: beta‐blockers for hypertension. Heart. 2018;104:282–283. [DOI] [PMC free article] [PubMed] [Google Scholar]
- 6. James PA, Oparil S, Carter BL, Cushman WC, Dennison‐Himmelfarb C, Handler J, Lackland DT, LeFevre ML, MacKenzie TD, Ogedegbe O, Smith SC, Svetkey LP, Taler SJ, Townsend RR, Wright JT, Narva AS, Ortiz E. 2014 evidence‐based guideline for the management of high blood pressure in adults: report from the panel members appointed to the Eighth Joint National Committee (JNC 8). JAMA. 2014;311:507–520. [DOI] [PubMed] [Google Scholar]
- 7. Krause T, Lovibond K, Caulfield M, McCormack T, Williams B; Guideline Development Group . Management of hypertension: summary of NICE guidance. BMJ. 2011;343:d4891. [DOI] [PubMed] [Google Scholar]
- 8. Jarari N, Rao N, Peela JR, Ellafi KA, Shakila S, Said AR, Nelapalli NK, Min Y, Tun KD, Jamallulail SI, Rawal AK, Ramanujam R, Yedla RN, Kandregula DK, Argi A, Peela LT. A review on prescribing patterns of antihypertensive drugs. Clin Hypertens. 2015;22:7. [DOI] [PMC free article] [PubMed] [Google Scholar]
- 9. Shah SJ, Stafford RS. Current trends of hypertension treatment in the United States. Am J Hypertens. 2017;30:1008–1014. [DOI] [PMC free article] [PubMed] [Google Scholar]
- 10. Jamerson K, DeQuattro V. The impact of ethnicity on response to antihypertensive therapy. Am J Med. 1996;101:22S–32S. [DOI] [PubMed] [Google Scholar]
- 11. Materson BJ. Variability in response to antihypertensive drugs. Am J Med. 2007;120:S10–S20. [DOI] [PubMed] [Google Scholar]
- 12. Gong Y, McDonough CW, Beitelshees AL, El Rouby N, Hiltunen TP, O'Connell JR, Padmanabhan S, Langaee TY, Hall K, Schmidt SO, Curry RW, Gums JG, Donner KM, Kontula KK, Bailey KR, Boerwinkle E, Takahashi A, Tanaka T, Kubo M, Chapman AB, Turner ST, Pepine CJ, Cooper‐DeHoff RM, Johnson JA. PTPRD gene associated with blood pressure response to atenolol and resistant hypertension. J Hypertens. 2015;33:2278–2285. [DOI] [PMC free article] [PubMed] [Google Scholar]
- 13. Hiltunen TP, Donner KM, Sarin AP, Saarela J, Ripatti S, Chapman AB, Gums JG, Gong Y, Cooper‐DeHoff RM, Frau F, Glorioso V, Zaninello R, Salvi E, Glorioso N, Boerwinkle E, Turner ST, Johnson JA, Kontula KK. Pharmacogenomics of hypertension: a genome‐wide, placebo‐controlled cross‐over study, using four classes of antihypertensive drugs. J Am Heart Assoc. 2015;4:e001521 DOI: 10.1161/JAHA.115.001778 [DOI] [PMC free article] [PubMed] [Google Scholar]
- 14. Gong Y, Wang Z, Beitelshees AL, McDonough CW, Langaee TY, Hall K, Schmidt SO, Curry RW, Gums JG, Bailey KR, Boerwinkle E, Chapman AB, Turner ST, Cooper‐DeHoff RM, Johnson JA. Pharmacogenomic genome‐wide meta‐analysis of blood pressure response to β‐blockers in hypertensive African Americans. Hypertension. 2016;67:556–563. [DOI] [PMC free article] [PubMed] [Google Scholar]
- 15. Singh S, El Rouby N, McDonough CW, Gong Y, Bailey KR, Boerwinkle E, Chapman AB, Gums JG, Turner ST, Cooper‐DeHoff RM, Johnson JA. Genomic association analysis reveals variants associated with blood pressure response to beta‐blockers in European Americans. Clin Transl Sci. 2019; DOI: 10.1111/cts.12643. [DOI] [PMC free article] [PubMed] [Google Scholar]
- 16. Taylor J. 2013 ESH/ESC guidelines for the management of arterial hypertension. Eur Heart J. 2013;34:2108–2109. [PubMed] [Google Scholar]
- 17. Prichard BN, Cruickshank JM, Graham BR. Beta‐adrenergic blocking drugs in the treatment of hypertension. Blood Press. 2001;10:366–386. [DOI] [PubMed] [Google Scholar]
- 18. Johnson JA, Boerwinkle E, Zineh I, Chapman AB, Bailey K, Cooper‐DeHoff RM, Gums J, Curry RW, Gong Y, Beitelshees AL, Schwartz G, Turner ST. Pharmacogenomics of antihypertensive drugs: rationale and design of the Pharmacogenomic Evaluation of Antihypertensive Responses (PEAR) study. Am Heart J. 2009;157:442–449. [DOI] [PMC free article] [PubMed] [Google Scholar]
- 19. Hamadeh IS, Langaee TY, Dwivedi R, Garcia S, Burkley BM, Skaar TC, Chapman AB, Gums JG, Turner ST, Gong Y, Cooper‐DeHoff RM, Johnson JA. Impact of CYP2D6 polymorphisms on clinical efficacy and tolerability of metoprolol tartrate. Clin Pharmacol Ther. 2014;96:175–181. [DOI] [PMC free article] [PubMed] [Google Scholar]
- 20. Rimpelä JM, Kontula KK, Fyhrquist F, Donner KM, Tuiskula AM, Sarin AP, Mohney RP, Stirdivant SM, Hiltunen TP. Replicated evidence for aminoacylase 3 and nephrin gene variations to predict antihypertensive drug responses. Pharmacogenomics. 2017;18:445–458. [DOI] [PubMed] [Google Scholar]
- 21. Pepine CJ, Handberg‐Thurmond E, Marks RG, Conlon M, Cooper‐DeHoff R, Volkers P, Zellig P. Rationale and design of the International Verapamil SR/Trandolapril Study (INVEST): an Internet‐based randomized trial in coronary artery disease patients with hypertension. J Am Coll Cardiol. 1998;32:1228–1237. [DOI] [PubMed] [Google Scholar]
- 22. Sever PS, Dahlöf B, Poulter NR, Wedel H, Beevers G, Caulfield M, Collins R, Kjeldsen SE, McInnes GT, Mehlsen J, Nieminen M, O'Brien E, Ostergren J; ASCOT Steering Committee, Anglo‐Scandinavian Cardiac Outcomes Trial: a brief history, rationale and outline protocol. J Hum Hypertens. 2001;15(suppl 1):S11–S12. [DOI] [PubMed] [Google Scholar]
- 23. Johnson JA. Pharmacogenomic Evaluation of Antihypertensive Responses (PEAR). NCBI's Database of Genotypes and Phenotypes: dbGaP. Accession phs000649.v1.p1. 2016.
- 24. Hiltunen TP, Suonsyrjä T, Hannila‐Handelberg T, Paavonen KJ, Miettinen HE, Strandberg T, Tikkanen I, Tilvis R, Pentikäinen PJ, Virolainen J, Kontula K. Predictors of antihypertensive drug responses: initial data from a placebo‐controlled, randomized, cross‐over study with four antihypertensive drugs (The GENRES Study). Am J Hypertens. 2007;20:311–318. [DOI] [PubMed] [Google Scholar]
- 25. Turner ST, Schwartz GL, Chapman AB, Beitelshees AL, Gums JG, Cooper‐Dehoff RM, Boerwinkle E, Johnson JA, Bailey KR. Power to identify a genetic predictor of antihypertensive drug response using different methods to measure blood pressure response. J Transl Med. 2012;10:47. [DOI] [PMC free article] [PubMed] [Google Scholar]
- 26. Winkler TW, Day FR, Croteau‐Chonka DC, Wood AR, Locke AE, Mägi R, Ferreira T, Fall T, Graff M, Justice AE, Luan J, Gustafsson S, Randall JC, Vedantam S, Workalemahu T, Kilpeläinen TO, Scherag A, Esko T, Kutalik Z, Heid IM, Loos RJ; Genetic Investigation of Anthropometric Traits (GIANT) Consortium . Quality control and conduct of genome‐wide association meta‐analyses. Nat Protoc. 2014;9:1192–1212. [DOI] [PMC free article] [PubMed] [Google Scholar]
- 27. Willer CJ, Li Y, Abecasis GR. METAL: fast and efficient meta‐analysis of genomewide association scans. Bioinformatics. 2010;26:2190–2191. [DOI] [PMC free article] [PubMed] [Google Scholar]
- 28. Machiela MJ, Chanock SJ. LDlink: a web‐based application for exploring population‐specific haplotype structure and linking correlated alleles of possible functional variants. Bioinformatics. 2015;31:3555–3557. [DOI] [PMC free article] [PubMed] [Google Scholar]
- 29. Barrett JC, Fry B, Maller J, Daly MJ. Haploview: analysis and visualization of LD and haplotype maps. Bioinformatics. 2005;21:263–265. [DOI] [PubMed] [Google Scholar]
- 30. Boyle AP, Hong EL, Hariharan M, Cheng Y, Schaub MA, Kasowski M, Karczewski KJ, Park J, Hitz BC, Weng S, Cherry JM, Snyder M. Annotation of functional variation in personal genomes using RegulomeDB. Genome Res. 2012;22:1790–1797. [DOI] [PMC free article] [PubMed] [Google Scholar]
- 31. Ward LD, Kellis M. HaploReg v4: systematic mining of putative causal variants, cell types, regulators and target genes for human complex traits and disease. Nucleic Acids Res. 2016;44:D877–D881. [DOI] [PMC free article] [PubMed] [Google Scholar]
- 32. Ortolan E, Augeri S, Fissolo G, Musso I, Funaro A. CD157: from immunoregulatory protein to potential therapeutic target. Immunol Lett. 2019;205:59–64. [DOI] [PubMed] [Google Scholar]
- 33. Okuyama Y, Ishihara K, Kimura N, Hirata Y, Sato K, Itoh M, Ok LB, Hirano T. Human BST‐1 expressed on myeloid cells functions as a receptor molecule. Biochem Biophys Res Commun. 1996;228:838–845. [DOI] [PubMed] [Google Scholar]
- 34. Funaro A, Ortolan E, Ferranti B, Gargiulo L, Notaro R, Luzzatto L, Malavasi F. CD157 is an important mediator of neutrophil adhesion and migration. Blood. 2004;104:4269–4278. [DOI] [PubMed] [Google Scholar]
- 35. Chen W, Li S, Srinivasan SR, Boerwinkle E, Berenson GS. Autosomal genome scan for loci linked to blood pressure levels and trends since childhood: the Bogalusa Heart Study. Hypertension. 2005;45:954–959. [DOI] [PubMed] [Google Scholar]
- 36. Allayee H, de Bruin TW, Michelle Dominguez K, Cheng LS, Ipp E, Cantor RM, Krass KL, Keulen ET, Aouizerat BE, Lusis AJ, Rotter JI. Genome scan for blood pressure in Dutch dyslipidemic families reveals linkage to a locus on chromosome 4p. Hypertension. 2001;38:773–778. [DOI] [PubMed] [Google Scholar]
- 37. Deaglio S, Malavasi F. The CD38/CD157 mammalian gene family: an evolutionary paradigm for other leukocyte surface enzymes. Purinergic Signal. 2006;2:431–441. [DOI] [PMC free article] [PubMed] [Google Scholar]
- 38. Chini EN. CD38 as a regulator of cellular NAD: a novel potential pharmacological target for metabolic conditions. Curr Pharm Des. 2009;15:57–63. [DOI] [PMC free article] [PubMed] [Google Scholar]
- 39. Wang LF, Miao LJ, Wang XN, Huang CC, Qian YS, Huang X, Wang XL, Jin WZ, Ji GJ, Fu M, Deng KY, Xin HB. CD38 deficiency suppresses adipogenesis and lipogenesis in adipose tissues through activating Sirt1/PPARγ signaling pathway. J Cell Mol Med. 2018;22:101–110. [DOI] [PMC free article] [PubMed] [Google Scholar]
- 40. Chiang SH, Harrington WW, Luo G, Milliken NO, Ulrich JC, Chen J, Rajpal DK, Qian Y, Carpenter T, Murray R, Geske RS, Stimpson SA, Kramer HF, Haffner CD, Becherer JD, Preugschat F, Billin AN. Genetic ablation of CD38 protects against western diet‐induced exercise intolerance and metabolic inflexibility. PLoS One. 2015;10:e0134927. [DOI] [PMC free article] [PubMed] [Google Scholar]
- 41. Xiong J, Xia M, Yi F, Abais JM, Li N, Boini KM, Li PL. Regulation of renin release via cyclic ADP‐ribose‐mediated signaling: evidence from mice lacking CD38 gene. Cell Physiol Biochem. 2013;31:44–55. [DOI] [PMC free article] [PubMed] [Google Scholar]
- 42. Turner ST, Schwartz GL, Chapman AB, Beitelshees AL, Gums JG, Cooper‐DeHoff RM, Boerwinkle E, Johnson JA, Bailey KR. Plasma renin activity predicts blood pressure responses to beta‐blocker and thiazide diuretic as monotherapy and add‐on therapy for hypertension. Am J Hypertens. 2010;23:1014–1022. [DOI] [PMC free article] [PubMed] [Google Scholar]
- 43. Thai TL, Churchill GC, Arendshorst WJ. NAADP receptors mediate calcium signaling stimulated by endothelin‐1 and norepinephrine in renal afferent arterioles. Am J Physiol Renal Physiol. 2009;297:F510–F516. [DOI] [PMC free article] [PubMed] [Google Scholar]
- 44. Kim SY, Gul R, Rah SY, Kim SH, Park SK, Im MJ, Kwon HJ, Kim UH. Molecular mechanism of ADP‐ribosyl cyclase activation in angiotensin II signaling in murine mesangial cells. Am J Physiol Renal Physiol. 2008;294:F982–F989. [DOI] [PubMed] [Google Scholar]
- 45. Lee S, Paudel O, Jiang Y, Yang XR, Sham JS. CD38 mediates angiotensin II‐induced intracellular Ca(2+) release in rat pulmonary arterial smooth muscle cells. Am J Respir Cell Mol Biol. 2015;52:332–341. [DOI] [PMC free article] [PubMed] [Google Scholar]
- 46. Yao H, Su S, Xia D, Wang M, Li Z, Chen W, Ren L, Xu L. F‐box and leucine‐rich repeat protein 5 promotes colon cancer progression by modulating PTEN/PI3K/AKT signaling pathway. Biomed Pharmacother. 2018;107:1712–1719. [DOI] [PubMed] [Google Scholar]
- 47. Huan T, Esko T, Peters MJ, Pilling LC, Schramm K, Schurmann C, Chen BH, Liu C, Joehanes R, Johnson AD, Yao C, Ying SX, Courchesne P, Milani L, Raghavachari N, Wang R, Liu P, Reinmaa E, Dehghan A, Hofman A, Uitterlinden AG, Hernandez DG, Bandinelli S, Singleton A, Melzer D, Metspalu A, Carstensen M, Grallert H, Herder C, Meitinger T, Peters A, Roden M, Waldenberger M, Dörr M, Felix SB, Zeller T, Vasan R, O'Donnell CJ, Munson PJ, Yang X, Prokisch H, Völker U, van Meurs JB, Ferrucci L, Levy D; International Consortium for Blood Pressure GWAS (ICBP) . A meta‐analysis of gene expression signatures of blood pressure, hypertension. PLoS Genet. 2015;11:e1005035. [DOI] [PMC free article] [PubMed] [Google Scholar]
- 48. Ornitz DM, Itoh N. The Fibroblast Growth Factor signaling pathway. Wiley Interdiscip Rev Dev Biol. 2015;4:215–266. [DOI] [PMC free article] [PubMed] [Google Scholar]
- 49. Ren Y, Jiao X, Zhang L. Expression level of fibroblast growth factor 5 (FGF5) in the peripheral blood of primary hypertension and its clinical significance. Saudi J Biol Sci. 2018;25:469–473. [DOI] [PMC free article] [PubMed] [Google Scholar]
- 50. Cuevas P, Carceller F, Ortega S, Zazo M, Nieto I, Giménez‐Gallego G. Hypotensive activity of fibroblast growth factor. Science. 1991;254:1208–1210. [DOI] [PubMed] [Google Scholar]
- 51. Cuevas P, García‐Calvo M, Carceller F, Reimers D, Zazo M, Cuevas B, Muñoz‐Willery I, Martínez‐Coso V, Lamas S, Giménez‐Gallego G. Correction of hypertension by normalization of endothelial levels of fibroblast growth factor and nitric oxide synthase in spontaneously hypertensive rats. Proc Natl Acad Sci USA. 1996;93:11996–12001. [DOI] [PMC free article] [PubMed] [Google Scholar]
- 52. Braun MC, Herring SM, Gokul N, Monita M, Bell R, Hicks MJ, Wenderfer SE, Doris PA. Hypertensive renal disease: susceptibility and resistance in inbred hypertensive rat lines. J Hypertens. 2013;31:2050–2059. [DOI] [PMC free article] [PubMed] [Google Scholar]
- 53. Tomaszewski M, Charchar FJ, Nelson CP, Barnes T, Denniff M, Kaiser M, Debiec R, Christofidou P, Rafelt S, van der Harst P, Wang WY, Maric C, Zukowska‐Szczechowska E, Samani NJ. Pathway analysis shows association between FGFBP1 and hypertension. J Am Soc Nephrol. 2011;22:947–955. [DOI] [PMC free article] [PubMed] [Google Scholar]
- 54. Tassi E, Lai EY, Li L, Solis G, Chen Y, Kietzman WE, Ray PE, Riegel AT, Welch WJ, Wilcox CS, Wellstein A. Blood pressure control by a secreted FGFBP1 (Fibroblast Growth Factor‐Binding Protein). Hypertension. 2018;71:160–167. [DOI] [PMC free article] [PubMed] [Google Scholar]
- 55. Blumenfeld JD, Sealey JE, Mann SJ, Bragat A, Marion R, Pecker MS, Sotelo J, August P, Pickering TG, Laragh JH. Beta‐adrenergic receptor blockade as a therapeutic approach for suppressing the renin‐angiotensin‐aldosterone system in normotensive and hypertensive subjects. Am J Hypertens. 1999;12:451–459. [DOI] [PubMed] [Google Scholar]
- 56. Park S, Rhee MY, Lee SY, Park SW, Jeon D, Kim BW, Kwan J, Choi D. A prospective, randomized, open‐label, active‐controlled, clinical trial to assess central haemodynamic effects of bisoprolol and atenolol in hypertensive patients. J Hypertens. 2013;31:813–819. [DOI] [PubMed] [Google Scholar]
- 57. Harry JD, Cruickshank JM, Young J, Barker N. Relative activities of atenolol and metoprolol on the cardiovascular system of man. Eur J Clin Pharmacol. 1981;20:9–15. [DOI] [PubMed] [Google Scholar]
Associated Data
This section collects any data citations, data availability statements, or supplementary materials included in this article.
Supplementary Materials
Data S1. Supplemental Methods.
Table S1. Clinical Characteristics of Black Participants From PEAR and PEAR‐2
Table S2. In Silico Analysis of the SNPs in LD With the Replicated SNP rs28404156 Using RegulomeDB and HaploReg v4.1
Figure S1. Change in systolic blood pressure post β1‐blocker treatment by rs28404156 genotype.