Abstract
Skeletal muscle is a highly adaptable tissue capable of changes in size, contractility, and metabolism according to functional demands. Atrophy is a decline in mass and strength caused by pathologic loss of myofibrillar proteins, and can result from disuse, aging, or denervation caused by injury or peripheral nerve disorders. We provide a high-quality longitudinal RNA-Seq dataset of skeletal muscle from a cohort of adult C57BL/6J male mice subjected to tibial nerve denervation for 0 (baseline), 1, 3, 7, 14, 30, or 90 days. Using an unbiased genomics approach to identify gene expression changes across the entire longitudinal course of muscle atrophy affords the opportunity to (1) establish acute responses to denervation, (2) detect pathways that mediate rapid loss of muscle mass within the first week after denervation, and (3) capture the molecular phenotype of chronically atrophied muscle at a stage when it is largely resistant to recovery.
Subject terms: Somatic system, Regeneration and repair in the nervous system
| Measurement(s) | skeletal muscle atrophy • gene expression |
| Technology Type(s) | RNA sequencing |
| Factor Type(s) | denervation status • denervation duration |
| Sample Characteristic - Organism | Mus musculus |
Machine-accessible metadata file describing the reported data: 10.6084/m9.figshare.9751892
Background & Summary
Skeletal muscle atrophy is the loss of muscle mass and function that occurs in response to diverse stimuli including disuse/immobility, glucocorticoid treatment, cancer, aging, and denervation1–5. Biologically, atrophy reflects the active loss of skeletal muscle contractile proteins, leading to loss of strength and functional impairment with substantial impact on quality of life and, in some cases, reduced survival6–8. In addition, chronically denervated, atrophied muscle shows impaired capacity for reinnervation and functional recovery, which significantly limits prospects for recovery in settings of chronic neuromuscular disease, delayed repair, or large nerve lesions9–12.
Nerve-evoked contraction is the most important factor for maintaining or regaining muscle mass and force13. Neurogenic atrophy refers specifically to skeletal muscle atrophy resulting from denervation, as may occur in traumatic injury or diseases that affect the peripheral nervous system, such as amyotrophic lateral sclerosis (ALS)14–17. A number of “atrogenes” are induced as a result of denervation and in response to various triggers of muscle atrophy; among these are specific ubiquitin ligases targeting components of the sarcomere18–29. A comprehensive analysis of the global gene pathways that change in response to denervation and during atrophy may offer an optimal chance of identifying means to pharmacologically maintain or increase muscle mass and function in atrophy-associated disease states.
We provide here a comprehensive RNA-Seq dataset30 to identify gene expression changes across the entire longitudinal course of muscle atrophy, affording the opportunity to (1) establish acute responses to denervation within the first day, (2) detect pathways that mediate rapid proteolysis and loss of muscle mass within the first week after denervation, and (3) capture the molecular phenotype of chronically atrophied muscle (weeks to months after denervation) at a stage when it is largely resistant to reinnervation and recovery.
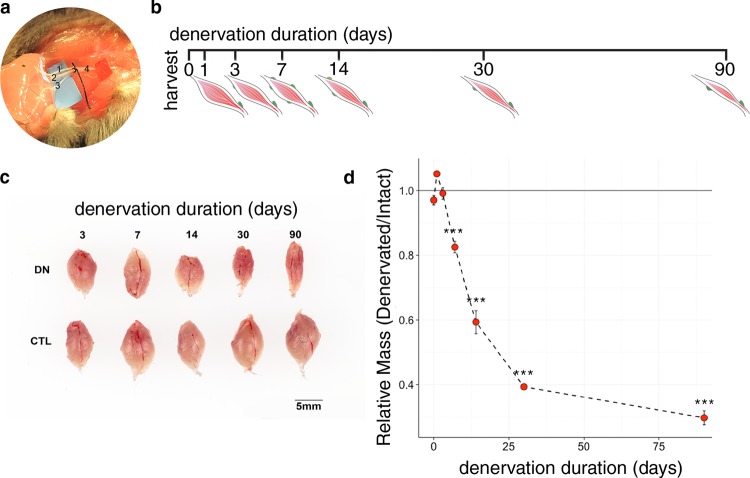
We generated a longitudinal RNA-Seq dataset from a cohort of adult (8-week-old) wild type C57BL/6 J male mice denervated for 0 (baseline), 1, 3, 7, 14, 30, or 90 days (n = 4 for each timepoint)30. We elected to use tibial nerve transection as a model for muscle denervation, as this approach is physiologically meaningful while limiting the morbidity (i.e., pain and immobility) associated with complete sciatic nerve transection31. The tibial nerve is the largest branch of the sciatic nerve that supplies skeletal muscles of the posterior compartment of the lower limb, including the gastrocnemius and soleus. In brief, we identified and separated the tibial nerve from other branches of the sciatic nerve, then ligated, cut distally, and sutured the proximal stump in place to prevent muscle reinnervation during chronic studies. We have established that this model reliably induces significant gastrocnemius atrophy within one week after denervation, with atrophy becoming progressively more severe over time (Fig. 1c,d).
Fig. 1.
Overview of the experimental procedure. The tibial nerve, the largest branch of the sciatic nerve, supplies the gastrocnemius muscle and other muscles of the lower limb posterior compartment. In our mouse model of denervation atrophy, the sciatic nerve is identified, and its branches separated to isolate the tibial nerve (a; nerve identities are as follows: 1, sural nerve; 2, tibial nerve; 3, common peroneal/fibular nerve; 4, sciatic nerve). We generated a cohort of C57BL/6 J male mice denervated for 0, 1, 3, 7, 14, 30, or 90 days (b,c). Significant atrophy is apparent by 7 days after denervation, with consistent decline in mass during chronic denervation (d); ***P < 0.001 compared to baseline.
The samples collected and described in this manuscript include transcriptional profiles from a total of 28 denervated gastrocnemii and 28 contralateral (paired) intact gastrocnemii, comprising 4 denervated and 4 contralateral (paired) intact gastrocnemii for each of 7 denervation durations [0 (baseline), 1, 3, 7, 14, 30, and 90 days]30. All specimens were generated from a cohort of male C57BL/6 J mice that were 8 weeks of age at the start of the study. These data provide a comprehensive description of baseline gene expression in adult mouse skeletal muscle and a broad assessment of the acute and longitudinal gene expression changes in atrophying muscle associated with denervation.
Methods
Animal husbandry
8-week-old C57BL/6 J male mice (Stock #000664) were obtained from the Jackson Laboratory (Bar Harbor, ME) and randomized into 7 groups of n = 4 mice per group for the following denervation timepoints: 0, 1, 3, 7, 14, 30, and 90 days. Animal subjects were housed in a controlled environment with a 12:12-h light-dark cycle with ad libitum access to water and food (Envigo 2018 SX). All mouse experiments were carried out under protocols approved by the JHU Animal Care and Use Committee.
Tibial nerve denervation surgery
Mice were anesthetized with 1.5% isoflurane/2% oxygen using a VetEquip inhalation system (Livermore, CA). The left hindlimb was shaved and sterilized, and a 1 cm incision was introduced in the skin overlying the dorsal thigh. Myofascial planes were gently separated to reveal the sciatic nerve. The tibial nerve branch was identified at its distal branch point and gently separated from the sciatic and peroneal nerves, then ligated proximally and distally using a 10-0 polyamide monofilament suture. The tibial nerve was then transected, the nerve length between ligatures carefully resected, and the proximal stump sutured to the biceps femoris muscle to prevent distal reinnervation. The incision was then closed using stainless steel wound clips. Mice were monitored for recovery from anesthesia and then returned to their home cages.
Myofiber morphometry
Gastrocnemii were frozen in O.C.T. in liquid nitrogen-cooled isopentane, then sectioned at 10 μm. Mid-belly transverse sections were blocked with M.O.M. in PBS (1:40 dilution, Vector Laboratories, catalogue #MKB-2213) at room temperature for 1 h, then incubated overnight at 4 °C with a mixture of BA-D5 supernatant (1:100, myosin heavy chain type I, SC-71 supernatant (1:100, myosin heavy chain type IIa), BF-F3 concentrate (1:100, myosin heavy chain type IIb) [all from the Developmental Studies Hybridoma Bank (DSHB)], and rat-anti-laminin (1:1000, Sigma, catalogue #L0663) in 1% BSA/PBS. Sections were then washed 3 × 5 min in PBS and incubated with a mixture of the following secondary antibodies (all at 1:500) for 2 h at room temperature: goat-anti-mouse IgG2b-DyLight-405, IgG1-Alexa Fluor-488, IgM-Alexa Fluor-594 (all from Jackson ImmunoResearch, catalogue numbers 115-475-207, 115-545-205, and 115-585-075, respectively), and goat anti-rat-IgG-Alexa Fluor-647 (Thermo Fisher Scientific, catalogue #A-21247), diluted in 1% BSA/PBS. Sections were washed 3 × 5 min in PBS and coverslipped using Prolong Gold antifade (Thermo Fisher Scientific, catalogue #P36930). Transverse sections were imaged in their entirety using a Zeiss AxioObserver. Myofiber minimum Feret diameters were determined using Fiji (NIH)32, with ~100 randomly selected myofibers of each fiber type (type I, II, or IIa) measured from each of 3 biological replicates for each indicated timepoint. Statistical analysis was performed using Stata v. 11.2 (College Station, TX)33.
RNA Isolation
Skeletal muscle was homogenized in TRIzol (Ambion, catalogue #15596018) using RNase-free stainless steel beads (Next Advance, catalogue #SSB02-RNA). Homogenates were centrifuged at 10,000 rpm at 4 °C for 10 min to pellet debris, and RNA was purified from the TRIzol supernatant using a Direct-Zol RNA mini purification kit with on-column DNase digestion (Zymo Research, catalogue #R2072). RNA integrity (RIN) was assayed using an Agilent 2100 Bioanalyzer.
RNA-Seq library preparation, sequencing, and bioinformatics analysis
RNA-sequencing was carried out using TrueSeq RiboZero gold (stranded) kit (Illumina, catalogue #20020597). Libraries were indexed and sequenced over 18 lanes using HiSeq4000 (Illumina) with 69-bp paired end reads. Quality control (QC) was performed on base qualities and nucleotide composition of sequences using FastQC version 0.11.534, to identify problems in library preparation or sequencing. Sequence quality for the dataset described here was sufficient that no reads were trimmed or filtered before input to the alignment stage. Paired-end reads were aligned to the most recent Mus musculus mm10 reference genome (GRCm38.75) using the STAR spliced read aligner (version 2.4.0)35. Average input read counts were 58.0 M per sample (range 39.1 M to 91.0 M) and average percentage of uniquely aligned reads was 81.9% (range 72.3% to 88.6%). Total counts of read-fragments aligned to known gene regions within the mouse (mm10) refSeq (refFlat version 07.24.14) reference annotation were used as the basis for quantification of gene expression. Fragment counts were derived using HTSeq (version 0.6.0) and the mm10 refSeq transcript model36. Low count transcripts were filtered, and count data were normalized using the method of trimmed mean of M-values (TMM)37 followed by removing unwanted variation using Bioconductor package RUVseq38 with k value of 1. Differentially expressed genes (FDR < 0.1) were then identified using the Bioconductor package limma with voom function to estimate mean-variance relationship, followed by empirical Bayes moderation39–41. Pairwise comparisons between denervated and contralateral intact muscle at each timepoint were used as the basis for model contrasts. All bioinformatics analyses were conducted using R version 3.5.142.
Data Records
Sequencing data in the fastq format have been deposited in NCBI Sequence Read Archive (SRA)30. A metadata table (Supplementary Table S1) is available with details for each sample.
Technical Validation
Reproducible skeletal muscle atrophy using tibial nerve denervation model
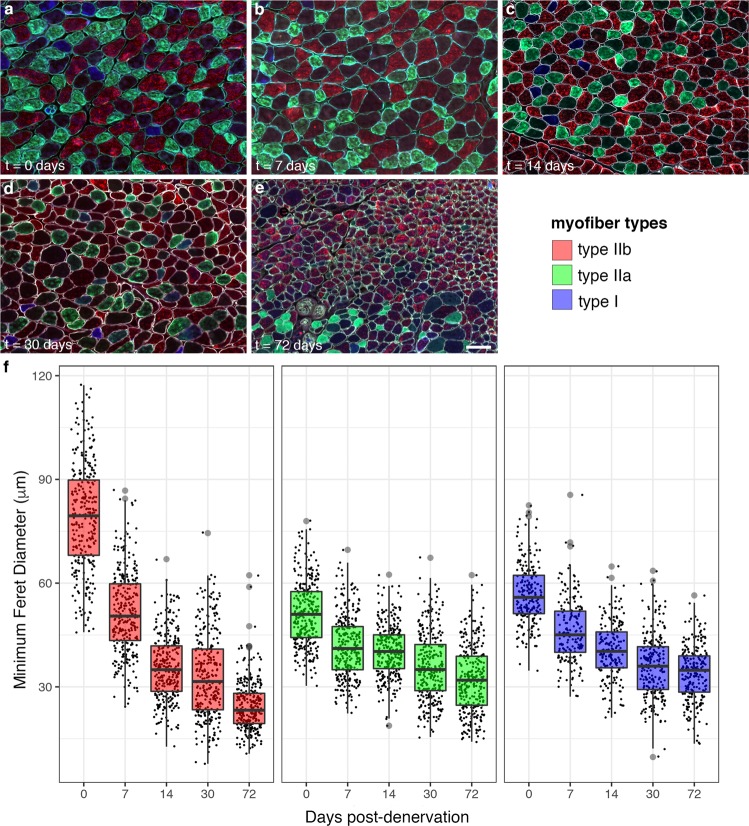
Tibial nerve denervation resulted in a reliable time-dependent loss of skeletal muscle mass, with a significant difference in mass between denervated and contralateral intact gastrocnemii detected by day 7 post-denervation (Fig. 1c,d). All mice used in this study entered the cohort at the same time, with sequential denervation according to the designated timepoints, to remove age as a potential confounding variable. Mouse gastrocnemius contains a mixed population of myofiber types including so-called slow twitch myofibers (type I) and fast twitch myofibers (type IIa and IIb). After muscle denervation, all three of these myofiber populations showed a significant reduction in size as measured by minimum Feret diameter, with the most substantial rate of individual myofiber atrophy occurring within the first two weeks post-denervation (Fig. 2). Type IIb myofibers, the most abundant myofiber type in mouse gastrocnemius, showed the largest magnitude of atrophy (Fig. 2f). Multiple linear regression with myofiber type, myofiber type-time interactions, and time modeled with a spline at t = 14 days was used to model rates of atrophy among type I, IIa, and IIb myofibers; bootstrapping was used to estimate standard errors. Results are presented in Table 1.
Fig. 2.
Gastrocnemius myofiber morphometry. Atrophy of type I, IIa, and IIb myofibers was analyzed by assessment of minimum Feret diameter at baseline (t = 0 days) and 7, 14, 30, and 72 days post-denervation. All three myofiber types showed significant atrophy within the first week after denervation, with the greatest change in magnitude observed for type IIb myofibers overall. Scale bar, 100 μm.
Table 1.
Myofiber type-dependent atrophy during acute and chronic denervation.
| 0–14 days denervation | Δ minimum Feret diameter (μm/day) | standard error (μm/day) | 95% CI | P (compared to type IIb) |
|---|---|---|---|---|
| type IIb | −3.03 | 0.07 | −3.16, −2.89 | — |
| IIa | −0.80 | 0.04 | −0.90, −0.71 | <0.0001 |
| I | −1.24 | 0.06 | −1.36, −1.13 | <0.0001 |
| >14 days denervation | ||||
| type IIb | −0.17 | 0.01 | −0.19, −0.15 | — |
| IIa | −0.11 | 0.01 | −0.14, −0.09 | <0.0001 |
| I | −0.09 | 0.01 | −0.11, −0.06 | <0.0001 |
RNA quality control
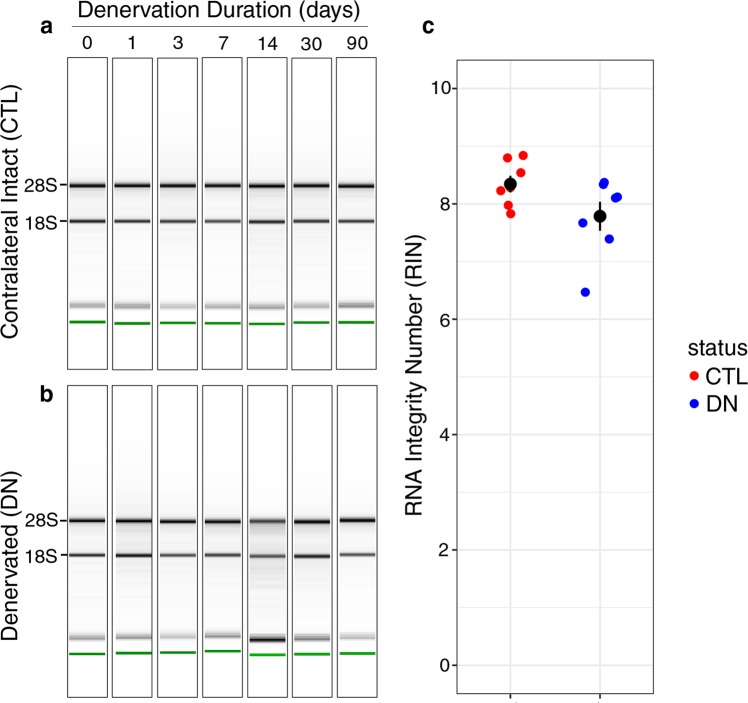
RNA integrity was analyzed using an Agilent 2100 Bioanalyzer (Fig. 3). The mean RNA Integrity Number (RIN) for RNA isolated from denervated and contralateral intact gastrocnemii was 7.8 ± 0.3 and 8.3 ± 0.1 (mean ± SEM), respectively, with no significant difference in RIN by denervation status.
Fig. 3.
RNA integrity of samples. Following denervation for the designated durations, denervated and contralateral intact gastrocnemii were harvested and homogenized directly in TRIzol, and total RNA was column-purified. RNA samples were reverse-transcribed to cDNA and sequenced on an Illumina platform. Representative RIN tracings from one biological replicate of the cohort, showing total RNA isolated from intact gastrocnemii (a) and paired contralateral denervated gastrocnemii (b). RNA isolated from denervated and intact muscle showed similar quality (c).
Read quality and base-calling accuracy
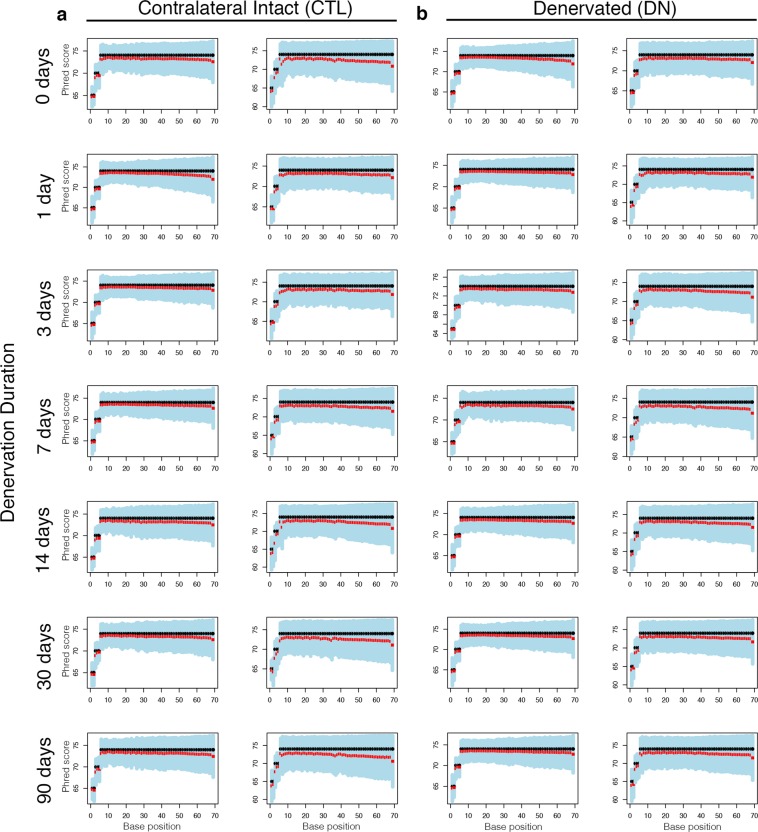
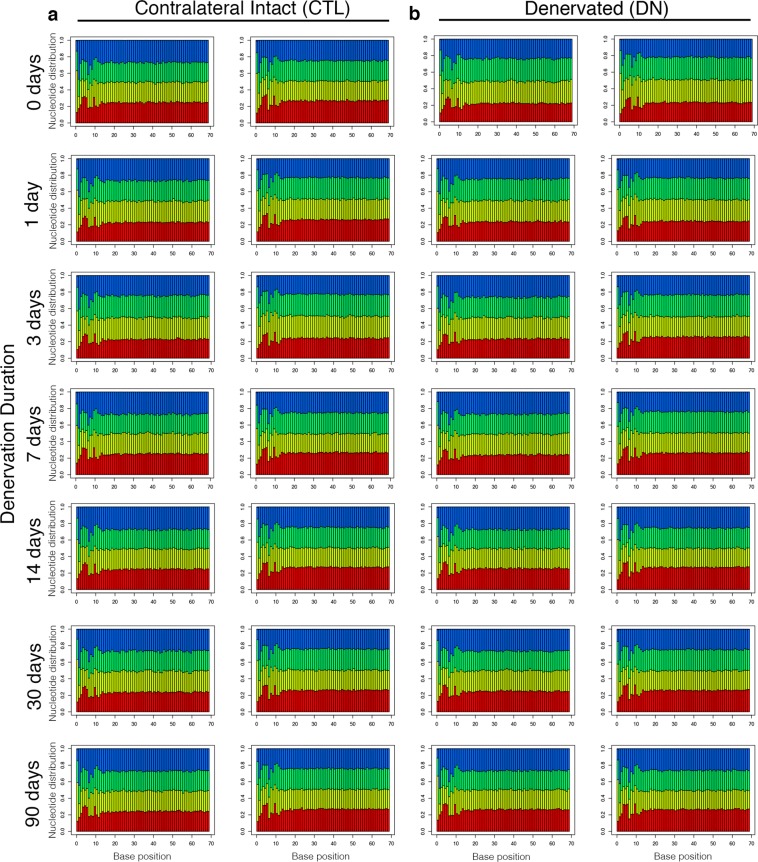
Read quality was high with Phred quality score >70 for the majority of the cycles, and lower quartile base qualities were generally high (Fig. 4). No reads or samples necessitated exclusion based on read quality. The nucleotide composition patterns (proportions of A/C/G/T) of all samples were as expected, with nearly uniform proportions of each nucleotide across sequencing cycles (with the exception of a non-random pattern of nucleotide proportions in the first 13 sequencing cycles as a result of random hexamer priming) (Fig. 5). No read trimming or filtering was required because the quality distribution and variance appeared normal across all reads and samples.
Fig. 4.
Read quality. Representative distribution of Phred quality scores at each nucleotide, shown for the paired reads of one biological replicate for contralateral intact (a) and denervated (b) muscle. The boxes indicate the mean, median, and lower and upper quartile.
Fig. 5.
Alignment quality. Representative distribution of A (red), C (yellow), G (green), and T (blue) at each nucleotide, shown for the paired reads of one biological replicate for contralateral intact (a) and denervated (b) muscle.
Alignment quality
A summary of alignment statistics for all samples is provided in Tables 2–9. Similar sequencing depths and mapping rates were observed for the denervated and contralateral intact skeletal muscle samples.
Table 3.
Day 0 (baseline) alignments.
| CTL-0-1 | CTL-0-2 | CTL-0-3 | CTL-0-4 | DN-0-1 | DN-0-2 | DN-0-3 | DN-0-4 | |
|---|---|---|---|---|---|---|---|---|
| Number of input reads | 55,742,415 | 55,520,609 | 55,035,747 | 63,030,555 | 61,655,193 | 46,879,302 | 68,278,353 | 90,993,687 |
| Average input read length | 138 | 138 | 138 | 138 | 138 | 138 | 138 | 138 |
| Number of uniquely mapped reads | 44,288,330 | 42,269,606 | 46,785,173 | 52,763,039 | 49,365,745 | 36,068,973 | 56,573,593 | 65,791,821 |
| Uniquely mapped reads (%) | 79.45 | 76.13 | 85.01 | 83.71 | 80.07 | 76.94 | 82.86 | 72.30 |
| Average mapped length | 137.29 | 136.1 | 137.64 | 137.57 | 137.2 | 137.61 | 137.61 | 135.93 |
| Number of splices: Total | 13,449,628 | 11,337,800 | 17,752,380 | 19,213,536 | 13,937,303 | 15,460,977 | 23,318,214 | 22,103,629 |
| Number of splices: Annotated (sjdb) | 13,279,964 | 11,188,952 | 17,562,687 | 18,981,111 | 13,722,595 | 15,257,243 | 23,063,152 | 21,856,608 |
| Number of splices: GT/AG | 13,338,075 | 11,231,532 | 17,622,780 | 19,059,810 | 13,811,905 | 15,337,675 | 23,148,268 | 21,924,998 |
| Number of splices: GC/AG | 79,141 | 70,961 | 100,965 | 116,597 | 83,254 | 93,607 | 131,002 | 128,493 |
| Number of splices: AT/AC | 6,613 | 5,470 | 7,814 | 8,779 | 7,204 | 7,569 | 10,127 | 10,049 |
| Number of splices: Non-canonical | 25,799 | 29,837 | 20,821 | 28,350 | 39,940 | 22,126 | 28,817 | 40,089 |
| Mismatch rate per base (%) | 0.32 | 0.64 | 0.19 | 0.21 | 0.31 | 0.22 | 0.19 | 0.68 |
| Deletion rate per base (%) | 0.00 | 0.01 | 0.00 | 0.00 | 0.00 | 0.00 | 0.00 | 0.01 |
| Deletion average length | 1.84 | 2.66 | 1.55 | 1.59 | 1.65 | 1.46 | 1.56 | 2.78 |
| Insertion rate per base (%) | 0.01 | 0.03 | 0.00 | 0.00 | 0.01 | 0.00 | 0.00 | 0.03 |
| Multi-Mapping Reads: | ||||||||
| Number of reads mapped to multiple loci | 7,297,246 | 6,213,049 | 5,623,293 | 6,892,906 | 7,920,730 | 7,915,620 | 7,813,515 | 12,905,331 |
| % of reads mapped to multiple loci | 13.09 | 11.19 | 10.22 | 10.94 | 12.85 | 16.89 | 11.44 | 14.18 |
| Number of reads mapped to too many loci | 582,753 | 255,211 | 341,804 | 568,680 | 987,746 | 539,784 | 463,089 | 172,576 |
| Unmapped Reads: | ||||||||
| % of reads unmapped: too many mismatches | 0.00 | 0.00 | 0.00 | 0.00 | 0.00 | 0.00 | 0.00 | 0.00 |
| % of reads unmapped: too short | 5.63 | 11.82 | 3.69 | 3.95 | 4.63 | 4.62 | 4.66 | 13.22 |
Table 4.
Day 1 post-denervation alignments.
| CTL-1-1 | CTL-1-2 | CTL-1-3 | CTL-1-4 | DN-1-1 | DN-1-2 | DN-1-3 | DN-1-4 | |
|---|---|---|---|---|---|---|---|---|
| Number of input reads | 61,636,872 | 58,072,077 | 55,973,096 | 71,794,344 | 58,034,876 | 48,989,931 | 73,886,622 | 74,271,951 |
| Average input read length | 138 | 138 | 138 | 138 | 138 | 138 | 138 | 138 |
| Number of uniquely mapped reads | 45,746,325 | 47,654,856 | 48,094,866 | 58,843,890 | 48,750,120 | 39,908,061 | 62,480,235 | 56,047,037 |
| Uniquely mapped reads (%) | 74.22 | 82.06 | 85.92 | 81.96 | 84.00 | 81.46 | 84.56 | 75.46 |
| Average mapped length | 137.34 | 137.47 | 137.57 | 137.6 | 137.62 | 137.59 | 137.57 | 136.25 |
| Number of splices: Total | 9,070,911 | 16,321,200 | 18,716,287 | 24,549,738 | 17,994,490 | 13,613,414 | 23,080,273 | 17,817,564 |
| Number of splices: Annotated (sjdb) | 8,836,384 | 16,122,233 | 18,519,783 | 24,297,361 | 17,785,158 | 13,408,135 | 22,808,431 | 17,582,261 |
| Number of splices: GT/AG | 8,966,851 | 16,190,887 | 18,583,614 | 24,365,743 | 17,858,255 | 13,494,722 | 22,900,176 | 17,663,375 |
| Number of splices: GC/AG | 50,713 | 96,907 | 103,605 | 141,926 | 103,877 | 83,585 | 134,880 | 108,178 |
| Number of splices: AT/AC | 4,255 | 7,466 | 8,267 | 11,276 | 8,327 | 6,878 | 11,030 | 8,758 |
| Number of splices: Non-canonical | 49,092 | 25,940 | 20,801 | 30,793 | 24,031 | 28,179 | 34,187 | 37,253 |
| Mismatch rate per base (%) | 0.40 | 0.26 | 0.23 | 0.17 | 0.19 | 0.25 | 0.21 | 0.63 |
| Deletion rate per base | 0.01 | 0.00 | 0.00 | 0.00 | 0.00 | 0.00 | 0.00 | 0.01 |
| Deletion average length | 1.37 | 1.63 | 1.84 | 1.71 | 1.49 | 1.45 | 1.66 | 2.4 |
| Insertion rate per base | 0.00 | 0.01 | 0.00 | 0.01 | 0.00 | 0.00 | 0.00 | 0.02 |
| Multi-Mapping Reads: | ||||||||
| Number of reads mapped to multiple loci | 9,782,705 | 6,777,446 | 5,377,772 | 8,642,605 | 6,176,521 | 5,844,014 | 7,396,719 | 9,668,787 |
| % of reads mapped to multiple loci | 15.87 | 11.67 | 9.61 | 12.04 | 10.64 | 11.93 | 10.01 | 13.02 |
| Number of reads mapped to too many loci | 1,984,894 | 619,936 | 341,393 | 194,108 | 530,916 | 812,052 | 596,417 | 413,918 |
| Unmapped Reads: | ||||||||
| % of reads unmapped: too many mismatches | 0.00 | 0.00 | 0.00 | 0.00 | 0.00 | 0.00 | 0.00 | 0.00 |
| % of reads unmapped: too short | 5.12 | 4.55 | 3.44 | 5.55 | 3.79 | 4.17 | 4.13 | 10.71 |
Table 5.
Day 3 post-denervation alignments.
| CTL-3-1 | CTL-3-2 | CTL-3-3 | CTL-3-4 | DN-3-1 | DN-3-2 | DN-3-3 | DN-3-4 | |
|---|---|---|---|---|---|---|---|---|
| Number of input reads | 43,601,767 | 39,051,346 | 60,982,532 | 77,529,167 | 61,614,609 | 48,980,170 | 77,233,032 | 49,001,916 |
| Average input read length | 138 | 138 | 138 | 138 | 138 | 138 | 138 | 138 |
| Number of uniquely mapped reads | 32,795,169 | 31,708,280 | 51,656,264 | 58,276,505 | 48,300,398 | 40,533,615 | 67,261,853 | 40,543,472 |
| Uniquely mapped reads (%) | 75.22 | 81.20 | 84.71 | 75.17 | 78.39 | 82.76 | 87.09 | 82.74 |
| Average mapped length | 137.18 | 137.54 | 137.63 | 136.29 | 137.27 | 137.61 | 137.58 | 137.7 |
| Number of splices: Total | 7,641,732 | 14,023,149 | 19,917,676 | 20,730,824 | 12,188,893 | 15,689,660 | 23,843,242 | 18,125,528 |
| Number of splices: Annotated (sjdb) | 7,481,956 | 13,875,662 | 19,704,844 | 20,503,659 | 11,912,730 | 15,485,355 | 23,536,888 | 17,920,443 |
| Number of splices: GT/AG | 7,559,269 | 13,909,110 | 19,774,059 | 20,569,914 | 12,051,290 | 15,551,272 | 23,642,787 | 17,982,044 |
| Number of splices: GC/AG | 44,922 | 89,610 | 110,632 | 117,092 | 76,969 | 104,920 | 151,795 | 114,053 |
| Number of splices: AT/AC | 3,751 | 6,827 | 8,919 | 9,864 | 8,217 | 10,333 | 14,859 | 11,510 |
| Number of splices: Non-canonical | 33,790 | 17,602 | 24,066 | 33,954 | 52,417 | 23,135 | 33,801 | 17,921 |
| Mismatch rate per base (%) | 0.37 | 0.18 | 0.18 | 0.57 | 0.35 | 0.20 | 0.21 | 0.15 |
| Deletion rate per base | 0.00 | 0.00 | 0.00 | 0.01 | 0.01 | 0.00 | 0.00 | 0.00 |
| Deletion average length | 1.45 | 1.93 | 1.54 | 2.64 | 1.41 | 1.76 | 1.74 | 1.65 |
| Insertion rate per base | 0.00 | 0.01 | 0.00 | 0.02 | 0.00 | 0.00 | 0.00 | 0.00 |
| Multi-Mapping Reads: | ||||||||
| Number of reads mapped to multiple loci | 5,971,134 | 4,893,812 | 6,531,891 | 10,323,333 | 8,224,640 | 5,219,448 | 6,412,447 | 6,047,917 |
| % of reads mapped to multiple loci | 13.69 | 12.53 | 10.71 | 13.32 | 13.35 | 10.66 | 8.30 | 12.34 |
| Number of reads mapped to too many loci | 1,070,563 | 150,149 | 453,705 | 168,949 | 1,656,313 | 391,356 | 516,587 | 143,641 |
| Unmapped Reads: | ||||||||
| % of reads unmapped: too many mismatches | 0.00 | 0.00 | 0.00 | 0.00 | 0.00 | 0.00 | 0.00 | 0.00 |
| % of reads unmapped: too short | 7.35 | 5.56 | 3.28 | 11.17 | 4.33 | 5.33 | 3.35 | 4.41 |
Table 6.
Day 7 post-denervation alignments.
| CTL-7-1 | CTL-7-2 | CTL-7-3 | CTL-7-4 | DN-7-1 | DN-7-2 | DN-7-3 | DN-7-4 | |
|---|---|---|---|---|---|---|---|---|
| Number of input reads | 60,590,610 | 56,143,558 | 52,019,275 | 51,496,201 | 59,955,862 | 52,135,014 | 56,347,860 | 49,238,405 |
| Average input read length | 138 | 138 | 138 | 138 | 138 | 138 | 138 | 138 |
| Number of uniquely mapped reads | 44,746,349 | 45,413,965 | 43,059,558 | 41,428,228 | 48,787,077 | 44,968,959 | 48,225,333 | 41,382,042 |
| Uniquely mapped reads (%) | 73.85 | 80.89 | 82.78 | 80.45 | 81.37 | 86.25 | 85.59 | 84.04 |
| Average mapped length | 137.59 | 137.52 | 137.55 | 137.52 | 137.54 | 137.62 | 137.62 | 137.71 |
| Number of splices: Total | 14,703,980 | 16,917,306 | 15,994,824 | 19,253,856 | 18,108,367 | 17,195,995 | 19,296,266 | 17,537,132 |
| Number of splices: Annotated (sjdb) | 14,509,688 | 16,698,117 | 15,827,806 | 19,075,521 | 17,848,555 | 16,979,726 | 19,078,139 | 17,331,026 |
| Number of splices: GT/AG | 14,581,736 | 16,782,958 | 15,879,431 | 19,119,493 | 17,951,606 | 17,055,436 | 19,144,656 | 17,402,247 |
| Number of splices: GC/AG | 87,629 | 94,175 | 90,057 | 109,413 | 113,654 | 107,871 | 121,143 | 107,129 |
| Number of splices: AT/AC | 6,982 | 7,259 | 6,713 | 8,335 | 11,444 | 10,331 | 10,951 | 10,114 |
| Number of splices: Non-canonical | 27,633 | 32,914 | 18,623 | 16,615 | 31,663 | 22,357 | 19,516 | 17,642 |
| Mismatch rate per base (%) | 0.23 | 0.25 | 0.24 | 0.20 | 0.21 | 0.19 | 0.23 | 0.16 |
| Deletion rate per base | 0.00 | 0.00 | 0.00 | 0.00 | 0.00 | 0.00 | 0.00 | 0.00 |
| Deletion average length | 1.46 | 1.6 | 1.55 | 1.66 | 1.5 | 1.68 | 1.61 | 1.58 |
| Insertion rate per base | 0.00 | 0.00 | 0.00 | 0.01 | 0.00 | 0.00 | 0.00 | 0.00 |
| Multi-Mapping Reads: | ||||||||
| Number of reads mapped to multiple loci | 9,428,246 | 6,672,205 | 5,740,042 | 6,966,763 | 7,352,327 | 4,543,202 | 5,722,848 | 5,194,049 |
| % of reads mapped to multiple loci | 15.56 | 11.88 | 11.03 | 13.53 | 12.26 | 8.71 | 10.16 | 10.55 |
| Number of reads mapped to too many loci | 819,014 | 789,365 | 391,842 | 166,663 | 716,324 | 332,671 | 233,636 | 243,367 |
| Unmapped Reads: | ||||||||
| % of reads unmapped: too many mismatches | 0.00 | 0.00 | 0.00 | 0.00 | 0.00 | 0.00 | 0.00 | 0.00 |
| % of reads unmapped: too short | 8.41 | 5.23 | 4.83 | 5.53 | 4.51 | 3.91 | 3.51 | 4.58 |
Table 7.
Day 14 post-denervation alignments.
| CTL-14-1 | CTL-14-2 | CTL-14-3 | CTL-14-4 | DN-14-1 | DN-14-2 | DN-14-3 | DN-14-4 | |
|---|---|---|---|---|---|---|---|---|
| Number of input reads | 49,441,646 | 69,876,924 | 57,832,497 | 47,973,299 | 55,891,429 | 44,966,509 | 59,715,016 | 54,942,368 |
| Average input read length | 138 | 138 | 138 | 138 | 138 | 138 | 138 | 138 |
| Number of uniquely mapped reads | 36,913,926 | 57,899,595 | 48,950,623 | 38,979,826 | 46,402,585 | 39,850,074 | 51,086,876 | 47,212,433 |
| Uniquely mapped reads (%) | 74.66 | 82.86 | 84.64 | 81.25 | 83.02 | 88.62 | 85.55 | 85.93 |
| Average mapped length | 136.42 | 137.57 | 137.64 | 137.71 | 137.43 | 137.6 | 137.26 | 137.64 |
| Number of splices: Total | 5,674,228 | 21,316,991 | 17,945,548 | 18,202,915 | 14,603,778 | 13,578,938 | 17,163,851 | 19,981,473 |
| Number of splices: Annotated (sjdb) | 5,507,058 | 21,070,682 | 17,756,782 | 18,029,158 | 14,378,276 | 13,404,598 | 16,946,761 | 19,745,905 |
| Number of splices: GT/AG | 5,594,717 | 21,157,480 | 17,811,041 | 18,071,861 | 14,465,582 | 13,467,591 | 17,016,218 | 19,822,262 |
| Number of splices: GC/AG | 33,738 | 117,529 | 105,892 | 108,309 | 97,389 | 86,275 | 114,337 | 126,876 |
| Number of splices: AT/AC | 2,460 | 8,933 | 7,681 | 8,376 | 8,415 | 7,229 | 9,540 | 11,690 |
| Number of splices: Non-canonical | 43,313 | 33,049 | 20,934 | 14,369 | 32,392 | 17,843 | 23,756 | 20,645 |
| Mismatch rate per base (%) | 0.66 | 0.22 | 0.19 | 0.15 | 0.23 | 0.21 | 0.30 | 0.17 |
| Deletion rate per base | 0.01 | 0.00 | 0.00 | 0.00 | 0.00 | 0.00 | 0.00 | 0.00 |
| Deletion average length | 1.96 | 1.53 | 1.49 | 1.54 | 1.6 | 1.73 | 1.77 | 1.81 |
| Insertion rate per base | 0.02 | 0.00 | 0.00 | 0.00 | 0.00 | 0.00 | 0.00 | 0.00 |
| Multi-Mapping Reads: | ||||||||
| Number of reads mapped to multiple loci | 6,729,802 | 8,099,802 | 6,448,816 | 6,968,357 | 5,711,963 | 3,266,255 | 5,086,857 | 5,109,283 |
| % of reads mapped to multiple loci | 13.61 | 11.59 | 11.15 | 14.53 | 10.22 | 7.26 | 8.52 | 9.30 |
| Number of reads mapped to too many loci | 1,288,797 | 704,083 | 369,246 | 131,113 | 711,573 | 285,356 | 277,105 | 152,218 |
| Unmapped Reads: | ||||||||
| % of reads unmapped: too many mismatches | 0.00 | 0.00 | 0.00 | 0.00 | 0.00 | 0.00 | 0.00 | 0.00 |
| % of reads unmapped: too short | 7.92 | 3.98 | 2.99 | 3.77 | 4.72 | 2.93 | 4.97 | 4.27 |
Table 8.
Day 30 post-denervation alignments.
| CTL-30-1 | CTL-30-2 | CTL-30-3 | CTL-30-4 | DN-30-1 | DN-30-2 | DN-30-3 | DN-30-4 | |
|---|---|---|---|---|---|---|---|---|
| Number of input reads | 52,742,878 | 46,463,403 | 57,501,219 | 60,468,553 | 73,590,727 | 48,399,322 | 51,665,579 | 54,577,655 |
| Average input read length | 138 | 138 | 138 | 138 | 138 | 138 | 138 | 138 |
| Number of uniquely mapped reads | 40,308,924 | 38,146,896 | 48,521,247 | 49,438,872 | 58,520,852 | 41,879,303 | 45,337,494 | 46,751,912 |
| Uniquely mapped reads (%) | 76.43 | 82.10 | 84.38 | 81.76 | 79.52 | 86.53 | 87.75 | 85.66 |
| Average mapped length | 137.26 | 137.46 | 137.68 | 137.65 | 137.6 | 137.5 | 137.65 | 137.55 |
| Number of splices: Total | 9,002,164 | 12,162,162 | 17,453,824 | 21,318,005 | 19,800,202 | 14,238,822 | 17,245,138 | 17,175,362 |
| Number of splices: Annotated (sjdb) | 8,779,541 | 11,999,102 | 17,264,634 | 21,090,387 | 19,528,567 | 14,056,750 | 17,044,059 | 16,948,110 |
| Number of splices: GT/AG | 8,902,807 | 12,063,473 | 17,319,770 | 21,157,409 | 19,623,217 | 14,122,315 | 17,105,745 | 17,027,539 |
| Number of splices: GC/AG | 50,013 | 69,863 | 105,703 | 125,956 | 132,947 | 88,561 | 112,478 | 111,959 |
| Number of splices: AT/AC | 4,129 | 5,439 | 7,989 | 9,587 | 11,133 | 6,876 | 8,957 | 9,017 |
| Number of splices: Non-canonical | 45,215 | 23,387 | 20,362 | 25,053 | 32,905 | 21,070 | 17,958 | 26,847 |
| Mismatch rate per base (%) | 0.41 | 0.34 | 0.18 | 0.18 | 0.21 | 0.23 | 0.16 | 0.22 |
| Deletion rate per base | 0.01 | 0.00 | 0.00 | 0.00 | 0.00 | 0.00 | 0.00 | 0.00 |
| Deletion average length | 1.35 | 1.54 | 1.52 | 1.54 | 1.59 | 2.1 | 1.61 | 1.85 |
| Insertion rate per base | 0.00 | 0.00 | 0.00 | 0.00 | 0.00 | 0.01 | 0.00 | 0.01 |
| Multi-Mapping Reads: | ||||||||
| Number of reads mapped to multiple loci | 7,401,284 | 5,478,248 | 6,190,600 | 8,046,293 | 8,580,950 | 4,181,432 | 4,632,180 | 5,281,885 |
| % of reads mapped to multiple loci | 14.03 | 11.79 | 10.77 | 13.31 | 11.66 | 8.64 | 8.97 | 9.68 |
| Number of reads mapped to too many loci | 1,771,867 | 704,627 | 353,874 | 396,886 | 672,558 | 312,239 | 158,758 | 369,051 |
| Unmapped Reads: | ||||||||
| % of reads unmapped: too many mismatches | 0.00 | 0.00 | 0.00 | 0.00 | 0.00 | 0.00 | 0.00 | 0.00 |
| % of reads unmapped: too short | 4.84 | 3.82 | 3.70 | 3.98 | 7.27 | 3.68 | 2.63 | 3.59 |
Table 2.
Overall summary of alignments.
| CTL | DN |
P
(DN vs. CTL)* |
|
|---|---|---|---|
| Mean (SD), range |
Mean (SD), range |
||
| Number of input reads |
5.71 × 10⁷ (8.50 × 10⁶) 3.91 × 10⁷–7.75 × 10⁷ |
5.90 × 10⁷ (1.15 × 10⁷) 4.15 × 10⁷–9.10 × 10⁷ |
0.49 |
| Average input read length | 138 | 138 | — |
| Number of uniquely mapped reads |
4.6 × 10⁷ (7.29 × 10⁶) 3.17 × 10⁷–5.88 × 10⁷ |
4.89 × 10⁷ (8.40 × 10⁶) 3.57 × 10⁷–6.73 × 10⁷ |
0.17 |
| Uniquely mapped reads (%) |
80.47 (3.75) 73.85–85.92 |
83.29 (3.99) 72.3–88.62 |
0.009 |
| Average mapped length |
137.39 (0.42) 136.10–137.71 |
137.45 (0.41) 135.93–137.71 |
0.58 |
| Number of splices: Total |
1.62 × 10⁷ (4.93 × 10⁶) 5.67 × 10⁶–2.45 × 10⁷ |
1.72 × 10⁷ (3.35 × 10⁶) 1.00 × 10⁷–2.38 × 10⁷ |
0.37 |
| Number of splices: Annotated (sjdb) |
1.60 × 10⁷ (4.91 × 10⁶) 5.51 × 10⁶–2.43 × 10⁷ |
1.70 × 10⁷ (3.33 × 10⁶) 9.86 × 10⁶–2.35 × 10⁷ |
0.38 |
| Number of splices: GT/AG |
1.61 × 10⁷ (4.90 × 10⁶) 5.59 × 10⁶–2.44 × 10⁷ |
1.71 × 10⁷ (3.33 × 10⁶) 9.92 × 10⁶–2.36 × 10⁷ |
0.38 |
| Number of splices: GC/AG |
9.38 × 10⁴ (2.83 × 10⁴) 3.37 × 10⁴–1.42 × 10⁵ |
1.09 × 10⁵ (13.37 × 10⁴) 7.05 × 10⁴–1.52 × 10⁵ |
0.03 |
| Number of splices: AT/AC |
7.31 × 10³ (2.18 × 10³) 2.46 × 10³–1.13 × 10⁴ |
9.38 × 10³ (1.95 × 10³) 5.41 × 10³–1.49 × 10⁴ |
0.0004 |
| Number of splices: Non-canonical |
2.79 × 10⁴ (8.77 × 10³) 1.44 × 10⁴–4.91 × 10⁴ |
2.77 × 10⁴ (8.62 × 10³) 1.76 × 10⁴–5.24 × 10⁴ |
0.92 |
| Mismatch rate per base (%) |
0.28 (0.14) 0.15–0.66 |
0.25 (0.12) 0.15–0.68 |
0.32 |
| Deletion rate per base (%) |
0.002 (0.004) 0–0.01 |
0.001 (0.004) 0–0.01 |
0.49 |
| Deletion average length |
1.68 (0.32) 1.35–2.66 |
1.72 (0.29) 1.41–2.78 |
0.65 |
| Insertion rate per base (%) |
0.005 (0.008) 0–0.03 |
0.003 (0.007) 0–0.03 |
0.38 |
| Multi-Mapping Reads: | |||
| Number of reads mapped to multiple loci |
7.09 × 10⁶ (1.34 × 10⁶) 4.89 × 10⁶–1.03 × 10⁷ |
6.32 × 10⁶ (2.01 × 10⁶) 3.27 × 10⁶–1.29 × 10⁷ |
0.10 |
| % of reads mapped to multiple loci |
12.46 (1.65) 9.61–15.87 |
10.64 (2.15) 7.26–16.89 |
0.0008 |
| Number of reads mapped to too many loci |
6.16 × 10⁵ (4.96 × 10⁵) 1.31 × 10⁵–1.98 × 10⁶ |
4.85 × 10⁵ (3.25 × 10⁵) 1.45 × 10⁵–1.66 × 10⁶ |
0.25 |
| Unmapped Reads: | |||
| % of reads unmapped: too many mismatches | 0 | 0 | — |
| % of reads unmapped: too short |
5.32 (2.21) 2.99–11.82 |
4.71 (2.29) 2.63–13.22 |
0.32 |
*Welch’s t-test.
Table 9.
Day 90 post-denervation alignments.
| CTL-90-1 | CTL-90-2 | CTL-90-3 | CTL-90-4 | DN-90-1 | DN-90-2 | DN-90-3 | DN-90-4 | |
|---|---|---|---|---|---|---|---|---|
| Number of input reads | 60,873,629 | 47,878,309 | 64,409,589 | 64,474,030 | 67,574,028 | 41,457,417 | 56,366,231 | 64,290,975 |
| Average input read length | 138 | 138 | 138 | 138 | 138 | 138 | 138 | 138 |
| Number of uniquely mapped reads | 48,591,921 | 36,558,406 | 54,742,091 | 52,310,648 | 55,842,215 | 35,688,427 | 49,296,566 | 56,228,095 |
| Uniquely mapped reads (%) | 79.82 | 76.36 | 84.99 | 81.13 | 82.64 | 86.08 | 87.46 | 87.46 |
| Average mapped length | 137.54 | 137.33 | 137.65 | 137.54 | 137.46 | 137.62 | 137.69 | 137.56 |
| Number of splices: Total | 17,976,086 | 9,096,031 | 19,807,129 | 23,581,453 | 14,738,624 | 10,009,836 | 16,531,735 | 17,148,016 |
| Number of splices: Annotated (sjdb) | 17,769,205 | 8,892,794 | 19,598,023 | 23,349,415 | 14,498,430 | 9,862,716 | 16,325,792 | 16,910,940 |
| Number of splices: GT/AG | 17,834,684 | 9,003,295 | 19,661,022 | 23,405,840 | 14,592,638 | 9,915,222 | 16,382,464 | 16,990,053 |
| Number of splices: GC/AG | 108,126 | 48,499 | 114,242 | 134,946 | 101,005 | 70,463 | 117,425 | 118,687 |
| Number of splices: AT/AC | 8,761 | 3,781 | 8,574 | 10,432 | 7,968 | 5,410 | 9,247 | 9,501 |
| Number of splices: Non-canonical | 24,515 | 40,456 | 23,291 | 30,235 | 37,013 | 18,741 | 22,599 | 29,775 |
| Mismatch rate per base (%) | 0.20 | 0.41 | 0.19 | 0.19 | 0.25 | 0.21 | 0.17 | 0.22 |
| Deletion rate per base | 0.00 | 0.01 | 0.00 | 0.00 | 0.01 | 0.00 | 0.00 | 0.00 |
| Deletion average length | 1.75 | 1.37 | 1.52 | 1.96 | 1.61 | 1.55 | 1.67 | 1.88 |
| Insertion rate per base | 0.01 | 0.00 | 0.00 | 0.01 | 0.01 | 0.00 | 0.00 | 0.00 |
| Multi-Mapping Reads: | ||||||||
| Number of reads mapped to multiple loci | 7,924,888 | 7,093,313 | 6,681,303 | 8,439,457 | 6,752,769 | 3,853,430 | 5,037,828 | 5,238,591 |
| % of reads mapped to multiple loci | 13.02 | 14.82 | 10.37 | 13.09 | 9.99 | 9.29 | 8.94 | 8.15 |
| Number of reads mapped to too many loci | 469,250 | 1,545,968 | 447,456 | 176,878 | 855,527 | 419,702 | 172,340 | 444,439 |
| Unmapped Reads: | ||||||||
| % of reads unmapped: too many mismatches | 0.00 | 0.00 | 0.00 | 0.00 | 0.00 | 0.00 | 0.00 | 0.00 |
| % of reads unmapped: too short | 5.92 | 4.16 | 3.34 | 5.34 | 5.23 | 2.77 | 2.88 | 3.10 |
Counts per gene
The distribution of normalized gene accounts appears similar among all samples in the dataset (Fig. 6).
Fig. 6.
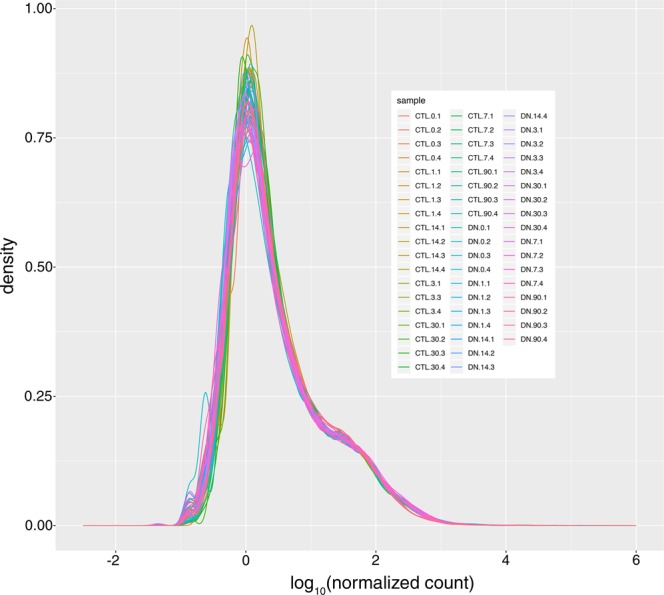
Summary of read counts. Density plot showing relative read count distributions for all samples.
Unsupervised clustering analysis of longitudinally denervated samples
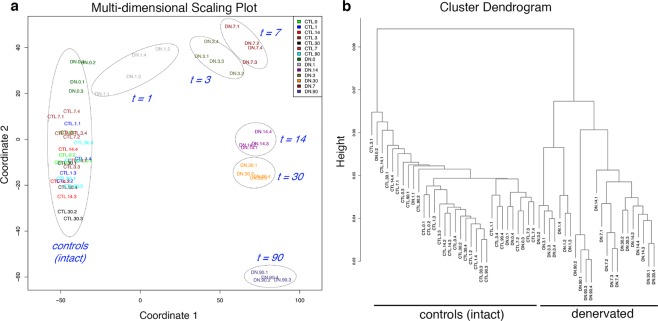
Multidimensional scaling using expression levels of all genes demonstrated temporal clustering based on denervation status, with replicates within each denervation timepoint clustering closer to each other than to other denervation timepoints (Fig. 7).
Fig. 7.
Quality of replicates. Multi-dimensional scaling analysis (a) and cluster dendrogram (b) of transcriptional profiles during neurogenic atrophy shows temporal clustering by denervation status.
Time-dependent comparison of denervated and contralateral intact skeletal muscle transcriptomes
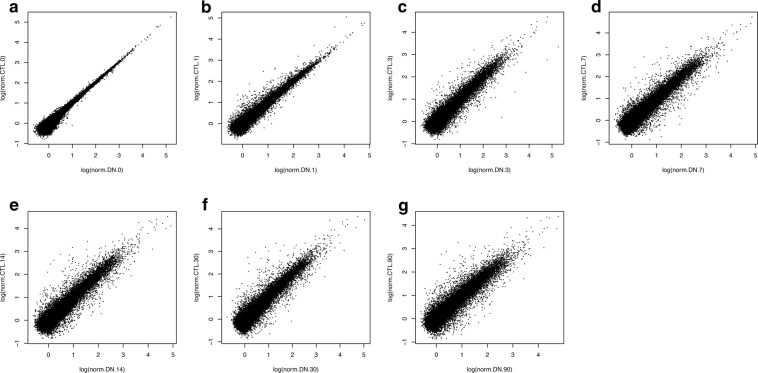
Normalized gene counts from denervated and contralateral intact skeletal muscle at each timepoint are compared in scatter plots (Fig. 8).
Fig. 8.
Gene expression visualization. Scatterplots showing the log2 transform of normalized counts.
Differential expression analysis
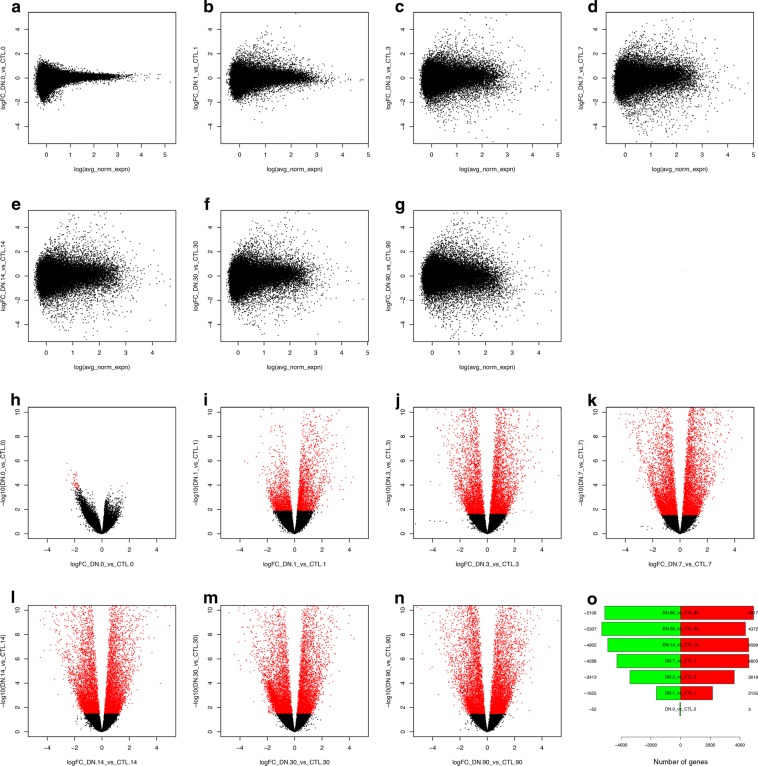
MA-plots showing the log-fold change (M-values, the log of the ratio of counts for each gene across the two samples being compared) against the normalized log-average (A-values, the average counts for each gene across the two samples being compared) indicate substantial differences in gene expression in skeletal muscle during acute and chronic neurogenic atrophy (Fig. 9a–g). Volcano plots indicate minimal differences in gene expression at baseline (intact muscle) (Fig. 9h), but demonstrate that thousands of genes are significantly differentially expressed (FDR < 0.1) within the first day after denervation (Fig. 9i) and beyond (Fig. 9j–n). A summary of the number of differentially expressed genes at each timepoint is shown in Fig. 9o.
Fig. 9.
Differential expression analysis. MA-plots comparing the log2 fold change of gene expression for denervated vs. contralateral intact skeletal muscle at each timepoint plotted against the normalized average of the counts (a–g). Volcano plots showing the -log10 FDR for difference in expression between denervated and contralateral intact skeletal muscle for each gene detected, plotted against the log2 fold-change (h–n). Genes with FDR < 0.1 are depicted in red. The total number of significantly differentially expressed genes (FDR < 0.1) at each timepoint is summarized in panel (o).
Usage Notes
The RNA-Seq dataset presented in this study provides a detailed view of the acute and chronic gene expression changes that occur in denervated, atrophying skeletal muscle. These data may provide insight into the early events associated with acute loss of neuronal input that trigger rapid atrophy, as well as the gene expression changes in chronically denervated and severely atrophied skeletal muscle associated with impaired capacity for reinnervation. Defining these changes may afford opportunities to limit the rate and severity of skeletal muscle atrophy, and to enhance functional reinnervation.
Supplementary Information
Acknowledgements
We thank the Next Generation Sequencing Core Facility at JHMI for assistance with Bioanalyzer analysis, the UCLA Neuroscience Genomics Core (UNGC) for preparing and sequencing the libraries, and Norman Barker (JHMI, Department of Pathology) for photographing Figure 1c. This work was supported by the Dr. Miriam and Sheldon G. Adelson Medical Research Foundation (A.H. and G.C.), U.S. Department of Defense (A.H.), Maryland Stem Cell Research Fund (J.T.E.), a Burroughs Wellcome Collaborative Research Travel Grant (J.T.E.), and the National Institute of Arthritis and Musculoskeletal and Skin Diseases (J.T.E., F32AR072477). The Johns Hopkins Multiphoton Imaging Core is supported by the National Institute of Neurological Disorders and Stroke (NS050274). The myosin antibodies developed by the lab of Dr. Stefano Schiaffino were obtained from the Developmental Studies Hybridoma Bank, created by the NICHD of the NIH and maintained at the University of Iowa, Department of Biology. The content of this manuscript is solely the responsibility of the authors and does not necessarily represent the official views of the National Institutes of Health.
Author Contributions
J.T.E., R.K., G.C., and A.H. designed the study; J.T.E., R.K., and R.M. conducted experiments; J.T.E., R.K., G.C., and A.H. analyzed data; and J.T.E. wrote the manuscript with contributions from all authors.
Code Availability
Scripts used in the RNA sequencing analyses are available at https://github.com/icnn/RNAseq-PIPELINE.git.
Competing Interests
The authors declare no competing interests.
Footnotes
Publisher’s note Springer Nature remains neutral with regard to jurisdictional claims in published maps and institutional affiliations.
Supplementary information
is available for this paper at 10.1038/s41597-019-0185-4.
References
- 1.Schakman O, Kalista S, Barbé C, Loumaye A, Thissen JP. Glucocorticoid-induced skeletal muscle atrophy. Int. J. Biochem. Cell Biol. 2013;45:2163–72. doi: 10.1016/j.biocel.2013.05.036. [DOI] [PubMed] [Google Scholar]
- 2.Bodine SC. Disuse-induced muscle wasting. Int. J. Biochem. Cell Biol. 2013;56:2200–8. doi: 10.1016/j.biocel.2013.06.011. [DOI] [PMC free article] [PubMed] [Google Scholar]
- 3.Schmidt SF, Rohm M, Herzig S, Berriel Diaz M. Cancer cachexia: more than skeletal muscle wasting. Trends Cancer. 2018;4:849–860. doi: 10.1016/j.trecan.2018.10.001. [DOI] [PubMed] [Google Scholar]
- 4.Argilés JM, Stemmler B, López-Soriano FJ, Busquets S. Inter-tissue communication in cancer cachexia. Nat. Rev. Endocrinol. 2018;15:9–20. doi: 10.1038/s41574-018-0123-0. [DOI] [PubMed] [Google Scholar]
- 5.Larsson L, et al. Sarcopenia: aging-related loss of muscle mass and function. Physiol. Rev. 2019;99:427–511. doi: 10.1152/physrev.00061.2017. [DOI] [PMC free article] [PubMed] [Google Scholar]
- 6.Burns TM, Graham CD, Rose MR, Simmons Z. Quality of life and measures of quality of life in patients with neuromuscular disorders. Muscle Nerve. 2012;46:9–25. doi: 10.1002/mus.23245. [DOI] [PubMed] [Google Scholar]
- 7.Dardiotis E, et al. Body mass index and survival from amyotrophic lateral sclerosis: A meta-analysis. Neurol. Clin. Pract. 2018;8:437–444. doi: 10.1212/CPJ.0000000000000521. [DOI] [PMC free article] [PubMed] [Google Scholar]
- 8.Ning P, et al. Systematic review of the prognostic role of body mass index in amyotrophic lateral sclerosis. Amyotroph. Lateral Scler. Frontotemporal Degener. 2019;20:356–367. doi: 10.1080/21678421.2019.1587631. [DOI] [PubMed] [Google Scholar]
- 9.Brunetti O, Carobi C, Pazzaglia U. Influence of atrophy on the efficiency of muscle reinnervation. Exp. Neurol. 1987;96:248–52. doi: 10.1016/0014-4886(87)90043-4. [DOI] [PubMed] [Google Scholar]
- 10.Fu SY, Gordon T. Contributing factors to poor functional recovery after delayed nerve repair: prolonged denervation. J Neurosci. 1995;15:3886–95. doi: 10.1523/JNEUROSCI.15-05-03886.1995. [DOI] [PMC free article] [PubMed] [Google Scholar]
- 11.Viguie CA, Lu DX, Huang SK, Rengen H, Carlson BM. Quantitative study of the effects of long-term denervation on the extensor digitorum longus muscle of the rat. Anat. Rec. 1997;248:346–54. doi: 10.1002/(SICI)1097-0185(199707)248:3<346::AID-AR7>3.0.CO;2-N. [DOI] [PubMed] [Google Scholar]
- 12.Gordon T, Tyreman N, Raji MA. The basis for diminished functional recovery after delayed peripheral nerve repair. J. Neurosci. 2011;31:5325–34. doi: 10.1523/JNEUROSCI.6156-10.2011. [DOI] [PMC free article] [PubMed] [Google Scholar]
- 13.Magown P, Shettar B, Zhang Y, Rafuse VF. Direct optical activation of skeletal muscle fibres efficiently controls muscle contraction and attenuates denervation atrophy. Nat. Commun. 2015;6:8506. doi: 10.1038/ncomms9506. [DOI] [PMC free article] [PubMed] [Google Scholar]
- 14.Hortobágyi T, Cairns NJ. Amyotrophic lateral sclerosis and non-tau frontotemporal lobar degeneration. Handb. Clin. Neurol. 2017;145:369–381. doi: 10.1016/B978-0-12-802395-2.00026-2. [DOI] [PubMed] [Google Scholar]
- 15.Maragakis NJ. Motor neuron disease: progressive muscular atrophy in the ALS spectrum. Nat. Rev. Neurol. 2013;9:562–571. doi: 10.1038/nrneurol.2013.179. [DOI] [PubMed] [Google Scholar]
- 16.Gordon T, Mao J. Muscle atrophy and procedures for training after spinal cord injury. Phys. Ther. 1994;74:50–60. doi: 10.1093/ptj/74.1.50. [DOI] [PubMed] [Google Scholar]
- 17.Robinson LR. Traumatic injury to peripheral nerves. Muscle Nerve. 2000;23:863–873. doi: 10.1002/(SICI)1097-4598(200006)23:6<863::AID-MUS4>3.0.CO;2-0. [DOI] [PubMed] [Google Scholar]
- 18.Furuno K, Goodman MN, Goldberg AL. Role of different proteolytic systems in the degradation of muscle proteins during denervation atrophy. J. Biol. Chem. 1990;265:8550–8557. [PubMed] [Google Scholar]
- 19.Bodine SC, et al. Identification of ubiquitin ligases required for skeletal muscle atrophy. Science. 2001;294:1704–8. doi: 10.1126/science.1065874. [DOI] [PubMed] [Google Scholar]
- 20.Tang H, et al. mTORC1 promotes denervation-induced muscle atrophy through a mechanism involving the activation of FoxO and E3 ubiquitin ligases. Sci. Signal. 2014;7:ra18. doi: 10.1126/scisignal.2004809. [DOI] [PubMed] [Google Scholar]
- 21.Zhao J, et al. FoxO3 coordinately activates protein degradation by the autophagic/lysosomal and proteasomal pathways in atrophying muscle cells. Cell Metab. 2007;6:472–83. doi: 10.1016/j.cmet.2007.11.004. [DOI] [PubMed] [Google Scholar]
- 22.Sandri M, et al. Foxo transcription factors induce the atrophy-related ubiquitin ligase atrogin-1 and cause skeletal muscle atrophy. Cell. 2004;117:399–412. doi: 10.1016/S0092-8674(04)00400-3. [DOI] [PMC free article] [PubMed] [Google Scholar]
- 23.Gomes MD, Lecker SH, Jagoe RT, Navon A, Goldberg AL. Atrogin-1, a muscle-specific F-box protein highly expressed during muscle atrophy. Proc. Natl. Acad. Sci. USA. 2001;98:14440–5. doi: 10.1073/pnas.251541198. [DOI] [PMC free article] [PubMed] [Google Scholar]
- 24.Glass DJ. Signalling pathways that mediate skeletal muscle hypertrophy and atrophy. Nat. Cell Biol. 2003;5:87–90. doi: 10.1038/ncb0203-87. [DOI] [PubMed] [Google Scholar]
- 25.Moresi V, et al. Myogenin and class II HDACs control neurogenic muscle atrophy by inducing E3 ubiquitin ligases. Cell. 2010;143:35–45. doi: 10.1016/j.cell.2010.09.004. [DOI] [PMC free article] [PubMed] [Google Scholar]
- 26.Medina R, Wing SS, Goldberg AL. Increase in levels of polyubiquitin and proteasome mRNA in skeletal muscle during starvation and denervation atrophy. Biochem. J. 1995;307:631–7. doi: 10.1042/bj3070631. [DOI] [PMC free article] [PubMed] [Google Scholar]
- 27.Sacheck JM, et al. Rapid disuse and denervation atrophy involve transcriptional changes similar to those of muscle wasting during systemic diseases. FASEB J. 2007;21:140–55. doi: 10.1096/fj.06-6604com. [DOI] [PubMed] [Google Scholar]
- 28.Cai D, et al. IKKbeta/NF-kappaB activation causes severe muscle wasting in mice. Cell. 2004;119:285–98. doi: 10.1016/j.cell.2004.09.027. [DOI] [PubMed] [Google Scholar]
- 29.Medina R, Wing SS, Haas A, Goldberg AL. Activation of the ubiquitin-ATP-dependent proteolytic system in skeletal muscle during fasting and denervation atrophy. Biomed. Biochim. Acta. 1991;50:347–356. [PubMed] [Google Scholar]
- 30.2019. NCBI Sequence Read Archive. SRP196460
- 31.Batt JA, Bain JR. Tibial nerve transection – a standardized model for denervation-induced skeletal muscle atrophy in mice. J. Vis. Exp. 2013;81:e50657. doi: 10.3791/50657. [DOI] [PMC free article] [PubMed] [Google Scholar]
- 32.Schindelin J, et al. Fiji: an open-source platform for biological-image analysis. Nat. Methods. 2012;9:676–682. doi: 10.1038/nmeth.2019. [DOI] [PMC free article] [PubMed] [Google Scholar]
- 33.StataCorp. Stata Statistical Software: Release 11. College Station, TX: StataCorp LP (2009).
- 34.FastQC, https://www.bioinformatics.babraham.ac.uk/projects/fastqc/ (2018).
- 35.Dobin A, et al. STAR: ultrafast universal RNA-Seq aligner. Bioinformatics. 2013;29:15–21. doi: 10.1093/bioinformatics/bts635. [DOI] [PMC free article] [PubMed] [Google Scholar]
- 36.Anders S, Huber W. Differential expression analysis for sequence count data. Genome Biol. 2010;11:R106. doi: 10.1186/gb-2010-11-10-r106. [DOI] [PMC free article] [PubMed] [Google Scholar]
- 37.Robinson MD, Oshlack A. A scaling normalization method for differential expression analysis of RNA-seq data. Genome Biol. 2010;11:R25. doi: 10.1186/gb-2010-11-3-r25. [DOI] [PMC free article] [PubMed] [Google Scholar]
- 38.Risso D, Ngai J, Speed TP, Dudoit S. Normalization of RNA-Seq data using factor analysis of control genes or samples. Nat. Biotechnol. 2014;32:896–902. doi: 10.1038/nbt.2931. [DOI] [PMC free article] [PubMed] [Google Scholar]
- 39.Ritchie ME, et al. limma powers differential expression analyses for RNA-sequencing and microarray studies. Nucleic Acids Res. 2015;43:e47. doi: 10.1093/nar/gkv007. [DOI] [PMC free article] [PubMed] [Google Scholar]
- 40.Law CW, Chen Y, Shi W, Smyth GK. Voom: precision weights unlock linear model analysis tools for RNA-seq read counts. Genome Biol. 2014;15:R29. doi: 10.1186/gb-2014-15-2-r29. [DOI] [PMC free article] [PubMed] [Google Scholar]
- 41.Smyth GK. Linear models and empirical Bayes methods for assessing differential expression in microarray experiments. Stat. Appl. Genet. Mol. Biol. 2004;3:Article 3. doi: 10.2202/1544-6115.1027. [DOI] [PubMed] [Google Scholar]
- 42.R Core Team. R: A language and environment for statistical computing. (R Foundation for Statistical Computing, 2018).
Associated Data
This section collects any data citations, data availability statements, or supplementary materials included in this article.
Data Citations
- 2019. NCBI Sequence Read Archive. SRP196460
Supplementary Materials
Data Availability Statement
Scripts used in the RNA sequencing analyses are available at https://github.com/icnn/RNAseq-PIPELINE.git.


