Abstract
Objective:
Ultrasound Lagrangian carotid strain imaging (LCSI) utilizes physiological deformation caused by arterial pressure variations to generate strain tensor maps of the vessel walls and plaque. A critique of LCSI has been the lack of normalization of magnitude-based strain indices to physiological stimuli, namely the blood pressure. In this paper, we report on the impact of normalization of magnitude based strain indices to blood pressure measurements acquired immediately after the acquisition of radiofrequency (RF) data loops for LCSI.
Materials and Methods:
A complete clinical ultrasound examination along with RF data loops for LCSI was performed on 50 patients (30 males and 20 females) who present with significant stenosis ≥ 60% using a S2000 system (Siemens Ultrasound, Mountain View, CA, USA) and an 18L6 transducer. All patients were scheduled for a clinically indicated carotid endarterectomy procedure. Cognition was assessed on these patients using the 60-minute neuropsychological test protocol.
Results:
For axial strains correlation of maximum accumulated strain indices (MASI) with cognition scores were −0.46, −0.45, −0.49, −0.37 and −0.48 for un-normalized, systolic, diastolic, pulse pressure and mean arterial pressure normalization respectively. The corresponding area under the curve (AUC) values for classifiers designed using maximum likelihood estimation of a binormal distribution with a median-split of the executive function cognition scores were 0.73, 0.70, 0.71, 0.70 and 0.71 respectively.
Conclusions:
No significant differences in the AUC estimates were obtained between the magnitude-based strain indices that were normalized to the systolic, diastolic and mean arterial pressure when compared to the un-normalized results reported previously.
Keywords: elastography, cognition, carotid strain imaging, strain indices, ultrasound
Introduction
Strokes are the fifth leading cause of mortality and leading cause of disability in the United States1. Strokes may result from blood flow disruptions due to embolization or thrombotic occlusion of complex plaques in extracranial blood vessels that are easily accessible to ultrasound. Over 700,000 strokes are reported each year in the United States, however, at least 5 “silent strokes” occur for each clinically recognized stroke 2, 3. Silent strokes, that may not cause frank symptoms, could result in vascular cognitive impairment (VCI) due to migration of micro emboli from vulnerable carotid plaques to sensitive brain vasculature that are assessed using cognitive testing2–4. VCI was observed in asymptomatic patients pointing to a possible role of micro-emboli causing cognitive deficits 5.
Current clinical ultrasound examinations use an external transducer to depict the carotid vessel wall geometry and plaque if present. Ultrasound mainly uses grayscale features to characterize tissue composition (i.e. calcium, lipid) and surface characteristics (i.e. ulcerative)6, 7. However, these grayscale features do not take into consideration the mechanical properties of the arterial wall and plaque. Both tissue composition and the mechanical properties of the arterial wall determine the risk for a plaque to become vulnerable to rupture3. Current clinical ultrasound B-mode imaging is therefore unable to differentiate vulnerable plaque prone to rupture from other types of plaque.
Ultrasound strain imaging 8–12 can be utilized to estimate the mechanical deformation of carotid plaque under stress, assisting in plaque vulnerability assessments2, 3, 10. Several groups have reported on noninvasive strain imaging 13–24, strain rate 25, ARFI 26, 27 or shear wave imaging28–30 for carotid arteries in human subjects. Our group 3, 10, 13–15, 18, 19, 31–33 has reported on Lagrangian strain estimation on human subjects without the use of any simplifying assumptions such as the incompressibility constraint. Algorithms from other research groups include Eulerian strain 17, 20, 23, angular compounded Eulerian strain 21, Lagrangian strain estimated using the incompressibility assumption 16, or strain estimated from B-mode cine-loops 34. Acoustic radiation force impulse (ARFI) imaging displacements have also been used to characterize carotid plaque 26, 27 on five26 and twenty-five 27 patients respectively. ARFI is unable to differentiate calcium from normal loose matrix, and adjacent arterial tissue could limit the stiffness of lipidic regions measured 26.
Ultrasound based Lagrangian carotid strain imaging (LCSI) developed in our laboratory utilizes physiological deformation generated in response to arterial pressure variations over cardiac cycle to estimate the corresponding strain tensors in the two-dimensional scan plane15, 18. Shi et al.18, initially developed a multi-level tracking algorithm to accurately estimate the discontinuous displacement of the carotid near and far walls in response to blood pressure variations. Their estimation of the local displacement and strain showed that axial strain and lateral displacement could separate soft from calcified plaque. McCormick et al.15 then developed a Lagrangian strain estimation algorithm based on a hierarchical framework utilizing Bayesian regularization19 to estimate all strain tensor components in the two-dimensional scan plane. Magnitude based strain indices such as the maximum and peak-to-trough strain indices derived from peak temporal variation of the respective strain tensor images over a cardiac cycle, have been demonstrated to be capable of quantifying vulnerability of carotid plaque, enhancing their validity as vascular biomarkers2, 18. Comparison of corresponding maximum accumulated strain indices (MASI) and cognition scores (two completely independent tests) have demonstrated a relationship, indicating that noninvasive LCSI can be used to identify patients with VCI14.
A criticism of our LCSI approach has been the lack of normalization of the respective maximum and peak-to-trough accumulated strain indices to the physiological stimuli, namely the underlying blood pressure. Blood pressure based normalization has been controversial as several investigators have reported that normalization is necessary and essential for reproducible carotid strain imaging23, 24. Our approach has always been that strain fluctuations provide sufficient information and normalization would just scale the strain indices and would not provide significant improvements. The hypothesis for this work therefore is that normalization of individual patient magnitude based MASI to their corresponding blood pressure, would improve identification of high-risk patients, by reducing variability in MASI due to blood pressure differences. We report on the impact of normalization of these MASI that depend on the magnitude of the artery wall deformation to blood pressure measurements obtained after the acquisition of radiofrequency (RF) data loops for strain imaging and clinical ultrasound imaging on human patients scheduled for a carotid endarterectomy (CEA).
Materials and Methods
Human Subjects
A complete ultrasound examination along with RF data loops for ultrasound carotid strain imaging was performed on 50 patients (30 males and 20 females) who present with significant stenosis ≥ 60%. All of these patients were candidates for clinically indicated CEA based on both the North American Symptomatic Carotid Endarterectomy Trial35 and Asymptomatic Carotid Atherosclerosis Study36 criteria. Subjects were scheduled for a CEA procedure at the University Hospitals and Clinics. Human subject data used in this study is a sub-set of the data previously presented13, 14, 31, 32, 37–39 and ongoing data acquisitions on human subjects. Clinical blood pressure measurements immediately after data acquisition was added to the IRB protocol in 2012, after reviewer comments on normalization were raised.
Informed consent was obtained from all patients prior to their participation under a protocol approved by the University Institutional Review Board (IRB). Patients were further identified as symptomatic or asymptomatic based on clinical symptoms. Patients who had already suffered a stroke or a transient ischemic attack were classified as symptomatic while all other patients were classified as asymptomatic. Table I, provides the demographic information and corresponding clinical status of the patients.
Table I:
Demographics and clinical statistics of patients reported in this study.
| Variable | Mean (Standard Deviation) |
|---|---|
| Age (years), Mean (SD) | 70.04 (8.84) |
| Gender (N/ (% male), N/ (% female) | 30 (60%)/ 20 (40%) |
| BMI, Mean (SD) | 29.10 (5.82) |
| Stenosis (%), Mean (SD) | 75.17 (11.84) |
| Systolic Pressure (mmHg), Mean (SD) | 130.92 (13.94) |
| Diastolic Pressure (mmHg), Mean (SD) | 73.18 (9.11) |
| Pulse Pressure (mmHg), Mean (SD) | 57.74 (13.66) |
| MAP (mmHg), Mean (SD) | 92.43 (8.87) |
| Asymptomatic patients (%) | 44% |
Human Subjects and Cognition Evaluation
Patients also participated in a study to assess cognition prior to their CEA procedure. Cognition was tested using the 60-minute neuropsychological test protocol following the protocol guidelines of the National Institute of Neurological Disorders (NINDS) and Canadian Stroke Network (CSN). An age-normalized cognition assessment protocol is used specifically for stroke patients and evaluates basic functions by testing executive function, along with deficits in verbal and nonverbal memory, language, and visuospatial ability 40.
Patients were categorized into low and high cognition groups using average z-scores of cognition tests evaluating executive function38, 40. All of these patients have a lower cognition score when compared to normal controls 40. All of these patients did not cognitively decline when tested 1 year post endarterectomy with significant improvement seen in two of the cognition tests 41. A lower cognition score for a patient denotes poorer cognition. Note that we have fewer numbers of patients that can be classified as cognitively impaired when using the zero mean as a classifier. We will therefore use a median-split of the patients based on their cognition score for classification purposes.
Ultrasound Data Acquisition and Strain Imaging
Human patient scans were performed with an Acuson Siemens S2000 system (Siemens Ultrasound, Mountain View, CA, USA) using an 18L6 transducer operated at a center frequency of 11.4 MHz. Radiofrequency (RF) data loops sampled at 40 MHz over two cardiac cycles were collected at three sites on both the carotid arteries to obtain a complete visualization of the plaque along a longitudinal axis. Imaging views were obtained at the common carotid artery (CCA), carotid bulb and internal carotid artery (ICA). In addition to RF data acquisition, clinical assessment of plaque was performed using a 9L4 transducer. Plaque was visualized at the carotid bulb extending into the ICA, and strain analysis was performed on a plane that provides the best view of the entire plaque with an 18L6 transducer. A manual segmentation of the plaque that also includes the adventitial layer was performed at the end-diastole frame, which was then propagated over the entire cardiac cycle. A noninvasive blood pressure measurement was obtained and recorded on each patient after the ultrasound examination.
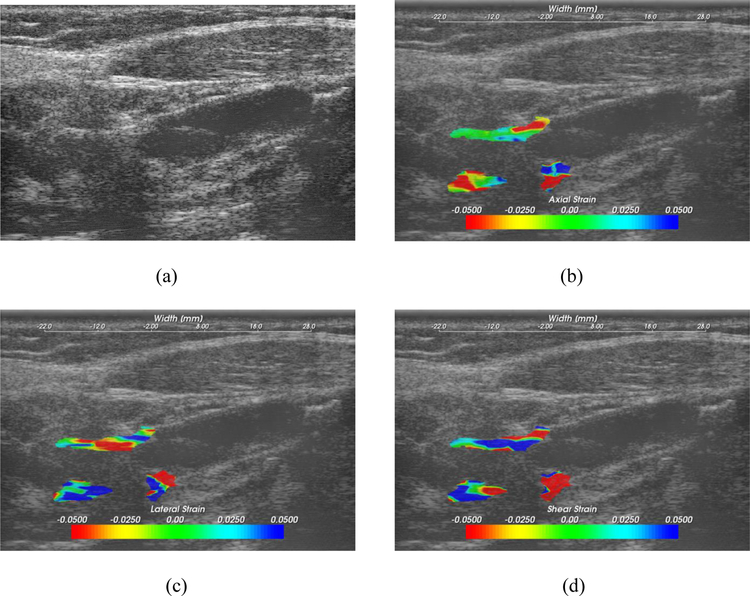
The strain imaging algorithm used to process the RF data loops has been previously described15. Our approach utilizes a two-dimensional normalized cross-correlation block for matching between a pre- and post-deformation frame to estimate the incremental displacement. This hierarchical multi-level algorithm utilizes non-overlapping comparison blocks of dimensions 15 × 28 samples at the upper level, reducing to blocks of 10 ×18 samples at the final level. Incremental displacements estimated using these blocks are then temporally tracked and cumulated over a cardiac cycle. The cumulated axial and lateral displacements are then utilized to estimate the accumulated axial and lateral Lagrangian strain with a final spatial resolution of the strain pixel of 0.2 (axial) ×1.35 (lateral) mm. Shear strain images are also obtained from the cumulated axial and lateral displacements. These strain images are overlaid on the corresponding ultrasound B-mode images as illustrated in Figure 1. Corresponding MASI are then estimated using a –3 dB region of interest around the maximum value of the accumulated strain38.
Figure 1:
Ultrasound B-mode (a) and corresponding accumulated axial (b), lateral (c) and shear (d) strain images. Strain images are overlaid on the corresponding ultrasound B-mode images.
Blood-Pressure Normalization
Blood pressure measurements (Welch Allyn, USA) were utilized to normalize MASI estimated from the axial, lateral and shear strain images over two cardiac cycles. Blood pressure measurements were performed with the patient in a supine position, with the cuff placed on the right arm. Normalization was performed using the systolic (SBP), diastolic (DBP), pulse pressure (PP) and mean arterial pressure (MAP) respectively42. Pulse pressure is defined as . Mean arterial pressure is defined as 42.
Statistical Analysis
Data from a total of n = 50 patients were analyzed in this study. For a significance level of 0.05, sample correlation of 0.4 and power of 0.8, a sample size of n = 47 or higher was needed for the analysis presented in this paper. Pearson’s correlation coefficients were computed to assess the relationship between cognition and un-normalized as well as normalized MASI. A median split was done to classify patients into high and low cognition groups and MASI were used to differentiate between these groups. The parameters for the receiver operating characteristic (ROC) plots were generated using ROC-kit software (Version 0.9.1 beta, Metz ROC Software at the University of Chicago). The software estimates a binormal distribution using maximum likelihood estimation based model.
Results
Typical ultrasound B-mode, and accumulated axial, lateral and shear strain tensor images for a patient are shown in Figure 1. Strain magnitude information and direction are depicted on the color bar. Strain magnitude variations over the entire plaque indicate the strain distribution of different heterogeneous plaque components. Note also the localized regions with higher strain magnitudes used in the computation of MASI.
Variations in MASI estimated from axial, lateral and shear strain images over the 50 subjects are shown in Figure 2 as a box-and-whisker plot. Axial lateral and shear strain based MASI are denoted as axial (A-MASI) lateral (L-MASI) and shear (S-MASI) determined from the strain tensor images over a cardiac cycle. Mean MASI values along with the standard deviation (both denoted in percentage strain) for the axial, lateral and shear MASI are 24.59 ± 22.45 (%), 14.89 ± 9.01 (%) and 29.55 ± 22.81 (%) respectively. Percentage strain denotes the percent change in the length (ΔL/L) in response to a quasi-static deformation, where ΔL denotes the change in length and L represents the original length. Blood pressure values for this patient cohort are illustrated in Figure 3 for systolic, diastolic, pulse pressure and MAP values with the corresponding mean and standard deviation values of 130.92±13.94 (mmHg), 73.18 ± 9.11 (mmHg), 57.74± 13.66 (mmHg), 92.42 ± 8.87 (mmHg) respectively.
Figure 2:
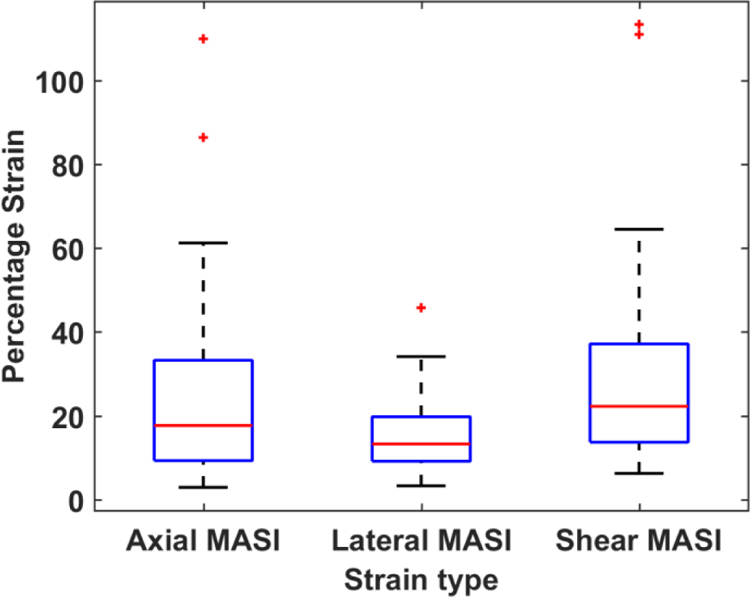
Box-and-Whisker plots of the maximum accumulated strain indices (MASI) for axial (A-MASI), lateral (L-MASI) and shear (S-MASI) over the patients in this study.
Figure 3:
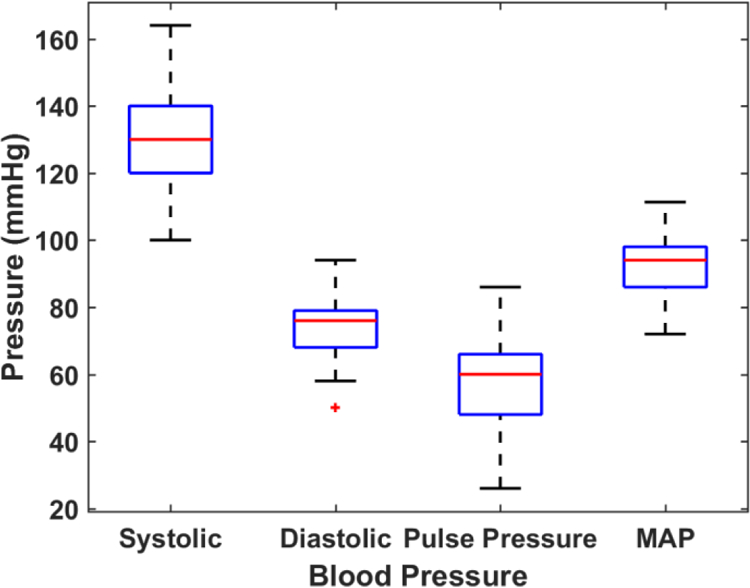
Box-and-Whisker plots of the blood pressure measurements over the patients in this study.
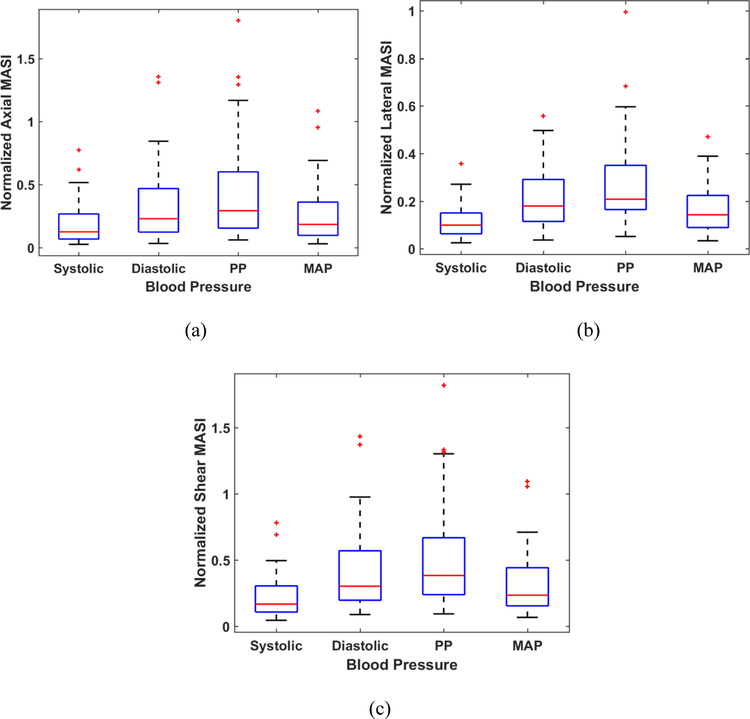
Normalization of MASI was performed using systolic, diastolic, pulse pressure, or the mean arterial pressure (MAP) values respectively. Normalization is performed by dividing the MASI indices obtained for each patient by the individual patient’s systolic, diastolic, pulse pressure, or MAP, respectively. Normalization of the axial, lateral and shear MASI values to the corresponding blood pressure values are depicted in Figure 4 for the axial (a), lateral (b) and shear (c) MASI as box-and-whisker plots. Normalization with the systolic pressure values provides a compressed range of MASI values, while the normalization with the pulse pressure presents the largest variation in normalized MASI values over this patient cohort.
Figure 4:
Box-and-Whisker plots of A-MASI (a), L-MASI (b) and S-MASI (c) normalized to the blood pressure measurements over the patients in this study.
A histogram of the patient’s cognition score is shown in Figure 5. Pearson correlation coefficient (r) values for the corresponding MASI values versus the composite cognition score for executive function is shown in Table II. The p-values for the correlation coefficient estimates are indicated below the table. The negative correlation in Table II, indicates as previously described that larger values of MASI correspond to lower cognition. Jackson et al. 40 present more detailed descriptions of the cognition tests for executive function. Corresponding correlation values obtained for clinical variables versus the composite cognition score for executive function on these patients is shown in Table III. Diastolic blood pressure (r=0.26, p=0.07) and age (r=0.27, p =0.06) were weakly correlated and not significant. All correlations obtained are low and not statistically significant when compared to the statistically significant correlations obtained with MASI in Table II.
Figure 5:
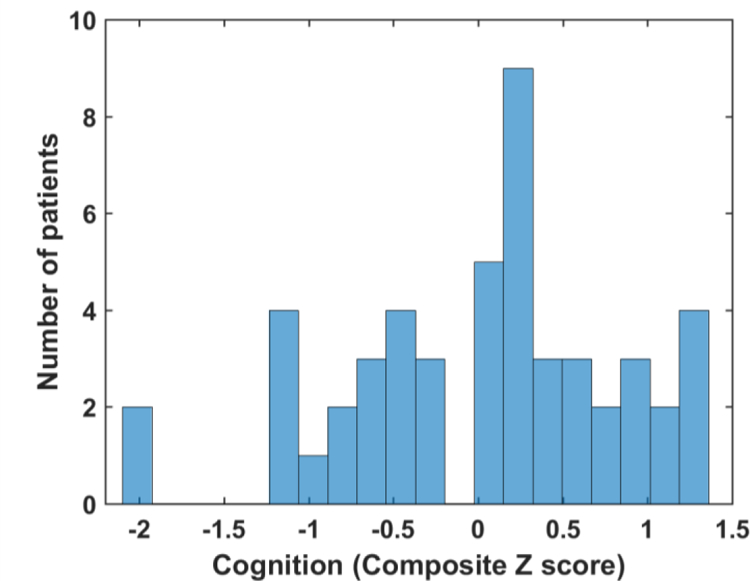
Histogram of the composite cognition z-scores on executive function. Z-scores below zero indicate poor-cognition while those above zero indicate improved cognition.
Table II:
Pearson’s correlation coefficient (with 95% confidence intervals (CI)) values for magnitude based MASI versus cognition z-scores on executive function with and without blood pressure normalization.
| r-values | No- Normalization |
Systolic Normalization |
Diastolic Normalization |
PP Normalization |
MAP Normalization |
|---|---|---|---|---|---|
| A-MASI CI |
−0.46** (−0.20 – −0.65) |
−0.45** (−0.20 – −0.65) |
−0.49** (−0.24 – −0.67 ) |
−0.37* (−0.10 – −0.59) |
−0.48** (−0.22 – −0.68) |
| L-MASI CI |
−0.32 (−0.05 – −0.55) |
−0.30 (−0.02– −0.53) |
−0.37* (−0.09– −0.58) |
−0.19 (0.09 – −0.44) |
−0.34 (−0.06 – −0.56) |
| S-MASI CI |
−0.39* (−0.12 – −0.60) |
−0.40* (−0.13– −0.61) |
−0.43* (−0.17 – −0.65) |
−0.31 (−0.04 – −0.54) |
−0.42* (−0.15 – −0.62) |
p <0.001
p<0.01
Table III:
Pearson’s correlation coefficient values and p-values for clinical variables in patients versus executive function cognition z-scores indicating that these relationships are not statistically significant.
| Variable | r-values | p-values | CI |
|---|---|---|---|
| Systolic Pressure (mmHg) | −0.03 | 0.84 | −0.30 – 0.25 |
| Diastolic Pressure (mmHg) | 0.26 | 0.07 | −0.01 – 0.50 |
| Pulse Pressure (mmHg) | −0.20 | 0.16 | −0.45 – 0.08 |
| MAP (mmHg) | 0.16 | 0.26 | −0.12 – 0.42 |
| Age (years) | 0.27 | 0.06 | −0.01– 0.51 |
| BMI | 0.14 | 0.33 | −0.14 – 0.41 |
| Stenosis (%) | 0.08 | 0.59 | −0.21 – 0.36 |
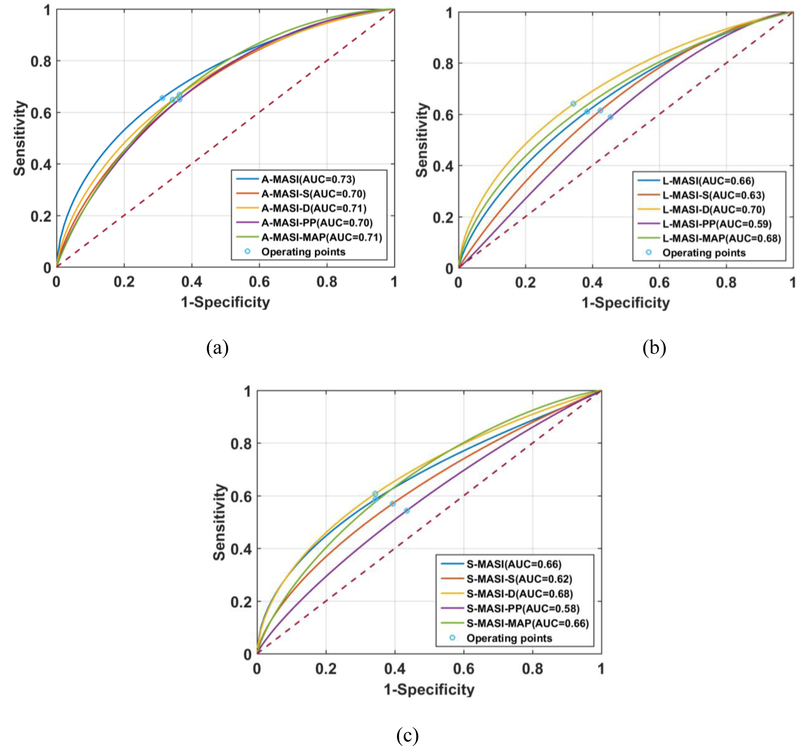
ROC analysis is then performed to assess any classification advantages obtained using MASI normalized to blood-pressure values when compared to un-normalized MASI values. MASI derived from axial, lateral or shear tensor images are utilized as features for classifying patients into the low and high cognition groups respectively. Figure 6 presents classification plots along with the area under the curve (AUC) values utilizing A-MASI (a), L-MASI (b) and S-MASI (c) based on a median-split of the cognition scores respectively. Note that normalization of corresponding MASI to the blood pressure measurements do not improve or change the AUC values versus the un-normalized MASI. The 95% CI for the AUC for each classifier are listed in Table IV, with the operating points shown in Figure 6. The ROC curve represents a tradeoff between the sensitivity and specificity of classifier performance. The operating point on the ROC curve, denotes a threshold value that is selected by the user to obtain the best or optimal tradeoff between sensitivity and specificity in the classifier’s performance (shown on the ROC curve in Figure 6). Note that MASI derived from the axial strain tensor images provide better classification perform when compared to MASI derived from the lateral and shear strain tensor images. Furthermore, un-normalized axial MASI provided the best classification performance.
Figure 6:
ROC curves for MASI versus a median-split of the cognition scores for all patients in the study. MASI denotes the un-normalized results described previously, while MASI-S, MASI-D, MASI-PP and MASI-MAP denotes normalization with the systolic, diastolic, pulse pressure and mean arterial pressure (MAP) respectively. ROC results are shown for (a) strain indices derived from axial strain (A-MASI), (b) lateral strain (L-MASI) and c) shear strain (S-MASI).
Table IV:
The 95% confidence intervals for ROC analysis with a median-split of the cognition scores.
| No- Normalization |
Systolic Normalization |
Diastolic Normalization |
PP Normalization |
MAP Normalization |
|
|---|---|---|---|---|---|
| A-MASI | 0.85–0.58 | 0.82–0.54 | 0.84–0.55 | 0.83–0.56 | 0.83–0.55 |
| L-MASI | 0.79–0.50 | 0.77–0.47 | 0.83–0.55 | 0.74–0.43 | 0.81–0.51 |
| S-MASI | 0.80–0.51 | 0.76–0.46 | 0.81–0.52 | 0.72–0.42 | 0.79–0.51 |
Finally, a multi-variate classifier utilizing un-normalized axial MASI, diastolic blood pressure and age was designed using logistic regression with 10-fold cross validation with Weka 3 (Version 3.8.0, Machine Learning Group at the University of Waikato) 43. This multi-variate classifier provided a median split AUC of 0.76 versus 0.73 using only the un-normalized axial MASI, and does not demonstrate significant improvement in the AUC.
Discussion
Magnitude based strain indices namely MASI and Peak-to-Trough indices have previously demonstrated improved classification results differentiating between patients with possible vascular cognitive impairment and symptomatic vs. asymptomatic patients 13, 14, 31, 32. MASI provides the most consistent set of magnitude based strain indices and is utilized in this paper to assess the efficacy of normalization with clinical blood pressure measurements37. Only MASI has been evaluated in this paper as it is significantly correlated to Peak-to-Trough indices, since both are dependent on strain magnitude and would not provide significantly improved performance when combined as multi-variable classifiers.
Normalization of MASI to clinical blood-pressure values are reported in this paper. All previously reported patient classification results in the literature were for un-normalized MASI from a primary region of interest (ROI) 13, 14, 31, 32 and other indices derived from multiple ROI 38. The results reported in this paper demonstrate that normalization to clinical blood-pressure measurements does not provide statistically significant improvements in classification performance for magnitude based MASI. These results imply that the information already present in the un-normalized MASI has sufficient discriminating capacity to differentiate between patients with low and high cognition respectively without the additional information provided by the blood-pressure measurements. A linear trend between MASI and cognition features for both symptomatic and asymptomatic patients has also been reported 44. In addition, since the deformation of the artery wall and plaque is due to blood pressure variations over a cardiac cycle, this information could be implicitly incorporated into the corresponding MASI values. Similar results demonstrating the limited impact of blood pressure or load on cardiac strain imaging have also been presented 45.
Normalization in this paper was performed using clinical blood pressure measurements and not intraluminal carotid arterial pressures. Intraluminal pressures can vary significantly in the presence of plaque since stenosis that alters blood-flow patterns may introduce local pressure fluctuations. In addition, it is not feasible to obtain invasive intraluminal pressures in human patients without causing further damage to their arteries. Intraluminal pressures in addition, could vary significantly with plaque and precise pressure measurements may not be possible due to turbulent blood flow. In addition, stress concentrations due to specific vessel geometries and boundary conditions would also manifest as an increase in tissue deformation, which are quantified using MASI providing direct estimates of plaque vulnerability or vascular aging.
However, as multiple groups have reported, the strain distribution by itself would not provide intrinsic elastic moduli of plaque even if the applied deformation can be controlled precisely, since modulus reconstruction would have to be performed. Current modulus reconstruction approaches have extremely large variability in the results due to noise artifacts that are augmented in the process of solving the inverse problem 46. Unfortunately, it has been shown by others 47–49 that stiffness or modulus measurements may not be reproducible if all boundary conditions are not accounted for. Intra-arterial pressure measurements in the presence of plaque vary significantly, due to different occlusion levels and tortuous blood flow making Young’s modulus estimation very noisy and well-above the already noisy reconstruction threshold 46. In addition, plaque tissue is extremely inhomogeneous, making modulus reconstruction approaches more difficult to implement. Shear velocity/modulus mapping have been reported on human subjects 28 but the validity of these results have to be carefully studied and established 50. Shear modulus estimation are dependent on several assumptions that may not hold in blood vessels, and heterogeneous plaque would introduce additional inaccuracies in the shear velocity and hence shear modulus mappings 50, 51.
On the other hand strain estimation and imaging in both normal and stenotic carotid arteries have been demonstrated to provide reproducible results on human subjects, for both Eulerian17, 20, 21, 23, 33 and Lagrangian strain using an incompressibility constraint16. Comparison of accumulated axial strain computed from RF echo signals indicate that the values reported in our paper are similar to that reported in the literature for specific human patient examples ranging from −20% to 20% 52, and −4% to 25% 16. Other reports have presented incremental axial strain ≈ 1% 17, which upon cumulating would lead to similar ranges as reported in this paper. Our group has demonstrated robust and reproducible Lagrangian carotid strain estimation algorithms without simplifying assumptions along with high spatial and temporal resolution on a significant number of human subjects 13, 14, 31, 32, 38, starting with an implementation using ITK software15 to a fast GPU based implementation53. Carotid strain imaging therefore has the potential to accurately depict the temporal variation of both normal and shear strain tensors with high spatial resolutions.
Conclusions
The impact of normalization using clinical blood pressure measurements on magnitude based strain indices estimated using Lagrangian carotid strain imaging is described in this paper. Normalization of MASI obtained for each patient with their corresponding clinical blood pressure values does not significantly impact correlation or the area under the curve (AUC) obtained between independently assessed cognition measures. We also did not observe any improvement in the differentiation between low and high cognition patient groups with and without MASI normalization. This is probably due to the fact that normalization did not add any additional or new information to improve classifier performance with respect to its sensitivity or specificity. Our results demonstrate that normalization of MASI to the clinical blood pressure does not have any adverse consequences to classifier performance or correlation analysis as this information is indirectly incorporated into corresponding MASI with the deformation of the artery due to blood pressure variations. Correlation with executive function obtained with MASI was also significantly higher than those obtained with other clinical parameters acquired on these patients. Age-normalized cognition measures are obtained independently on these patients with researchers acquiring this data blinded to the strain analysis and vice versa. Pearson’s correlation coefficients obtained between MASI and cognition measures are statistically significant with reasonable strength in the association between MASI and cognition measures.
Acknowledgements
This research was funded in part by National Institutes of Health grants R01 NS064034 and 2R01 CA112192. We gratefully acknowledge the support of NVIDIA Corporation with the donation of the Tesla K40 GPU used for this research. Support for this research was also provided by the Office of the Vice Chancellor for Research and Graduate Education at the University of Wisconsin-Madison with funding from the Wisconsin Alumni Research Foundation (WARF). We are grateful to Siemens Medical Solutions USA, Inc., for providing the S2000 Axius Direct Ultrasound Research Interface (URI) and software licenses.
Footnotes
Conflict of Interest
None
References
- 1.Benjamin EJ, Blaha MJ, Chiuve SE, et al. Heart Disease and Stroke Statistics-2017 Update: A Report From the American Heart Association. Circulation 2017;135:e146–e603. [DOI] [PMC free article] [PubMed] [Google Scholar]
- 2.Rocque BG, Jackson DC, Varghese T, et al. Impaired cognitive function in patients with atherosclerotic carotid stenosis and correlation with ultrasound strain measurements. J Neurol Sci 2012;322:20–4. [DOI] [PMC free article] [PubMed] [Google Scholar]
- 3.Dempsey RJ, Vemuganti R, Varghese T, et al. A review of carotid atherosclerosis and vascular cognitive decline: a new understanding of the keys to symptomology. Neurosurgery 2010;67:484–93. [DOI] [PMC free article] [PubMed] [Google Scholar]
- 4.Lal BK, Dux MC, Sikdar S, et al. Asymptomatic carotid stenosis is associated with cognitive impairment. J Vasc Surg 2017;66:1083–1092. [DOI] [PubMed] [Google Scholar]
- 5.Dempsey RJ, Varghese T, Jackson DC, et al. Ultrasound plaque strain determines carotid atherosclerotic plaque instability and cognition in asymptomatic patients with significant stenosis. Journal of Neurosurgery 2018;128:111–119. [DOI] [PMC free article] [PubMed] [Google Scholar]
- 6.Bluth EI, Kay D, Merritt CR, et al. Sonographic characterization of carotid plaque: detection of hemorrhage. AJR Am J Roentgenol 1986;146:1061–5. [DOI] [PubMed] [Google Scholar]
- 7.Mitchell CC, Stein JH, Cook TD, et al. Histopathologic Validation of Grayscale Carotid Plaque Characteristics Related to Plaque Vulnerability. Ultrasound Med Biol 2017;43:129–137. [DOI] [PMC free article] [PubMed] [Google Scholar]
- 8.Ophir J, Garra B, Kallel F, et al. Elastographic imaging. Ultrasound in Medicine and Biology 2000;26, suppl:S23–9. [DOI] [PubMed] [Google Scholar]
- 9.Varghese T, Ophir J, Konofagou E, et al. Tradeoffs in elastographic imaging. Ultrasonic Imaging 2001;23:216–48. [DOI] [PubMed] [Google Scholar]
- 10.Varghese T Quasi-Static Ultrasound Elastography. Ultrasound Clin 2009;4:323–338. [DOI] [PMC free article] [PubMed] [Google Scholar]
- 11.Alam SK, Ophir J and Konofagou EE. An adaptive strain estimator for elastography. IEEE Trans Ultrason Ferroel Freq Cont 1998;45:461–72. [DOI] [PubMed] [Google Scholar]
- 12.Rivaz H, Boctor EM, Choti MA, et al. Real-time regularized ultrasound elastography. IEEE Trans Med Imaging 2011;30:928–45. [DOI] [PubMed] [Google Scholar]
- 13.Wang X, Jackson DC, Mitchell CC, et al. Classification of Symptomatic and Asymptomatic Patients with and without Cognitive Decline using Non-invasive Carotid Plaque based Strain Indices as Biomarkers. Ultrasound Med Biol 2016;42:909–918. [DOI] [PMC free article] [PubMed] [Google Scholar]
- 14.Berman S, Wang X, Mitchell CC, et al. The relationship between carotid artery plaque stability and white matter ischemic injury. NeuroImage: Clinical 2015;9:216–222. [DOI] [PMC free article] [PubMed] [Google Scholar]
- 15.McCormick M, Varghese T, Wang X, et al. Methods for robust in vivo strain estimation in the carotid artery. Phys Med Biol 2012;57:7329–53. [DOI] [PMC free article] [PubMed] [Google Scholar]
- 16.Schmitt C, Soulez G, Maurice RL, et al. Noninvasive vascular elastography: toward a complementary characterization tool of atherosclerosis in carotid arteries. Ultrasound Med Biol 2007;33:1841–1858. [DOI] [PubMed] [Google Scholar]
- 17.Ribbers H, Lopata RG, Holewijn S, et al. Noninvasive two-dimensional strain imaging of arteries: validation in phantoms and preliminary experience in carotid arteries in vivo. Ultrasound Med Biol 2007;33:530–540. [DOI] [PubMed] [Google Scholar]
- 18.Shi H, Mitchell CC, McCormick M, et al. Preliminary in vivo atherosclerotic carotid plaque characterization using the accumulated axial strain and relative lateral shift strain indices. Phys Med Biol 2008;53:6377–94. [DOI] [PMC free article] [PubMed] [Google Scholar]
- 19.McCormick M, Rubert N and Varghese T. Bayesian regularization applied to ultrasound strain imaging. IEEE Trans Biomed Eng 2011;58:1612–20. [DOI] [PMC free article] [PubMed] [Google Scholar]
- 20.Idzenga T, Holewijn S, Hansen HH, et al. Estimating cyclic shear strain in the common carotid artery using radiofrequency ultrasound. Ultrasound Med Biol 2012;38:2229–37. [DOI] [PubMed] [Google Scholar]
- 21.Hansen HH, de Borst GJ, Bots ML, et al. Validation of Noninvasive In Vivo Compound Ultrasound Strain Imaging Using Histologic Plaque Vulnerability Features. Stroke 2016;47:2770–2775. [DOI] [PubMed] [Google Scholar]
- 22.Wan J, He F, Zhao Y, et al. Non-invasive vascular radial/circumferential strain imaging and wall shear rate estimation using video images of diagnostic ultrasound. Ultrasound Med Biol 2014;40:622–36. [DOI] [PubMed] [Google Scholar]
- 23.Nayak R, Huntzicker S, Ohayon J, et al. Principal Strain Vascular Elastography: Simulation and Preliminary Clinical Evaluation. Ultrasound Med Biol 2017;43:682–699. [DOI] [PMC free article] [PubMed] [Google Scholar]
- 24.Mercure E, Destrempes F, RoyCardinal MH, et al. A local angle compensation method based on kinematics constraints for non-invasive vascular axial strain computations on human carotid arteries. Comput Med Imaging Graph 2014 Mar;. 2014;38:123–36. [DOI] [PubMed] [Google Scholar]
- 25.Huang C, He Q, Huang M, et al. Non-Invasive Identification of Vulnerable Atherosclerotic Plaques Using Texture Analysis in Ultrasound Carotid Elastography: An In Vivo Feasibility Study Validated by Magnetic Resonance Imaging. Ultrasound Med Biol 2017;43:817–830. [DOI] [PubMed] [Google Scholar]
- 26.Doherty JR, Dahl JJ, Kranz PG, et al. Comparison of Acoustic Radiation Force Impulse Imaging Derived Carotid Plaque Stiffness With Spatially Registered MRI Determined Composition. IEEE Trans Med Imaging 2015;34:2354–65. [DOI] [PMC free article] [PubMed] [Google Scholar]
- 27.Czernuszewicz TJ, Homeister JW, Caughey MC, et al. Performance of acoustic radiation force impulse ultrasound imaging for carotid plaque characterization with histologic validation. J Vasc Surg 2017;66:1749–1757. [DOI] [PMC free article] [PubMed] [Google Scholar]
- 28.Ramnarine KV, Garrard JW, Kanber B, et al. Shear wave elastography imaging of carotid plaques: feasible. reproducible and of clinical potential. Cardiovasc Ultrasound 2014;12:49. [DOI] [PMC free article] [PubMed] [Google Scholar]
- 29.Dumont DM, Doherty JR and Trahey GE. Noninvasive assessment of wall-shear rate and vascular elasticity using combined ARFI/SWEI/spectral Doppler imaging system. Ultrason Imaging 2011;33:165–88. [DOI] [PMC free article] [PubMed] [Google Scholar]
- 30.Couade M, Pernot M, Prada C, et al. Quantitative assessment of arterial wall biomechanical properties using shear wave imaging. Ultrasound Med Biol 2010;36:1662–76. [DOI] [PubMed] [Google Scholar]
- 31.Wang X, Mitchell CC, Varghese T, et al. Improved Correlation of Strain Indices with Cognitive Dysfunction with Inclusion of Adventitial Layer with Carotid Plaque. Ultrason Imaging 2016;38:194–208. [DOI] [PMC free article] [PubMed] [Google Scholar]
- 32.Wang X, Jackson DC, Varghese T, et al. Correlation of cognitive function with ultrasound strain indices in carotid plaque. Ultrasound Med Biol 2014;40:78–89. [DOI] [PMC free article] [PubMed] [Google Scholar]
- 33.Shi H and Varghese T. Two-dimensional multi-level strain estimation for discontinuous tissue. Phys Med Biol 2007;52:389–401. [DOI] [PubMed] [Google Scholar]
- 34.Khan AA, Sikdar S, Hatsukami T, et al. Noninvasive characterization of carotid plaque strain. J Vasc Surg 2017;65:1653–1663. [DOI] [PMC free article] [PubMed] [Google Scholar]
- 35.NASCET. The North American symptomatic carotid endarterectomy trial surgical results in 1415 patients. Stroke 1999;30:1751–1758. [DOI] [PubMed] [Google Scholar]
- 36.ACAS. Endarterectomy for asymptomatic carotid artery stenosis. Jama 1995;273:1421–1428. [PubMed] [Google Scholar]
- 37.Varghese T, Meshram NH, Mitchell CC, et al. Normalization of Carotid Plaque based Strain Indices using Blood Pressure Measurements. 2017 IEEE International Ultrasonics Symposium (IUS) 2017.
- 38.Meshram NH, Varghese T, Mitchell CC, et al. Quantification of carotid artery plaque stability with multiple region of interest based ultrasound strain indices and relationship with cognition. Phys Med Biol 2017;62:6341–6360. [DOI] [PMC free article] [PubMed] [Google Scholar]
- 39.Mitchell CC, Stein JH, Cook TD, et al. Histopathological Validation of Novel Gray Scale Carotid Plaque Characteristics Related to Plaque Vulnerability Ultrasound Med Biol 2017;43:129–137. [DOI] [PMC free article] [PubMed] [Google Scholar]
- 40.Jackson DC, Sandoval-Garcia C, Rocque BG, et al. Cognitive Deficits in Symptomatic and Asymptomatic Carotid Endarterectomy Surgical Candidates. Arch Clin Neuropsychol 2016;31:1–7. [DOI] [PMC free article] [PubMed] [Google Scholar]
- 41.Dempsey RJ, Jackson DC, Wilbrand SM, et al. The Preservation of Cognition One Year after Carotid Endarterectomy in Patients with Prior Cognitive Decline. Neurosurgery 2018;82:322–328. [DOI] [PMC free article] [PubMed] [Google Scholar]
- 42.Walker HK, Hall WD and Hurst JW. Clinical Methods, The History, Physical, and Laboratory Examinations, 3rd edition. Boston: Butterworth Publishers, a division of Reed Publishing; 1990. [PubMed] [Google Scholar]
- 43.Hall M, Frank E, Holmes G, et al. The WEKA data mining software: an update ACM SIGKDD Explorations Newsletter 2009;11:10–18. [Google Scholar]
- 44.Meshram NH, Jackson D, Varghese T, et al. A Cross-Sectional Investigation of Cognition and Ultrasound-Based Vascular Strain Indices. Arch Clin Neuropsychol 2019. [DOI] [PMC free article] [PubMed]
- 45.Khamis H, Claes P, Cauwenberghs N, et al. Machine learning to understand anthropomorphic modulators of spatiotemporal myocardial mechanics. 2017 IEEE International Ultrasonics Symposium (IUS) 2017.
- 46.Barbone PE and Oberai AA. Elastic modulus imaging: some exact solutions of the compressible elastography inverse problem. Phys Med Biol 2007;52:1577–93. [DOI] [PubMed] [Google Scholar]
- 47.Barbone PE and Bamber JC. Quantitative elasticity imaging: what can and cannot be inferred from strain images. Phys Med Biol 2002;47:2147–64. [DOI] [PubMed] [Google Scholar]
- 48.Oudry J, Lynch T, Vappou J, et al. Comparison of four different techniques to evaluate the elastic properties of phantom in elastography: is there a gold standard? Phys Med Biol 2014;59:5775–93. [DOI] [PubMed] [Google Scholar]
- 49.Seidl DT, Babaniyi OA, Oberai AA, et al. Boundary conditions in quantitative elastic modulus imaging. J Acoust Soc Am 2014;135:2157. [Google Scholar]
- 50.Widman E, Maksuti E, Amador C, et al. Shear Wave Elastography Quantifies Stiffness in Ex Vivo Porcine Artery with Stiffened Arterial Region. Ultrasound Med Biol 2016;42:2423–35. [DOI] [PubMed] [Google Scholar]
- 51.de Korte CL, Fekkes S, Nederveen AJ, et al. Mechanical Characterization of Carotid Arteries and Atherosclerotic Plaques. IEEE Trans Ultrason Ferroelectr Freq Control 2016;63:1613–1623. [DOI] [PubMed] [Google Scholar]
- 52.Naim C, Cloutier G, Mercure E, et al. Characterisation of carotid plaques with ultrasound elastography: feasibility and correlation with high-resolution magnetic resonance imaging. Eur Radiol 2013;23:2030–41. [DOI] [PubMed] [Google Scholar]
- 53.Meshram NH and Varghese T. GPU accelerated multilevel Lagrangian Carotid Strain Imaging. IEEE Trans Ultrason Ferroel Freq Cont 2018;65:1370–1379. [DOI] [PMC free article] [PubMed] [Google Scholar]


