Abstract
Study Objectives:
The association between obstructive sleep apnea (OSA) and hypertension in prior studies has been determined using a definition of hypopnea requiring a 4% O2 desaturation. However, the American Academy of Sleep Medicine (AASM) recommends using a 3% O2 desaturation or an arousal. This analysis assesses the relationship between OSA and hypertension utilizing the AASM recommended definition and the 2018 American College of Cardiology/American Heart Association hypertension guidelines.
Methods:
Data from 6113 participants from the Sleep Heart Health Study were analyzed. The AASM recommended apnea-hypopnea index (AHI) was classified into 4 categories of OSA severity: < 5, 5 to < 15, 15 to < 30 and ≥ 30 events/h. Three definitions of hypertension were used: elevated (> 120/< 80 or use of hypertension medications [meds]), stage 1/stage 2 (> 130/80 or meds), stage 2 (> 140/90 or meds). Data were analyzed using logistic regression controlling for demographics, smoking and body mass index. Multiple linear regression analysis assessed the relationship between natural log AHI, and systolic and diastolic blood pressure controlling for the same covariates.
Results:
For all definitions of blood pressure elevation, increasing OSA severity was associated with greater likelihood of an elevated or hypertensive status in fully adjusted models (odds ratio [95% confidence interval]): elevated 1.30 (1.09–1.54), 1.39 (1.13–1.70) 1.69 (1.29–2.13); stage 1/2: 1.25 (1.06–1.47), 1.32 (1.10–1.59), 1.53 (1.23–1.91); stage 2: 1.07 (0.91–1.25), 1.21 (1.01–1.44), 1.37 (1.11–1.69) for AHI 5 to < 15, 15 to < 30 and > 30 events/h (< 5 events/h reference). Linear regression found that AHI was associated with both systolic and diastolic blood pressure in fully adjusted models.
Conclusions:
Use of the AASM recommended definition of hypopnea as a component of the AHI is associated with the presence of hypertension.
Citation:
Budhiraja R, Javaheri S, Parthasarathy S, Berry RB, Quan SF. The association between obstructive sleep apnea characterized by a minimum 3 percent oxygen desaturation or arousal hypopnea definition and hypertension. J Clin Sleep Med. 2019;15(9):1261–1270.
Keywords: obstructive sleep apnea, hypertension, blood pressure, apnea-hypopnea index
BRIEF SUMMARY
Current Knowledge/Study Rationale: Severity of obstructive sleep apnea (OSA) is usually characterized by the apnea-hypopnea index (AHI), which in most studies requires a hypopnea definition utilizing a minimum 4% oxygen desaturation. AASM standards, however, recommend using a hypopnea definition requiring a minimum 3% oxygen desaturation or an arousal. This study analyzes the relationship between the AASM recommended AHI definition and prevalent hypertension.
Study Impact: Use of the AASM recommended definition of hypopnea as a component of the AHI is associated with the presence of hypertension. This suggests that use of a 4% O2 desaturation requirement by several third party payors to define treatable OSA is too stringent and may deny treatment to some patients with OSA.
INTRODUCTION
Obstructive sleep apnea (OSA) is a prevalent disorder characterized by recurrent episodes of either complete upper airway collapse (apneas) or partial collapse (hypopneas) during sleep. In 2012, the American Academy of Sleep Medicine (AASM) recommended that the hypopnea definition include any decrease in airflow by at least 30% from the baseline with an oxyhemoglobin desaturation of at least 3%, or an arousal from sleep.1 However, several payors including the Centers for Medicare and Medicaid Services (CMS) continue to require a more stringent hypopnea definition necessitating a 4% or greater decrease in oxygen saturation despite evidence documenting a relationship between the AASM recommended standard and daytime sleepiness. The resistance to universal acceptance of the AASM criteria is based in part on the assertion that 3% desaturations or arousals have not been convincingly demonstrated to have adverse cardiovascular impact. Whether this reluctance to adopt a more inclusive definition of sleep apnea denies appropriate OSA therapy to persons who would be at higher risk of adverse consequences such as hypertension is not clear. Delineating the potential relationship between OSA characterized by lesser degrees of oxyhemoglobin desaturation (3% drop in saturation) or an arousal from sleep and the putative consequences of OSA in large population studies can help better identify persons at risk for adverse effects and potentially improve health-related outcomes.
Several studies have now firmly established a relationship between OSA and hypertension.2,3 Diverse physiological derangements, including intermittent hypoxemia, sleep fragmentation, sympathetic activation and endothelial dysfunction may play an integral role in mediating the cardiovascular consequences of OSA. Furthermore, therapy of OSA is associated with a decline in systemic blood pressure.4–6 In 2017, the American College of Cardiology (ACC) and the American Heart Association (AHA) published updated definitions of hypertension.7 However, the relationship between OSA and hypertension incorporating the most recent definitions of hypertension has not been determined.
Using the database from the Sleep Heart Health Study (SHHS), a large well-characterized community based cohort that had undergone polysomnography, the current study aimed to determine the impact of using the AASM recommended standards on the relationship between OSA and prevalent hypertension in middle-aged and older adults. The specific objective was to evaluate the association of hypertension incorporating both new and older AHA definitions of hypertension, with severity of OSA as determined using a definition of hypopnea with at least a 3% desaturation or an arousal from sleep. In addition, the same analyses were performed in which the severity of OSA was assessed using a hypopnea definition requiring at least a 4% oxygen desaturation without the need for an arousal.
METHODS
The SHHS was a prospective multicenter cohort study designed to investigate the relationship between OSA and cardiovascular diseases in the United States. A detailed description of the study rationale and design have been published elsewhere.8 Recruitment began in 1995, enrolling 6,441 individuals 40 years of age and older, from several ongoing “parent” cardiovascular and respiratory disease cohorts who were initially assembled between 1976 and 1995.9 These cohorts included the Offspring Cohort and the Omni Cohort of the Framingham Heart Study in Massachusetts; the Hagerstown, Maryland, and Minneapolis, Minnesota, sites of the Atherosclerosis Risk in Communities Study; the Hagerstown, Maryland, Pittsburgh, Pennsylvania, and Sacramento, California, sites of the Cardiovascular Health Study; 3 hypertension cohorts (Clinic, Worksite, and Menopause) in New York City; the Tucson Epidemiologic Study of Airways Obstructive Diseases and the Health and Environment Study; and the Strong Heart Study of American Indians in Oklahoma, Arizona, North Dakota, and South Dakota. Because of sovereignty issues, 134 participants from the Arizona cohort of the Strong Heart Study withdrew consent. Analyses were performed on the remaining 6,307 participants. Parent cohort data were used for documentation of age, height, sex, ethnicity and smoking status. The SHHS was approved by the respective parent institutional review boards for human research, and informed written consent was obtained from all participants at the time of their enrollment.
Polysomnography and Home Visit
Participants underwent overnight in-home polysomnography using the Compumedics Portable PS-2 System (Abbottsville, Victoria, Australia) administered by trained technicians.10 The home visits were performed by two-person, mixed-sex teams in visits that lasted 1.5 to 2 hours. There was emphasis on making the night of the assessment as representative as possible of a usual night of sleep. Participants were asked to schedule the visit so that it would occur approximately 2 hours prior to their usual bedtime. At the time of the home visit, an inventory of each participant’s medications was made. Blood pressure was measured manually in triplicate in a seated position after 5 minutes of rest.11 The average of the second and third measurements was used for this analysis. Body weight was obtained using a digital scale.
The SHHS recording montage consisted of electroencephalogram (C4/A1 and C3/A2), right and left electrooculogram, a bipolar submental electromyogram, thoracic and abdominal excursions (inductive plethysmography bands), airflow (detected by a nasal-oral thermocouple [Protec, Woodinville, Washington]), oximetry (finger pulse oximetry [Nonin, Minneapolis, Minnesota]), electrocardiogram and heart rate (using a bipolar electrocardiogram lead), body position (using a mercury gauge sensor), and ambient light (on/off, by a light sensor secured to the recording garment). Sensors were placed, and equipment was calibrated during an evening home visit by a certified technician. After technicians retrieved the equipment, the data, stored in real time on PCMCIA cards, were downloaded to the computers of each respective clinical site, locally reviewed, and forwarded to a central reading center (Case Western Reserve University, Cleveland, Ohio). Comprehensive descriptions of polysomnography scoring and quality-assurance procedures have been previously published.10,12 In brief, sleep was scored according to guidelines developed by Rechtschaffen and Kales.13 Strict protocols were maintained to ensure comparability among centers and technicians. Intrascorer and interscorer reliabilities were high.12
The apnea-hypopnea index (AHI) was calculated for each participant using two definitions of hypopnea, the AASM recommended definition (3%A) and the AASM acceptable (CMS) definition (4% only). For 3%A, hypopneas were identified if the amplitude of a measure of flow or volume (detected by the thermocouple or thorax or abdominal inductance band signals) was reduced discernibly (at least 25% lower than baseline breathing) for at least 10 seconds, did not meet the criteria for apnea and the event was associated with either a 3% oxygen desaturation from baseline or terminated with electroencephalographic evidence of an arousal. For 4% only, hypopneas were identified if the aforementioned reduction in flow or volume occurred and the event was associated with a 4% oxygen desaturation from baseline. In both cases, an apnea was defined as a complete or almost complete cessation of airflow, as measured by the amplitude of the thermocouple signal, lasting at least 10 seconds.
Statistical Analyses
Mean and standard deviation were used to provide an overall description of the data used in the analyses. For both definitions of the AHI, each participant’s AHI was assigned to one of 4 OSA severity categories: normal (AHI < 5 events/h), mild (AHI 5 to ≤ 15 events/h), moderate (AHI 15 to ≤ 30 events/h) and severe (AHI ≥ 30 events/h). Analysis of variance was used for each variable to assess for differences among the OSA severity categories.
Three definitions of hypertension were used in these analyses. For each definition, the threshold for classifying a participant as hypertensive used the new ACC/AHA guidelines.7 However, participants with blood pressures exceeding the minimum threshold as well as those who were taking antihypertensive medications also were classified as hypertensive. Thus, the following definitions were used:
Elevated or higher blood pressure: > 120 mmHg systolic and < 80 mmHg diastolic or use of antihypertensive medications
Stage 1 or 2 hypertension: > 130 mmHg systolic or > 80 mmHg diastolic or use of antihypertensive medications
Stage 2 hypertension: > 140 mmHg systolic or > 90 mmHg diastolic or use of antihypertensive medications
For each definition of hypertension, the association between AHI severity and the presence of hypertension was modeled using logistic regression. Four progressively complex models were constructed: unadjusted, adjusted for demographic variables (age, ethnicity, and sex), adjusted for demographic variables plus body mass index (BMI, kg/m2) and adjusted for demographics, BMI and smoking status. Two sensitivity analyses were performed. In the first, antihypertensive medications were omitted from the aforementioned definitions. In the second, for elevated blood pressure, models were constructed in which hypertensive cases were limited only to those with blood pressure > 120 mmHg systolic and < 80 mmHg diastolic.
Multiple linear regression was used to determine the relationship between systolic and diastolic BP and AHI controlling for age, sex, ethnicity, smoking and BMI. Inasmuch as the distribution of AHI is heavily skewed leftward and some values are 0, AHI was transformed using the natural log + 0.1 in these analyses.
Analyses were performed using IBM SPSS Statistics version 25 (Armonk, New York). P < .05 was considered statistically significant.
RESULTS
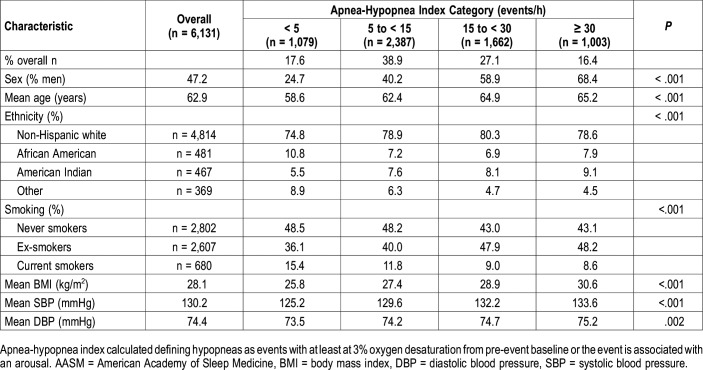
The demographic and anthropometric characteristics of the SHHS cohort, overall and stratified by the 3%A definition of AHI, are shown in Table 1. With greater AHI severity, there is an increase in the prevalence of men, age, BMI, blood pressure and American Indian ethnicity. In contrast, the prevalence of African Americans and other ethnicities (primarily Hispanic and Asian) declined. The percentage of Non-Hispanic whites increased at the AHI 5 to < 15 category and was stable thereafter. Current smoking declined with increasing AHI. Of particular note is that the greatest number of participants was in the AHI 5 to < 15 category which represents mild OSA.
Table 1.
Study population demographic and anthropometric characteristics stratified by apnea-hypopnea index (current AASM-recommended hypopnea definition).
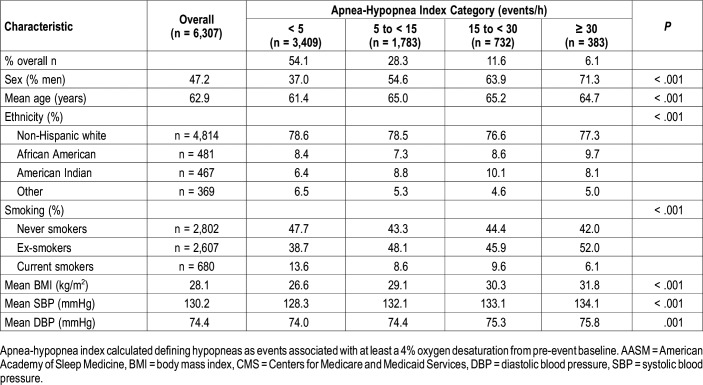
Table 2 depicts the overall demographic and anthropometric characteristics of the SHHS cohort stratified using the 4% only definition for hypopnea. The findings are similar to those in Table 1 except that the greatest number of participants is now in the AHI < 5 category, and the percentage of African Americans and American Indians increased in the higher AHI categories. Additionally, the prevalence of Non-Hispanic whites remained stable across AHI categories.
Table 2.
Study population demographic and anthropometric characteristics stratified by apnea-hypopnea index (acceptable AASM/CMS hypopnea definition).
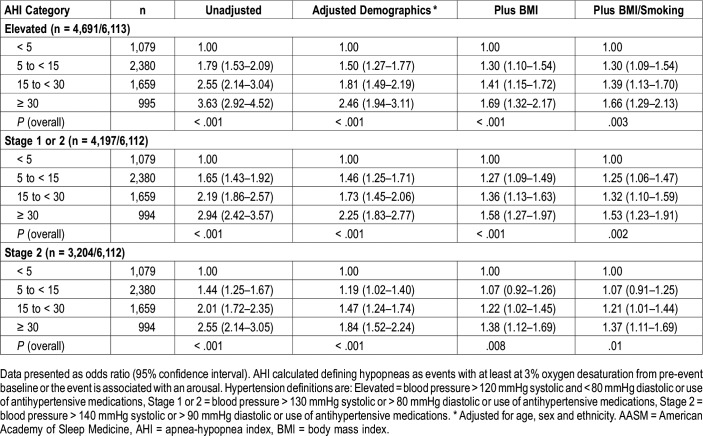
Adjusted odds ratios (OR) and their 95% confidence intervals (CI) for the association between AHI using the 3%A hypopnea definition and three definitions of hypertension are shown in Table 3. Irrespective of the definition of hypertension used, the association between hypertension and AHI became stronger as the severity of OSA increased. Adjustment for demographic characteristics and BMI, but not smoking attenuated, but did not eliminate this relationship.
Table 3.
Adjusted odds ratios and 95% confidence intervals of hypertension definitions stratified by AHI severity categories (current AASM-recommended hypopnea definition).
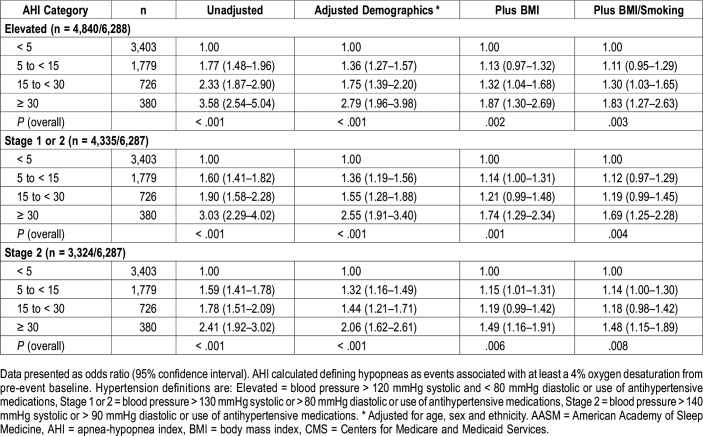
In Table 4 are the OR and 95% CI for the association between AHI using the 4% only hypopnea definition and three definitions of hypertension. Similar to the data shown in Table 3, the association with hypertension increased with greater severity of AHI with all three definitions of hypertension. The strength of these associations appeared similar to that observed in Table 3 using the 3%A definition of hypopnea.
Table 4.
Adjusted odds ratios and 95% confidence intervals of hypertension definitions stratified by AHI severity categories (acceptable AASM/CMS hypopnea definition).
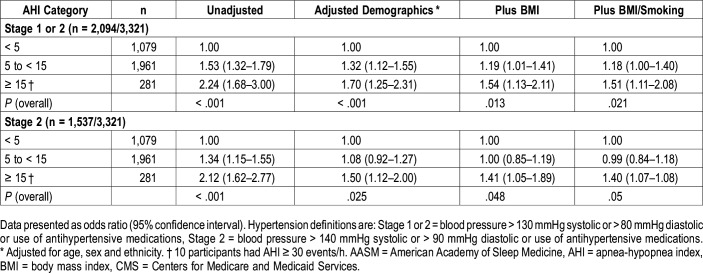
Table 5 shows the association between severity of AHI and hypertension in those participants who were identified as having OSA using the 3%A hypopnea definition, but not the 4% only definition. Because there were only 10 participants with an AHI ≥ 30 events/h, this category was combined with the AHI 15 to < 30 category. Of particular note are the 281 participants with an AHI ≥ 15 events/h (moderate to severe OSA) who did not have OSA using the 4% only definition. For the elevated blood pressure and stage 1 hypertension definitions of hypertension, both AHI 5 to < 15 and AHI ≥ 15 events/h were associated with a greater likelihood of hypertension with higher risk assigned to AHI ≥ 15 events/h in both unadjusted and adjusted models. For stage 2 hypertension, AHI 5 to < 15 events/h was not associated with risk of hypertension in adjusted models. However, increased risk was observed with AHI ≥ 15 events/h.
Table 5.
Adjusted odds ratios and 95% confidence intervals of hypertension definitions stratified by AHI severity categories using the current AASM-recommended hypopnea definition for participants without OSA using the acceptable AASM/CMS hypopnea definition.
In sensitivity analyses, removal of cases defined only by use of antihypertensive medications did not substantially alter the relationships between OSA severity and hypertension. Similarly, limiting cases in models of elevated blood pressure to only those who met the blood pressure criteria did not change these findings.
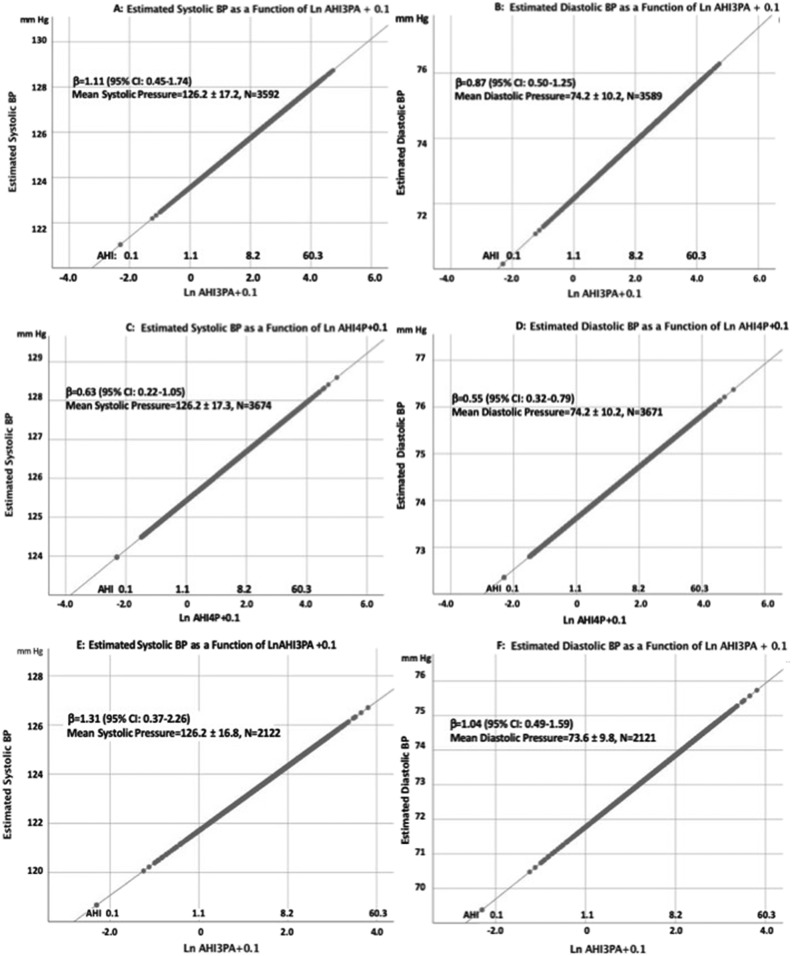
Linear regression analyses of systolic and diastolic blood pressure in participants not using antihypertensive medications are shown in Table 6 with graphic representations shown in Figure 1. Using either the 3%A definition or the 4% only of hypopnea, there was a significant association between systolic or diastolic blood pressure and the natural log of AHI in models including BMI, age, sex, ethnicity and smoking. When analyses were limited only to those who had an AHI ≥ 5 events/h using 3%A definition of hypopnea, but AHI < 5 events/h using the 4% only definition, the association between systolic or diastolic blood pressure and natural log of AHI persisted.
Table 6.
Linear regression analyses of systolic and diastolic blood pressure in participants not using antihypertensive medications.
Figure 1. Graphic representations of the association of LnAHI + 0.1 and either systolic or diastolic blood pressure for each of the models shown in Table 6.
Values for BMI, sex, smoking, race/ethnicity and age were fixed at their respective means in order to generate an illustrative 2-dimensional plot. The values for LnAHI + 0.1 were converted to the AHI and shown as an alternative x-axis to facilitate visualization. (A) Estimated systolic blood pressure as a function of Ln AHI defined by a 3% desaturation or arousal for hypopneas. (B) Estimated diastolic blood pressure as a function of Ln AHI defined by a 3% desaturation or arousal for hypopneas. (C) Estimated systolic blood pressure as a function of Ln AHI defined by a 4% desaturation for hypopneas. (D) Estimated diastolic blood pressure as a function of Ln AHI defined by a 4% desaturation for hypopneas. (E) Estimated systolic blood pressure as a function of Ln AHI defined by a 3% desaturation or arousal for hypopneas in participants who had an AHI < 5 events/h using an AHI definition defined by a 4% desaturation for hypopneas. (F) Estimated diastolic blood pressure as a function of Ln AHI defined by a 3% desaturation or arousal for hypopneas in participants who had an AHI < 5 events/h using an AHI definition defined by a 4% desaturation for hypopneas.
DISCUSSION
In this large community-based study, we demonstrated that OSA defined by apneas and hypopneas characterized by 3% desaturation events or arousals is associated with significantly increased odds of prevalent hypertension. The elevated odds seen in the middle aged and older adults with OSA, thus defined, persisted for both older and new definitions of hypertension. Remarkably, the strength of associations using the 3%A definition of hypopnea appeared similar to those observed with the 4% only definition, further reinforcing the clinical relevance of the former. This suggests that the regulatory requirement by the CMS in the United States of using a 4% desaturation definition denies a substantial proportion of people with OSA who are at a meaningfully elevated risk of hypertension a chance at appropriate therapy.
OSA is associated with assorted adverse health-related outcomes, including diverse cardiovascular disorders.14 Several studies have now established an association between OSA and hypertension.2 Initially, analyses from the Wisconsin Sleep Cohort Study found elevated odds of prevalent and incident hypertension with increasing severity of OSA.15,16 Confirmatory results from the SHHS demonstrated a higher prevalence of hypertension in those with OSA.17 Although there appeared to increased risk of developing hypertension in longitudinal analyses in persons with OSA in SHHS, it was attenuated after controlling for BMI and no longer statistically significant.11,16 Nevertheless, further support for the robust association between these conditions is provided from other large population based cohorts as well as intervention studies demonstrating an improvement in blood pressure with therapy for OSA.4–6 Both CPAP and mandibular advancement devices may produce a similar reduction in the blood pressure,6 and the magnitude of the reduction in blood pressure may be greater in those with refractory hypertension than those with nonrefractory hypertension.5 Our analyses extend these previous findings by demonstrating an association between OSA and hypertension as defined by recent criteria irrespective of whether the 4% only or 3%A definition of hypopnea is used.
Hitherto, most studies of the association between OSA and hypertension have employed a minimum 4% desaturation criterion to identify hypopneas for the purpose of calculating the AHI.18 More recently, a 3% desaturation criterion also has been used.19,20 However, the impact of using a more inclusive hypopnea definition consisting of a minimum 3% desaturation or arousal (ie, 3%A) as recommended by the AASM has not been thoroughly explored previously. The current study confirms that the 3%A definition is associated with hypertension using both previous and newer definitions of hypertension. Importantly, in the current study, only 17.7% of the participants had moderate to severe sleep apnea using the CMS definition compared to 43.5% using the AASM definition. Therefore, reliance on a more rigorous definition of hypopnea requiring a 4% or greater desaturation in clinical practice will inevitably lead to under-recognition of a significant proportion of patients with OSA. This will potentially deprive some of them the opportunity to have a reversible etiologic factor causing their hypertension treated. Our finding that 1,242 participants, including 281 with moderate to severe OSA were not identified using the 4% only criteria emphasizes this omission.
There is increasing evidence that intermittent hypoxemia plays an important pathophysiology role in linkage between OSA and hypertension. Some,21,22 but not all23,24 studies have demonstrated that administration of supplemental oxygen can mitigate the blood pressure elevation associated with OSA. Intermittent hypoxemia-reoxygenation can result in inflammation, endothelial dysfunction and activation of the sympathetic nervous system. The damage to the vascular endothelium is associated with imbalance between vasoconstrictors and vasodilators, anomalous cell proliferation, and increased coagulability.25
In contrast, whether or not to include arousals in the definition of OSA has been a matter of protracted debate.26 The controversy stems from an absence of large well conducted trials demonstrating an association between arousals with adverse outcomes such as hypertension. Furthermore, the role of arousals in OSA pathology is not entirely clear. Arousals may precede or follow the upper airway opening after apneic events, and have been suggested by some to even be coincidental.27 Finally, a relatively lower interscorer reliability for arousals has also been mentioned as a reason to exclude arousals from diagnosis of sleep apnea, but the reliability between experienced scorers appears to be relatively high.26 From a physiological perspective, the association of arousals with hypertension seems intuitive. The arousals involve an increase in the sympathetic activity and a decrease in the parasympathetic activity.28 Arousals have been shown in small studies to be associated with a spike in blood pressure during sleep and daytime hypertension even in persons without sleep apnea.29,30 The increase in blood pressure with apneic events in persons with sleep apnea may also depend on the degree of arousal.31,32 Analyses from Cleveland Family Study demonstrated a 22% increase in the odds of hypertension with each 5-unit increase in the number of arousals per hour.33 In fact, in adjusted analyses, arousal index was the only significant predictor of hypertension. The current study incorporates a large number of participants to provide robust evidence that a definition of OSA including cortical arousals significantly increases the odds of associated hypertension. In conjunction with the data revealing the impact of arousals on increasing sleepiness in patients with OSA34 and other adverse consequences,26 this now makes a compelling argument for this more inclusive definition to be adopted for consideration of therapy.
The current study attempts to overcome several of the limitations of the existing literature evaluating the relationship between OSA and hypertension. The large size of the database diminishes the probability of Type I or Type II error. The study participants were derived from the community, hence obviating referral bias. The associations were controlled for multiple confounders including age, BMI and smoking, attesting to an independent association between SDB and hypertension. However, residual confounding and selection bias in participants derived from different parent cohorts cannot be excluded. The study utilized polysomnograms, the gold standard test for measuring sleep disordered breathing. Finally, the large database permitted analyses utilizing diverse definitions of hypertension, including the most recent hypertension classifications per the AHA guidelines.
While the study provides strong evidence for the relationship between OSA and prevalent hypertension, the cross-sectional nature of the study prevents drawing any conclusions regarding causal association between hypopneas associated with lower degrees of desaturation or arousals, and hypertension. Assessment of a longitudinal association between such hypopneas and incident hypertension would help corroborate such an inference. We also recognize that the polysomnography montage in SHHS did not include nasal pressure monitoring. Thus, it is likely that some participants classified as having an AHI < 5 events/h may have had OSA. However, this does not mitigate our conclusions because of the “dose relationship” association between OSA severity and hypertension, and that such cases would have been considered as not having OSA with the 4% only criteria. Furthermore, the participants in the study were middle aged and older and the findings may not be generalizable to younger persons with OSA. Measurement of blood pressure was performed only in the evening. Inasmuch as there is a normal decline of blood pressure at night, ascertainment over a 24 hour period might have resulted in a more precise assessment of the association between OSA severity and hypertension. Finally, the pathogenesis of hypertension may involve a complex and multifactorial process. It is possible that other factors not assessed in the study including diet and exercise may contribute to the increased odds of hypertension seen in those with OSA.
In summary, this large cross sectional study provides robust support for an association between OSA defined by a more inclusive definition than previously utilized in several other studies and CMS, and hypertension. Specifically, the odds of the presence of hypertension, regardless of how it was defined, were higher in those with 3% desaturation events or arousals, even in absence of more severe desaturation. Contemplating the morbidity associated with hypertension, universal adoption of a less restrictive definition of OSA appears to be a prudent step toward ensuring appropriate diagnosis and adequate therapy, thus mitigating associated adverse outcomes and higher health care costs.
DISCLOSURE STATEMENT
All authors have read and approve this manuscript. Dr. Budhiraja reports no conflicts of interest or grant funding. Dr. Quan reports research funding from the National Institutes of Health, serves as a consultant to Jazz Pharmaceuticals and is a vice committee chair for the American Academy of Sleep Medicine. Dr. Javaheri serves as a consultant for Jazz Pharmaceuticals. Dr. Berry reports research funding from Philips Respironics, Res Med and the University of Florida Foundation. Dr. Parthasarathy reports grants from NIH/NHLBI as PI (HL138377, HL126140; IPA-014264-00001; HL095799) or site PI (HL128954; UG3HL140144), grants from Patient Centered Outcomes Research Institute as PI (IHS-1306-02505; EAIN-3394-UOA) or site-investigator (PCS-1504-30430), grants from US Department of Defense as co-investigator (W81XWH-14-1-0570), grants from NIH/NCI as co-investigator (R21CA184920) and NIH/NIMHD as co-investigator (MD011600), grants from Johrei Institute, personal fees from American Academy of Sleep Medicine, non-financial support from National Center for Sleep Disorders Research of the NIH (NHLBI), personal fees from UpToDate Inc., grants from Younes Sleep Technologies, Ltd., personal fees from Vapotherm, Inc., personal fees from Merck, Inc., grants from Philips-Respironics, Inc., personal fees from Philips-Respironics, Inc., personal fees from Bayer, Inc., personal fees from Nightbalance, Inc, personal fees from Merck, Inc, grants from American Academy of Sleep Medicine Foundation (169-SR-17); In addition, Dr. Parthasarathy has a patent UA 14-018 U.S.S.N. 61/884,654; PTAS 502570970 (Home breathing device) issued.
ACKNOWLEDGMENTS
SHHS acknowledges the Atherosclerosis Risk in Communities Study, the Cardiovascular Health Study, the Framingham Heart Study, the Cornell/Mt. Sinai Worksite and Hypertension Studies, the Strong Heart Study, the Tucson Epidemiologic Study of Airways Obstructive Diseases (TESAOD), and the Tucson Health and Environment Study for allowing their cohort members to be part of the SHHS and for sharing such data for the purposes of this study. SHHS is particularly grateful to the members of these cohorts who agreed to participate in SHHS as well. SHHS further recognizes all the investigators and staff who have contributed to its success. A list of SHHS investigators, staff, and their participating institutions is available on the SHHS website (www.jhsph.edu/shhs).
The opinions expressed in this paper are those of the authors and do not necessarily reflect the views of the Indian Health Service.
This work was supported by National Heart, Lung and Blood Institute cooperative agreements U01HL53940 (University of Washington), U01HL53941 (Boston University), U01HL53938 (University of Arizona), U01HL53916 (University of California, Davis), U01HL53934 (University of Minnesota), U01HL53931 (New York University), U01HL53937 and U01HL64360 (Johns Hopkins University), U01HL63463 (Case Western Reserve University), U01HL63429 (Missouri Breaks Research).
REFERENCES
- 1.Berry RB, Budhiraja R, Gottlieb DJ, et al. Rules for scoring respiratory events in sleep: update of the 2007 AASM Manual for the Scoring of Sleep and Associated Events. Deliberations of the Sleep Apnea Definitions Task Force of the American Academy of Sleep Medicine. J Clin Sleep Med. 2012;8(5):597–619. doi: 10.5664/jcsm.2172. [DOI] [PMC free article] [PubMed] [Google Scholar]
- 2.Budhiraja R, Sharief I, Quan SF. Sleep disordered breathing and hypertension. J Clin Sleep Med. 2005;1(4):401–404. [PubMed] [Google Scholar]
- 3.Marin JM, Agusti A, Villar I, et al. Association between treated and untreated obstructive sleep apnea and risk of hypertension. JAMA. 2012;307(20):2169–2176. doi: 10.1001/jama.2012.3418. [DOI] [PMC free article] [PubMed] [Google Scholar]
- 4.Fava C, Dorigoni S, Dalle Vedove F, et al. Effect of CPAP on blood pressure in patients with OSA/hypopnea a systematic review and meta-analysis. Chest. 2014;145(4):762–771. doi: 10.1378/chest.13-1115. [DOI] [PubMed] [Google Scholar]
- 5.Iftikhar IH, Valentine CW, Bittencourt LR, et al. Effects of continuous positive airway pressure on blood pressure in patients with resistant hypertension and obstructive sleep apnea: a meta-analysis. J Hypertens. 2014;32(12):2341–2350. doi: 10.1097/HJH.0000000000000372. [DOI] [PMC free article] [PubMed] [Google Scholar]
- 6.Bratton DJ, Gaisl T, Wons AM, Kohler M. CPAP vs mandibular advancement devices and blood pressure in patients with obstructive sleep apnea: a systematic review and meta-analysis. JAMA. 2015;314(21):2280–2293. doi: 10.1001/jama.2015.16303. [DOI] [PubMed] [Google Scholar]
- 7.Whelton PK, Carey RM, Aronow WS, et al. 2017 ACC/AHA/AAPA/ABC/ACPM/AGS/APhA/ASH/ASPC/NMA/PCNA guideline for the prevention, detection, evaluation, and management of high blood pressure in adults: a report of the American College of Cardiology/American Heart Association Task Force on Clinical Practice Guidelines. Hypertension. 2018;71(6):e13–e115. doi: 10.1161/HYP.0000000000000065. [DOI] [PubMed] [Google Scholar]
- 8.Quan SF, Howard BV, Iber C, et al. The Sleep Heart Health Study: design, rationale, and methods. Sleep. 1997;20(12):1077–1085. [PubMed] [Google Scholar]
- 9.Lind BK, Goodwin JL, Hill JG, Ali T, Redline S, Quan SF. Recruitment of healthy adults into a study of overnight sleep monitoring in the home: experience of the Sleep Heart Health Study. Sleep Breath. 2003;7(1):13–24. doi: 10.1007/s11325-003-0013-z. [DOI] [PubMed] [Google Scholar]
- 10.Redline S, Sanders MH, Lind BK, et al. Methods for obtaining and analyzing unattended polysomnography data for a multicenter study. Sleep Heart Health Research Group. Sleep. 1998;21(7):759–767. [PubMed] [Google Scholar]
- 11.O’Connor GT, Caffo B, Newman AB, et al. Prospective study of sleep-disordered breathing and hypertension: the Sleep Heart Health Study. Am J Respir Crit Care Med. 2009;179(12):1159–1164. doi: 10.1164/rccm.200712-1809OC. [DOI] [PMC free article] [PubMed] [Google Scholar]
- 12.Whitney CW, Gottlieb DJ, Redline S, et al. Reliability of scoring respiratory disturbance indices and sleep staging. Sleep. 1998;21(7):749–757. doi: 10.1093/sleep/21.7.749. [DOI] [PubMed] [Google Scholar]
- 13.Rechtschaffen A, Kales A. A Manual for Standardized Terminology, Techniques and Scoring System for Sleep Stages in Human Subjects. Los Angeles, CA: University of California, Los Angeles, Brain Information Service, NINDB Neurological Information Network; 1968. [Google Scholar]
- 14.Javaheri S, Barbe F, Campos-Rodriguez F, et al. Sleep apnea: types, mechanisms, and clinical cardiovascular consequences. J Am Coll Cardiol. 2017;69(7):841–858. doi: 10.1016/j.jacc.2016.11.069. [DOI] [PMC free article] [PubMed] [Google Scholar]
- 15.Peppard PE, Young T, Palta M, Skatrud J. Prospective study of the association between sleep-disordered breathing and hypertension. N Engl J Med. 2000;342(19):1378–1384. doi: 10.1056/NEJM200005113421901. [DOI] [PubMed] [Google Scholar]
- 16.Peppard PE. Is obstructive sleep apnea a risk factor for hypertension?–differences between the Wisconsin Sleep Cohort and the Sleep Heart Health Study. J Clin Sleep Med. 2009;5(5):404–405. [PMC free article] [PubMed] [Google Scholar]
- 17.Nieto FJ, Young TB, Lind BK, et al. Association of sleep-disordered breathing, sleep apnea, and hypertension in a large community-based study. Sleep Heart Health Study. JAMA. 2000;283(14):1829–1836. doi: 10.1001/jama.283.14.1829. [DOI] [PubMed] [Google Scholar]
- 18.Hirotsu C, Haba-Rubio J, Andries D, et al. Effect of three hypopnea scoring criteria on OSA prevalence and associated comorbidities in the general population. J Clin Sleep Med. 2019;15(02):183–194. doi: 10.5664/jcsm.7612. [DOI] [PMC free article] [PubMed] [Google Scholar]
- 19.Redline S, Sotres-Alvarez D, Loredo J, et al. Sleep-disordered breathing in Hispanic/Latino individuals of diverse backgrounds. The Hispanic Community Health Study/Study of Latinos. Am J Respir Crit Care Med. 2014;189(3):335–344. doi: 10.1164/rccm.201309-1735OC. [DOI] [PMC free article] [PubMed] [Google Scholar]
- 20.Guillot M, Sforza E, Achour-Crawford E, et al. Association between severe obstructive sleep apnea and incident arterial hypertension in the older people population. Sleep Med. 2013;14(9):838–842. doi: 10.1016/j.sleep.2013.05.002. [DOI] [PubMed] [Google Scholar]
- 21.Turnbull CD, Sen D, Kohler M, Petousi N, Stradling JR. Effect of supplemental oxygen on blood pressure in obstructive sleep apnea (SOX). A randomized continuous positive airway pressure withdrawal trial. Am J Respir Crit Care Med. 2019;199(2):211–219. doi: 10.1164/rccm.201802-0240OC. [DOI] [PMC free article] [PubMed] [Google Scholar]
- 22.Sands SA, Edwards BA, Terrill PI, et al. Identifying obstructive sleep apnoea patients responsive to supplemental oxygen therapy. Eur Respir J. 2018;52(3):1800674. doi: 10.1183/13993003.00674-2018. [DOI] [PMC free article] [PubMed] [Google Scholar]
- 23.Gottlieb DJ, Punjabi NM, Mehra R, et al. CPAP versus oxygen in obstructive sleep apnea. N Engl J Med. 2014;370(24):2276–2285. doi: 10.1056/NEJMoa1306766. [DOI] [PMC free article] [PubMed] [Google Scholar]
- 24.Norman D, Loredo JS, Nelesen RA, et al. Effects of continuous positive airway pressure versus supplemental oxygen on 24-hour ambulatory blood pressure. Hypertension. 2006;47(5):840–845. doi: 10.1161/01.HYP.0000217128.41284.78. [DOI] [PubMed] [Google Scholar]
- 25.Budhiraja R, Parthasarathy S, Quan SF. Endothelial dysfunction in obstructive sleep apnea. J Clin Sleep Med. 2007;3(4):409–415. [PMC free article] [PubMed] [Google Scholar]
- 26.Bonnet MH, Doghramji K, Roehrs T, et al. The scoring of arousal in sleep: reliability, validity, and alternatives. J Clin Sleep Med. 2007;3(2):133–145. [PubMed] [Google Scholar]
- 27.Eckert DJ, Younes MK. Arousal from sleep: implications for obstructive sleep apnea pathogenesis and treatment. J Appl Physiol. 2014;116(3):302–313. doi: 10.1152/japplphysiol.00649.2013. [DOI] [PubMed] [Google Scholar]
- 28.Horner RL, Brooks D, Kozar LF, Tse S, Phillipson EA. Immediate effects of arousal from sleep on cardiac autonomic outflow in the absence of breathing in dogs. J Appl Physiol. 1995;79(1):151–162. doi: 10.1152/jappl.1995.79.1.151. [DOI] [PubMed] [Google Scholar]
- 29.Garcia CE, Drager LF, Krieger EM, et al. Arousals are frequent and associated with exacerbated blood pressure response in patients with primary hypertension. Am J Hypertens. 2013;26(5):617–623. doi: 10.1093/ajh/hps065. [DOI] [PubMed] [Google Scholar]
- 30.Lofaso F, Coste A, Gilain L, Harf A, Guilleminault C, Goldenberg F. Sleep fragmentation as a risk factor for hypertension in middle-aged nonapneic snorers. Chest. 1996;109(4):896–900. doi: 10.1378/chest.109.4.896. [DOI] [PubMed] [Google Scholar]
- 31.Yoon IY, Jeong DU. Degree of arousal is most correlated with blood pressure reactivity during sleep in obstructive sleep apnea. J Korean Med Sci. 2001;16(6):707–711. doi: 10.3346/jkms.2001.16.6.707. [DOI] [PMC free article] [PubMed] [Google Scholar]
- 32.Nisbet LC, Yiallourou SR, Nixon GM, et al. Characterization of the acute pulse transit time response to obstructive apneas and hypopneas in preschool children with sleep-disordered breathing. Sleep Med. 2013;14(11):1123–1131. doi: 10.1016/j.sleep.2013.06.010. [DOI] [PubMed] [Google Scholar]
- 33.Sulit L, Storfer-Isser A, Kirchner HL, Redline S. Differences in polysomnography predictors for hypertension and impaired glucose tolerance. Sleep. 2006;29(6):777–783. doi: 10.1093/sleep/29.6.777. [DOI] [PubMed] [Google Scholar]
- 34.Roehrs T, Zorick F, Wittig R, Conway W, Roth T. Predictors of objective level of daytime sleepiness in patients with sleep-related breathing disorders. Chest. 1989;95(6):1202–1206. doi: 10.1378/chest.95.6.1202. [DOI] [PubMed] [Google Scholar]


