Abstract
Abstract. Objectives: The vasculature of tumours imposes certain barriers that transport of anti‐cancer drugs must overcome. Here follows an account of development of a general computational model that describes the mechanisms of drug transport to a solid tumour, with an emphasis on modelling the vasculature using solute transport concepts. Materials and methods: Investigation into the biological parameters that enhance/prevent anticancer drug transport to the tumour provides a means to evaluate the effects of these parameters on the treatment process. Sensitivity analysis of these provides useful insights concerning anticancer drug transport mechanisms from the vasculature to the solid tumour for a non‐specified drug and non‐specified solid tumour by revealing the conditions that promote or prevent effective drug transport. The effect of the vasculature on transport efficiency is studied using a parametric analysis of some of the transport and biological parameters. Understanding the various transport mechanisms provides a basis to evaluate the effectiveness of the drug treatment a priori. Results: It was found that increases in the capillary hydrostatic pressure, diffusive permeability coefficient and hydraulic conductivity all result in a decrease in tumour size. Similarly, decreases in the interstitium hydrostatic pressure and filtration constant result in a decrease in tumour size. Dependence of the change in the tumour size to changes in these parameters is non‐linear. These results demonstrate the potential of the integrated computational model of the tumour and its vasculature to estimate efficacy of a particular treatment process. Regardless of the dependency of the outcome on the assumed model parameters and the assumed kinetics, mathematical models of this type can provide more explanation on the issues related to the transport barriers, the efficacy of the treatment, and the development of effective anticancer drugs. A case study also is presented to demonstrate the model's flexibility to accommodate a two‐cell‐glioma population.
INTRODUCTION
Cancer is one of the leading causes of death in humans in both developed and developing countries (Jain 1997). Remarkable advances in cancer research in the past few decades have enabled early diagnoses of various cancers and more effective anticancer drugs and novel treatment therapies have been developed. A complete understanding of the nature of the origin of malignancy is yet to be realized, due largely to the complex nature of tumour formation and the unpredictable functionality of a tumour in the human body.
Proliferation status of tumour cells differs amongst different tumour types and even between individuals who suffer from the same tumour type (Folkman 2001). Such variations pose problems in generalization of factors that affect effective transport of anticancer drugs to the tumour (Jain 1987a). Development of effective drug delivery mechanisms requires a thorough understanding of:
-
•
formation of the tumour,
-
•
biological structure of the tumour,
-
•
functionality of the tumour at various stages of its development and
-
•
physiological barriers to the drug delivery mechanism caused by the tumour. Thus, for effective drug delivery to the cancer cells, anticancer therapeutics must overcome both physiological and biological barriers imposed by the tumour vasculature and tumour tissue itself 1987a, 1987b).
Because drug transport within tumour as well as drug and cell kinetics play important roles on effective drug treatment, numerous research studies have been carried out, experimental, theoretical and numerical, to visualize these dynamics within the neoplasm. In Norris et al. (2006) discussed importance of the knowledge of cell and drug kinetics within tumours and also the dependency of cell death rate on local drug concentrations. However, their work did not focus on specific barriers that anticancer drugs may encounter.
Mallet and De Pillis (2006) developed a model to describe interactions between a growing tumour next to a nutrient source and the immune system of the host organism. While this work provided insights concerning tumour growth it provided nothing about the fate of a drug present within the tumour vasculature. A similar study was performed by De Pillis and Radunskaya (2006) where the focus was confined to drug and cell kinetics within the tumour. However, it is also necessary to investigate the fate of a particular drug when administrated via host blood stream because tumour vasculature plays a critical role in transportation of drugs across the tumour boundary. Jang et al. (2003) and Au et al. (2001) suggested that better understanding of barriers that affect such transport may play a significant role in the development of new cancer therapeutic strategies. Such studies have motivated our research to develop improved knowledge that includes the tumour vasculature.
When blood‐borne molecules or particles enter tumour vasculature, they reach the malignant cells by distribution through the vascular compartment, transport across microvascular walls and into the interstitial compartment. Mechanisms involve convection and diffusion, and/or a combination of both. While the presence of a concentration gradient causes diffusion‐based transport, pressure gradients lead to convective fluid transport where the solute is carried away by solvent drag. It is known that the tumour vasculature poses a barrier to optimum drug transport to the tumour interstitium. Physiological configuration (that is, size and shape) and the biological structure of tumour and its vasculature also play major roles in drug transport outcome. (Jain 1987a; Brown et al. 2001; Venturoli & Rippe 2001; Pluen et al. 2002). Factors such as permeability and porosity of the diffusional media (the composition of capillary wall, interstitium, tumours), and local pressures can significantly influence transport mechanisms (Jain 1994) resulting in non‐optimal drug transport. Changes in cell population are reflected in the size of the tumour, which has a pronounced effect on drug uptake. Change in tumour size can generally be used as a measure of efficacy of a treatment regime.
Tumour growth models developed by Cui & Friedman (2004) assume that the tumour cells acquire velocity of change due to pressure changes within the tissue as result of expansion or contraction of the tumour. Cristini et al. (2003) followed with a similar approach to track tumour boundaries by relating its movement to the internal pressures, which can be a function of surface tension and tumour curvature. Macklin & Lowengrub (2006) used tumour curvature to estimate the tumour change velocity. D’Onofrio & Gandolfi (2004) suggested that tumour growth is strictly controlled by evolution of the vasculature network that supplies nutrients and oxygen to the tumour cells, and the model proposed by Greenspan (1972) used mass conservation principles to obtain its volume at a given time.
In this study, a general computational model has been developed to investigate transport mechanisms of anticancer drugs to solid tumours using solute transport concepts; specifically, transport mechanisms from a capillary to the interstitium and to the tumour itself. The proposed model will emphasize transport mechanisms in general (non‐drug treatment specific, non‐cyclic specific and non‐tumour specific). Transport mechanisms depend on the diffusivity of a drug within different media, permeability of vessel geometry, compartment pressures and concentration of the anticancer drug. Effects of these factors on drug transport are investigated. Additionally, changing tumour boundary due to changes in the cell population is addressed by the model. Because the model developed in this study assumes a stationary cell population, individual cell movements are assumed to be negligible. Thus, changes in the tumour are due only to the change in cell population status. The moving boundary is located using the same approach as Greenspan model (Greenspan 1972). A case study is introduced to demonstrate the potential of the model to predict the effectiveness of an anticancer drug.
MODEL FORMULATION
Problem description
This model describes tumour cell population growth in the presence of an anticancer drug. This growth is assumed to follow exponential parameters and anticancer drug and cell interaction is assumed to follow second‐order kinetics. As shown in Fig. 1, the shape of the tumour is assumed to be spherical surrounded by interstitium and the capillary bed, respectively.
Figure 1.
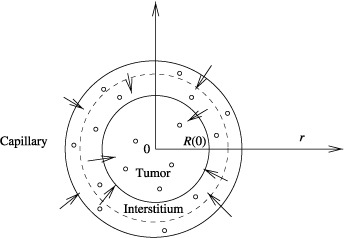
Schematic of solute transfer to a solid tumour.
The following assumptions are made:
-
1
Tumour histology is ubiquitously homogeneous.
-
2
Symmetry about the centre of the tumour is spherical.
-
3
Convective transport exists within the capillaries and the interstitium. In general, diffusion‐based drug transport also exists in the interstitium. However, with the assumption of relatively smaller size of interstitium as compared to size of the tumour, diffusion‐based drug transport in the interstitium is negligible, which reduces the complexity of the model.
-
4
Diffusive transport exists from the interstitium to the tumour cell plasma‐membrane and inside the tumour.
-
5
Anticancer drug concentration within the interstitium and capillary compartments is homogeneous.
-
6
Average cell volume, which is estimated using the initial cell population, is assumed to be constant.
Anticancer drug transport in the interstitium and in the capillary bed are modelled using the principle of solute transport (Jain 1987a). Changes in tumour size, tracked by changes in tumour boundary due to changes in the cell population, are modelled using an approach first initiated by Greenspan (1972).
Computational model
Conservation of cell mass (mtC(r,t)) per unit volume of tumour, is found based on the difference between net generation of cell mass, and its loss by death or decay,
| (1) |
Accumulation of drug mass (St(r,t)) within a control volume is the difference between the diffusion rate to the control volume (from interstitium) and cell uptake rate,
| (2) |
where the subscripts t, if and c represent variables in the tumour, in the interstitium and in the capillary, respectively. The first and last terms on the right‐hand side of Equation 1 represent cell generation and local cell death due to activity of the anticancer drug, respectively. The reaction constant and drug diffusivity coefficients within the tumour are denoted by Kt and Dt, respectively. The first term on the left‐hand side of Equation 2 represents the diffusion rate of the drug into the tumour. The reader is referred to the nomenclature section and to Table 1 for all variable definitions.
Table 1.
Parameter notation and values
| Variable | Symbol | Value | Source |
|---|---|---|---|
| Drug diffusivity in the tumour | Dt | 7.7 × 10⁻² cm2/day | |
| Effectiveness factor | Y | 0.45 cell/µg/cm3 | |
| Growth rate | ρ | 0.0268/day | |
| Reaction rate | Kt | 5 × 10⁻⁴ cell/cm3 | |
| Interstitium filtration rate | Kif | 0.4/day | |
| Capillary filtration rate | Kc | 0.5/day | |
| Mass transfer coefficient | Km | 1.16 cm/day | |
| Capillary hydraulic conductivity | Lp | 0.119 cm/cm H2O | (Jain 1987a) |
| Capillary hydrostatic pressure | Pc | 34 cm H2O | (Klabunde 2004) |
| Interstitium hydrostatic pressure | Pif | 11.09 cm H2O | (Klabunde 2004) |
| Plasma osmotic pressure | Oc | 34 cm H2O | (Klabunde 2004) |
| Interstitium osmotic pressure | Oif | 6.8 cm H2O | (Klabunde 2004) |
| Osmotic reflection coefficient | σ | 0.5 | (Jain 1987a) |
| Coupling coefficient | σif | 0.29 | (Jain 1987a) |
| Capillary volume | Vc | 0.0029 cm3 | (Kellen 2002) |
| Interstitium volume | Vif | 3.0494 cm3 | (Kellen 2002) |
| Tumour volume | Vt | 4.186 cm3 | |
| Tumour surface area | At | 12.56 cm2 | |
| Initial tumour radius | rt | 1.0 cm | |
| Interstitium radius | rif | 1.2 cm | |
| Capillary radius | rc | 1.20016 cm | |
| Capillary surface area | Ac | 8.1004 cm2 | (Kellen 2002) |
| Interstitium surface area | Aif | 18.0954 cm2 | (Kellen 2002) |
| Capillary diffusive permeability | P | 1.43 × 10⁻⁴ (cm/day) | (Jain 1987a) |
| Drug strength during the administration | G(t) | 35 µg/cm3 | (Swanson et al. 2002) |
| Blood velocity in the capillary | u | 6.04 (cm/day) | (Berger et al. 1996) |
Initial conditions for tumour cell and drug distributions, respectively, are given by,
| Ct(r,0) = M(r) 0 ≤ r ≤ R(0) | (3) |
| St(r,0) = 0 0 ≤ r ≤ R(0) | (4) |
The boundary condition at the interstitium and tumour boundary is defined by the continuity of mass transfer. The assumed symmetrical geometry of the tumour imposes a zero concentration gradient at the centreline of the tumour for all t > 0,
| (5) |
| (6) |
Conservation of drug mass in the interstitium (Sif) for all t > 0 is given by the net amount of drug transported across the interstitium. That is, a balance between the amounts of drug transported from the capillary to the interstitium and the amount of the drug that diffuses to the tumour from the interstitium,
| (7) |
Conservation of drug mass in the capillary Sc for all t > 0 is given by the difference between rate at which the drug leaves the control volume (to the interstitium) and the filtered rate from the control volume.
| (8) |
The initial conditions are given by:
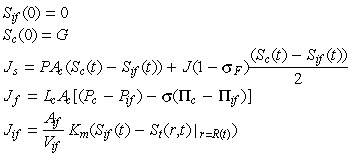 |
here Js represents the total solute transfer rate from capillary to interstitium. The first term in this equation indicates diffusive solute flux exchange, while the latter term represents solute transport due to convective fluid flow between the capillary and the interstitium. The variable Jf represents net fluid across the capillary wall which is modelled by implementing the Starling hypothesis (Gore 2005). The variable Jif represents solute transfer across the tumour/interstitium boundary, which is equivalent to mass transfer across the tumour/interstitium boundary. Concentration of the anticancer drug administrated is denoted by G.
A balance between tumour cell death and cell birth determines the size of the tumour at any given time. Rate of change in the tumour boundary is related to the rate of change in the tumour cell population, and is given by,
 |
(9) |
where the initial radius (R(0)) of the tumour is equal to unity and vo is the average cell volume. Note that a positive integrand means that tumour cell proliferation is greater than tumour cell death, which is overall growth in the size of the tumour. Negative integrand indicates a shrinking tumour.
Dimensionless model
Conversion to a fixed spatial domain
In time, changes in tumour boundary affect estimation of variables that are defined on a fixed spatial domain. To address this, the front fixing method of Crank (1994) has been applied to Equation 2 to accommodate the variability of the tumour boundary, while drug distribution is estimated at fixed nodal points. This ‘fixed spatial domain’ is achieved by normalizing the new tumour radius after each time increment. Accordingly, spatially varying variables are trans‐formed to match the new normalized coordinates. The following transformations are used:
 |
Applying the above variable transformation results in the following fixed domain expression for Equation 2
 |
(10) |
| (11) |
| (12) |
Conversion to dimensionless form
Conversion of the variables to dimensionless quantities provides a means to scale the variables against properly selected reference values thus, facilitating appropriate comparisons amongst different variables and among variables of different size. Dimensional variables are converted to dimensionless forms as follows: cell densities are made non‐dimensional using the initial cell density at the tumour boundary Cref = C(R(0),0); drug densities with the strength of the anticancer drug administrated G; pressures with capillary hydrostatic pressure Pc; and lengths with the radius of the tumour R(t). The characteristic time is given by R 2(0)/Dt.
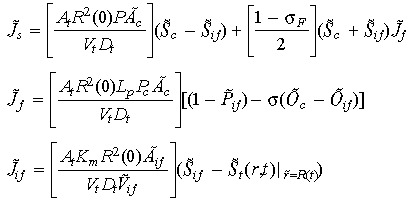
Applying these transforms to (1), (2), (7), (8), (9), gives the following dimensionless equations,
 |
(13) |
 |
(14) |
 |
(15) |
 |
(16) |
 |
(17) |
With
 |
Dimensionless initial and boundary conditions are given by,
| (18) |
| S̃t(r̃,0) = 0 | (19) |
 |
(20) |
 |
(21) |
| S̃if(0) = 0 | (22) |
| S̃c(0) = 1 | (23) |
MODEL RESULTS
Drug transport
Dimensionless (13), (14), (15), (16), (17), together with their initial and boundary conditions form a system of non‐linear partial differential equations that can be numerically solved using Galerkin's finite element method (Finlayson 1980). The convergence criterion used is an error on the order of 10−3. Parameter values used to find a solution are listed in Table 1.
Considering a drug treatment regimen of 1 day of chemotherapy followed by 21 days (equivalent to 1.69 units of dimension‐less time) without any chemotherapy. Such treatments are realistic because large continuous doses of anticancer drugs are lethal to not only the tumour cells but also to normal cells (Tracqui et al. 1995). Let the treatment regimen be carried out for five cycles.
Spatial and temporal cell distributions of the tumour cells are shown in Fig. 2. This graph shows a rapid decline in the number of tumour cells at the tumour/interstitium boundary (i.e. radial distance close to one) when compared to the number of cells near the tumour centre (i.e. radial distance close to zero). This difference is attributed to diffusion of a smaller amount of the anticancer drug towards the interior of the tumour initially. Figure 3, which shows the spatial and temporal drug distribution within the tumour, confirms the initial low amounts of the anticancer drug in the interior of the tumour.
Figure 2.
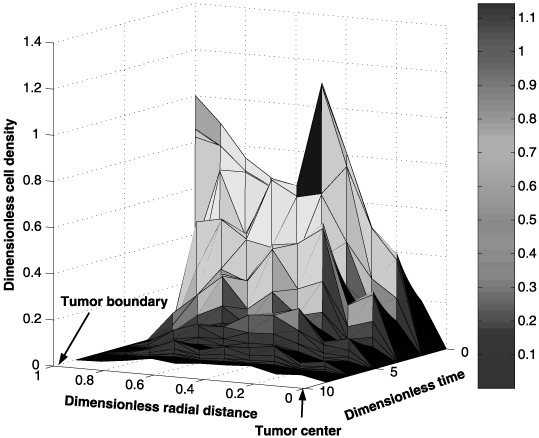
Spatial and temporal distribution of the tumour cells during a five‐cycle anticancer drug treatment.
Figure 3.
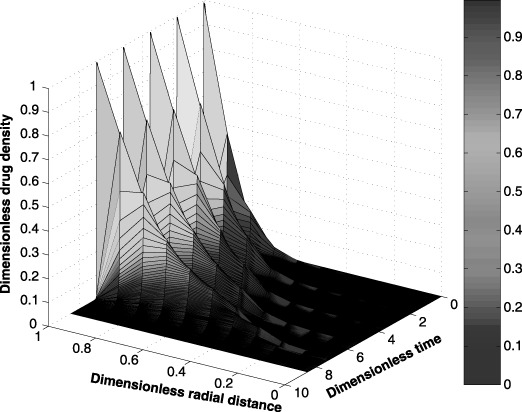
Spatial and temporal distribution of the anticancer drug within the tumour during a five‐cycle anticancer drug treatment.
Simulation results indicate (figures not shown) a periodic accumulation of the anticancer drug within the interstitium and capillary. This periodicity is not surprising due to the cyclic nature of the drug regimen. Furthermore, the concentration of the anticancer drug in the interstitium is less compared to the amount of anticancer drug within the capillary. These results confirm that less than the full dose of anticancer drug is transported to the tumour.
Changes in the tumour cell population affect the tumour size. Figure 4 shows the change in the tumour size over the five cycle treatment. The graph indicates significant reduction of the tumour size during the treatment period but an increase in size during the drug‐free period. Here, the decrease in the tumour radius during the drug administrated period is proportional to the rate at which the tumour cell population changes (i.e. balance between rates of the cell birth and cell death). During the drug‐free period, the tumour radius is increased at a rate proportional to the tumour cell birth rate. This pattern repeats for all five cycles.
Figure 4.
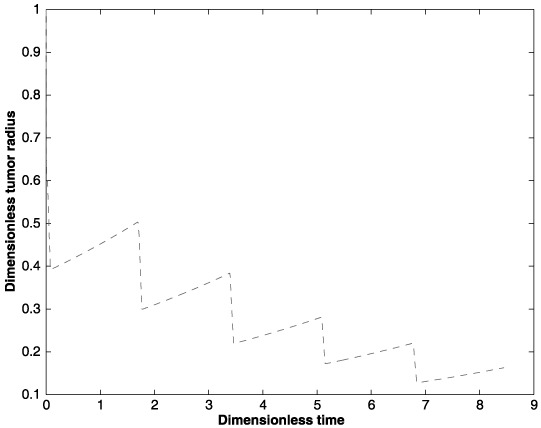
Changes in the tumour size (radius) for five cycles of an anticancer drug treatment.
Parametric sensitivity analysis
Because the tumour and its vasculature are functions of number of parameters, the sensitivity of their behaviour on the treatment are investigated in this section. Drug diffusivity (Dt) within the tumour has a major influence on the efficacy of the treatment. Figure 5 shows how changes in drug diffusivity affect the tumour radius during the five cycle anticancer drug treatment. As expected, an increase in Dt enhances drug delivery within the tumour resulting in faster reduction in tumour size. Here, ±20% change in the nominal value of the drug diffusivity coefficient was applied. An increase of 20% in Dt results in a 94% by volume decrease in the tumour size after five cycles of the drug treatment. On the other hand, a 20% reduction in Dt yields a 109% increase in the final tumour volume. These results indicate a non‐linear dependence of the tumour size on the drug diffusivity coefficient. This result may be attributed to the non‐linearities found in the model. However, in reality, this type of non‐linear dependence is not surprising.
Figure 5.

Effect of the drug diffusivity (Dt) on tumour size for five cycles of an anticancer drug treatment.
Transport of substances across the interstitium is governed by physical and biological properties of the interstitium and also physico‐chemical properties of the substance (Jain 1987a). Compared to normal tissue, the interstitial compartment of neoplastic tissues is significantly different in both biological properties and physical configuration. The tumour interstitial compartment consists of a high collagen concentration, low proteoglycan and hyaluronate concentrations, and a high interstitial fluid pressure. However, there is no presence of the usual well‐defined lymphatic network. These competing factors have a major influence on the filtration coefficient, Kif. As a result, a fraction of the drug that is transported into the interstitium is returned to the capillary and is filtered by the body. This natural transport leads to the non‐optimal use of the drug. An increase in Kif results in a requirement for a longer period of treatment.
Figure 6 illustrates the impact on tumour size due to ±20% changes in Kif from its nominal value. It can be observed that an increase in Kif results in the requirement of a longer period of treatment to reduce the size of the tumour.
Figure 6.
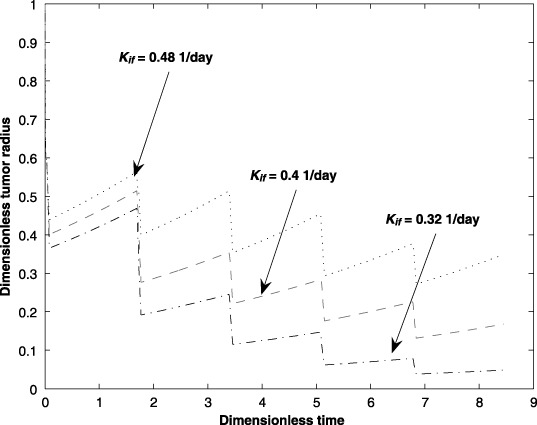
Effect of the interstitium filtration parameter (Kif) on tumour size for five cycles of an anticancer drug treatment.
The interstitium hydrostatic pressure (Pif) has a significant influence on the transport of drug from the capillary. Previous research indicates that the tumour interstitium has a significantly elevated hydrostatic pressure hindering drug delivery. Figure 7 confirms that an elevated interstitium hydrostatic pressure hinders drug transport to the tumour. Here, the impacts on the tumour size due to ±20% changes over the nominal interstitium hydrostatic pressure are investigated.
Figure 7.
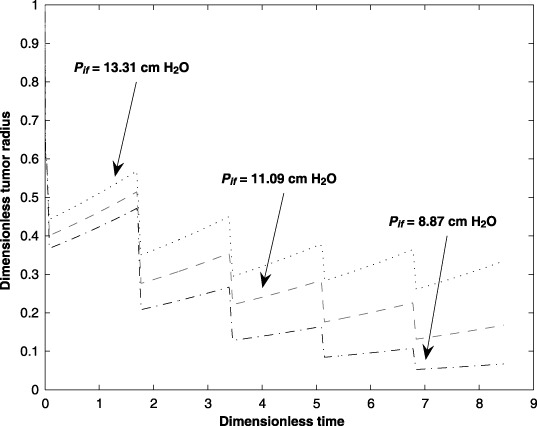
Effect of the interstitium hydrostatic pressure (Pif) on tumour size for five cycles of an anticancer drug treatment.
The hydraulic conductivity (Lp) in the capillary affects drug transport within the capillary. Due to the anticancer drugs and also the tumour environment, these properties can change throughout the treatment process affecting efficacy of the treatment. The effects of hydraulic conductivity (±20% over the nominal value) on tumour size are illustrated in Fig. 8.
Figure 8.
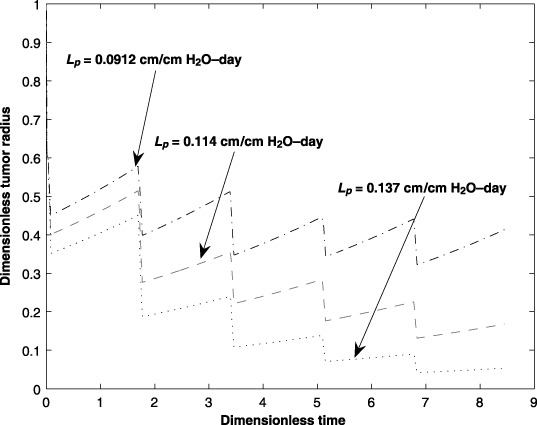
Effect of the capillary hydraulic conductivity (Lp) on tumour size for five cycles of an anticancer drug treatment.
Permeability, P, of the capillary wall affects drug transport to the interstitium. Due to the non‐homogeneous composition of the capillary wall, drug delivery from the capillary to the interstitium is affected by the permeability of the capillary wall. Figure 9 shows the impact on change in capillary permeability on the tumour size. The graph shows that a higher permeability results in faster reduction of the tumour size. The deviation in P is about 10 times the nominal value.
Figure 9.
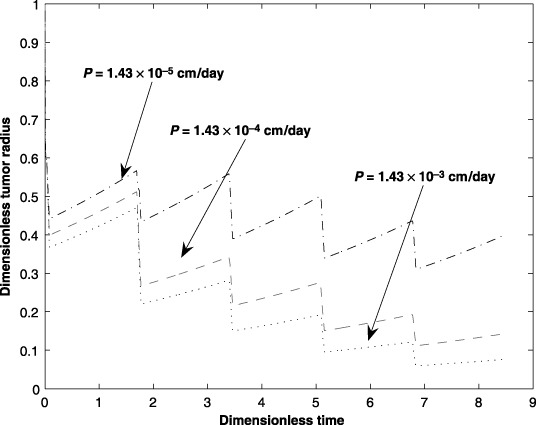
Effect of the capillary diffusive permeability (P) parameter on tumour size for five cycles of an anticancer drug treatment.
An increase in the capillary hydrostatic pressure, Pc, increases the convective fluid flow, hence greater transport across the capillary/interstitium boundary. It stands to reason that an increase in the amount of the anticancer drug in the interstitium should result in an increase in the amount of the drug that is transported across the interstitium/tumour boundary. However, while a higher capillary hydrostatic pressure has a positive effect on transport across the capillary/interstitium boundary, a higher capillary hydrostatic pressure also may enhance the capillary filtration rate. The present analysis does not account for capillary filtration due to the changes in the capillary hydrostatic pressure. However, the effect of different hydrostatic pressures on tumour size is shown in Fig. 10. The graph indicates that if the capillary filtration rate is negligible, then a reduction in tumour size occurs as Pc increases. The deviation of Pc is in the range of ±20% of its nominal value.
Figure 10.
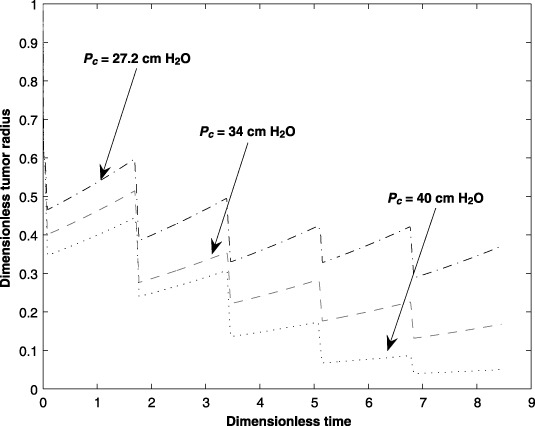
Effect of the capillary hydrostatic pressure (Pc) on tumour size for five cycles of an anticancer drug treatment.
CASE STUDY
A model by Tracqui et al. (1995) was developed from a study for anticancer drug effectiveness on a human subject suffering from a virulent brain tumour. This case study is used here to demonstrate the use of the computational model to predict the effectiveness of anticancer drug transport to a tumour.
With reference to the model provided by Tracqui et al. the dynamics of the anticancer drug in the tumour vasculature is added along with (i) spherical geometry of the tumour with one‐dimensional anticancer drug diffusion and cell motility, and (ii) cell death dependency on the presence of local anticancer drug concentration.
A mathematical model of glioma growth
Gliomas are diffusive and highly invasive tumours that account for 50% of all primary brain malignancies (Swanson et al. 2003). The available treatment methods are surgery, chemotherapy and/or radiation therapy. Chemotherapies are particularly difficult to administer not only due to tumour invasiveness but also due to the blood–brain barrier (Swanson et al. 2002). The blood–brain barrier exists to maintain the chemical balance of the delicate brain cells by maintaining a tight junction between the cells and the capillary network. Surgical resection of a tumour is not always possible due to the location and geometry of the tumour in the brain (Tracqui et al. 1995) and while radiation treatment is effective, the dose‐dependent side‐effects such as radiation induced necrosis, etc., cannot be eliminated. Given these obstacles to the limited treatment choices, optimizing chemotherapy treatment methods is a justifiable undertaking.
Clinical studies provide a rich source of data to improve our knowledge about the effectiveness of chemotherapy and the efficacy of the drug treatment regimen. However, when paired with models (fundamental computational entities) that describe the expected effectiveness of the anticancer drug, together they provide a powerful framework to explore the space of possible solutions in spite of their own individual limitations. Gliomas consist of motile cells that can migrate and proliferate. Tracqui et al. proposed a mathematical model that described a cyclic administration of two chemotherapeutic drugs (first – a make up of six drugs: 6‐thioguanine, procarbazine, dibromodulcitiol, CCNN, 5‐fluorouracil and hydroxyurea; second – cisplatinum) on glioma tumour growth (Tracqui et al. 1995). The treatment consisted of five cycles of the first anticancer drug followed by two cycles of the second anticancer drug. A cycle is 42 days – where 15 of the 42 days involve actual anticancer drug administration and the remaining 27 days is the recovery period.
According to Bardford et al. (1997) existence of chemically resistive subpopulations is common in chemotherapy and radiation treatments. Swanson et al. (2002) suggested that because the patient in the clinical studies had radiation therapy for 3 years prior to current treatment, the radiation may have induced a distinct subpopulation of cells that may have been resistant to the present day chemotherapy treatment. Hence, Tracqui et al. (1995), proposed the existence of a two‐cell population model.
Two cell population models in spherical co‐ordinates
The mass conservation of each cell population and the anticancer drug conservation within the tumour, respectively, are given by:
| (24) |
| (25) |
| (26) |
| 0 ≤ r ≤ R(t), t > 0 drug type i = 1,2 | (27) |
with boundary and initial conditions given by,
| (28) |
| (29) |
 |
(30) |
The reader is referred to the nomenclature section and to Table 2 for all variable definitions.
Table 2.
Case study parameters
| Variable | Symbol | Value | Source |
|---|---|---|---|
| Type 1 cell density | c 1 | cell/cm3 | |
| Type 2 cell density | c 2 | cell/cm3 | |
| Motility of the cell type 1 inside the tumour |

|
1.11 × 10⁻² cm2/day | (Tracqui et al. 1995) |
| Motility of the cell type 2 inside the tumour |

|
1.29 × 10⁻² cell/day | (Tracqui et al. 1995) |
| Diffusivity of drug type 1 inside the tumour |

|
4.32 × 10⁻⁴ cm2/day | |
| Diffusivity of drug 2 inside the tumour |

|
7.77 × 10⁻⁴ cm2/day | |
| Growth rate of type 1 cell | ρ1 | 1.05 × 10⁻² cell/day | (Tracqui et al. 1995) |
| Growth rate of type 2 cell | ρ2 | 1.24 × 10⁻² cell/day | (Tracqui et al. 1995) |
| Death rate of type 1 cell due to drug type 1 | K 11 | 0.5 cells/cm3 per day | |
| Death rate of type 2 cell due to drug type 1 | K 12 | 0 | |
| Death rate of type 1 cell due to drug type 2 | K 21 | 0.45 cells/cm3 per day | |
| Death rate type 2 cells due to drug type 2 | K 22 | 0.45 cells/cm3 per day | |
| Maximum initial cell density at tumour boundary |

|
706 cells/cm3 | (Tracqui et al. 1995) |
| Distance to the tumour centre | ro | 1 cm | |
| Standard deviation of tumour cells | b | 5.68 | (Tracqui et al. 1995) |
Although the model results of Tracqui et al. and the clinical data they provided matched well, the model neither contained anticancer drug transport mechanisms nor any anticancer drug and tumour cell kinetics. Chaplain (2000) and El‐Kareh & Secomb (2000) emphasized the importance of incorporating kinetic and transport mechanisms in the development of general fundamental models of anticancer drug effectiveness in tumour cell eradication to obtain a more rational basis for optimizing anticancer drug administration regimens, efficient anticancer drug delivery mechanisms, and effective anticancer drug development.
Drug transport within capillaries and from the capillary across the interstitium is similar to the governing equations developed in section on model development, (7), (8).
Results using the two cell population models
Using the parameter values listed in 1, 2, (7), (8), (24), (25), (26) are solved numerically by applying Galerkin's finite element method. The temporal and spatial distributions of the tumour cells and anticancer drug within the tumour are shown in 11, 12. The spatial and temporal cell distributions show an initial overall reduction of the tumour cell population as predicted by (Tracqui et al. 1995). This reduction can be attributed to a favourable response to the anticancer drug by the dominant tumour cell population. However, when the drug‐resistive cell population begins to grow, there is an increase in the tumour size (Fig. 13).
Figure 11.
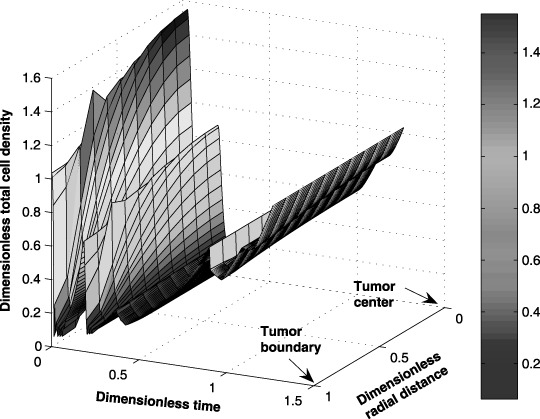
Case study: spatial and temporal distribution of the tumour cells during a seven‐cycle anticancer drug treatment.
Figure 12.
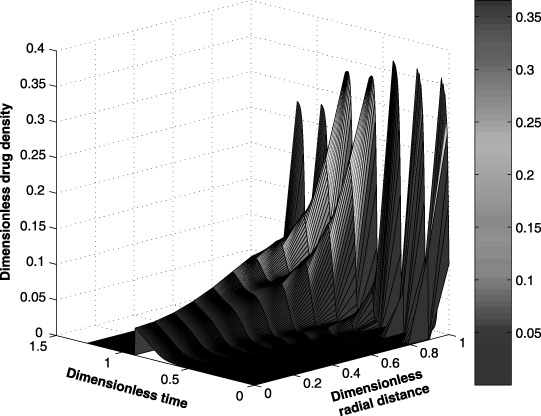
Case study: spatial and temporal distribution of the drug within the tumour during a seven‐cycle anticancer drug treatment.
Figure 13.
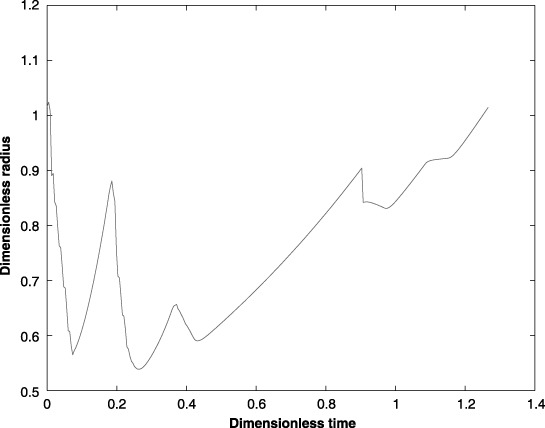
Case study: change in the tumour radius during a seven‐cycle anticancer drug treatment.
Initially, the tumour cell population may increase because the amount of anticancer drug transported to the interior of the tumour is limited by the blood brain barrier and other factors. Figure 12, which shows the anticancer drug distribution within the tumour, supports this claim. The spatial and temporal drug distributions within the tumour show the diffusion limitation of the anticancer drug towards the centre. Note that a periodic drug administration affects the position of the tumour boundary by changing the size of the tumour proportionally to the total tumour cell population.
The model of Tracqui et al. predicted the existence of a second tumour cell population at a later stage in the treatment cycle. The clinical data obtained from the human subject support this claim. The second anticancer drug was unable to combat this second tumour cell strain for at least two reasons: first, the subject's body was not strong enough to withstand a regimen of stronger anticancer drugs and second, it was not clear that the subsequent anticancer drug was potent enough to arrest the tumour cell growth. It was made clear that the subject would not be given any further treatments of the first anticancer drug.
The model proposed in this work enabled the investigation of the role played by several biological parameters on transportation of the anticancer drug to the tumour. Identification of these barriers on drug transport before and also during the treatment is useful in determination of better treatment options even post‐audit.
ACKNOWLEDGEMENTS
A variation of this work was reported in an internal report dated May 2005. The first author is supported by the Texas Tech University Process Control & Optimization Consortium. Both authors wish to thank Dr H. F. Janssen (Texas Tech University Health Sciences Centre Department Orthopedics) for the numerous discussions and helpful advice.
REFERENCES
- Au JL, Jang SH, Zheng J, Chen CT, Song S, Hu L, Wientjes MG (2001) Determinants off drug delivery and transport to solid tumours. J. Control Release 74, 31–46. [DOI] [PubMed] [Google Scholar]
- Bardford R, Koppel H, Pilkington GJ, Thomas DG, Darling JL (1997) Heterogeneity of chemo‐sensitivity in six clonal cell lines derived from a spontaneous murine astrocytoma and its relationship to genotypic and phenotypic characteristics. J. Neurooncol. 34, 247–261. [DOI] [PubMed] [Google Scholar]
- Berger SA, Goldsmith W, Lewis ER (1996) Introduction to Bio Engineering. New York: Oxford University press. [Google Scholar]
- Brown EB, Izumi Y, Campbell RB, Berk DA, Jain RK (2001) Role of tumor‐host interactions in interstitial diffusion of macromolecules: cranial vs. subcutaneous tumours. PNAS 98, 4628–4663. [DOI] [PMC free article] [PubMed] [Google Scholar]
- Chaplain MAJ (2000) Mathematical modeling of angiogenesis. J. Neurooncol. 50, 37–51. [DOI] [PubMed] [Google Scholar]
- Crank J (1994) Free and Moving Boundary Problems. Oxford, UK: Clarendon press. [Google Scholar]
- Cristini V, Lowengrub J, Nie Q (2003) Nonlinear simulation of tumour growth. J. Math. Biol. 46, 191–224. [DOI] [PubMed] [Google Scholar]
- Cui S, Friedman A (2004) A free boundary problem for a singular system of differential equations: an application to a model of tumour growth. Trans. Amer. Math. Soc. 355, 3537–3590. [Google Scholar]
- D’Onofrio A, Gandolfi A (2004) Tumour eradication by antiangiogenic therapy: analysis and extensions of the model by Hahnfeldt et al (1999). Math. Biosci. 191, 159–184. [DOI] [PubMed] [Google Scholar]
- De Pillis LG, Radunskaya AE (2006) Mixed immunotherapy and chemotherapy of tumours: modeling applications and biological interpretations. J. Theor. Biol. 238, 841–862. [DOI] [PubMed] [Google Scholar]
- El‐Kareh AW, Secomb TW (2000) A mathematical model for comparison of bolus injection, continuous infusion, and lopsomal delivery of doxorubicin to tumour cells. Neoplasia 2, 325–338. [DOI] [PMC free article] [PubMed] [Google Scholar]
- Finlayson BA (1980) Nonlinear Analysis in Chemical Engineering. New York: McGraw‐Hill. [Google Scholar]
- Folkman J (2001) Angiogenesis In: Braunwald E, Fauci AS, Kasper DL, Hauser SL, Longo DL, Jameson JL, eds. Harrison's Principles of Internal Medicine, 15th edn, pp. 517–530. New York: McGraw‐Hill. [Google Scholar]
- Gore A (2005) Trans‐capillary fluid exchange: the Starling's hypothesis. http://omaha.physiol.arizona.edu/Physiology485/Gore/Lecture21a/Gore.L21a.html . [accessed on 9 January 2005].
- Greenspan HP (1972) Models for growth of a solid tumour by diffusion. Stud. Appl. Math. 52, 317–340. [Google Scholar]
- Jain RK (1987a) Transport of molecules across tumour vasculature. Cancer Metastasis Rev. 6, 559–593. [DOI] [PubMed] [Google Scholar]
- Jain RK (1987b) Transport of molecules in the tumour interstitium: a review. Cancer Res. 47, 3039–3305. [PubMed] [Google Scholar]
- Jain RK (1994) Barriers to drug delivery in solid tumours. Sci. Am. 271, 58–65. [DOI] [PubMed] [Google Scholar]
- Jain RK (1997) Delivery of molecular and cellular medicine to solid tumors. Microcirculation 4, 1–23. [DOI] [PubMed] [Google Scholar]
- Jang SH, Wientjes MG, Lu D, Au JL (2003) Drug delivery and transport to solid tumours. Pharm. Res. 20, 1337–1350. [DOI] [PubMed] [Google Scholar]
- Kellen MR (2002) A model for micro‐circulatory fluid and solute exchange in the heart. PhD Thesis, University Washington, Academic Degree Doctor of Bio‐Engineering. [Google Scholar]
- Klabunde RE (2004) Cardiovascular Physiology Concepts. Lippincott, PA: Williams & Wilkins. [Google Scholar]
- Macklin P, Lowengrub J (2006) An improved geometry‐aware curvature discretization for level set methods: application to tumour. J. Comput. Phys. 215, 392–401. [Google Scholar]
- Mallet DG, De Pillis LG (2006) A cellular automata model of tumour‐immune system interactions. J. Theor. Biol. 239, 334–350. [DOI] [PubMed] [Google Scholar]
- Norris ES, King JR, Byrne HM (2006) Modeling the response of spatially structured tumors to chemotherapy: drug kinetics. Math. Comput. Model. 43, 820–837. [Google Scholar]
- Pluen A, Boucher Y, Ramanujan S, Mckee TD, Gohongi T, Tomaso ED, Rippe B, Rosengern B, Carlsson O, Venturoli D (2002) Transendotheial transport: the vesicle controversy. J. Vasc. Res. 39, 375–390. [DOI] [PubMed] [Google Scholar]
- Swanson KR, Murray JD, Alvord EC Jr (2002) Quantifying efficacy of chemotherapy of the brain tumours with homogeneous and heterogeneous drug delivery. Acta Biotheor. 50, 223–237. [DOI] [PubMed] [Google Scholar]
- Swanson KR, Bridge C, Murray JD, Alvord EC Jr (2003) Virtual and real brain tumours: using mathematical modeling to quantify glioma growth and invasion. J. Neurol. Sci. 216, 1–10. [DOI] [PubMed] [Google Scholar]
- Tracqui P, Cruywagen GC, Woodward DE, Bartoo GT, Murray JD, Alvord EC Jr (1995) A mathematical model of glioma growth: the effect of chemotherapy on spatio‐temporal growth. Cell Prolif. 28, 17–31. [DOI] [PubMed] [Google Scholar]
- Venturoli D, Rippe B (2001) Transport asymmetry in peritoneal dialysis: application of a serial hetero‐porous peritoneal membrane model. Am. J. Renol. Physiol. 280, F599–F606. [DOI] [PubMed] [Google Scholar]


