

Abstract
Abstract. A model of intestinal crypt organization is suggested based on the assumption that stem cells have a finite replicative life span. The model assumes the existence in a crypt of a quiescent (‘deep’) stem cell and a few more actively cycling (‘proximate’) stem cells. Monte Carlo computer simulation of published intestinal crypt mutagenesis data is used to test the model. The results of the simulation indicate that stabilization of the crypt mutant phenotype following treatment with external mutagen is consistent with a stem cell replicative life span of about 40 divisions for mouse colon and 90–100 divisions for mouse small intestine, corresponding to a deep stem cell cycle time of about 3.9 and 8.5 weeks for colon and small intestine, respectively. Simulation of the data obtained for human colorectal crypts suggests that the proximate stem cell cycle time is about 80 h, assuming a replicative life span of 50–150 divisions, and that the deep stem cell divides approximately every 30 weeks.
INTRODUCTION
The intestinal mucosa displays tight spatial organization of constituent cell types, rapid and continual cellular turnover that is balanced by a stem cell‐dependent proliferative hierarchy, and is a common site for human tumour occurrence (Wright 2000; Ries et al. 2004). These factors combine to make the intestinal mucosa an attractive model system for analysing both epithelial cell biology and the processes that lead to epithelial tumours. Central to a description of the biology and diseases of the intestinal tract is an understanding of the organization and properties of intestinal stem cells. These cells are usually inferred to be located at or near the base of the crypts of Lieberkühn, which represents the clonal proliferation unit of the intestine, and they are assumed to have a capacity for both self‐renewal and contribution to differentiated cell lineages. Despite intensive investigation, many properties of intestinal crypt stem cells remain unclear or contentious, due primarily to a lack of phenotypic markers that allow the identification and isolation of these cells and a lack of suitable in vitro culture systems. Accordingly, much of our understanding of intestinal crypt stem cells derives from indirect functional assays such as the ability to repopulate crypts following exposure to cytotoxic agents (Potten 1998) or the frequency of mutant crypts following mutagen exposure (Campbell et al. 1996).
The intestinal crypts of mature laboratory mice and humans are apparently monoclonal in origin (Wright 2000), however, the number and the organization of the stem cells that are present in each crypt is unclear, and several models have been suggested. Single stem cell models (Meinzer & Sandblad 1986) assume that one actively proliferating stem cell is responsible for crypt repopulation and predict a relatively short crypt turnover time. The long time intervals taken for crypts in the small and large intestine of the laboratory mouse to become wholly populated by mutant cells following mutagen exposure appear, however, to be inconsistent with this prediction (Winton & Ponder 1990). As an alternative to single stem cell models, Williams et al. (1992) proposed that each crypt contains multiple stem cells that occupy a niche (a microenvironment necessary for the maintenance of stem cell properties). The ‘niche’ model suggests that, following stem cell division, daughter cells are randomly retained or lost from the niche. Results derived from the analysis of variability in gene methylation patterns obtained from the DNA of single human colon crypts (Yatabe et al. 2001) and from transgene expression in mouse intestinal crypts (Wong et al. 2000), are consistent with the presence of multiple stem cells per crypt.
An underlying assumption of the above models is that intestinal crypt stem cells are ‘immortal’. Based on this assumption, it has been calculated that crypt stem cells would complete over 5000 divisions during a human lifetime (Potten & Loeffler 1990). The validity of this assumed immortality is questionable as both in vitro and in vivo studies of different normal replicative cell types from several species have demonstrated eventual senescence (a non‐dividing state) or death (Faragher 2000). (Note that embryonic stem cell lines can replicate far beyond the limits of normal somatic cells (Amit et al. 2000), however, these cells contain high levels of telomerase (see below) and their relevance to the properties of adult stem cells is debatable). The induction of cellular senescence or death has been ascribed to an age‐related accumulation of DNA damage (Harman 1992) or to telomere shortening caused by both the ‘end replication problem’ (Olovnikov 1996) and an apparent active telomere attrition mechanism (Smogorzewska & de Lange 2002) resulting in an increased probability that a telomere switches to an unprotected form (Blackburn 2000). The latter hypotheses are not necessarily mutually exclusive (von Zglinicki 2002). Although the telomere hypothesis might explain human cellular senescence, the laboratory mouse has anomalously long telomeres (Hemann & Greider 2000) that are not appreciably shortened during ageing (Kipling & Cooke 1990). The occurrence of senescence in laboratory mouse cells suggests that the telomere hypothesis is incorrect or that different species use different senescence‐induction mechanisms or that both mechanisms are operating simultaneously in mammalian cells.
Potten et al. (2002) have argued, based on the high sensitivity of laboratory mouse small intestinal stem cells to induction of apoptosis by toxins, and on the ability of ‘label‐retaining’ cells (equated with stem cells) in the small intestine of the laboratory mouse to selectively segregate template DNA strands, that intestinal stem cells can avoid both DNA damage accumulation and the telomere shortening problem, and thereby potentially replicate indefinitely. (Whether selective DNA strand segregation occurs in human stem cell populations and in human or mouse large intestine stem cells, is unknown). In spite of such arguments, studies of telomere length in human haemopoietic stem cells (Engelhardt et al. 1997) and derived populations (Rufer et al. 1999), and in various tissues including human colonic mucosa (Hastie et al. 1990), have shown a significant age‐related shortening. Low to moderate levels of telomerase activity have been demonstrated in some human stem cell populations (probably including those of the intestinal crypt (Tahara et al. 1999)) that service tissues involved in continuous or cyclic proliferation; however, the level of activity appears to have little effect on the rate of telomere shortening (Forsyth et al. 2002) and this telomerase activity may have a proliferative and/or anti‐apoptotic function (Oh et al. 2001; Chan & Blackburn 2002). As well, there is a multitude of studies that describe age‐related increases in various types of DNA damage (including chromosomal aberrations) in different tissues (including intestine‐ (Ellsworth & Schimke 1990; Zahn et al. 2000)) from various species (Sedelnikova et al. 2004). Hence, if such changes in progeny cells are reflective of events in their stem cells, then both DNA damage and telomere shortening may combine to limit the replicative potential of human and mouse adult stem cells. Consistent with this view, functional assays suggest that there is an age‐dependent decline in the proliferative potential of human haemopoietic stem cells (Marley et al. 1999; Van Zant & Liang 2003) and of laboratory mouse haemopoietic (Van Zant & Liang 2003) and small intestinal stem cells (Martin et al. 1998).
Concerns about the length of the replicative lifespan of adult stem cells led to 1994, 1999) ‘linear hierarchy’ model in which it is suggested that intestinal crypt stem cells progress with increasing numbers of divisions through a multiple‐layer hierarchy. The linear hierarchy model can readily account for crypt cell replenishment whilst restricting stem cells to around 100 divisions; however, it predicts relatively large numbers of stem cells per crypt and has been criticized as being inconsistent with the results of crypt mutagenesis experiments (Williams & Williams 2000).
Gerike et al. (1998) have proposed that dedicated intestinal crypt stem cells may not exist, and that differences in proliferative activity along the length of crypts reflect proximity to a hypothetical source of growth factor at the crypt base. Such a model appears unlikely, given the characterization of stem cells in various tissues, including some with low cell turnover (Clarke et al. 2003; Alison et al. 2004), and the ability of cell aggregates from the murine small intestine to regenerate the intestinal structure following subcutaneous grafting (Slorach et al. 1999). As well, a structured cell hierarchy that includes stem cells can provide a maximization of cellular replication potential (Kay 1965) and a minimization of the rates of mutation accumulation (Heddle et al. 1996) and of telomere shortening.
As outlined in the previous discussion, there are experimental or theoretical objections to current models of intestinal crypt stem cell organization. Accordingly, there is a need to examine the plausibility of alternative explanations. In this report, we have used computer simulation of published intestinal crypt mutagenesis data to test a model whose basic assumptions are that there is a two‐tiered arrangement of intestinal crypt stem cells (quiescent (‘deep’) and more actively cycling (‘proximate’)) and that these stem cells have a finite replicative life span. The idea that stem cells in the crypt epithelium are arranged as a stem‐cell hierarchy, with one infrequently dividing stem cell at its top and a few actively proliferating “transit stem” cells, has been suggested by Winton & Ponder (1990) however, without detailed elaboration of the interrelationship between these two levels of hierarchy. There is also evidence from the haemopoietic system to support the existence of deep stem cells. It has been estimated, based on analysis of the rate of age‐dependent telomere shortening in human haemopoietic cell lineages (Rufer et al. 1999) and on the incorporation of bromodeoxyuridine by haemopoietic stem cells in adult baboons (Mahmud et al. 2001), that primate primitive haemopoietic stem cells divide less than once per year. A similar result was obtained by Vickers et al. (2000) who analysed the frequency of red blood cell mutation at the glycophorin A locus and estimated that human haemopoietic stem cells complete around 70–90 divisions between birth and old age. There is also evidence for quiescent epidermal stem cell populations in the hair follicle niche (Blanpain et al. 2004). It has been speculated that a two‐tiered arrangement of stem cells may have evolved as a defence against inadvertent toxin exposure (Cooper & Spangrude 1999) or tumour formation (Wright & Shay 2002).
Our computer simulations have used data obtained from both the small and the large intestines. It is recognized that there are potentially important differences between the epithelial stem cells in the small and large intestines (Williams et al. 1992; Merritt et al. 1995); nevertheless, it seems not unreasonable to predict that the broad generalities of stem cell organization and behaviour will be similar in both regions of the intestine.
MATERIALS AND METHODS
Basic assumptions and supportive evidence for the model
Assumption 1: All intestinal crypt stem cell lineages are restricted to a finite number of divisions and there is a maximization of the proliferative potential of these cells.
The experimental and theoretical basis for the restriction of crypt stem cells to a finite number of divisions is presented in the Introduction section. A necessary extension of this assumption is the postulate that there are mechanism(s) that maximize the proliferative potential of crypt stem cells. This could be achieved, once the functional intestinal crypt has been established, by restricting the ability of stem cells that have completed few divisions to differentiate into transit‐amplifying cells (discussed further under Assumption 3).
Assumption 2: The intestinal crypt is populated by one deep stem cell and a few proximate stem cells, which occupy niches that define their properties.
An outline of our model assumptions related to the crypt stem cell organization is shown in Fig. 1. The assumed presence of one deep stem cell per crypt is supported by experimental and theoretical considerations. First, the occurrence of crypts in both the small and the large intestine of the laboratory mouse (Winton & Ponder 1990; Williams et al. 1992; Wright 2000) and in the large intestine of humans (Campbell et al. 1996) that are wholly populated by mutant cells following mutagen exposure is consistent with the presence of one deep stem cell. It is also of interest that the frequency of label‐retaining cells in sections of the laboratory mouse small intestine appears potentially consistent with the presence of one such cell per crypt (Potten et al. 2002). The postulated deep stem cell could be equivalent in this case to the label‐retaining cell. Second, restriction of total cell divisions (see Assumption 1) requires a maximization of cellular replication potential that is provided by an infrequently dividing deep stem cell, similar to the first cell of the ‘linear hierarchy’ model (Morris 1994, 1999). The deep stem cell in our model plays the role of this ‘first’ stem cell, and all cells in a crypt descend from this cell.
Figure 1.
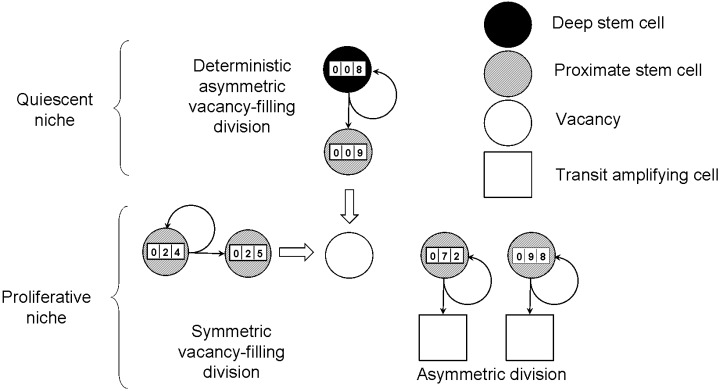
A schematic representation of the model assumptions. The intestinal crypt is populated by one deep stem cell and a few (four in the diagram) proximate stem cells. The deep stem cell undergoes deterministic divisions that result in self‐renewal and the production of a proximate stem cell that fills a vacancy in the proliferative niche. Proximate stem cells normally undergo asymmetric divisions that result in self‐renewal and the production of a transit‐amplifying cell. In certain circumstances, they divide symmetrically, resulting in the production of two proximate stem cells, one of which fills a vacancy. A vacancy is formed when a proximate stem cell approaches the end of its replicative life span and leaves the niche (i.e. undergoes apoptosis or divides symmetrically to produce two transit‐amplifying cells). The counter on each stem cell shows its replicative age and represents the assumption that each stem cell is restricted to a finite number of divisions.
A deep stem cell, which divides infrequently, cannot account for the kinetics of crypt cell repopulation. There is therefore a logical requirement for proximate stem cells that are descendants of the deep stem cell and that divide more frequently to both renew themselves and to produce transit‐amplifying cells. The existence of a few proximate stem cells per crypt is supported by laboratory mouse studies in which the radiosensitivity of crypt clonogenic cells (Potten 1998) and the kinetics of mutant cell turnover (Bjerknes & Cheng 1999) have been analysed. The results are consistent with the presence of around four proximate stem cells per crypt. The width of ‘ribbons’ of mutant cells in human colonic crypts is also potentially consistent with around four proximate stem cells per crypt (Taylor et al. 2003).
A model for a quiescent intestinal crypt stem cell niche is presented in the accompanying paper (Radford & Lobachevsky 2006).
Assumption 3: Proximate stem cells normally undergo asymmetric divisions that result in self‐renewal and the production of a transit‐amplifying cell; however, in certain circumstances they can divide symmetrically, resulting in the production of two proximate stem cells.
The properties of proximate stem cells in our model are similar to those suggested for stem cells in ‘niche’ (Williams et al. 1992; Yatabe et al. 2001) or stochastic models (Loeffler et al. 1993). These models, which can successfully simulate the general shape of wholly mutant crypt formation data, postulate the presence of multiple stem cells per crypt and typically assume that stem cell divisions have stochastic consequences, including a finite probability of symmetric, division resulting in the production of two daughter stem cells or the loss of both daughter cells from the niche. The latter outcome is, however, wasteful of stem cell division potential (particularly if it occurs at a significant frequency during early post‐natal life). Therefore, in contrast to the previously mentioned models, the symmetric division of proximate stem cells in our model is not characterized by a fixed probability, but rather is governed by the principle of maximizing cell division potential (see Assumption 1) and depends on the replicative ‘age’ of the proximate stem cells. (In our model, the ‘age’ of a cell is related to the number of divisions it has completed.) When a proximate stem cell approaches the end of its replicative life span, there is an increasing probability that it will die by apoptosis or divide symmetrically to produce two transit‐amplifying cells, thus leaving a vacancy in the niche. The latter event is postulated to stimulate one of the remaining proximate stem cells to divide symmetrically, resulting in self‐renewal and in filling of the niche vacancy. Consistent with the principle of maximizing cell division potential, the ‘youngest’ proximate stem cell in the niche is postulated to have the greatest probability of undergoing the latter division.
Our model does not specify whether proximate stem cell niche vacancies are created by apoptosis or by symmetric division (and this decision does not affect our simulation results). A low level of spontaneous apoptosis has, however, been found at the presumed location of crypt stem cells in both the small and the large intestine of the laboratory mouse (Merritt et al. 1995), supporting a role for apoptosis in the creation of niche vacancies.
Assumption 4: The deep stem cell undergoes deterministic divisions that result in self‐renewal and the production of a proximate stem cell.
Studies of lower eukaryotic stem cell niches have defined intrinsic molecular mechanisms (involving proteins such as an adenomatous polyposis coli tumour suppressor homologue) that orientate the mitotic spindle to ensure a cell division plane that results in only one of the daughter cells remaining associated with the niche (Yamashita et al. 2003; Roegiers & January 2004).
Division of the deep stem cell is ultimately responsible for the replacement of ageing proximate stem cells. The process of filling a niche vacancy by symmetrical division of a proximate stem cell (see Assumption 3) is limited as eventually all proximate stem cells will exhaust their proliferative potential. Therefore, the probability that a niche vacancy is filled by division of the deep stem cell increases as the proliferative potential of the proximate stem cells declines.
Input parameters and variables
The main parameters of the model are:
-
1
Np– the number of proximate stem cells per crypt,
-
2
Tp– the cell cycle time of proximate stem cells.
The restriction on the number of divisions that a stem cell can undergo is achieved in our model by the assumption that the probability (denoted as P v, the probability of a niche vacancy) that a proximate stem cell is lost from the niche increases with its replicative age (denoted as N div– the number of completed divisions). We describe this dependence using the value M 1 (the number of divisions at which the probability P v equals 0.5) and the parameter k 1, which defines the ‘steepness’ of the probability curve. Similarly, we introduce the probability that a proximate stem cell divides symmetrically producing two daughter stem cells (denoted as P s), which is defined by another pair of parameters M 2 and k 2. It is important to note that the probability P s is conditional upon the existence of a niche vacancy, in contrast to P v, which is a probability per division. The expressions used to describe these probability curves are given in the Appendix (expressions A1 and A2).
Two parameters were used in the analysis of mutagenesis results:
-
1
µext– the mutation frequency following a single dose of external mutagen, and
-
2
d– the detection threshold (the minimum detectable fraction of mutated cells in a crypt). Spontaneous mutagenesis was ignored given its small contribution as compared to the induced mutagenesis rate.
The simulations used the following variables:
-
1
N c– the number of simulated crypts (the numbers chosen were large enough to accumulate a statistically significant number of mutated crypts),
-
2
T s– the time interval simulated,
-
3
T m– the time of external mutagen treatment, and
-
4
N t– the total number of transit‐amplifying cells per crypt for the purpose of determination of the mutation status.
Basic simulation procedure
We used a Monte Carlo approach to simulate cell division, the formation and filling of vacancies in the proximate stem cell niche and cell mutagenesis. For each crypt, the simulation protocol recorded current time, number of divisions completed by the deep stem cell and by each proximate stem cell, and the mutation status of each cell. Average values were calculated for all simulated crypts. The simulation proceeded by generating a time interval to the next event (a proximate stem cell division) in a crypt and updating the current time by the value of this interval. By analysing the replicative age of proximate stem cells, a choice was made based on the P v(N div) value as to whether the event represented a normal cell division or the formation of a vacancy. Two possible mechanisms for niche vacancy formation were considered. One option is that all proximate stem cells are candidates for vacancy formation; another option is that only the oldest proximate stem cell is lost. Preliminary simulation results indicated no significant difference between these options; however, the second option was adopted as it resulted in greater concordance with the experimental data.
If a normal cell division occurred during the previous time interval, the replicative age of the dividing cell and the mutation status of the transit‐amplifying cell produced were updated. If a vacancy was formed, then a choice was made as to whether it was filled by symmetric division of another proximate stem cell (based on analysis of P s(N div) values) or by division of the deep stem cell. Two possible mechanisms for niche vacancy filling were considered. One option is that all proximate cells can participate in vacancy filling; another option is that only the youngest proximate stem cell participates. Preliminary results indicated minor differences between these two options, and the second option was used in subsequent simulations. Following vacancy filling, the replicative age of the dividing cell was updated, and the replicative age and mutation status of the new proximate stem cell was recorded.
The mutation status of a crypt was determined based on the phenotype of all proximate stem cells and a few levels (generations) of transit‐amplifying cells. The number of levels considered was the smallest integer number larger than log2(1 + N t /N p). This calculation was performed to reflect the delay between mutation of one stem cell and conversion of all proximate stem cells and the whole crypt to the mutant state, and ensures that determination of the mutation status of a crypt is carried out at a given total number of cells N t and is not affected by the number of proximate stem cells. It should be noted that for a given number of proximate stem cells, the number of levels is the same for quite a wide range of N t. For example, for N p = 4, the number of levels equals 5 for N t = 124–252. The latter range approximates the number of transit‐amplifying cells in a mouse intestinal crypt. When the elapsed simulation time reached the time of mutagen exposure (T m), the mutation status of all stem cells in each crypt was determined based on their probability for mutagenesis (µext). The value of T m should be large enough to ensure that mutagen treatment is simulated in steady‐state crypts. Following division of a mutant proximate stem cell, a first‐generation transit‐amplifying cells became mutant and so on. We assumed that the cycle time of a transit‐amplifying cell was the same as that of a proximate stem cell. Crypts were considered to be wholly mutant if all proximate stem cells and transit‐amplifying cells were mutant. Alternatively, if the fraction of mutant cells exceeded the detection threshold (d), crypts were scored as partially mutant.
Simulations were performed using custom‐built software called odmp (acronym for One Deep Many Proximate). The software was developed using borland c++builder version 5 and run on a standard desktop PC in the Microsoft Windows environment. The details of the simulation procedure are described in the Appendix.
RESULTS
Experimental data
We tested the ability of our model to simulate the occurrence of crypts containing mutant cell populations in the small intestine or colon following mutagen exposure. Data were taken from three studies in the literature. One of these studies tested for ethyl nitrosourea‐induced mutation of the Dlb‐1 b locus, which results in loss of binding of the lectin Dolichos biflorus agglutinin to intestinal epithelium, using heterozygous Dlb‐1 b /Dlb‐1 a mice (Winton & Ponder 1990). Mutant crypts were recognized by their lack of lectin binding. Another study used a histochemical method to detect ethyl nitrosourea‐induced mutation of the X‐linked glucose‐6‐phosphate dehydrogenase locus in the intestinal crypt epithelium of male mice (Park et al. 1995). The third study tested for loss of O‐acetylation of human colorectal crypt epithelial sialomucoproteins, which can be detected by histochemical staining in colectomy specimens from patients who had received prior therapeutic radiation and who were heterozygous for O‐acetyltransferase gene activity (Campbell et al. 1996). In the latter study, ionizing radiation was acting as a mutagen inducing the loss of O‐acetylation.
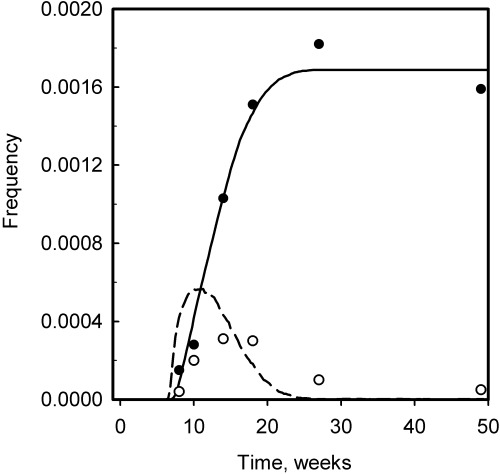
In both mouse studies, similar forms for the kinetics of appearance of wholly and partially mutant crypts were reported. Figure 2 shows data from Park et al. (1995) for mouse small intestine (a) and colon (b). The results show that partially mutant crypts appear and then disappear soon after mutagen treatment, followed by an increase in the number of wholly mutant crypts that reaches a plateau with time.
Figure 2.
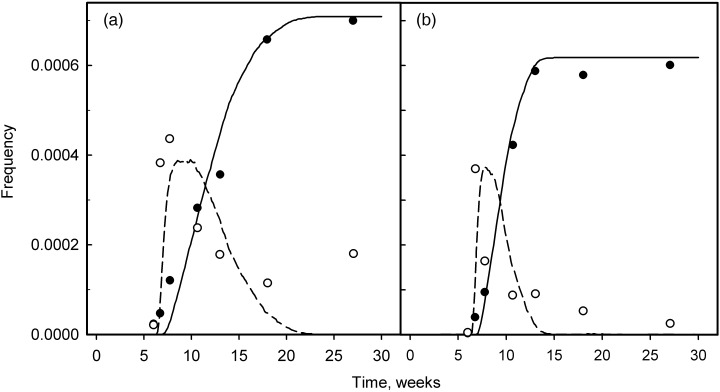
The kinetics of appearance of partially (open symbol) and wholly (closed symbol) mutant crypts following treatment with mutagen. Experimental data from Park et al. (1995) are for mouse small intestine (a) and colon (b). Mice were injected with ethyl nitrosourea at 6 weeks. The lines represent the results of simulation (dashed line is partially mutant crypts and solid line is wholly mutant crypts). The values of the model parameters used for the simulation were: proximate stem cell cycle time (T p) = 18 h; number of proximate stem cells (N p) = 4; and the limiting number of divisions (M 1) = 46–138 for small intestine and 20–60 for colon. The simulated values of the clonal half‐stabilization time (T 50) = 5.75 weeks for small intestine and 3.44 weeks for colon; the deep stem cell cycle time (T d) = 7.61 weeks for small intestine and 3.86 weeks for colon.
In the context of our model, a partially mutant crypt may arise from a mutation in one of the proximate stem cells or in the deep stem cell. In the first case, such a crypt will arise soon after mutagen treatment; however, it will eventually convert to a normal crypt following one or a few divisions of the non‐mutant deep stem cell that will produce proximate stem cells of normal phenotype. In the second case, the partially mutant crypt will arise following division of the mutant deep stem cell and will eventually convert to a wholly mutant crypt. A wholly mutant crypt may in principle arise from a mutation in a proximate stem cell, provided that this stem cell repopulates the crypt before a division of the deep stem cell occurs.
Inter‐relationship between model input and output parameters
A prominent feature of the kinetics shown in Fig. 2 is the time after mutagen treatment at which crypts are converted to the wholly mutant state. This feature was characterized by the ‘clonal half‐stabilization time’ (by analogy with the term ‘clonal stabilization time’ used in Campbell et al. (1996)) (T 50): the time at which the frequency of wholly mutant crypts reached half its plateau value. Another important feature of the conversion kinetics is the spread of the conversion time (denoted as T w), or in other words the time between the appearance of the first and the last wholly mutant crypt. These definitions of T 50 and T w are shown schematically in Fig. 3. Values of T 50 and T w calculated from the experimental data shown in Fig. 2 are summarized in Table 1.
Figure 3.
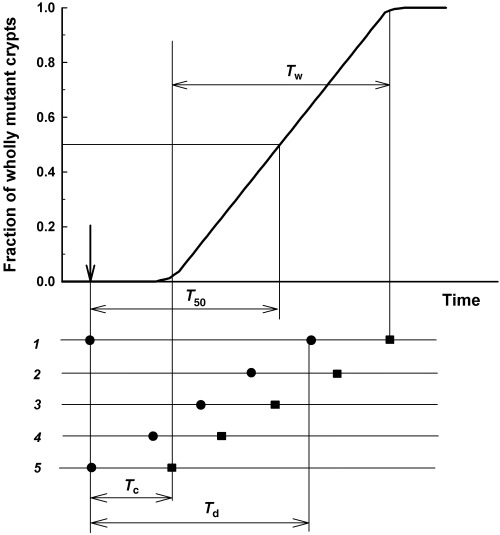
The relationship between stem cell parameters and the kinetics of appearance of wholly mutant crypts. T d is the deep stem cell cycle time, T c is the time between deep stem cell division and crypt conversion, and T 50 is the time after mutagen treatment at which the number of wholly mutant crypts reaches 50% of the maximum value.
Table 1.
Characteristics of wholly mutant intestinal crypt stabilisation kinetics
| Experimental data | T 50 (weeks) | T w (weeks) |
|---|---|---|
| Park et al. (1995) | ||
| Mouse colon | 3.53 | 5.01 |
| Park et al. (1995) | ||
| Mouse small intestine | 5.91 | 12.2 |
| Winton & Ponder (1990) | ||
| Mouse small intestine | 6.84 | 10.3 |
| Campbell et al. (1996) | ||
| Human colorectum | 21 | 145 |
A given pair of T 50 and T w values can be achieved by simulation with various combinations of values for the model parameters T p, N p, M 1 and M 2. To minimize the number of combinations, we tried to establish an approximate relationship between the model parameters for a given pair of T 50 and T w values. To establish this relationship, two simplifications were made to the model. First, we considered a crypt to be converted to the wholly mutant state when all proximate stem cells were mutant. That is, we ignored the time interval required for conversion of transit‐amplifying cells. Second, we considered the threshold dependence for probabilities P v and P s (which means that P v = 0 if N div < M 1 and P v = 1 if N div > M 1, see Fig. A1 in the Appendix for details). It can be shown, based on the second simplification, that the average time interval T v between the formation of consecutive crypt vacancies can be expressed as (see expression A4 in the Appendix for details):
Figure A1.
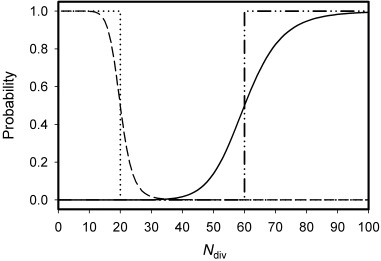
The probabilities that a proximate stem cell leaves the niche and forms a vacancy (Pv(M1, k1, Ndiv)) (solid line) or divides symmetrically, renewing itself and filling the vacancy (Ps(M2, k2, Ndiv)) (dashed line), as a function of the number of divisions it has completed (Ndiv). Probabilities have been calculated for the following parameter values: M 1 = 60, M 2 = 20, k 1 = k 2 = 10.0. The probability that a stem cell divides symmetrically producing two daughter stem cells is also conditional upon the existence of a vacancy in the niche. The dash‐dot and dot lines represent the P v and P s probabilities, respectively, for the case of a threshold dependency, which is the limiting case for increasing k 1 and k 2.
 |
(1) |
This in turn, allows calculation of the time interval between divisions of the deep stem cell, T d (that is, the deep stem cell cycle time):
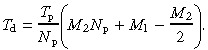 |
(2) |
Following division of a mutant deep stem cell, the conversion of the crypt to wholly mutant requires, according to the first simplification above, the filling of (N p− 1) vacancies, therefore the time interval T c between division of the deep stem cell and subsequent conversion of the crypt to wholly mutant can be written as:
| (3) |
The schematic relationship between the kinetics of appearance of wholly mutant crypts (as quantified by the experimental values T 50 and T w) and crypt parameters (T d and T c) is shown in Fig. 3. Our modelling assumes a random distribution of deep stem cells through the cell cycle at the time of mutagen treatment. In Fig. 3, the lines numbered from 1 to 5 represent individual crypts, black circles represent divisions of the deep stem cell and black squares represent the conversion of crypts to wholly mutant. According to our model, the first wholly mutant crypt to be detected is that in which division of the deep stem cell occurred just after mutagen treatment (crypt 5). Whereas the last wholly mutant crypt to be stabilized is that in which the deep stem cell divided just before mutagen treatment (crypt 1). The following relationships follow from the latter considerations:
| (4) |
| Tw = Td | (5) |
Substitution of T d and T c from expressions 2 and 3 allows determination of the relationship between the model parameters for given experimental values of T 50 and T w.
Estimation of model parameters
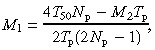
We solved Equation 4 relative to M 1 for two values of T 50 obtained from the mouse colon and small intestine data (Table 1), assuming the cycle time of proximate stem cells to be T p = 16 h and considering a few values for the number of proximate stem cells: N p = 4, 8 and 16. Also, additional requirements imposed by the model were taken into account, namely:
| M2 < M1 and M2 > 0. | (6) |
The major outcome of this solution (details of which are given in the Appendix, expression A11 and Fig. A2) is that only a restricted range of M 1 satisfies the experimental data: 38–42 divisions for mouse colon and 64–71 divisions for mouse small intestine. These values were adopted for simulation. Interestingly, the number of proximate stem cells per niche had little effect on the outcome. An estimate of M 2 can be obtained by solving expression 2 with substitution of T d with experimental values of T w according to expression 5. This substitution indicates, however, that in the range of M 2 values that satisfy the condition imposed by expressions 6, values of T d are less than the experimental values of T w (for details see Appendix, Fig. A3). Formally, this means there is no common solution of (4), (5) for M 1 and M 2, and in the context of the model, such a result means that the experimental spread of the conversion kinetics cannot be explained based on the model assumptions. The best approximation, however, can be achieved by assuming M 1 = M 2. The corresponding T d values are 4.2 and 7.7 weeks for mouse colon and small intestine, respectively, as compared to experimental T w values of 5 and 12.2 weeks.
Figure A2.
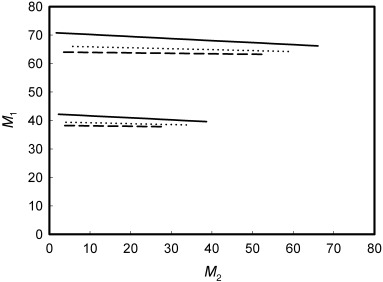
Graphic representation of the solution of Equation A9 for mouse colon (bottom lines, T50 = 3.53 weeks) and small intestine (top lines, T50 = 5.91 weeks). The solution is obtained assuming the cycle time of stem cells (T p) = 16 h, and the number of proximate stem cells (N p) = 4 (solid lines), 8 (dot lines) or 16 (dash lines).
Figure A3.
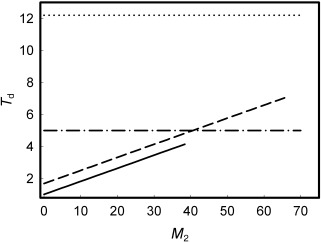
Graphic representation of the solution of (A9) , (A10) for mouse colon (solid and dash‐dot lines, T50 = 3.53 weeks, Tw = 5.01 weeks) and small intestine (dash and dot lines, T50 = 5.91 weeks, Tw = 12.2 weeks). Solid and dash lines show values of T d calculated for various M 2 values according to expression A7, assuming the number of proximate stem cells (N p) = 4 and the cycle time of stem cells (T p) = 16 weeks. Dash‐dot and dot lines represent experimental values of T w (Table 1).
Simulation of the kinetics of stabilization of wholly mutant intestinal crypts in mice
Given the results described in the previous section, our simulations of the kinetics of wholly mutant crypt stabilization assumed that M 1 = M 2. The biological meaning of this assumption is that a proximate stem cell, regardless of its replicative age, retains the ability to fill a niche vacancy. Simulations based on our model generated linear kinetics for wholly mutant crypt stabilization when a threshold dependence (that is, very large k 1 and k 2) was assumed for the probabilities P v and P s (Fig. 3). To ‘smooth’ the kinetics curve edges, we used values of k 1 = k 2 = 10. If smaller values of k 1 and k 2 were used, the simulation results (T 50 and T w values) were dependent on k 1 and k 2.
To account for the large spread in the experimental data, we assumed that there can be significant variation between individual crypts in the value of M 1. The plotted lines in Fig. 2 represent the results of one such simulation where the range of M 1 values used was 46–138 for mouse small intestine and 20–60 for mouse colon, assuming a uniform distribution of the number of crypts over the range of M 1 values. The cycle time of proximate stem cells (T p) was assumed to be 18 h, and the number of proximate stem cells (N p) was assumed to be 4. The average values of M 1 and T p used for simulations were slightly increased compared to those estimated previously, in order to achieve better agreement of the output T 50 values with the experimental data. Values for clonal half‐stabilization time obtained as a result of simulation (3.44 and 5.75 weeks) were close to the expected values (3.53 and 5.91 weeks) for mouse colon and small intestine, respectively (1, 2).
Table 2.
Input parameters and results of simulation
| Mouse colon (Park et al. 1995) | Mouse small intestine (Park et al. 1995) | Mouse small intestine (Winton & Ponder 1990) | Human colorectum (Campbell et al. 1996) | |
|---|---|---|---|---|
| Proximate stem cell cycle time (T p, hours) | 18 | 18 | 18 | 80 |
| Number of proximate stem cells (N p) | 4 | 4 | 4 | 4 |
| Division limit (M 1) | 20–60 | 46–138 | 55–165 | 50–150 |
| Detection threshold | 0.45 | 0.42 | 0.55 | 0.5 |
| Deep stem cell cycle time (T d, weeks) | 3.86 | 7.61 | 9.56 | 30.8 |
| Clonal half‐stabilization time (T 50, weeks) | 3.44 | 5.75 | 6.70 | 25.3 |
| Average probability of vacancy formation (per division of proximate stem cell) | 0.054 | 0.027 | 0.024 | 0.034 |
The cycle time of the deep stem cell (T d) was estimated from the simulation results to be 7.6 weeks in the mouse small intestine and 3.8 weeks in the mouse colon. These values are comparable to the estimated cycle time for mouse primitive haemopoietic stem cells of 4.3 weeks (Bradford et al. 1997). In the context of our model, the difference in the cycle time of the deep stem cell accounts for the variation in the kinetics of wholly mutant crypt appearance between mouse colon and small intestine. This difference in the cycle time of the deep stem cell in turn results from a difference in the number of divisions that proximate stem cells can complete before creating a vacancy. The postulated difference in M 1 values between colonic and small intestinal proximate stem cells could reflect differences in telomerase activity and/or the efficiency of DNA repair functions. Comparison of the simulation results with predictions of the simplified estimation given in the previous section, indicated that simulation generated smaller values for T c than predicted by expression 3. This resulted from the fact that expression 3 implies equal time intervals between consecutive vacancies, whereas in the simulation process, a batch of vacancies separated by less than the T v interval occurs when proximate stem cells approach their proliferative limit.
Simulation of the kinetics of partially mutant intestinal crypts in mice
Simulated kinetics for the appearance of partially mutant crypts are also shown in Fig. 2. The fit to the experimental values of Park et al. (1995) is not as good as that obtained for the wholly mutant crypt values. A discrepancy can be seen in the rapid early appearance of partially mutant crypts, the frequency of which then quickly declines without the appearance of wholly mutant crypts. The simulation predicts an increase in the frequency of partially mutant crypts followed by a decline that is accompanied by the appearance of wholly mutant crypts. The experimental kinetics of partially mutant crypt occurrence might be explained, in the context of the model, by the formation of a partially mutant crypt from a mutant proximate stem cell, followed by the crypt's conversion to the non‐mutated state following division of the deep stem cell. In the context of our model, the contribution of the latter mechanism is, however, not large enough to account for the experimental results.
Winton & Ponder (1990) also studied partially mutant crypt formation in mouse small intestine and observed kinetics that were quite different in some details to those reported by Park et al. (1995) (see Fig. 4), although both studies obtained results for wholly mutant crypt stabilization, that are broadly similar. A simulation of the results of Winton & Ponder (1990) is shown in Fig. 4, and parameter values are summarized in 1, 2. It is interesting to note that, in contrast to the data of Park et al. (1995), the simulation predicts a more rapid appearance of partially mutant crypts than is indicated by the experimental values. The differences in partially mutant crypt kinetics between these two studies may result from the experimental assays used, however, a detailed analysis of this issue is beyond the scope of this report.
Figure 4.
The kinetics of appearance of partially (open symbol) and wholly (closed symbol) mutant crypts in mouse small intestine following treatment with mutagen. Experimental data are from Winton & Ponder (1990). The wholly mutant crypt frequency includes ‘Paneth‐cell crypts’. The lines represent the results of simulation (dashed line is partially mutant crypts and solid line is wholly mutant crypts). The values of the model parameters used for the simulation were: proximate stem cell cycle time (T p) = 18 h; number of proximate stem cells (N p) = 4; mutagen treatment time (T m) = 6 weeks; and the limiting number of divisions (M 1) = 55–165. The simulated values of the clonal half‐stabilization time (T 50) = 6.70 weeks, and the deep stem cell cycle time (T d) = 9.56 weeks.
It is also notable that the experimental data indicate that a significant frequency of partially mutant crypts appear at extended times after mutagen treatment, whereas the simulations predict a more rapid disappearance of such crypts. The continuing appearance of partially mutant crypts may reflect a degree of inter‐crypt variability that is not considered by our model. For example, some crypts may proliferate at a significantly slower rate than others.
Simulation of the kinetics of appearance of mutated intestinal crypts in man
In contrast to the considerable amount of experimental data on the properties of intestinal crypt stem cells in laboratory mice, very little information is available on the number, organization and cycle time of stem cells in human intestinal epithelium. Nevertheless, the study of Campbell et al. (1996) indicated that the form of the kinetics for the appearance of mutated crypts in man may be similar to that observed in mice. All the cases reported in the latter study were combined into groups according to the time interval between radiation and colectomy. Although each group covers quite a wide range of time intervals and there are considerable variations in the levels of mutated crypts in each group, the results show a temporary increase in the frequency of partially mutant crypts, which then decreases at later times, and an increase in the number of wholly mutant crypts, which reaches a plateau level at around 12 months (Fig. 5).
Figure 5.
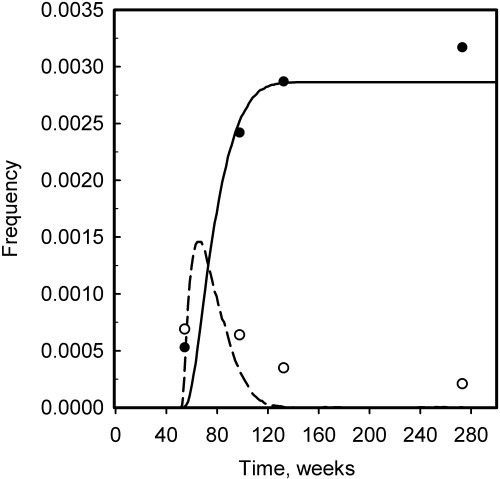
The kinetics of appearance of partially (open symbol) and wholly (closed symbol) mutant crypts in human colorectal specimens at various time intervals after therapeutic irradiation. Data are from Campbell et al. (1996). The lines represent the results of simulation (dashed line is partially mutant crypts and solid line is wholly mutant crypts). The values of the model parameters used for the simulation were: proximate stem cell cycle time (T p) = 80 h; number of proximate stem cells (N p) = 4; mutagen treatment time (T m) = 50 weeks; and the limiting number of divisions (M 1) = 50–150. The simulated values of the clonal half‐stabilization time (T 50) = 30.8 weeks, and the deep stem cell cycle time (T d) = 25.3 weeks.
As no information is available on the cycle time of stem cells in human colorectal crypts, we attempted, for the purpose of simulation, to establish the relationship between values of the division limit M 1, the cycle time of proximate stem cells T p, and the experimental clonal stabilization half‐time (T 50 = 21 weeks for human colorectal crypts (Table 1)). We used the approach described in the first two sections of this chapter and assumed M 1 = M 2. The following relationship can then be obtained from expression 4:
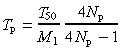 |
(7) |
The relationship between M 1 and T p for T 50 = 21 weeks and N p = 4 is shown in Fig. A4 of the Appendix. This relationship is little affected by the value of N p. It is expected that any pair of M 1 and T p values would produce a clonal half‐stabilization time of T 50 = 21 weeks following simulation. Our simulations used values of T p = 80 h and an M 1 range of 50–150. A broad M 1 range was used as the experimental kinetics data show a large asymmetry such that the interval between half‐stabilization and full stabilization is much longer than the T 50 value. Simulation results are shown graphically in Fig. 5, and the output parameters are summarized in Table 2. These results predict a cycle time for human colorectal deep stem cells of around 30 weeks. The latter value is comparable to estimates of the cycling time of human haemopoietic stem cells (see the Introduction section).
Figure A4.
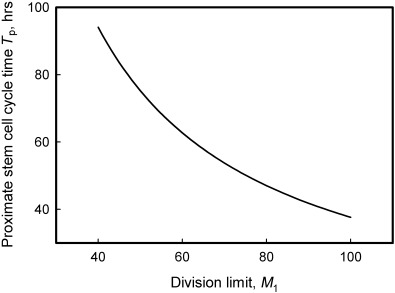
Graphic representation of the solution of Equation 7 (T50= 21 weeks, Np= 4). The relationship between the cycle time and division limit of proximate stem cells, as predicted by the model, based on the human colorectal data of Campbell et al. (1996).
DISCUSSION
‘Ageing’ of the deep stem cell
In our simulations, we assumed that following division of the deep stem cell, the replicative age of the new proximate stem cell was N div = 1. This simplification was made as it avoids assumptions regarding the replicative age of the deep stem cell, and has no effect on simulation results because the deep stem cell undergoes relatively few divisions (two to seven) during the simulated interval (30–50 weeks for mouse and 250 weeks for human crypts). If, however, time intervals comparable to a life span are considered, then the accumulation of divisions by the deep stem cell cannot be ignored. Two issues are worth considering in this context. First, our model predicts that, as a result of the accumulation of divisions by the deep stem cell, the proliferative potential of proximate stem cells will decrease with age, resulting in more frequent formation of vacancies by proximate stem cells, which in turn will result in more frequent divisions of the deep stem cell and a decrease in the clonal half‐stabilization time. Second, to simulate the large spread in the wholly mutant crypt stabilization kinetics, we assumed that the limiting number of divisions M 1 varies between crypts. Alternatively, the same outcome could be achieved by assuming that the limiting number of divisions M 1 is fixed but that there are variations between crypts as to the replicative age of their deep stem cell.
Comparison with results obtained using stochastic models
As noted in the Methods section, both our model and stochastic models (for example, Loeffler et al. 1993) postulate that stem cells can undergo asymmetric or symmetric divisions. A critical difference is, however, that stochastic models postulate a fixed probability for symmetric division, whereas in our model, the probability of symmetric division varies with cell age and occurs when a proximate stem cell exhausts its proliferative potential or when a niche vacancy is formed. The probability of symmetric division in our model can be calculated from our simulation results (that is, it equals the fraction of all simulated proximate stem cell divisions that are symmetric). For example, simulation of the mouse small intestinal data of Winton & Ponder (1990) (shown in Fig. 4) suggested that the probability of a proximate stem cell symmetric division is 0.045 (0.025 for vacancy formation and 0.021 for vacancy filling). Similarly, analysis of Winton & Ponder's (1990) data using the stochastic model suggested that symmetric division occurs at a probability of 0.043–0.045, assuming six stem cells per niche and a stem cell cycle time of 1 day (Loeffler et al. 1993).
Role of crypt fission in mutant crypt stabilization
Similar to previous studies employing ‘niche’ (Williams et al. 1992; Yatabe et al. 2001) or stochastic models (Loeffler et al. 1993), we have attempted to interpret intestinal crypt mutagenesis data using a model for the organization and kinetics of crypt stem cells. An alternative hypothesis that wholly mutant crypts derive from crypt fission was proposed by Park et al. (1995), and was based on their observation that the more rapid stabilization of wholly mutant crypts in mouse colon as compared to small intestine correlated with a higher crypt fission index in the colon. The following probabilistic analysis suggests, however, that crypt fission does not contribute significantly to the formation of wholly mutant crypts. The fission of a partially mutant crypt will result more often in the segregation of partially rather than wholly mutant crypts. For example, consider a crypt that contains four stem cells (cells 1, 2, 3 and 4) of which two are mutant (say cells 2 and 4). Fission of the latter crypt will produce three possible two crypt combinations with equal probability (1/3): (1,2) and (3,4); (1,3) and (2,4); and (1,4) and (2,3). Therefore, a wholly mutant crypt is segregated in only one of these combinations (that is, the second combination), whereas in the other two combinations, partially mutant crypts are segregated. The outcome of this exercise is that after the first cycle of crypt fission, 67% of partially mutant crypts will not have produced a wholly mutant crypt, after the second cycle of fission, 44% (0.6662) will remain without wholly mutant progeny, and so on. In parallel, crypts that have given rise to a wholly mutant crypt will accumulate as follows: 33% after the first cycle of crypt fission, 56% (1–0.44) after the second cycle, and so on; finally reaching 90% after six to seven cycles of crypt fission. Given that the crypt fission cycle time is at least 17 and 51 days in mouse colon and small intestine, respectively (Park et al. 1995), 90% stabilization of mutant crypts can be expected at not earlier than 16 and 47 weeks in mouse colon and small intestine, respectively. The latter values are much greater than the respective experimental crypt stabilization values of 4.6–7 weeks (colon) and 12 weeks (small intestine) (Park et al. 1995). It is also notable that Campbell et al. (1996) observed that wholly mutant crypts in human colorectal samples were rarely adjacent to partially mutant crypts. Such results point to the inconsistency of the crypt fission model.
CONCLUSION
A model postulating a two‐tiered arrangement of stem cells that have a limited replicative lifespan is consistent with intestinal crypt mutagenesis data from mouse and man.
APPENDIX
Probabilities of proximate stem cell vacancy formation (P v) or symmetrical division (P s)
The following expressions describe the probabilities P v and P s:
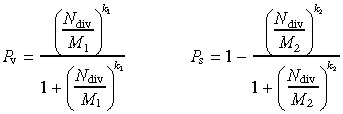 |
(A1) |
Probability curves are presented in Fig. A1 for the parameters values: M 1 = 60, M 2 = 20, k 1 = k 2 = 10.0.
Inter‐relationship between model input and output parameters
The following relationship exists between the deep stem cell cycle time T d and the average time between the formation of consecutive vacancies:
| Td = Tv Nv, | (A2) |
where N v is the number of vacancies formed between consecutive deep stem cell divisions, and is expressed as:
| Nv = Nr + 1, | (A3) |
where N r is the number of times a vacancy is filled by proximate stem cell division between consecutive deep stem cell divisions.
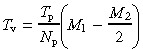
Assuming that vacancy filling by symmetric division of a proximate stem cell is more frequent than by division of the deep stem cell, the average number of divisions that a proximate stem cell undergoes before vacancy formation is M1 − M2/2 (where M2/2 is the average replicative age of a new proximate stem cell, and M 1 is the number of divisions when this cell forms a vacancy). The time for completion of this number of divisions is T p(M 1 − M 2/2). Hence, on average each proximate stem cell forms a vacancy after the latter interval. If there are N p proximate stem cells, then the average time interval between formation of vacancies is decreased by a factor of N p, so
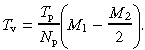 |
(A4) |
Vacancies are filled by proximate stem cell symmetric divisions until there is a proximate stem cell that has completed less than M 2 divisions. The time for the youngest cell to complete these divisions is T p M 2; therefore we can write the following equation:
| TP M2 = Tv Nr | (A5) |
Solving A4 and A5 allows determination of the deep stem cell cycle time (T d):
| Td = Tp M2 + Tv | (A6) |
or
 |
(A7) |
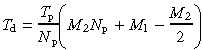
To calculate the time required to convert the proximate stem cell compartment to monoclonality after a deep stem cell division, we assume that N p− 1 vacancies must be filled:
| Tc = Tv(Np − 1) | (A8) |
Crypt stabilization time and the width of the conversion kinetics can be written (according to Fig. 3) as:
| (A9) |
| Tw = Td. | (A10) |
Solution of equation A9 for M 1 after substitution for T d and T c from A6 and A7
 |
(A11) |
This solution for mouse colon and small intestine data (T 50 from Table 1) is presented in Fig. A2 assuming T p = 16 h and considering a few values for the number of proximate stem cells: N p = 4, 8 and 16. Only those solutions are shown that satisfy additional requirements imposed by the model:
| M2 < M1, and M2 > 0 | (A12) |
An estimate of M 2 can be obtained by solving Equation A10 using the expression A7 for T d with M 1 substituted from the solution of A11; or, in other words, by comparing the experimental values of T w with those obtained from expression A7. Figure A3 shows T d values calculated according to expression A7 using the solution for M 1 from A11 for the experimental values of T 50 for mouse colon and small intestine. It follows from these results that in the range of M 2 values satisfying the condition A12, the calculated T d values are less than the experimental values of T w. Formally, this means that there is no common solution of (A9), (A10) for M 1 and M 2.
Details of the simulation procedure
Initialization
The simulation procedure was performed for each of N c crypts. The main operating variable was the elapsed (current) time, which was initialized to 0.0 at the start of simulation. The number of proximate stem cell divisions (i.e. the replicative age) was initialized to a random number in the interval (0, M 1). The number of divisions of the deep stem cell was initialized to 0.
Cell division
Step 1. The time interval between consecutive divisions
Proximate stem cell divisions were considered central events of the simulation procedure that determined the increments of elapsed time. The simulation proceeded by generating a time interval to the next division. The average time interval between consecutive divisions is given by:
| (A13) |
Two methods of assigning a time interval were considered:
-
1
The ‘deterministic’ option assumed a fixed time interval between consecutive divisions equal to the average time interval according to expression A13.
-
2
The ‘stochastic’ option assumed a variable time interval between consecutive divisions calculated according to the expression:
| (A14) |
where R is a random number in the interval (0, 1) and was generated preceding each division.
Following calculation of the time interval, the elapsed time was incremented by this interval.
Step 2. Selection of the proximate stem cell that undergoes division
A choice was made as to which one of the proximate stem cells in a crypt divided. Two options were considered:
-
1
Proximate stem cell division is synchronized such that each cell divides in turn.
-
2
Selection for division is a stochastic process and a stem cell was chosen by generating a random number in the interval (0, N p).
For the cell selected to divide, the time of division was recorded, and the time interval between the previous division of this cell and the current division was calculated. These data were used to build the distribution of cell division intervals for model validation purposes. The average of this distribution must be equal to the cell cycle time.
Step 3. Selection of the type of stem cell division
A choice was made as to whether the division event represented a normal division or the formation of a niche vacancy. This decision was made according to one of two options:
-
1
Vacancy formation was allowed only for the oldest proximate stem cell in the crypt. The probability P v(N div) was calculated (expression A1) and compared with a random number R in the interval (0, 1). If R < P v, vacancy formation occurred, otherwise the event was considered to be a normal division.
-
2
Vacancy formation was allowed for any proximate stem cell regardless of its replicative age. Selection between normal division and vacancy formation was made as in option 1.
If vacancy formation occurred, the replicative age and the current time were recorded, the time interval between the previous and the current vacancy formation event was calculated, and the number of vacancies formed in the crypt was incremented. These data were used to calculate the number of divisions completed before vacancy formation, the average time between formation of consecutive vacancies (T v) and the average number of crypt vacancies formed during the simulation interval.
If this step resulted in a normal division, the replicative age of the dividing cell was incremented, the mutation status of the transit‐amplifying cell was updated, and the simulation returned to step 1. If vacancy formation occurred, the simulation proceeded to step 4.
Step 4. Selection of a stem cell to fill a niche vacancy
A niche vacancy can be filled by division of the deep stem cell or one of the proximate stem cells. Initially, proximate stem cells were assessed with respect to their ability to fill a vacancy. Two options were considered:
-
1
Only the youngest proximate cell (i.e. the cell with the shortest proliferative age) can fill a vacancy. This was implemented by calculating the probability P s(N div) (expression A1) for the cell with the lowest N div and then comparing this probability with a random number R in the interval (0, 1). If R < P s, then the vacancy was filled by division of this cell, otherwise the vacancy was filled by division of the deep stem cell.
-
2
All proximate stem cells can fill a vacancy. This option was implemented by calculating the probability
 for each proximate stem cell, and by generating a random number R in the interval (1, N
p). Partial sums S
k were calculated for k = 1, 2, … , N
p:
for each proximate stem cell, and by generating a random number R in the interval (1, N
p). Partial sums S
k were calculated for k = 1, 2, … , N
p:
 |
(A15) |
and compared with R. The cell with index k was selected to fill a vacancy if S k–1 < R < S k. If R > S Np, then the vacancy was filled by division of the deep stem cell.
If a vacancy was filled by division of a proximate stem cell, then the number of divisions completed by this cell was recorded to build a distribution of cells with respect to the number of divisions completed before vacancy filling. If a vacancy was filled by division of the deep stem cell, then the time of the division was recorded, and the time interval between consecutive divisions of the deep stem cell was calculated. Following vacancy filling, the replicative age of the dividing cell was updated, and the replicative age and mutation status of the new proximate stem cell was recorded.
Induced mutagenesis and detection of mutant crypts
When the elapsed simulation time reached the time of T m, the mutation status of all stem cells was determined based on their probability of mutagenesis (µext). For each stem cell, a random number R was generated in the interval (0, 1) and compared with the probability of mutagenesis. If R < µext, the cell became mutant. For diagnostic purposes, the simulation procedure allowed switching off induced mutagenesis in the deep stem cell, or in proximate stem cells, or in both.
The simulation procedure also allowed consideration of spontaneous mutagenesis by determining the mutation status of cells after each division in a similar way to that described for induced mutagenesis; however, this option was not required in the present study. The mutation status of a crypt was determined as described in the Methods section.
Generating output values
The total simulation time (T s) was separated into a number of equal intervals (usually 100 or 200) to generate output data points. For each crypt, when elapsed time reached the end of each interval, the average fractions of wholly or partially mutant crypts at this time point were updated by determining the mutation status of the crypt being simulated. The average per crypt numbers of deep stem cell divisions and of vacancy filling divisions by proximate stem cells were calculated for each time point.
When elapsed time reached the total simulation time (T s), the simulation terminated. Average values were calculated for the deep stem cell cycle time (T d), the interval between formation of consecutive vacancies (T v) and the interval between division of the deep stem cell and subsequent conversion of the crypt to monoclonality (T c). For model diagnostic purposes, distributions were calculated for proximate stem cells with respect to number of normal divisions, number of divisions completed at the time of vacancy formation and number of divisions completed at the time of symmetrical division to fill a niche vacancy.
ACKNOWLEDGEMENTS
The authors are greatful to Drs Tom Karagiannis and Rob Ramsay for their help.
REFERENCES
- Alison MR, Vig P, Russo F, Bigger BW, Amofah E, Themis M, Forbes S (2004) Hepatic stem cells: from inside and outside the liver? Cell Prolif. 37, 1–21. [DOI] [PMC free article] [PubMed] [Google Scholar]
- Amit M, Carpenter MK, Inokuma MS, Chiu CP, Harris CP, Waknitz. MA, Itskovitz‐Eldor J, Thomson JA (2000) Clonally derived human embryonic stem cell lines maintain pluripotency and proliferative potential for prolonged periods of culture. Dev. Biol. 227, 271–278. [DOI] [PubMed] [Google Scholar]
- Bjerknes M, Cheng H (1999) Clonal analysis of mouse intestinal epithelial progenitors. Gastroenterology 116, 7–14. [DOI] [PubMed] [Google Scholar]
- Blackburn EH (2000) Telomere states and cell fates. Nature 408, 53–56. [DOI] [PubMed] [Google Scholar]
- Blanpain C, Lowry WE, Geoghegan A, Polak L, Fuchs E (2004) Self‐renewal, multipotency, and the existence of two cell populations within an epithelial stem cell niche. Cell 118, 635–648. [DOI] [PubMed] [Google Scholar]
- Bradford GB, Williams B, Rossi R., Bertoncello I (1997) Quiescence, cycling, and turnover in the primitive hematopoietic stem cell compartment. Exp. Hematol. 25, 445–453. [PubMed] [Google Scholar]
- Campbell F, Williams GT, Appleton MAC, Dixon MF, Harris M, Williams ED (1996) Post‐irradiation somatic mutation and clonal stabilisation time in the human colon. Gut 39, 569–573. [DOI] [PMC free article] [PubMed] [Google Scholar]
- Chan SWL, Blackburn EH (2002) New ways not to make ends meet: telomerase, DNA damage proteins and heterochromatin. Oncogene 21, 553–563. [DOI] [PubMed] [Google Scholar]
- Clarke RB, Anderson E, Howell A, Potten CS (2003) Regulation of human breast epithelial stem cells. Cell Prolif. 1, 45–58. [DOI] [PMC free article] [PubMed] [Google Scholar]
- Cooper DD, Spangrude GJ (1999) (R)evolutionary considerations in hematopoietic development. Ann. N. Y. Acad. Sci. 872, 83–93. [DOI] [PubMed] [Google Scholar]
- Ellsworth JL, Schimke RT (1990) On the frequency of metaphase chromosome aberrations in the small intestine of aged rats. J. Gerontol. 45, B94–B100. [DOI] [PubMed] [Google Scholar]
- Engelhardt M, Kumar R., Albanell J, Pettengell R., Han W, Moore MAS (1997) Telomerase regulation, cell cycle, and telomere stability in primitive hematopoietic cells. Blood 90, 182–193. [PubMed] [Google Scholar]
- Faragher RGA (2000) Cell senescence and human aging: where's the link? Biochem. Soc. Trans. 28, 221–226. [DOI] [PubMed] [Google Scholar]
- Forsyth NR, Wright WE, Shay JW (2002) Telomerase and differentiation in multicellular organisms: turn it off, turn it on, and turn it off again. Differentiation 69, 188–197. [DOI] [PubMed] [Google Scholar]
- Gerike TG, Paulus U, Potten CS, Loeffler M (1998) A dynamic model of proliferation and differentiation in the intestinal crypt based on a hypothetical intraepithelial growth factor. Cell Prolif. 31, 93–109. [DOI] [PMC free article] [PubMed] [Google Scholar]
- Harman D (1992) Free radical theory of aging. Mutat. Res. 275, 257–266. [DOI] [PubMed] [Google Scholar]
- Hastie ND, Dempster M, Dunlop MG, Thompson AM, Green DK, Allshire RC (1990) Telomere reduction in human colorectal carcinoma and with ageing. Nature 346, 866–868. [DOI] [PubMed] [Google Scholar]
- Heddle JA, Cosentino L, Dawod G, Swiger RR, Paashuis‐Lew Y (1996) Why do stem cells exist? Environ. Mol. Mutagen. 28, 334–341. [DOI] [PubMed] [Google Scholar]
- Hemann MT, Greider CW (2000) Wild‐derived inbred mouse strains have short telomeres. Nucleic Acids Res. 28, 4474–4478. [DOI] [PMC free article] [PubMed] [Google Scholar]
- Kay HEM (1965) How many cell generations? Lancet 2, 418–419. [DOI] [PubMed] [Google Scholar]
- Kipling D, Cooke HJ (1990) Hypervariable ultra‐long telomeres in mice. Nature 347, 400–402. [DOI] [PubMed] [Google Scholar]
- Loeffler M, Birke A, Winton D, Potten C (1993) Somatic mutation, monoclonality and stochastic models of stem cell organization in the intestinal crypt. J. Theor. Biol. 160, 471. [DOI] [PubMed] [Google Scholar]
- Mahmud N, Devine SM, Weller KP, Parmar S, Sturgeon C, Nelson MC, Hewett T, Hoffman R (2001) The relative quiescence of hematopoietic stem cells in nonhuman primates. Blood 97, 3061–3068. [DOI] [PubMed] [Google Scholar]
- Marley SB, Lewis JL, Davidson RJ, Roberts IAG, Dokal I, Goldman JM, Gordon MY (1999) Evidence for a continuous decline in haemopoietic cell function from birth: application to evaluating bone marrow failure in children. Br. J. Haematol. 106, 162–166. [DOI] [PubMed] [Google Scholar]
- Martin K, Potten CS, Roberts SA, Kirkwood TBL (1998) Altered stem cell regeneration in irradiated intestinal crypts of senescent mice. J. Cell Sci. 111, 2297–2303. [DOI] [PubMed] [Google Scholar]
- Meinzer HP, Sandblad B (1986) Evidence for cell generation controlled proliferation in the small intestinal crypt. Cell Tissue Kinet. 19, 581–590. [DOI] [PubMed] [Google Scholar]
- Merritt AJ, Potten CS, Watson AJM, Loh DY, Nakayama KI, Nakayama K, Hickman JA (1995) Differential expression of bcl‐2 in intestinal epithelia. Correlation with attenuation of apoptosis in colonic crypts and the incidence of colonic neoplasia. J. Cell Sci. 108, 2261–2271. [DOI] [PubMed] [Google Scholar]
- Morris JA (1994) Stem cell kinetics and intestinal cancer. Anticancer Res. 14, 2073–2076. [PubMed] [Google Scholar]
- Morris JA (1999) The kinetics of epithelial cell generation: its relevance to cancer and ageing. J. Theor. Biol. 199, 87–95. [DOI] [PubMed] [Google Scholar]
- Oh H, Taffet GE, Youker KA, Entman ML, Overbeek PA, Michael LH, Schneider MD (2001) Telomerase reverse transcriptase promotes cardiac muscle cell proliferation, hypertrophy, and survival. Proc. Natl. Acad. Sci. USA 98, 10308–10313. [DOI] [PMC free article] [PubMed] [Google Scholar]
- Olovnikov AM (1996) Telomeres, telomerase, and aging: origin of the theory. Exp. Gerontol. 31, 443–448. [DOI] [PubMed] [Google Scholar]
- Park HS, Goodlad RA, Wright NA (1995) Crypt fission in the small intestine and colon. A mechanism for the emergence of G6PD locus‐mutated crypts after treatment with mutagens. Am. J. Pathol. 147, 1416–1427. [PMC free article] [PubMed] [Google Scholar]
- Potten CS (1998) Stem cells in gastrointestinal epithelium: numbers, characteristics and death. Philos. Trans. R. Soc. Lond. B. Biol. Sci. 353, 821–830. [DOI] [PMC free article] [PubMed] [Google Scholar]
- Potten CS, Loeffler M (1990) Stem cells: attributes, cycles, spirals, pitfalls and uncertainties. Lessons for and from the crypt. Development 110, 1001–1020. [DOI] [PubMed] [Google Scholar]
- Potten CS, Owen G, Booth D (2002) Intestinal stem cells protect their genome by selective segregation of template DNA strands. J. Cell Sci. 115, 2381–2388. [DOI] [PubMed] [Google Scholar]
- Radford IR, Lobachevsky PN (2006) An enteroendocrine cell–based model for a quiescent intestinal stem cell niche. Cell Prolif. 39. [DOI] [PMC free article] [PubMed] [Google Scholar]
- Ries LAG, Eisner MP, Kosary CL, Hankey BF, Miller BA, Clegg L, Mariotto A, Feuer EJ, Edwards BK, (eds.) (2004) SEER Cancer Statistics Review, 1975–2001, National Cancer Institute. Bethesda, MD, http://seer.cancer.gov/csr/1975_2001/ . [Google Scholar]
- Roegiers F, Jan YN (2004) Asymmetric cell division. Curr. Opin. Cell Biol. 16, 195–205. [DOI] [PubMed] [Google Scholar]
- Rufer N, Brummendorf TH, Kolvraa S, Bischoff C, Christensen K, Wadsworth L, Schulzer M, Lansdorp PM (1999) Telomere fluorescence measurements in granulocytes and T lymphocyte subsets point to a high turnover of hematopoietic stem cells and memory T cells in early childhood. J. Exp. Med. 190, 157–167. [DOI] [PMC free article] [PubMed] [Google Scholar]
- Sedelnikova OA, Horikawa I, Zimonjic DB, Popescu NC, Bonner WM, Barrett JC (2004) Senescing human cells and ageing mice accumulate DNA lesions with unrepairable double‐strand breaks. Nat. Cell Biol. 6, 168–170. [DOI] [PubMed] [Google Scholar]
- Slorach EM, Campbell FC, Dorin JR (1999) A mouse model of intestinal stem cell function and regeneration. J. Cell Sci. 112, 3029–3038. [DOI] [PubMed] [Google Scholar]
- Smogorzewska A, De Lange T (2002) Different telomere damage signaling pathways in human and mouse cells. EMBO J. 21, 4338–4348. [DOI] [PMC free article] [PubMed] [Google Scholar]
- Tahara H, Yasui W, Tahara E, Fujimoto J, Ito K, Tamai K, Nakayama J, Ishikawa F, Tahara E, Ide T (1999) Immuno‐histochemical detection of human telomerase catalytic component, hTERT, in human colorectal tumor and non‐tumor tissue sections. Oncogene 18, 1561–1567. [DOI] [PubMed] [Google Scholar]
- Taylor RW, Barron MJ, Borthwick GM, Gospel A, Chinnery PF, Samuels DC, Taylor GA, Plusa SM, Needham SJ, Greaves LC, Kirkwood TBL, Turnbull DM (2003) Mitochondrial DNA mutations in human colonic crypt stem cells. J. Clin. Invest. 112, 1351–1360. [DOI] [PMC free article] [PubMed] [Google Scholar]
- Van Zant G, Liang Y (2003) The role of stem cells in aging. Exp. Hematol. 31, 659–672. [DOI] [PubMed] [Google Scholar]
- Von Zglinicki T (2002) Oxidative stress shortens telomeres. Trends Biochem. Sci. 27, 334–339. [DOI] [PubMed] [Google Scholar]
- Vickers M, Brown GC, Cologne JB, Kyoizumi S (2000) Modelling haemopoietic stem cell division by analysis of mutant red cells. Br. J. Haematol. 110, 54–62. [DOI] [PubMed] [Google Scholar]
- Williams ED, Lowes AP, Williams D, Williams GT (1992) A stem cell niche theory of intestinal crypt maintenance based on a study of somatic mutation in colonic mucosa. Am. J. Pathol. 141, 773–776. [PMC free article] [PubMed] [Google Scholar]
- Williams ED, Williams GT (2000) Cancer, somatic mutation and stem cells. J. Theor. Biol. 205, 165–166. [DOI] [PubMed] [Google Scholar]
- Winton DJ, Ponder BAJ (1990) Stem‐cell organization in mouse small intestine. Proc. R. Soc. Lond. B. Biol. Sci. 241, 13–18. [DOI] [PubMed] [Google Scholar]
- Wong MH, Saam JR, Stappenbeck TS, Rexer CH, Gordon JI (2000) Genetic mosaic analysis based on Cre recombinase and navigated laser capture microdissection. Proc. Natl. Acad. Sci. USA 97, 12601–12606. [DOI] [PMC free article] [PubMed] [Google Scholar]
- Wright NA (2000) Epithelial stem cell repertoire in the gut: clues to the origin of cell lineages, proliferative units and cancer. Int. J. Exp. Pathol. 81, 117–143. [DOI] [PMC free article] [PubMed] [Google Scholar]
- Wright WE, Shay JW (2002) Historical claims and current interpretations of replicative aging. Nat. Biotechnol. 20, 682–688. [DOI] [PubMed] [Google Scholar]
- Yamashita YM, Jones DL, Fuller MT (2003) Orientation of asymmetric stem cell division by the APC tumor suppressor and centrosome. Science 301, 1547. [DOI] [PubMed] [Google Scholar]
- Yatabe Y, Tavare S, Shibata D (2001) Investigating stem cells in human colon by using methylation patterns. Proc. Natl. Acad. Sci. USA. 98, 10839–10844. [DOI] [PMC free article] [PubMed] [Google Scholar]
- Zahn RK, Zahn‐Daimler G, Ax S, Reifferscheid G, Waldmann P, Fujisawa H, Hosokawa M (2000) DNA damage susceptibility and repair in correlation to calendric age and longevity. Mech. Ageing Dev. 119, 101–112. [DOI] [PubMed] [Google Scholar]