

Abstract
Objectives: Among the many pathological aspects of Down syndrome, brain hypoplasia and mental retardation have been recently ascribed to defective proliferation of neural precursors during central nervous system development. By analogy, other features of Down syndrome, such as heart defects, gastrointestinal abnormalities, craniofacial dystrophy and reduced growth rate could be related, at least in theory, to similar proliferation impairment in peripheral tissues.
Materials and methods: In order to test this hypothesis, we evaluated cell proliferation in peripheral tissues of the Ts65Dn mouse, one of the animal models most commonly used to investigate Down syndrome.
Results: In fibroblast cultures from neonatal Ts65Dn mice, we found that cell proliferation was notably impaired. While length of the cell cycle was similar in fibroblasts from Ts65Dn and control mice, the number of actively proliferating cells was significantly smaller in Ts65Dn mice. Moreover, fibroblasts from Ts65Dn animals exhibited limited population‐doubling capacity, decreased proliferative lifespan and premature senescence. Analysis of cell proliferation in the skin of neonates, in vivo, showed that in Ts65Dn mice, cell proliferation was significantly reduced compared to control mice.
Conclusions: Our results suggest that defective proliferation may be a generalized feature of trisomic mice. In view of the genetic and phenotypic similarities between Ts65Dn mice and individuals with Down syndrome, proliferation impairment in various organs may also occur in subjects with Down syndrome. Thus, perturbation of a basic developmental function, cell proliferation, may be a critical determinant that contributes to the many aspects of pathology of this condition.
Introduction
Down syndrome (DS), which arises from trisomy of human chromosome 21 (HSA21), is the leading cause of genetically defined intellectual disability. Some of the neurological abnormalities observed in people with DS have been ascribed to overall reduction in brain size. Reduced brain size has been described in infants and even foetuses with DS (1, 2, 3, 4), suggesting the existence of early developmental defects, rather than late‐occurring degenerative processes, in the aetiology of this abnormality. Indeed, recent evidence demonstrates that neuronal precursors in the DS foetal brain exhibit notable proliferation impairment (5, 6). In addition to mental retardation, DS is characterized by dysfunction of other organs, mainly heart defects, gastrointestinal anomalies, craniofacial dystrophy and haematological/immunological abnormalities (7, 8, 9, 10, 11, 12, 13, 14, 15, 16, 17). Reduced growth rate, short stature and brachycephaly are also features of DS (18, 19, 20, 21). All these abnormalities point at a generalized developmental defect in pathogenesis of the disease. The mechanism by which trisomy of HSA21 affects body development of people with DS, however, is still unknown.
In the past few years, many trisomic mouse models of DS have been proposed, carrying complete or segmental trisomy of mouse chromosome 16 (Mmu16), the distal portion of which is syntenic to HSA21 (22, 23, 24, 25, 26, 27, 28, 29, 30). Ts65Dn mice, the animal model most commonly used to demonstrate DS, carry an extra copy of the distal portion of Mmu16 (22, 24, 31) and are trisomic for about 50% of HSA21 genes (32, 33). Ts65Dn mice show striking similarities with DS phenotype, including lag in growth and small body size (34), intestinal anomalies (35), alterations in the craniofacial skeleton (36, 37), cardiac abnormalities (38), immunological defects (39, 40), and reduced number of cortical, hippocampal and cerebellar neurones (5, 41, 42, 43, 44, 45).
Recent evidence clearly indicates that defective proliferation of neural precursors, accompanied by impaired acquisition of neuronal phenotype and increased cell death, is responsible for brain hypocellularity and hypoplasia both in Ts65Dn mice and people with DS (5, 6, 44). So far, no study has addressed the hypothesis that cell proliferation in other organs may also be impaired and that this might contribute to the various anomalies seen in people with DS. In the current study, we have addressed this issue and examined proliferation in different tissues of Ts65Dn and control mice. Results show that lag in growth observed in newborn Ts65Dn mice is accompanied by decrease of cell proliferation in peripheral tissues.
Materials and methods
Ts65Dn mouse colony
Female Ts65Dn mice carrying partial trisomy of chromosome 16 (23, 24) were obtained from Jackson Laboratories (Bar Harbor, ME, USA) and were maintained at the original genetic background by mating them to C57BL/6JEi × C3SnHeSnJ (B6EiC3) F1 males. Animals were karyotyped by fluorescence in situ hybridization, as previously described (46). Day of birth was designated postnatal day (P) zero and animals of 24 h of age were considered as 1‐day‐old animals (P1). Animal health and comfort were appropriately veterinarily controlled with access to food and water ad libitum and living with 12 : 12 h dark/light cycle. A total of 12 control and 12 Ts65Dn mice of both sexes were used. For evaluation of body weight, we used additional animals (18 control and 18 Ts65Dn mice of both sexes). Experiments were performed in accordance with Italian and European Community law for the use of experimental animals approved by the Bologna University Bioethical Committee. In this study, all effort was made to minimize animal suffering and to keep to a minimum numbers of animals used.
Cell cultures and estimation of population doubling
Primary cultures of mouse fibroblasts were obtained from the tail of single P2 pups, as previously described (47). After dissociation of the tissue, cells were plated (passage 0) in Dulbecco's modified Eagle's medium supplemented with 10% foetal bovine serum, 2 mm glutamine, 100 µg/ml penicillin and 50 µg/ml streptomycin (Sigma, St. Louis, MO, USA). Cells were grown in 5% CO2 humidified atmosphere at 37 °C. When monolayer cultures at passage 0 had reached 80–90% confluence (4–5 days), cells were collected and then cultured in 3T3‐like flasks (48) by plating 1 × 10⁴ cells/cm2 every 3 days. Experiments (except where otherwise stated) were performed with cells at passage two in culture. For measurement of population doublings (PD), at the end of each passage cells were harvested and were counted using a haemocytometer chamber and the trypan blue exclusion method. PD was calculated from passages 1 to 5 using the formula (49):
| PD = [log10(Ni/N0)*3.33] |
where N 0 was the seeded cell number and N i cell harvest number at each passage. Cumulative PD plots were obtained by adding PD calculated at each passage to PD of the previous passage.
Immunofluorescence cytochemistry
Fibroblasts, plated on coverslips (1 × 10⁴ cells/cm2), were fixed for 30 min with 4% paraformaldehyde in 120 mm sodium phosphate buffer, pH 7.4, and then washed in phosphate‐buffered saline (PBS). Coverslips were then incubated with 2 N HCl for 30 min and were washed extensively in PBS. Samples were incubated overnight at 4 °C with mouse anti‐5‐bromo‐2‐deoxyuridine (BrdUrd) monoclonal antibody (dilution 1 : 100; Roche Applied Science, Basel, Switzerland) in blocking buffer (1% bovine serum albumin, 0.1% Triton X‐100 in PBS). Cells were then incubated with Cy3‐conjugated anti‐mouse secondary antibody (dilution 1 : 200; Sigma). After all incubations, specimens were washed extensively with PBS containing 0.1% Triton X‐100 (PBS‐T). To decorate actin filaments (F‐actin), fibroblasts were fixed, washed, permeabilized with PBS‐T and incubated with fluorescein isothiocyanate‐conjugated phalloidin (dilution 1 : 200; Sigma) for 1 h at room temperature. All samples were counterstained with Hoechst‐33258 dye.
Cell‐cycle analysis
For determination of total cell‐cycle length (T C) and S‐phase length (T S) of cultured fibroblasts, the BrdUrd cumulative method was applied (50, 51, 52). Cells were plated on coverslips (1 × 10⁴ cells/cm2) and after 24 h they were treated with 10 µm BrdUrd for 2, 6, 12, 24, 30 and 36 h, then fixed and processed for BrdUrd immunofluorescence (see above). The labelling index (number of BrdUrd‐positive cells over total cell number) was evaluated in 12 random fields for each sample. Labelling index values obtained at each time point for control and Ts65Dn fibroblasts were then plotted as function of time after BrdUrd administration. Changes in labelling index values over time exhibited the following behaviour. Initially, labelling index values increased, as additional cells passed through the S‐phase. Subsequently, labelling indices reached their maximum and remained constant, as all cycling cells were labelled (Fig. 2c). Using linear regression, two least‐square lines (y = a*x + b) were best‐fitted to data points for each group. Maximum labelling index value corresponded to growth fraction (GF) and time at which this occured (x GF) corresponded to the interval T C–T S. Thus the y‐intercept (b parameter of the equation, that is, labelling index at x = 0) corresponds to (T S/T C)*GF. By solving the system of equations with two variables:
Figure 2.
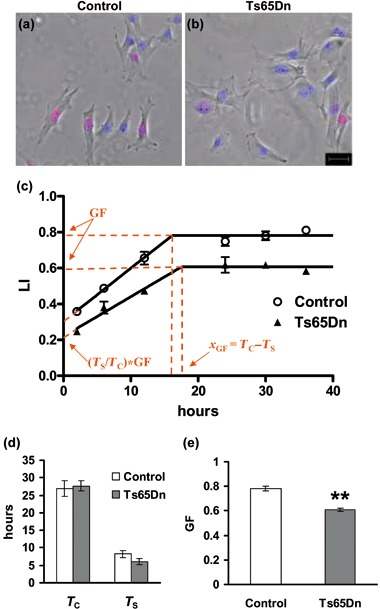
Cell cycle analysis in cultures of fibroblasts from control and Ts65Dn mice. BrdUrd immunofluorescence of control (a) and Ts65Dn (b) fibroblasts at the second passage in culture incubated for 6 h with 10 µm BrdUrd. Final pictures were obtained by merging BrdUrd (red) and Hoechst nuclear staining (blue) fluorescence images with corresponding phase‐contrast images (grey). Scale bar (20 µm) applies to (a) and (b). (c) Cumulative labelling indices in control (white circles) and Ts65Dn (black triangles) fibroblasts as function of time after BrdUrd administration (time 0). Cells, at the second passage in culture, were incubated with 10 µm BrdUrd for increasing time intervals (2, 4, 6, 12, 24, 30 or 36 h) and processed for BrdUrd immunofluorescence. Parameters used for cell cycle time length measurement are indicated in red (see Materials and methods). (d) Total cell cycle (T C) and S‐phase (T S) length of time for fibroblasts from control and Ts65Dn mice. T C and T S were calculated as explained in the Materials and methods section. (e) Growth fraction (GF: the pool of actively proliferating cells over total cell number) of fibroblasts from control and Ts65Dn mice. Values in (c–e) are the mean ± standard error of the mean of independent fibroblast cultures (three control and three Ts65Dn mice). **P < 0.01 (Student's t‐test).
| (TS/TC)*GF = b |
| (TC – TS) = xGF |
T C and T S could be calculated:
| TC = GF/a |
| TS = b/a. |
Senescence‐associated β‐galactosidase assay
For determination of number of senescent cells, fibroblasts were seeded on coverslips (1 × 10⁴ cells/cm2). After 24 h, cells were washed in PBS, fixed for 5 min in 3% paraformaldehyde, processed for senescence‐associated β‐galactosidase (SA‐β‐gal) staining as previously described (53), and were lightly counterstained with haematoxylin (Vector Laboratories, Burlingame, CA, USA). Percentage of SA‐β‐gal‐positive cells over total cell number was determined in six random fields for each sample.
Flow cytometry
Analysis by flow cytometry of cell DNA content was performed as previously described (54). Cells were harvested, collected (including detached cells in the medium) by centrifugation, and were incubated in ice for 10 min. Cells were then stained with propidium iodide for 30 min at 4 °C (propidium iodine 50 µg/ml, tri‐sodium citrate 0.1%, RNAse A 0.1 mg/ml, Triton‐X100 0.1%). DNA content of cells was measured using the EPICS‐XL flow cytometer (Beckman Coulter, Fullerton, CA, USA).
Histological procedures
To determine amounts of proliferating cells in vivo, P2 mice (three control and three Ts65Dn mice) received a single subcutaneous injection (100 µg/g body weight) of BrdUrd in 0.9% NaCl solution. Animals were sacrificed 2 h after BrdUrd injection; skin samples of approximately 1 cm2 were then dissected from the dorsal sides, and were fixed and processed for paraffin wax embedding as previously described (5). Embedded samples were microtome‐sectioned at 8 µm and were attached to poly‐lysine‐coated slides. Anti‐BrdUrd immunohistochemistry was performed as previously described (5) with anti‐BrdUrd mouse monoclonal antibody (dilution 1 : 100; Roche Applied Science). Detection was performed using horseradish peroxidase‐conjugated anti‐mouse antibody (dilution 1 : 100; Amersham Biosciences, Uppsala, Sweden) followed with a DAB kit (Vector Laboratories) and finally counterstained with toluidine blue. BrdUrd‐positive cells were counted at the epidermal germinative basal cell layer. The number of BrdUrd‐positive cells over total cell number (labelling index) was measured in six sections (96 µm apart) for each sample.
Microscopy
Bright field images were taken using a Leitz Diaplan microscope equipped with a motorized stage and a Coolsnap‐Pro colour digital camera (Media Cybernetics, Silver Spring, MD, USA). Fluorescence and phase contrast images were taken using an Eclipse TE 2000‐S inverted microscope (Nikon Corp., Kawasaki, Japan), equipped with an AxioCam MRm (Zeiss, Oberkochen, Germany) digital camera.
Statistical analysis
Results are presented as mean ± standard errors of the mean and statistical testing was performed using the two‐tailed Student's t‐test. A probability level of P < 0.05 was considered statistically significant.
Results
Ts65Dn mice exhibit reduced postnatal growth
No gross developmental delay appeared to be present during gestation in Ts65Dn compared to control mice (34, 45). We measured body weight of Ts65Dn mice at P2, P7 and P30 and in adulthood (15 months). In agreement with previous evidence (34), we found that at all postnatal ages examined, Ts65Dn mice had a lower body weight compared to control littermates (Table 1). Body mass of Ts65Dn mice was low compared to control littermates by ~22% at P2 and ~35% at P7 as well as at all following ages. This indicates that Ts65Dn mice exhibited growth impairment that was already present shortly after birth. Body weight difference became more prominent during the first postnatal week and, thereafter, settled to a value that was retained across all ages.
Table 1.
Body weight of control and Ts65Dn mice
| Control | Ts65Dn | Percentage of control | |
|---|---|---|---|
| P2 | 1.79 ± 0.06 | 1.39 ± 0.04 b | 77.83 |
| P7 | 4.76 ± 0.22 | 3.08 ± 0.26 a | 64.68 |
| P30 | 14.35 ± 0.94 | 9.36 ± 1.24 a | 65.24 |
| 15 months | 41.57 ± 2.39 | 26.53 ± 0.86 a | 63.81 |
Body weights (in grams) during early postnatal development (P2, P7 and P30) and in adulthood (15 months), are the mean ± standard error of the mean obtained from 6–12 control and 6–12 Ts65Dn mice of both sexes at each time point. In the right column, the body weight of Ts65Dn mice is expressed as percentage with respect to control animals. The letters indicate a difference between control and Ts65Dn mice of corresponding age a P < 0.005; b P < 0.001 (Student's t‐test).
Impaired proliferation of fibroblasts from Ts65D mice
Low body mass of Ts65Dn mice suggests that expansion of their body tissues takes place at a lower rate than those of control mice. Growth impairment may be ascribed to one or a combination of the following processes: reduced number of proliferating cells, reduced proliferation rate and/or increased apoptotic cell death. In order to obtain information on possible alterations of these processes in Ts65Dn mice, we examined cell proliferation in cultures of fibroblasts from newborn (P2) Ts65Dn and control mice.
We first evaluated proliferation of fibroblasts by uptake of BrdUrd, a thymidine analogue that is incorporated by proliferating cells during the S‐phase of cell cycle. We found that fibroblasts from Ts65Dn mice had 30% reduction in BrdUrd incorporation with respect to controls, indicating substantial proliferation impairment (Fig. 1a). We then evaluated percentage of apoptotic cells by flow cytometric analysis of the sub‐G1 peak, which is considered to indicate proportion of apoptotic cells over total (55). We found that percentage of apoptotic cells over total cell number was very low (less then 4%). Comparison of Ts65Dn and control mice, however, showed that in Ts65Dn mice apoptotic cell death was increased by a factor two compared to control mice (3.38% vs. 2.19%, respectively; P < 0.05; Table 2). To confirm this finding, we evaluated apoptotic cell death also based on pyknotic appearance of nuclei of dying cells. Results showed that percentage of pyknotic nuclei over total nuclei present in cultures (assayed by Hoechst nuclear staining) was higher in Ts65Dn mice with respect to controls (3.79% vs. 1.67%, respectively; Fig. 1b). Although these data indicate that fibroblasts underwent more pronounced apoptosis in trisomic compared to control mice, absolute number of apoptotic cells was very low, indicating that reduced number of BrdUrd‐positive cells found in cultures from Ts65Dn mice would mainly have been attributable to other mechanisms. Namely, reduced proliferation of fibroblasts from Ts65Dn mice may have been a consequence of increased length of the cell cycle and/or reduced number of actively proliferating cells. To distinguish between these two possibilities, we measured cell‐cycle length and size of the pool of proliferating cells (the growth fraction, GF).
Figure 1.
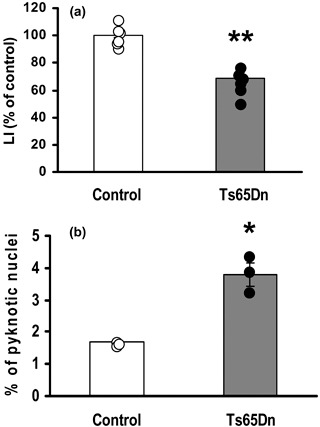
Cell proliferation and apoptotic cell death in cultures of fibroblasts from control and Ts65Dn mice. (a) Number of BrdUrd‐positive cells at the second passage in culture. Results are expressed as percentage of control values and were obtained from independent cultures (six control and six TS65Dn mice). (b) Number of pyknotic nuclei evaluated in Hoechst‐stained cultures at the second passage. The number of pyknotic nuclei was expressed as percentage of total number of nuclei and was obtained from independent fibroblast cultures (three control and three Ts65Dn mice). Data in histograms (a) and (b) are mean ± standard error of the mean. Dots indicate data from single animals. *P < 0.01; **P < 0.001 (Student's t‐test).
Table 2.
Flow cytometry of DNA content of fibroblasts from control and Ts65Dn mice
| Control | Ts65Dn | |
|---|---|---|
| Sub‐G1 (apoptotic cells) | 2.19 ± 0.46 | 3.38 ± 0.10 a |
| Diploid G0/G1 (2N cells) | 43.93 ± 0.68 | 34.78 ± 0.21 b |
| S‐phase | 23.73 ± 0.46 | 17.23 ± 0.88 b |
| Tetraploid G2/M + binucleate G0/G1 (4N) | 30.13 ± 0.46 | 42.70 ± 0.57 b |
Values (mean ± standard error of the mean) represent the percentage of cells in each fluorescence‐activated cell sorting peak obtained from independent cultures at the second passage (four control and four TS65Dn mice). a P < 0.05; b P < 0.01 (Student's t‐test).
Total cell‐cycle length (T C), S‐phase length (T S) and GF can be estimated by BrdUrd‐cumulative labelling. According to this protocol, successive cohorts of cells entering S‐phase were labelled with BrdUrd at consecutive time intervals. Fibroblast cultures from P2 Ts65Dn and control mice at the second passage in culture were incubated with BrdUrd for increasing time periods, then were fixed and processed for BrdUrd immunofluorescence cytochemistry and were counterstained with Hoechst nuclear staining (Fig. 2a,b). Labelling indices for control and Ts65Dn fibroblasts at different time points were plotted as function of time after BrdUrd administration (Fig. 2c). GF, T C and T S were calculated as described in the Materials and methods section. Cell‐cycle analysis revealed no significant difference in total cell‐cycle length between fibroblasts from Ts65Dn and control mice and slight, although not significant, reduction in length of the S‐phase (Fig. 2d). In contrast, GF was significantly smaller (–18%) in cultures from Ts65Dn mice, indicating that the reduced number of BrdUrd‐positive cells observed 2 h after BrdUrd administration in cultures from Ts65Dn mice was due to low size of the pool of actively proliferating cells and not to a slower cycling rate (Fig. 2e).
Ts65Dn fibroblasts undergo premature senescence
Evaluation of population doubling (PD) over time provides an estimate of overall proliferation capacity of a cell population. Control and Ts65Dn fibroblasts were cultured up to fifth passage and numbers of cells at the end of each passage were counted to determine the PD. Cumulative PD plots for Ts65Dn and control fibroblasts (Fig. 3) showed that Ts65Dn cells were capable of a limited number of PD in culture. Consistent with previous published data, fibroblasts from control mice were capable of around six to seven PDs in culture (56), whereas Ts65Dn cells did not attain more than three PDs. A strong decrease in number of cells produced in Ts65Dn cultures was detectable from the second passage and became dramatic from the third, when very few new cells were produced in Ts65Dn cultures. Strong decrease in cell number over time in Ts65Dn cultures was not due to increase in apoptotic cell death, as examination of pyknotic cells at passages 3–5 (data not shown) indicated that at each passage, percentage of pyknotic cells was similar to that found at the second passage (see Fig. 1b). These findings indicate that TS65Dn fibroblasts had very short proliferative lifespan and exhibited remarkably premature cessation of proliferation with respect to control cells.
Figure 3.
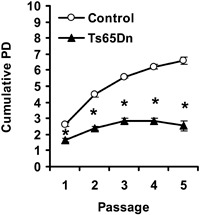
Cumulative population doublings (PD) in cultures of fibroblasts from control and Ts65Dn mice. PD was evaluated for passages 1–5, as indicted in the Materials and methods section. Values are mean ± standard error of the mean from independent fibroblast cultures (six control and six Ts65Dn mice). *P < 0.0001 (Student's t‐test).
In view of the pattern of PDs in Ts65Dn mouse cells, with cessation of proliferation after a few passages in culture, we postulated that Ts65Dn fibroblasts might suffer premature entry into a senescence‐like state. This hypothesis was corroborated by features of fibroblasts from Ts65Dn mice, which had typical morphology of senescent cells. Ts65Dn fibroblasts (Fig. 4 and see also Fig. 6) acquired (starting from the first passage in culture) enlarged and flattened shape, characterized by increased filamentous actin bundles (F‐actin) and larger nuclei, numerous cells with presence of two or more nuclei (polyploidy). Polyploid cells accumulated large amounts of DNA compared to diploid cells, due to DNA synthesis without cell division (57) and presence of polyploidy in some types of mammalian cell is generally considered to indicate cell senescence (58). All features observed in Ts65Dn fibroblasts were established stigmata of senescence (56, 59, 60, 61, 62) detectable in Ts65Dn cultures as early as first passage in culture, with their number progressively higher at subsequent passages. As increase in the number of binucleate cells was particularly evident in early passages, we evaluated numbers of binucleate cells over total cell number, in Hoechst‐stained cultures, at the second passage. Results indicate that Ts65Dn mice had 45% more binucleate cells (Fig. 5a) compared to controls (12.4% and 8.5%, respectively, P < 0.05).
Figure 4.
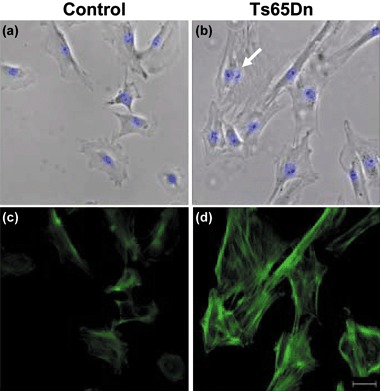
Morphology of fibroblasts from control and Ts65Dn mice. (a–d) Images of fibroblasts at the second passage in culture from a control (a, c) and a Ts65Dn (b, d) mouse. (a, b) Phase‐contrast images merged with Hoechst nuclear staining fluorescent images. The arrow in (b) indicates a binucleate fibroblast. Note the enlarged morphology of fibroblasts from the Ts65Dn mouse. (c, d) Images showing actin fibres (F‐actin), visualized with fluorescein isothiocyanate‐conjugated phalloidin. Note the intense network of F‐actin in fibroblasts from the Ts65Dn mouse, a sign of senescence. Scale bar (20 µm) applies to (a–d).
Figure 6.
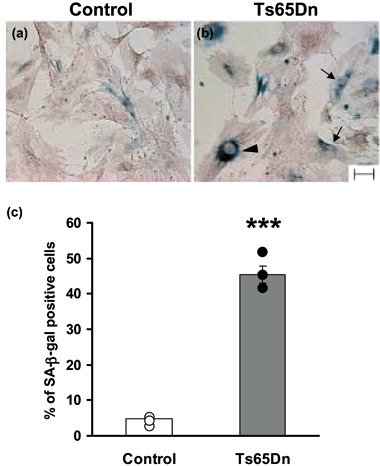
Quantification of senescent cells. (a, b) Examples of fibroblasts at fourth passage in culture from a control (a) and a Ts65Dn (b) mouse. Fibroblasts were stained for senescence‐associated β‐galactosidase activity (SA‐β‐gal; blue) and lightly counterstained with haematoxylin (light brown). Note the increased number of SA‐β‐gal‐positive cells strongly blue stained in the Ts65Dn fibroblast culture. Other features of senescent cells are also visible in Ts65Dn cells: binucleate cells (arrows) and cells with enlarged nuclei (arrowhead). Scale bar (50 µm) applies to (a) and (b). (c) Quantification of the number of SA‐β‐gal‐positive cells at fourth passage in culture in control and Ts65Dn mice. Data in the histogram are mean ± standard error of the mean from independent fibroblast cultures (three control and three Ts65Dn mice). Dots indicate data from single animals. ***P < 0.0001 (Student's t‐test).
Figure 5.
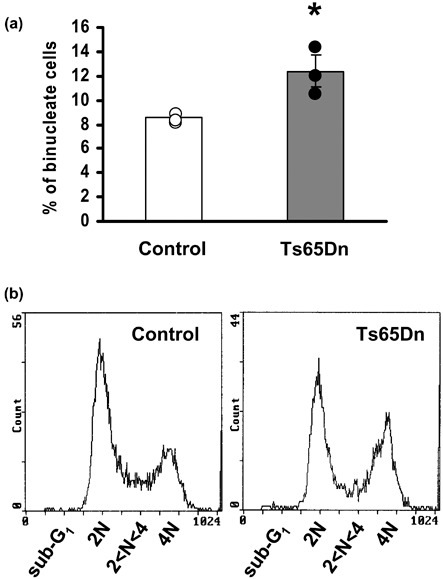
Quantification of binucleate cells in cultures of fibroblasts from control and Ts65Dn mice. (a) Percentage of binucleate cells over total cell number, evaluated by counting Hoechst‐stained nuclei at the second passage in culture. Data in the histogram are mean ± standard error of the mean from independent fibroblast cultures (three control and three Ts65Dn mice). Dots indicate data from single animals. *P < 0.05 (Student's t‐test). (b) Representative profiles of flow cytometry analysis of DNA content in cultures at the second passage. Note greater height of the 4 N DNA peak for Ts65Dn fibroblasts.
Cell ploidity can be also evaluated by flow cytometric analysis of DNA content of cells. The 2 N DNA peak obtained by flow cytometry represents diploid cells in G0/G1, 4 N DNA peak is composed of either tetraploid cells in G2/M or cells with two nuclei in G0/G1, while cells with between 2 N and 4 N DNA peaks are S‐phase diploid cells. Flow cytometry of DNA content of cells confirmed a significant increase (+40%) of 4 N Ts65Dn fibroblasts (Fig. 5b; Table 2). The increased number of 4 N DNA cells in Ts65Dn cultures was paralleled by reduction in percentage of diploid cells in either G0/G1 or S‐phase of the cell cycle (–21% and –27%, respectively).
In order to confirm that Ts65Dn fibroblasts suffer premature entrance into senescence, cells at fourth passage in culture were stained for SA‐β‐gal activity. As shown in Fig. 6a and 6b, Ts65Dn fibroblasts showed dramatic increase in the number of SA‐β‐gal‐positive cells. Quantification of number of SA‐β‐gal‐positive cells over total cell number revealed striking increase in percentage of senescent cells in Ts65Dn cultures (Fig. 6c). This clearly indicates that Ts65Dn fibroblasts suffered premature senescence in culture compared to control fibroblasts.
Impaired skin cell proliferation in newborn Ts65Dn mice
Results obtained in cultures of fibroblasts showed that cell proliferation was strongly reduced in Ts65Dn mice. To confirm in vitro findings, we examined cell proliferation in vivo in P2 Ts65Dn and control mice. To this purpose, P2 pups were injected with BrdUrd and were sacrificed 2 h later. We counted numbers of BrdUrd‐positive cells in the skin, a tissue with high proliferation rate during postnatal development. Numbers of BrdUrd‐positive cells were expressed as ratios with respect to total cell number (labelling index). Results showed that Ts65Dn mice had a reduced number (–27%) of BrdUrd‐positive cells compared to controls (Fig. 7), indicating that in trisomic animals cell proliferation was impaired compared to control animals in vivo. It seems interesting to note that reduction in cell proliferation rate observed in the skin (–27%) as well as in fibroblasts (–30%) of P2 Ts65Dn vs. control mice was of the same magnitude as weight difference (–22%) at this age (Table 1).
Figure 7.
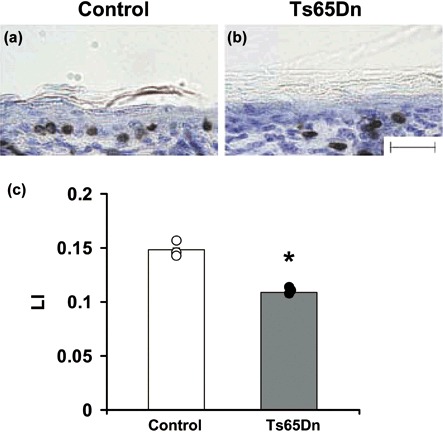
Proliferation in skin of control and of Ts65Dn mice. (a–b) Representative images of sections from skin processed for BrdUrd immunohistochemistry and counterstained with toluidine blue in a control (a) and a Ts65Dn (b) mouse. These animals received one BrdUrd injection on P2 and were sacrificed 2 h later. Scale bar (50 µm) applies to (a, b). (c) Quantification of BrdUrd‐positive cells over total cell number (labelling index) in the skin of control and Ts65Dn mice. Data in the histogram are mean ± standard error of the mean (three control and three Ts65Dn mice). Dots indicate data from single animals. *P < 0.01 (Student's t‐tests).
Discussion
Several lines of evidence suggest that cognitive disability associated with DS may arise from defective brain development, due to reduced proliferation capacity of neural precursor cells (44, 45). An intriguing possibility is that proliferation in other tissues, apart from brain, could also be impaired in people with DS and that this defect may underlie their delayed growth. In this study, we used the Ts65Dn mouse model to test the hypothesis that defective cell proliferation rate may be a widespread feature of DS. We report here, for the first time, that in neonatal Ts65Dn mice, proliferation is reduced in different tissues during postnatal development and that this defect is accompanied by a body weight reduction.
Reduced proliferation and premature senescence of Ts65Dn fibroblasts in culture
In order to shed light on possible proliferation defects in peripheral tissues of Ts65Dn mice, we established fibroblast cultures from control and Ts65Dn mice. Our results show that fibroblasts from Ts65Dn mice proliferated poorly and that this defect was due to a reduced number of cells that were capable of division (that is, reduced growth fraction) and not to elongation of cell cycle time. This is at variance with increased length of the cell cycle of neural precursor cells observed in Ts65Dn mice during embryonic brain development (45). It is possible that different mechanisms underlie proliferation impairment in the trisomic condition, according to tissue type and/or age. In fibroblast cultures from Ts65Dn mice, we found significant increase in apoptotic cell death. However, this increase is unlikely to be the primary cause of reduced number of proliferating cells, as the absolute number of apoptotic cells was anyway very low (less than 4% of total cell number). Nevertheless, in Ts65Dn cultures could represent a telltale sign of increased cell stress (see below), which may contribute to reduce the final cell number.
Interestingly, Ts65Dn fibroblasts were characterized by increased cell death observed as progressive reduction in PDs, indicating progressive reduction in size of the pool of proliferating cells (growth fraction), and stopped proliferating very prematurely with respect to controls. Proliferation impairment of Ts65Dn fibroblasts was accompanied by the full spectrum of morphological and biochemical features of senescence: enlarged and flattened morphology, increased F‐actin bundles, increased number of multinucleate cells and early appearance of SA‐β‐gal activity (56, 59, 60, 61, 62). This suggests that reduction in the growth fraction of Ts65Dn fibroblasts was due to premature entry into a non‐proliferative, senescent state. Polyploidy appears to be a morphological feature typical of senescence (58). Although genetic regulation of polyploidy has not been fully defined, there is evidence that different mechanisms may underlie it. In transgenic mice that abundantly express cyclin‐dependent kinase inhibitor p21, hepatocytes become polyploid and there are fewer per liver (63), suggesting that derangement in expression of genes that regulate the cell cycle may lead to polyploidy. Interestingly, oxidative stress, which contributes to increased genomic instability through DNA damage, appears also to trigger centrosome hyper‐amplification and polyploid cell formation (62). Overexpression of a triplicated gene, the Cu/Zn superoxide dismutase (Sod1) in Ts65Dn mice, may underlie the polyploidy observed in Ts65Dn fibroblasts.
Previous studies (64, 65) have shown that cultured fibroblasts from people with DS proliferate poorly and undergo premature senescence, possibly due to oxidative stress (64, 66). The similarity between data from human and current data from the Ts65Dn mouse further validates the use of this mouse model for studies aimed at elucidating the mechanism underlying developmental defects in DS. The possibility should be taken into account that precocious senescence observed in fibroblasts from DS humans and from Ts65Dn mice may be due to the artificial conditions of the culture system. In this respect, however, it seems interesting to note that precocious signs of ageing, as indicated by telomere shortening (67), have been observed in samples of fibroblasts and lymphocytes from individuals with DS, even at neonatal ages (68, 69). This would be in agreement with premature signs of ageing that characterize individuals with DS (70, 71). The premature onset of age‐dependent changes in DS individuals includes greying of hair, hair loss, menopause, osteoporosis, osteoarthritis, hypogonadism, immunological changes and senile cataracts (72). In addition, accelerated ageing of the skin and greater effects of sun exposure on skin wrinkling have been documented in people with DS (70, 71, 73). Low basal levels of many DNA repair enzymes in people with DS (73, 74) and/or increased free radical metabolism (75), which is known to exist in DS, may underlie precocious ageing of skin and, possibly, of other tissues.
Cell proliferation is reduced in skin of Ts65Dn mice
To establish whether proliferation impairment involves other peripheral tissues besides fibroblasts, we have examined here proliferation in skin samples, by labelling proliferating cells with BrdUrd. Our results indicate that the skin of Ts65Dn mice exhibits notable reduction in proliferation rate. Moreover, preliminary data from our laboratory (unpublished observations) also show that Ts65Dn mice exhibit reduced proliferation rate in cells of the liver and small intestine. This set of evidence confirms our hypothesis that proliferation impairment may be a generalized feature of the trisomic condition. Proliferation impairment of neural precursors during embryonic development has been shown to be due to extension of cell cycle time. We found here in fibroblasts from neonate mice that reduced proliferation was due to precocious replicative senescence. It remains to be established whether defective cell proliferation is retained across ages and whether the mechanisms underlying it (that is, longer cell cycle time or growth fraction reduction) differ according to tissue type.
Conclusions
Current findings show for the first time, that cells of various peripheral tissues of the neonate Ts65Dn mouse have impaired proliferation rate, suggesting that defective proliferation may be a generalized feature of the trisomic condition. Given the genetic and phenotypic similarities between Ts65Dn mice and DS, a similar generalized defect is likely to occur also in people with DS. DS pathology is characterized, in addition to mental retardation, by a reduced growth and derangement of numerous body functions. Perturbation of a basic developmental process, cell proliferation, may be a critical determinant that contributes to the many aspects of the pathology.
Acknowledgements
This work was supported by the research project 1/397 granted by the Fondation Jerome Lejeune to E.Ciani and by the CARISBO foundation to R. Bartesaghi.
References
- 1. Sylvester PE (1983) The hippocampus in Down's syndrome. J. Ment. Defic. Res. 27, 227–236. [DOI] [PubMed] [Google Scholar]
- 2. Schmidt‐Sidor B, Wisniewski KE, Shepard TH, Sersen EA (1990) Brain growth in Down syndrome subjects 15–22 weeks of gestational age and birth to 60 months. Clin. Neuropathol. 9, 181–190. [PubMed] [Google Scholar]
- 3. Winter TC, Ostrovsky AA, Komarniski CA, Uhrich SB (2000) Cerebellar and frontal lobe hypoplasia in fetuses with trisomy 21: usefulness as combined US markers. Radiology 214, 533–538. [DOI] [PubMed] [Google Scholar]
- 4. Pinter JD, Eliez S, Schmitt JE, Capone GT, Reiss AL (2001) Neuroanatomy of Down's syndrome: a high‐resolution MRI study. Am. J. Psychiatry 158, 1659–1665. [DOI] [PubMed] [Google Scholar]
- 5. Contestabile A, Fila T, Ceccarelli C, Bonasoni P, Bonapace L, Santini D, Bartesaghi R, Ciani E (2007) Cell cycle alteration and decreased cell proliferation in the hippocampal dentate gyrus and in the neocortical germinal matrix of fetuses with Down syndrome and in Ts65Dn mice. Hippocampus 17, 665–678. [DOI] [PubMed] [Google Scholar]
- 6. Guidi S, Bonasoni P, Caccarelli C, Santini D, Gualtieri F, Ciani E, Bartesaghi R (2008) Neurogenesis impairment and increased cell death reduce total neuron number in the hippocampal region of fetuses with Down syndrome. Brain Phatol. 18, 180–197. [DOI] [PMC free article] [PubMed] [Google Scholar]
- 7. Rowe RD, Uchida IA (1961) Cardiac malformation in mongolism: a prospective study of 184 mongoloid children. Am. J. Med. 31, 726–735. [DOI] [PubMed] [Google Scholar]
- 8. Levin S, Schlesinger M, Handzel Z, Hahn T, Altman Y, Czernobilsky B, Boss J (1979) Thymic deficiency in Down's syndrome. Pediatrics 63, 80–87. [PubMed] [Google Scholar]
- 9. Levy J (1991) The gastrointestinal tract in Down syndrome. Prog. Clin. Biol. Res. 373, 245–256. [PubMed] [Google Scholar]
- 10. Allanson JE, O’Hara P, Farkas LG, Nair RC (1993) Anthropometric craniofacial pattern profiles in Down syndrome. Am. J. Med. Genet. 47, 748–752. [DOI] [PubMed] [Google Scholar]
- 11. Roizen NJ, Amarose AP (1993) Hematologic abnormalities in children with Down syndrome. Am. J. Med. Genet. 46, 510–512. [DOI] [PubMed] [Google Scholar]
- 12. Kivivuori SM, Rajantie J, Siimes MA (1996) Peripheral blood cell counts in infants with Down's syndrome. Clin. Genet. 49, 15–19. [DOI] [PubMed] [Google Scholar]
- 13. McElhinney DB, Straka M, Goldmuntz E, Zackai EH (2002) Correlation between abnormal cardiac physical examination and echocardiographic findings in neonates with Down syndrome. Am. J. Med. Genet. 113, 238–241. [DOI] [PubMed] [Google Scholar]
- 14. Bagić I, Verzak Z (2003) Craniofacial anthropometric analysis in Down's syndrome patients. Coll. Antropol. 27, 23–30. [PubMed] [Google Scholar]
- 15. Roizen NJ, Patterson D (2003) Down's syndrome. Lancet 361, 1281–1289. [DOI] [PubMed] [Google Scholar]
- 16. Gurbuxani S, Vyas P, Crispino JD (2004) Recent insights into the mechanisms of myeloid leukemogenesis in Down syndrome. Blood 103, 399–406. [DOI] [PubMed] [Google Scholar]
- 17. Cleves MA, Hobbs CA, Cleves PA, Tilford JM, Bird TM, Robbins JM (2007) Congenital defects among liveborn infants with Down syndrome. Birth Defects Res. A Clin. Mol. Teratol. 79, 657–663. [DOI] [PubMed] [Google Scholar]
- 18. Stempfle N, Huten Y, Fredouille C, Brisse H, Nessmann C (1999) Skeletal abnormalities in fetuses with Down's syndrome: a radiographic post‐mortem study. Pediatr. Radiol. 29, 682–688. [DOI] [PubMed] [Google Scholar]
- 19. Myrelid A, Gustafsson J, Ollars B, Annerén G (2002) Growth charts for Down's syndrome from birth to 18 years of age. Arch. Dis. Child. 87, 97–103. [DOI] [PMC free article] [PubMed] [Google Scholar]
- 20. Styles ME, Cole TJ, Dennis J, Preece MA (2002) New cross sectional stature, weight, and head circumference references for Down's syndrome in the UK and Republic of Ireland. Arch. Dis. Child. 87, 104–108. [DOI] [PMC free article] [PubMed] [Google Scholar]
- 21. Melville CA, Cooper SA, McGrother CW, Thorp CF, Collacott R (2005) Obesity in adults with Down syndrome: a case‐control study. J. Intellect. Disabil. Res. 49, 125–133. [DOI] [PubMed] [Google Scholar]
- 22. Davisson MT, Schmidt C, Akeson EC (1990) Segmental trisomy of murine chromosome 16: a new model system for studying Down syndrome. Prog. Clin. Biol. Res. 360, 263–280. [PubMed] [Google Scholar]
- 23. Davisson MT, Schmidt C, Reeves RH, Irving NG, Akeson EC, Harris BS, Bronson RT (1993) Segmental trisomy as a mouse model for Down syndrome. Prog. Clin. Biol. Res. 384, 117–133. [PubMed] [Google Scholar]
- 24. Reeves RH, Irving NG, Moran TH, Wohn A, Kitt C, Sisodia SS, Schmidt C, Bronson RT, Davisson MT (1995) A mouse model for Down syndrome exhibits learning and behaviour deficits. Nat. Genet. 11, 177–184. [DOI] [PubMed] [Google Scholar]
- 25. Sago H, Carlson EJ, Smith DJ, Kilbridge J, Rubin EM, Mobley WC, Epstein CJ, Huang TT (1998) Ts1Cje, a partial trisomy 16 mouse model for Down syndrome, exhibits learning and behavioral abnormalities. Proc. Natl. Acad. Sci. USA 95, 6256–6261. [DOI] [PMC free article] [PubMed] [Google Scholar]
- 26. Sago H, Carlson EJ, Smith DJ, Rubin EM, Crnic LS, Huang TT, Epstein CJ (2000) Genetic dissection of region associated with behavioral abnormalities in mouse models for Down syndrome. Pediatr. Res. 48, 606–613. [DOI] [PubMed] [Google Scholar]
- 27. O'Doherty A, Ruf S, Mulligan C, Hildreth V, Errington ML, Cooke S, Sesay A, Modino S, Vanes L, Hernandez D, Linehan JM, Sharpe PT, Brandner S, Bliss TV, Henderson DJ, Nizetic D, Tybulewicz VL, Fisher EM (2005) An aneuploid mouse strain carrying human chromosome 21 with Down syndrome phenotypes. Science 309, 2033–2037. [DOI] [PMC free article] [PubMed] [Google Scholar]
- 28. Villar AJ, Belichenko PV, Gillespie AM, Kozy HM, Mobley WC, Epstein CJ (2005) Identification and characterization of a new Down syndrome model, Ts[Rb(12.1716)]2Cje, resulting from a spontaneous Robertsonian fusion between T(1716)65Dn and mouse chromosome 12. Mamm. Genome 16, 79–90. [DOI] [PubMed] [Google Scholar]
- 29. Seregaza Z, Roubertoux PL, Jamon M, Soumireu‐Mourat B (2006) Mouse models of cognitive disorders in trisomy 21: a review. Behav. Genet. 36, 387–404. [DOI] [PubMed] [Google Scholar]
- 30. Li Z, Yu T, Morishima M, Pao A, Laduca J, Conroy J, Nowak N, Matsui SIS, Yu Y (2007) Duplication of the entire 22.9 Mb human chromosome 21 syntenic region on mouse chromosome 16 causes cardiovascular and gastrointestinal abnormalities. Hum. Mol. Genet. 16, 1359–1366. [DOI] [PubMed] [Google Scholar]
- 31. Akeson EC, Lambert JP, Narayanswami S, Gardiner K, Bechtel LJ, Davisson MT (2001) Ts65Dn – localization of the translocation breakpoint and trisomic gene content in a mouse model for Down syndrome. Cytogenet. Cell Genet. 93, 270–276. [DOI] [PubMed] [Google Scholar]
- 32. Gardiner K, Fortna A, Bechtel L, Davisson MT (2003) Mouse models of Down syndrome: how useful can they be? Comparison of the gene content of human chromosome 21 with orthologous mouse genomic regions. Gene 318, 137–147. [DOI] [PubMed] [Google Scholar]
- 33. Antonarakis SE, Lyle R, Dermitzakis ET, Reymond A, Deutsch S (2004) Chromosome 21 and down syndrome: from genomics to pathophysiology. Nat. Rev. Genet. 5, 725–738. [DOI] [PubMed] [Google Scholar]
- 34. Roper RJ, St John HK, Philip J, Lawler A, Reeves RH (2006b) Perinatal loss of Ts65Dn Down syndrome mice. Genetics 172, 437–443. [DOI] [PMC free article] [PubMed] [Google Scholar]
- 35. Cefalu JA, Croom WJJ, Eisen EJ, Jones EE, Daniel LR, Taylor IL (1998) Jejunal function and plasma amino acid concentrations in the segmental trisomic Ts65Dn mouse. Growth Dev. Aging 62, 47–59. [PubMed] [Google Scholar]
- 36. Richtsmeier JT, Zumwalt A, Carlson EJ, Epstein CJ, Reeves RH (2002) Craniofacial phenotypes in segmentally trisomic mouse models for Down syndrome. Am. J. Med. Genet. 107, 317–324. [DOI] [PubMed] [Google Scholar]
- 37. Hill CA, Reeves RH, Richtsmeier JT (2007) Effects of aneuploidy on skull growth in a mouse model of Down syndrome. J. Anat. 210, 394–405. [DOI] [PMC free article] [PubMed] [Google Scholar]
- 38. Moore CS (2006) Postnatal lethality and cardiac anomalies in the Ts65Dn Down syndrome mouse model. Mamm. Genome 17, 1005–1012. [DOI] [PubMed] [Google Scholar]
- 39. Paz‐Miguel JE, Flores R, Sánchez‐Velasco P, Ocejo‐Vinyals G, Escribano de Diego J, López de Rego J, Leyva‐Cobián F (1999) Reactive oxygen intermediates during programmed cell death induced in the thymus of the Ts(1716)65Dn mouse, a murine model for human Down's syndrome. J. Immunol. 163, 5399–5410. [PubMed] [Google Scholar]
- 40. Kirsammer G, Jilani S, Liu H, Davis E, Gurbuxani S, Le Beau MM, Crispino JD (2008) Highly penetrant myeloproliferative disease in the Ts65Dn mouse model of Down syndrome. Blood 111, 767–775. [DOI] [PMC free article] [PubMed] [Google Scholar]
- 41. Insausti AM, Megias M, Crespo D, Cruz‐Orive LM, Dierssen M, Vallina IF, Insausti R, Florez J (1998) Hippocampal volume and neuronal number in Ts65Dn mice: a murine model of Down syndrome. Neurosci. Lett. 253, 175–178. [DOI] [PubMed] [Google Scholar]
- 42. Baxter LL, Moran TH, Richtsmeier JT, Troncoso J, Reeves RH (2000) Discovery and genetic localization of Down syndrome cerebellar phenotypes using the Ts65Dn mouse. Hum. Mol. Genet. 9, 195–202. [DOI] [PubMed] [Google Scholar]
- 43. Lorenzi HA, Reeves RH (2006) Hippocampal hypocellularity in the Ts65Dn mouse originates early in development. Brain Res. 1104, 153–159. [DOI] [PubMed] [Google Scholar]
- 44. Roper RJ, Baxter LL, Saran NG, Klinedinst DK, Beachy PA, Reeves RH (2006a) Defective cerebellar response to mitogenic Hedgehog signaling in Down's syndrome mice. Proc. Natl. Acad. Sci. USA 103, 1452–1456. [DOI] [PMC free article] [PubMed] [Google Scholar]
- 45. Chakrabarti L, Galdzicki Z, Haydar TF (2007) Defects in embryonic neurogenesis and initial synapse formation in the forebrain of the Ts65Dn mouse model of Down syndrome. J. Neurosci. 27, 11483–11495. [DOI] [PMC free article] [PubMed] [Google Scholar]
- 46. Contestabile A, Fila T, Bartesaghi R, Ciani E (2006) Choline acetyltransferase activity at different ages in brain of Ts65Dn mice, an animal model for Down's syndrome and related neurodegenerative diseases. J. Neurochem. 97, 515–526. [DOI] [PubMed] [Google Scholar]
- 47. Strovel J, Stamberg J, Yarowsky PJ (1999) Interphase FISH for rapid identification of a down syndrome animal model. Cytogenet. Cell Genet. 86, 285–287. [DOI] [PubMed] [Google Scholar]
- 48. Todaro GJ, Green H (1963) Quantitative studies of the growth of mouse embryo cells in culture and their development into established lines. J. Cell Biol. 17, 299–313. [DOI] [PMC free article] [PubMed] [Google Scholar]
- 49. Crisrofalo VJ, Allen RG, Pignolo RJ, Martin BG, Beck JC (1998) Relationship between donor age and the replicative lifespan of human cells in culture: a reevaluation. Proc. Natl. Acad. Sci. USA 95, 10614–10619. [DOI] [PMC free article] [PubMed] [Google Scholar]
- 50. Takahashi TN, Nowakowski RS, Caviness VS (1993) Cell cycle parameters and patterns of nuclear movement in the neocortical proliferative zone of the fetal mouse. J. Neurosci. 13, 820–833. [DOI] [PMC free article] [PubMed] [Google Scholar]
- 51. Lou J, Miller MW (1997) Basic fibroblast growth factor‐ and platelet‐derived growth factor‐mediated cell proliferation in B104 neuroblastoma cells: effect of ethanol on cell cycle kinetics. Brain Res. 770, 139–150. [DOI] [PubMed] [Google Scholar]
- 52. Li Z, Lin H, Zhu Y, Wang M, Luo J (2001) Disruption of cell cycle kinetics and cyclin‐dependent kinase system by ethanol in cultured cerebellar granule progenitors. Brain Res. Dev. Brain Res. 132, 47–58. [DOI] [PubMed] [Google Scholar]
- 53. Dimri GP, Lee X, Basile G, Acosta M, Scott G, Roskelley C, Medrano EE, Linskens M, Rubelj I, Pereira‐Smith O, Peacocke M, Campisis J. (1995) A biomarker that identifies senescent human cells in culture and in aging skin in vivo . Proc. Natl. Acad. Sci. USA 92, 9363–9367. [DOI] [PMC free article] [PubMed] [Google Scholar]
- 54. Spengler D, Villalba M, Hoffmann A, Pantaloni C, Houssami S, Bockaert J, Journot L (1997) Regulation of apoptosis and cell cycle arrest by Zac1, a novel zinc finger protein expressed in the pituitary gland and the brain. EMBO J. 16, 2814–2825. [DOI] [PMC free article] [PubMed] [Google Scholar]
- 55. Godard T, Deslandes E, Lebailly P, Vigreux C, Poulain L, Sichel F, Poul JM, Gauduchon P (1999) Comet assay and DNA flow cytometry analysis of staurosporine‐induced apoptosis. Cytometry 36, 117–122. [DOI] [PubMed] [Google Scholar]
- 56. Rohme D (1981) Evidence for a relationship between longevity of mammalian species and life spans of normal fibroblasts in vitro and erythrocytes in vivo . Proc. Natl. Acad. Sci. USA 8, 5009–5013. [DOI] [PMC free article] [PubMed] [Google Scholar]
- 57. Hieter P, Griffiths T (1999) Polyploidy – more is more or less. Science 285, 210–211. [DOI] [PubMed] [Google Scholar]
- 58. Brodsky WY, Uryvaeva IV (1977) Cell polyploidy: its relation to tissue growth and function. Int. Rev. Cytol. 50, 275–332. [DOI] [PubMed] [Google Scholar]
- 59. Wang E, Gundersen D (1984) Increased organization of cytoskeleton accompanying the aging of human fibroblasts in vitro . Exp. Cell Res. 154, 191–202. [DOI] [PubMed] [Google Scholar]
- 60. Cristofalo VJ, Lorenzinia A, Allen RG, Torresa C, Tresinia M (2004) Replicative senescence: a critical review. Mech. Ageing Dev. 125, 827–848. [DOI] [PubMed] [Google Scholar]
- 61. Mason DX, Jackson TJ, Lin AW (2004) Molecular signature of oncogenic ras‐induced senescence. Oncogene 23, 9238–9246. [DOI] [PubMed] [Google Scholar]
- 62. Chae S, Yun C, Um H, Lee JH, Cho H (2005) Centrosome amplification and multinuclear phenotypes are Induced by hydrogen peroxide. Exp. Mol. Med. 37, 482–487. [DOI] [PubMed] [Google Scholar]
- 63. Wu H, Wade M, Krall L, Grisham J, Xiong Y, Van Dyke T (1996) Targeted in vivo expression of the cyclin‐dependent kinase inhibitor p21 halts hepatocyte cell‐cycle progression, postnatal liver development and regeneration. Genes Dev. 10, 245–260. [DOI] [PubMed] [Google Scholar]
- 64. Segal DJ, McCoy EE (1974) Studies on Down's syndrome in tissue culture. I. Growth rates and protein contents of fibroblast cultures. J. Cell. Physiol. 83, 85–90. [DOI] [PubMed] [Google Scholar]
- 65. De Haan JB, Cristiano F, Iannello R, Bladier C, Kelner MJ, Kola I (1996) Elevation in the ratio of Cu/Zn‐superoxide dismutase to glutathione peroxidase activity induces features of cellular senescence and this effect is mediated by hydrogen peroxide. Hum. Mol. Genet. 5, 283–292. [DOI] [PubMed] [Google Scholar]
- 66. De Haan JB, Susil B, Pritchard M, Kola I (2003) An altered antioxidant balance occurs in Down syndrome fetal organs: implications for the ‘gene dosage effect’ hypothesis. J. Neural Transm. Suppl. 67–83. [DOI] [PubMed] [Google Scholar]
- 67. Harley CB (1991) Telomere loss: mitotic clock or genetic time bomb? Mutat. Res. 256, 271–282. [DOI] [PubMed] [Google Scholar]
- 68. Vaziri H, Schachter F, Uchida I, Wei L, Zhu X, Effros R, Cohen D, Harley CB (1993) Loss of telomeric DNA during aging of normal and trisomy 21 human lymphocytes. Am. J. Hum. Genet. 52, 661–667. [PMC free article] [PubMed] [Google Scholar]
- 69. De Arruda Cardoso Smith M, Borsatto‐Galera B, Feller RI, Goncalves A, Oyama RS, Segato R, Chen E, Carvalheira GM, Filho AS, Burbano RR, Payao SL (2004) Telomeres on chromosome 21 and aging in lymphocytes and gingival fibroblasts from individuals with Down syndrome. J. Oral Sci. 46, 171–177. [DOI] [PubMed] [Google Scholar]
- 70. Brugge KL, Grove GL, Clopton P, Grove MJ, Piacquadio DJ (1993) Evidence for accelerated skin wrinkling among developmentally delayed individuals with Down's syndrome. Mech. Ageing Dev. 70, 213–225. [DOI] [PubMed] [Google Scholar]
- 71. Nakamura E, Tanaka S (1998) Biological ages of adult men and women with Down's syndrome and its changes with aging. Mech. Ageing Dev. 105, 89–103. [DOI] [PubMed] [Google Scholar]
- 72. Madan V, Williams J, Lear JT (2006) Dermatological manifestations of Down's syndrome. Clin. Exp. Dermatol. 31, 623–629. [DOI] [PubMed] [Google Scholar]
- 73. Makrantonaki E, Zouboulis CC (2007) Molecular mechanisms of skin aging: state of the art. Ann. NY Acad. Sci. 1119, 40–50. [DOI] [PubMed] [Google Scholar]
- 74. Raji NS, Rao KS (1998) Trisomy 21 and accelerated aging: DNA‐repair parameters in peripheral lymphocytes of Down's syndrome patients. Mech. Ageing Dev. 100, 85–101. [DOI] [PubMed] [Google Scholar]
- 75. Sinha S (2005) Anti‐oxidant gene expression imbalance, aging and Down syndrome. Life Sci. 76, 1407–1426. [DOI] [PubMed] [Google Scholar]