

Abstract
Thorium is a well-known radioactive and chemically toxic contaminant in the environment. The continuous exposure to thorium may cause an increased risk of developing lung and liver diseases as well as lung, pancreas and bone cancer. Due to its use in nuclear industry and other industrial applications, thorium may be accidentally released to the environment from its mining and processing plants. In this work, we developed a rapid, real-time, and label-free nanopore sensor for Th4+ detection by using an aspartic acid containing peptide as a chelating agent and tuning the electrolyte solution pH to control the net charges of the peptide ligand and its metal ion complex. The method is highly sensitive with a detection limit of 0.45 nanomolar. Furthermore, the sensor is selective: other metal ions (e.g., UO22+, Pb2+, Cu2+, Ni2+, Hg2+, Zn2+, As3+, Mg2+, and Ca2+) with concentrations of up to three orders of magnitude greater than that of Th4+ would not interfere with Th4+detection. In addition, simulated water samples were successfully analyzed. Our developed computation-assisted sensing strategy should find useful applications in the development of nanopore sensors for other metal ions.
Graphical Abstract

INTRODUCTION
Nanopore sensing is an emerging label-free and amplification-free technique for measuring single molecules.1 By monitoring ionic current modulations produced by the passage of analyte molecules through a single nanopore (either a protein ion channel 2 embedded in phospholipid bilayer or a synthetic nanopore3 fabricated in a solid-state membrane) bathed in high salt solutions at a fixed applied potential, both the identity (from the residence time and/or blockage amplitude) and the concentration (by the event frequency) of the analyte can be determined. In addition to biosensing,4–7 nanopore technology could be used as a versatile tool to explore various other applications, for example, DNA sequencing,8,9 biomolecular folding/unfolding,1enzyme activity and kinetics,2 and covalent and non-covalent bonding interactions.14,15 Thus far, two major strategies have been utilized to develop nanopore sensors. One relies on construction of molecular recognition in the nanopore interior, which can be achieved by introducing various surface functional groups such as hydrophobic, aromatic, positively charged, and negatively charged residues inside the nanopore as the binding sites.16–18 The other takes advantage of an external selective molecular probe (e.g., host compound, complimentary single-stranded DNA, binding protein / antibody, or chelating agent) and detects analytes based on various interactions such as host-guest, hybridization, protein-ligand, and chelation (or coordination).5,7,19 Due to its simplicity and flexibility, the molecular probe-based nanopore sensing technique has attracted increasing interest over recent years. Chelation interaction is a well-known technique to develop colorimetric and fluorescent sensors for small molecules such as metal ions and anions20; however, nanopore detection of metal ions using a chelating probe is still a challenging task. In part, this is because it remains unclear how the nature (e.g., structure and charge) of the transported molecule is correlated with its residence time and blockage amplitude in the nanopore. Furthermore, metal ion–biomolecule interaction may induce conformational change of the biomolecules, and its effect on the event signatures is complicated, which makes the sensor design more difficult and not easily predictable. For example, addition of metal ions to a chelating biomolecule probe might lead to the following four cases: 1) no change on the event signature; 2) an increase in the event frequency; 3) a decrease in the event count; and 4) appearance of a new types of events with significantly different residence time and blockage amplitude.5,21,22 Therefore, there is a need of rational strategy to design nanopore sensors for metal ion detection. Herein, with thorium ion detection as a model system, we report a computation-assisted nanopore approach for highly sensitive detection of metal ions.
Thorium is a naturally occurring radioactive and chemically toxic element that is found at low levels in soil, rocks, water, plants, and animals. It is a well-known carcinogen, which has the ability to change genetic arrangements and can be lethal at high doses. The continuous exposure to thorium may cause an increased risk of developing lung and liver diseases, as well as lung, pancreas and bone cancer.23–25 Thorium has been applied in various industries including ceramics, gas mantles, flame spraying, crucibles, medicine, non-silica optical glass, and catalyst. More importantly, thorium has been used as a fuel in several nuclear power plants, 26 even though uranium is the most commonly used fuel in nuclear power industry. Although thorium is regarded as a safer fuel and will generate less nuclear wastes, its potential wide-spread use in nuclear power industry may exert increasing risks to the environmental and human health. In addition, there are active debates about whether thorium may be used in developing and producing nuclear weapons.27 If so, to detect such material production and weapon development activities are critical to non-proliferation. Thus far, various analytical techniques have been utilized for thorium detection, including flow-injection analysis,28 inductively coupled plasma mass spectrometry (ICP-MS),29 neutron activation analysis (NAA),30 as well as spectrophotometric,31 fluorimetric,32 electrochemical,33 and radiometric34 methods. However, most of these techniques are laborious (e.g., involving with time-consuming pre-concentration and/or radiochemical separation procedures), and require the use of expensive and sophisticated instruments. Therefore, it is highly desirable to develop new techniques for thorium detection, which are easy to operate and potentially field-deployable.
EXPERIMENTAL SECTION
Chemicals and Reagents.
Peptide D-12, a 12-amino acid peptide with a sequence of YEVHHQKDDPDD, was obtained from WatsonBio sciences (Houston, TX). Other chemicals such as Th(NO3)4 (99.999%), UO2(NO3)2 (99.999%), Ca(NO3)2 (99.999%), Mg(NO3)2 (99.999%), Ni(NO3)2 (99.999%), Zn(NO3)2 (99.999%), Cu(NO3)2 (99.999%), As(Cl)3 (99.999%), Pb(NO3)2 (99.999%), Hg(NO3)2(99.999%), NaCl (99.999%), HCl (ACS reagent, ≤1 ppm heavy metals), NaH2PO4 (BioXtra grade, ≥99.5%), and Trizma base (BioXtra grade, ≥99.9%) were bought from Sigma (St. Louis, MO). All the chemicals, including the D-12 peptide, were dissolved in HPLC-grade water (ChromAR, Mallinckrodt Baker). The stock solutions of the peptide and metal salts were prepared at concentrations of 10 mM each, and were kept at −20 °C before and after use. The buffer solutions used in this study included: (1) 1.0 M NaCl and 1 mM tris with pH values adjusted to 6.5 using HCl; (2) 1.0 M NaCl and 1 mM NaH2PO4 with pH values adjusted to 2.5, 3.5, 4.0, 4.5 and 5.5 using HCl. Lipid 1,2-diphytanoylphosphatidylcholine was purchased from Avanti Polar Lipids (Alabaster, AL). Teflon film was obtained from Goodfellow (Malvern, PA). The α-hemolysin (α-HL) (M113F)7 protein pores was made according to our previous work.35
Planar Bilayer Experiments.
Single channel recordings were carried out at 25 ± 1 °C in a two-compartment chamber, which was separated by a Teflon septum having a 150 μm diameter aperture. Briefly, the planar bilayer was formed on the aperture of the Teflon film using 1,2-diphytanoylphosphatidylcholine. Unless otherwise stated, the experiments were carried out under symmetrical buffer conditions, with the α-HL proteins added to the grounded cis compartment, while metal ion salts and the peptide probe were placed to the trans side of the chamber device. Currents were recorded with an Axopatch 200B amplifier (Molecular Devices, Sunnyvale, CA, USA), filtered with a built-in four-pole low-pass Bessel filter at 10 kHz, and then sampled at 50 kHz with a Digidata 1440 A/D converter (Molecular Devices). The signatures of current blockage modulations (i.e., events) were determined by using Clampfit 10.5 software (Molecular Device). Specifically, the conductance values and the mean residence time (τoff) of the D-12 peptide were obtained from the amplitude and residence time histograms by fitting the distributions to Gaussian and single exponential functions, respectively.15 The change (Δn) in the number of peptide D-12 events before/after addition of metal ions, including Th4+, to the electrolyte solution was calculated by using the equation Δn = n0 − n1, where n0 was the number of peptide D-12 events in the absence of metal ions, while n1 represented the number of peptide D-12 events in the presence of metal ions. Therefore, a positive value Δn represents a reduction in the number of peptide events after addition of metal ions to the electrolyte solution. Each single-channel current trace was recorded for 10 min with an average of 650 events. At least three separate experiments, in each of which a new protein nanopore was used, were performed for each sample.
Circular Dichroism (CD) Spectroscopy.
CD measurements were performed using a Jasco-715 spectrometer (Tokyo, Japan). Typically, 3–5 scans were recorded at room temperature in the far-UV region ranging from 200 to 250 nm, using a 1 mm optical path quartz cell. Both the peptide and Th4+ samples used in the CD experiments were prepared at 100 μM in electrolyte solutions containing 0.5 M NaCl and 0.5 mM Na2HPO4 (pH 4.5).
Calculation of the charge state of peptide D-12.
The net charge of peptide D-12 is calculated based on the difference between the solution pH and the pKa value of each of the positively charged (histidine and lysine) and negatively charged (aspartic acid, glutamic acid, tyrosine) amino acids in the peptide using the equation below.
Where, Q+ is the charge on n identical positively charged amino acid and Q- is the charge on m identical negatively charged amino acid, with a summation over the number of particular type of amino acid (k) within the D-12 peptide.36
RESULT AND DISCUSSION
Design of peptide probe D-12 and experimental conditions for nanopore detection of Th4+ ions.
Since the hydrated ion radius of Th4+ (between 0.95 and 1.14 Å depending on its coordination number37) is much smaller than the constriction of the α-hemolysin (αHL) pore (~1.5 nm), Th4+ species themselves could not produce any observable current modulation events in the nanopore due to their rapid translocation and the resolution (~ 200 µs) of the electrophysiology set up used in nanopore stochastic sensing. In order to detect Th4+, a 12-mer peptide with a sequence of YEVHHQKDDPDD was utilized as a molecular probe. Metal ion - peptide chelation/coordination interactions are well known due to the presence of potential donor atoms in peptides.38,39 Metal chelates of Th4+ with aspartic and glutamic acids have been studied potentiometrically.40 Note that aspartic acid possesses three potential donor sites (one amine and two carboxyl groups) and is well known as a bi-, tri-, and monodentate and bridging ligand.41–43 Furthermore, it has been reported that histidine residues in the peptide display strong affinity for divalent or trivalent metal ions due to the strong chelation/coordination interaction.44
The initial experiment was performed at −80 mV with the mutant αHL (M113F)7 protein pore in a buffer solution containing 1 M NaCl and 1 mM NaH2PO4 (pH 4.5). The mutant αHL (M113F)7 nanopore was used as the stochastic sensing element since this pore has been shown to offer an improved sensor resolution/sensitivity (e.g., prolonged event residence time for the analytes) over the wild-type αHL pore.13 Our computational prediction indicated that at pH 4.5, peptide D-12 could serve as an effective chelating agent for nanopore detection of Th4+ ions, as such, a buffer solution of pH 4.5, rather than the commonly used buffer solution of pH 7.4 (i.e., the physiological pH), was employed as the supporting electrolyte in our investigation. It has been well established that several factors, including the structural characteristics of the nanopore and the nature (e.g., the surface charge) of the analyte, would strongly affect the resolution and sensitivity of the nanopore sensor.1,45 In our constructed nanopore Th4+ sensor system, the surface charge of the probe peptide is not only dependent on the number and identities of the charged amino acid components, but also affected by solution pH. As shown in Figure 1, peptide D-12 had a net charge varying from −4.50 to +4.27 as the solution pH changed from 6.5 to 2.5. After chelation with Th4+, the net charge of the formed peptide-Th4+ complex changed from −5.00 to +12.54, accordingly (note that Th4+ are prone to form eight-coordinate 1:2 (Th / D-12) stoichiometric complexes, especially in acidic solutions46). It is apparent that the most significant change in the charge state of peptide D-12 (before / after addition of Th4+) occurs at pH 4.5, where the charge changed signs (from −1.52 to +0.96), although we couldn’t rule out the possibility of pH 4.0, where the transition occurred from almost neutral to charged species.
Figure 1.

The net charges of peptide D-12 and its thorium ion complex at different pH values.
In the absence of Th4+, the interaction between peptide D-12 and the αHL nanopore produced two major types of events. One type showed a mean residual current (Ir) of −14.5 ± 0.5 pA and a mean residence time of 0.57 ± 0.03 ms, while the other had a mean residence time of 0.13 ± 0.02 ms but with a large spread of blockage amplitudes (with a residual current ranging from ~ −48 pA to ~ −20 pA). As reported previously38,39, these events were attributed to peptide D-12’s translocation through and bumping into the nanopore, respectively. Unlike most of the probe-based nanopore sensors reported previously, where new types of events with significantly different signatures such as residence time and/or blockage amplitude were observed after addition of the target analyte into the probe-containing solution,24,38 we didn’t observe any significant change in the event residence time or amplitude (τoff = 0.59 ± 0.10 ms and Ir = −14.3 ± 0.2 pA for the translocation events), but noticed a large reduction in the number of peptide events after addition of a tiny amount of Th4+ ions to the peptide D-12 solution. For instance, when 200 nM Th4+ ions were added to 20 μM of peptide D-12 solution, the number of peptide events decreased by 25.2 ± 1.4% (Figure 2). Furthermore, our experiments showed that the peptide event frequency decreased with the increased concentration of added Th4+. One likely reason for our observation might be attributed to the conformational change of peptide D-12 induced by the metal ion – biomolecule interaction so that these biomolecules became larger than the nanopore opening and hence could not enter and pass through the pore. This interpretation was supported by our CD experiments, where the CD profile of peptide D-12 was significantly different from that of the Th4+ / peptide D-12 mixture (Figure 3). According to the secondary structure estimation using BeStSel analysis 47 of the CD spectrum of the D-12 peptide solution (at pH 4.5), peptide D-12 showed 31.6% antiparallel β-sheet, 15.3% turn, and 53.1% random coil structures in the absence of Th4+, while had 17.5% turn conformers, 30.6% antiparallel β-sheet, 48.1% random coil, and 3.8% alpha helix structures in the presence of Th4+. The combined results suggested that one out of twelve amino acid residues in the peptide D-12 molecule underwent the random coil to alpha helix transition after addition of Th4+ to the peptide solution.
Figure 2.

Nanopore detection of Th4+ ions using peptide D-12 as a chelating probe. (a) 0 nM; and (b) 200 nM Th4+. (Left) Typical single-channel current recording trace segments; and (Right) the corresponding event amplitude histograms. The experiments were performed at −80 mV with the (M113F)7 αHL pore in an electrolyte solution containing 1.0 M NaCl and 1 mM Na2HPO4 (pH 4.5) and in the presence of 20 μM peptide D-12. Both the peptide and Th4+ were added to the trans compartment of the nanopore sensing chamber. Dashed lines represent the levels of zero current.
Figure 3.

CD spectra of peptide D-12 in the absence and presence of thorium ions. Both the D-12 peptide and Th4+ ions were prepared at 100 μM each in electrolyte solutions containing 0.5 M NaCl and 0.5 mM Na2HPO4 (pH 4.5).
The effect of solution pH on the sensitivity and performance of the nanopore sensor.
To confirm our prediction that pH 4.5 was the optimum solution pH for nanopore detection of Th4+, the effect of Th4+ on the translocation of peptide D-12 in the (M113F)7 αHL nanopore was investigated in a series of electrolyte solutions with different pH values, ranging from pH 2.5 to pH 6.5. Our experimental results showed that, in the absence of Th4+ ions, as the pH value of the electrolyte solution increased, the mean residence time of the peptide events decreased (Figure 4a). The results were reasonable since the net charge of peptide D-12 shifted from positive to negative as the solution pH increased from pH 2.5 to pH 6.5 (Figure 1). Accordingly, under an applied negative potential bias, the peptide molecules would be subjected to a larger electrophoretic force, thus producing smaller residence time events. In theory, an increase in the pH value of the electrolyte solution would lead to an increase in the peptide event frequency, which was not in agreement with our experimental results that the number of peptide events first increased and then decreased (Figure 4b). One possible reason for the disagreement might be attributed to the resolution of the single channel recording setup so that many of the rapid peptide events at pH 4.5, pH 5.5, and pH 6.5 were missed under our experimental conditions. This interpretation was supported by the observed blockage amplitude values of the peptide events which also first increased and then decreased with increasing solution pH (Figure 4c). Although the number of peptide events obtained at pH 4.0 was larger than that of pH 4.5, the electrolyte buffer solution of pH 4.5 was used in the remaining experiments because addition of Th4+ to the peptide D-12 solution produced a larger percent reduction in the number of peptide events at this pH (Figure 4d). Specifically, after addition of 200 nM Th4+ ions to 20 μM peptide D-12, the number of peptide events decreased by 25.2 ± 1.4 % at pH 4.5 compared to 10.9 ± 0.5 % at pH 4. Note that the performance of our nanopore Th4+ sensor was dependent on the effect of thorium ions on the frequency of the peptide D-12 events. Two conditions must be satisfied to achieve highly sensitive detection of Th4+ ions: one is a large number of peptide events in the absence of Th4+; while the other is a large percent peptide event reduction in the presence of Th4+.
Figure 4.
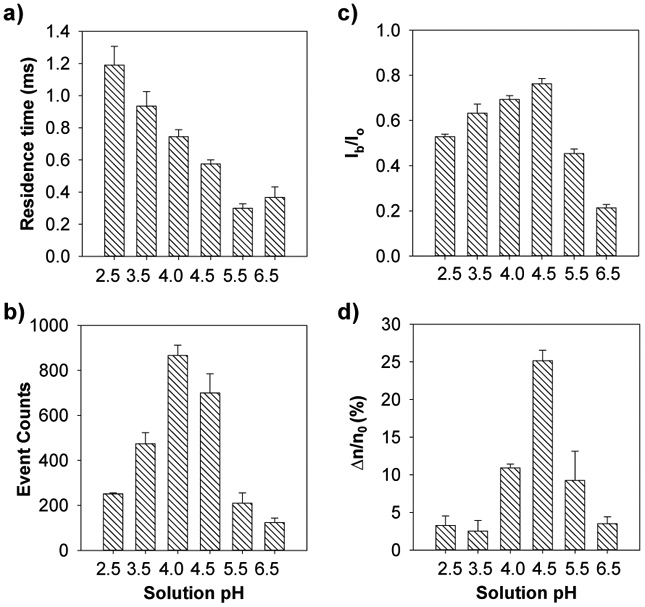
The effect of electrolyte pH on the (a) residence time; (b) number of occurrences; and (c) normalized blockage amplitude (Ib/Io) of the peptide D-12; as well as (d) percent reduction in the number of D-12 events after addition of Th4+. The experiments were performed at −80 mV with the (M113F)7 αHL nanopore in a series of electrolyte solutions with different pH values and in the presence of 20 μM peptide D-12. The concentration of Th4+ ions used in Fig. 4d was 200 nM.
Effect of applied voltage bias on peptide D-12 translocation.
It has been well established that physical conditions such as solution pH, salt concentration, solvent, temperature, and applied potential affect the translocation of molecules / ions through channels, and have been employed to enhance the nanopore resolution for the detection of various species.48–51 In this investigation (i.e., our developed nanopore Th4+ sensor in a buffer solution of pH 4.5), a net negatively charged peptide was used as a molecular probe. It is apparent that the applied potential bias would also play a significant role in the sensor sensitivity. To achieve the maximum nanopore resolution for the detection of Th4+, we investigated the translocation of peptide D-12 in the nanopore at different voltages. Our experimental results (Figure 5) showed that, with an increase in the negative applied potential bias, the mean residence time of the peptide events decreased, while both the peptide event blockage amplitude and the frequency increased. This is not unreasonable considering that a stronger electrophoretic effect would be expected for a charged species at a larger applied voltage bias. A voltage of −100 mV was chosen as the optimum applied potential bias and used in the remaining experiments because the bilayer at −120 mV was not as stable as it was at −100 mV.
Figure 5.

The effect of the applied potential bias on the (a) number of occurrences; (b) blockage amplitude; and (c) residence time of the peptide D-12 events. The experiments were performed with the (M113F)7 αHL protein nanopore in an electrolyte solution containing 1 M NaCl and 1 mM sodium phosphate (pH 4.5) and in the presence of 20 μM peptide D-12 at various voltage values ranging from −40 mV to −120 mV.
Sensitivity and interference study of the Th4+ nanopore sensor.
Under the current experimental conditions (i.e., in 1 M NaCl buffer solution of pH 4.5 and at an applied voltage bias of −100 mV), the dose response of the nanopore Th4+ sensor was investigated, where we kept the concentration of the probe peptide constant at 5 µM, but varied the Th4+ ion concentration (ranging from 2.5 to 20 nM). 5 µM (instead of 20 µM) peptide D-12 was used in this series of experiments because it produced enough events for statistical data analysis without consuming too much chemicals; further, the concentration of the peptide would not affect the sensitivity of the nanopore significantly due to the linear relationship between the peptide concentration and its event frequency (Supporting Information, Figure S1). We found that the reduction in the number of peptide events increased with an increase in the concentration of added ****Th4+ ions (Figure 6a). The detection limit (which is defined as the Th4+ concentration corresponding to three times the standard deviation of blank signal) of the sensor was 0.45 nM in a 10 min electrical recording. To our best knowledge, such a detection limit, although not as impressive as that (20 pM) of ICP-MS, is much better than those (ranging from 2 nM to 2.02 µM) of various other sensitive thorium detection methods28–34 (Supporting Information, Table S1). This detection limit is more than good enough for analysis of thorium in environmental samples (note that the World Health Organization’s thorium concentration limit in drinking water is <1.06 µM52). It is worth mentioning that our developed nanopore Th4+ sensor has not yet been optimized. Significant improvement in the sensor sensitivity and detection limit could be expected using a salt gradient instead of the symmetric electrolyte buffer condition employed in this investigation, as documented in our previous studies.5,7
Figure 6.

(a) Dose-response curve; and (b) interference study of the Th4+ nanopore sensor. The experiments were performed at −100 mV with the (M113F)7 αHL protein nanopore in an electrolyte solution containing 1 M NaCl and 1 mM Na2HPO4 (pH 4.5) and in the presence of 5 μM peptide D-12. With the exception of Th4+ (20 nM), and Ca2+ / Mg2+ (500 μM each), the concentrations of all the other metal ions shown in part b were 5 μM each. In Figs. 6a and 6b, the change (∆n) in the number of peptide D-12 events after addition of metal ions to the solution was calculated by using the equation: ∆n = n0-n1, where n0 and n1 represented the number of D-12 events in the absence / presence of metal ions, respectively.
In addition, the matrix effect on the nanopore sensor response was also investigated. Nine metal ions (i.e., UO22+, Pb2+, Cu2+, Ni2+, Hg2+, Zn2+, As3+, Mg2+, and Ca2+) were selected as potential interfering species to examine the selectivity of the nanopore Th4+ sensor based on their similar chemical properties and/or abundances in water. Except for Ca2+ and Mg2+ (both at 500 μM), the concentrations of all the other metal ions used in this investigation were 5 μM each. The experimental results were summarized in Fig. 6b. We found that the nine metal ions could be divided into two categories, which showed quite different responses to the nanopore sensor. Specifically, the presence of Ca2+ and Zn2+ in the solution led to an increase in the number of peptide events, while other seven ions caused a reduction in the produced peptide event count. However, since small event count changes (17.3 ± 4.4 %, 1.0 ± 1.2 %, 12.5 ± 4.1 %, 17.0 ± 3.6 %, 5.2 ± 1.7 %, 16.1 ± 1.0 %, 12.1±4.7 %, 11.2 ±1.6 %, and 10.9 ± 3.9 % for Ca2+, Zn2+, UO22+, Pb2+, Cu2+, Ni2+, Hg2+, As3+, and Mg2+ respectively) were obtained in the presence of relatively large (5 to 500 μM) concentrations of interfering metal ions, the effect is negligible, as a 58.2 ± 1.7% decrease in the number of peptide events was observed after addition of Th4+ ions with concentration of at least 250-fold less than other interfering species. It is worth mentioning that peptide D-12 contains histidine, aspartic acid, and glutamic acid residues, and hence could potentially bind to a variety of divalent and trivalent metal ions. However, our CD experiments (Supporting Information, Figure S2) showed that binding of other metal ions to peptide D-12 would not result in any significant conformational change in the peptide molecule. Therefore, the high selectivity of the nanopore sensor toward Th4+ further demonstrated that the sensing mechanism of the nanopore Th4+ sensor was attributed to the conformational change in the peptide D-12 molecule due to the peptide-Th4+ ion interaction.
Simulated water sample analysis.
To show the potential utility of our nanopore sensor in the analysis of environmental samples, three simulated Th4+-contaminated water samples were analyzed. These three water samples were prepared by spiking 20 nM Th4+ ions into the bottled spring water (Ice Mountain brand), tap water (obtained from our life science building), and lake water (from Lake Michigan). The results are summarized in Figure 7. We found that the event reduction percentages (53.3 ± 3.9 %, 48.6 ± 2.4 %, and 58.3 ± 4.0 %) of the three simulated water samples were similar to that (58.2 ± 1.7 %) of the Th4+ standard solution, indicating that the matrix component in the water would not affect Th4+ ion detection significantly.
Figure 7.

Simulated water sample analysis. The experiments were performed at −100 mV with the (M113F)7 αHL protein nanopore in an electrolyte solution containing 1 M NaCl and 1 mM Na2HPO4 (pH 4.5) and in the presence of 5 μM peptide D-12. Labels S, L, T, and B represented the Th4+ standard as well as Th4+-containing lake water, tap water, and bottle water samples, respectively.
CONCLUSION
In summary, we developed a nanopore based Th4+ sensor with an aspartic acid-containing peptide D-12 as a chelating agent and by monitoring the effect of Th4+ on the translocation of peptide D-12 in the nanopore. Similar to our previous observation with the interaction between UO22+ and a histidine rich peptide, although the formation of Th4+-peptide complex did not affect the event residence time and blockage amplitude, the percent reduction in the peptide translocation events could be utilized for Th4+ quantitation. Our experiments showed that, for a peptide to be an effective ligand for nanopore detection of metal ions, the net charge of the formed metal ion - peptide complex should be significantly different from that of the free peptide. It should be noted that, the surface charge of a peptide ligand is not only dependent on the number and identities of the charged amino acid components, but also affected by solution pH. Therefore, given the peptide ligand composition, the appropriate solution pH for nanopore detection of metal ions could be logically predicted. Due to the high sensitivity and selectivity, our developed nanopore sensor may find useful applications in detection of Th4+ in natural water for environmental monitoring.
Supplementary Material
ACKNOWLEDGMENT
This work was financially supported by the National Institutes of Health (2R15GM110632–02) and National Science Foundation (1708596).
Footnotes
Supporting Information.
The Supporting Information is available free of charge on the ACS Publications website.
Additional tables and figures, including detection limits of several popular Th4+ detection techniques, dose response curve for peptide D-12, and CD spectra of peptide D-12 in the absence and presence of metal ions.
Notes
The authors declare no competing financial interests.
REFERENCES
- (1).Wang G; Wang L; Han Y; Zhou S; Guan X Acc. Chem. Res 2013, 46, 2867–2877. [DOI] [PubMed] [Google Scholar]
- (2).Ying Y-L; Cao C; Long Y-T Analyst 2014, 139, 3826–3835. [DOI] [PubMed] [Google Scholar]
- (3).Zhang H; Tian Y; Jiang L Nano Today 2016, 11, 61–81. [Google Scholar]
- (4).Mereuta L; Schiopu I; Asandei A; Park Y; Hahm KS; Luchian T Langmuir 2012, 28, 17079–17091. [DOI] [PubMed] [Google Scholar]
- (5).Roozbahani GM; Chen X; Zhang Y; Xie R; Ma R; Li D; Li H; Guan X ACS Sens. 2017, 2, 703–709. [DOI] [PMC free article] [PubMed] [Google Scholar]
- (6).Han Y; Zhou S; Wang L; Guan X Electrophoresis 2015, 36, 467–470. [DOI] [PMC free article] [PubMed] [Google Scholar]
- (7).Wang L; Han Y; Zhou S; Wang G; Guan X ACS Appl. Mater. Interfaces 2014, 6, 7334–7339. [DOI] [PMC free article] [PubMed] [Google Scholar]
- (8).Stoddart D; Heron AJ; Mikhailova E; Maglia G; Bayley H Proc. Natl. Acad. Sci 2009, 106, 7702–7707. [DOI] [PMC free article] [PubMed] [Google Scholar]
- (9).Liu A; Zhao Q; Krishantha DM; Guan XJ Phys. Chem. Lett 2011, 2, 1372–1376. [DOI] [PMC free article] [PubMed] [Google Scholar]
- (10).Oukhaled A; Bacri L; Pastoriza-Gallego M; Betton JM; Pelta J ACS Chem. Biol 2012, 7, 1935–1949. [DOI] [PubMed] [Google Scholar]
- (11).Pastoriza-Gallego M; Breton MF; Discala F; Auvray L; Betton JM; Pelta J ACS Nano 2014, 8, 11350–11360. [DOI] [PubMed] [Google Scholar]
- (12).Majd S; Yusko EC; MacBriar AD; Yang J; Mayer MJ Am. Chem. Soc 2009, 131, 16119–16126. [DOI] [PMC free article] [PubMed] [Google Scholar]
- (13).Zhao Q; Wang D; Jayawardhana DA; de Zoysa RS; Guan XJ Am. Chem. Soc 2009, 131, 6324–6325. [DOI] [PubMed] [Google Scholar]
- (14).Luchian T; Shin SH; Bayley H Angew. Chem., Int. Ed 2003, 42, 3766–3771. [DOI] [PubMed] [Google Scholar]
- (15).Zhao Q; Jayawardhana DA; Guan X Biophys. J 2008, 94, 1267–1275. [DOI] [PMC free article] [PubMed] [Google Scholar]
- (16).Guan X; Gu LQ; Cheley S; Braha O; Bayley H ChemBioChem 2005, 6, 1875–1881 [DOI] [PubMed] [Google Scholar]
- (17).Rincon-Restrepo M; Mikhailova E; Bayley H, Maglia G Nano Lett 2011, 11, 746–750. [DOI] [PMC free article] [PubMed] [Google Scholar]
- (18).Maglia G; Rincon-Restrepo MR; Mikhailova E; Bayley H Proc. Natl. Acad. Sci 2008, 105, 19720–19725. [DOI] [PMC free article] [PubMed] [Google Scholar]
- (19).Jayawardhana DA; Crank JA; Zhao Q; Armstrong DW; Guan X Anal. Chem 2009, 81, 460–464. [DOI] [PubMed] [Google Scholar]
- (20).Yang Y-K; Yook K-J; Tae JJ Am. Chem. Soc 2005, 127, 16760–16761. [DOI] [PubMed] [Google Scholar]
- (21).Wang G; Wang L; Han Y; Zhou S; Guan X Biosens. Bioelectron 2014, 53, 453–458. [DOI] [PMC free article] [PubMed] [Google Scholar]
- (22).Lee JS Protein Pept. Lett 2014, 21, 247–255. [DOI] [PubMed] [Google Scholar]
- (23).Bowen HJM Environmental Chemistry of the Elements. Academic Press, New York: 1979, 1–320. [Google Scholar]
- (24).Hawley GG; Condensed Chemical Dictionary, Van Nostrand Reinhold Company, New York: 1981. [Google Scholar]
- (25).Roth P; Hollriegl V; Li WB; Oeh U; Schramel P Health Phys 2005, 88, 223–228. [DOI] [PubMed] [Google Scholar]
- (26).IAEA. Thorium fuel cycle-Potential benefits and challenges, IAEA-TECDOC-1450, Vienna: 2005. [Google Scholar]
- (27).Serfontein DE; Mulder EJ Nucl. Eng. Des 2014, 271, 106–113. [Google Scholar]
- (28).Mizani F; Shamsipur M; Yaftian MR; Matt DF Anal. Sci 2013, 29, 361–366. [DOI] [PubMed] [Google Scholar]
- (29).Aydin F; Soylak M Talanta 2006, 72,187–192. [DOI] [PubMed] [Google Scholar]
- (30).Osawa M; Tokunaga O; Itani M; Sakanoue M Nucl. Sci. Technol 1966, 3, 333–342 [Google Scholar]
- (31).Selvakumara R; Ashok Kumara SK; Kari V; Sivaramakrishnaa A; Brahmmananda Rao CVS; Sivaraman N; Shahoo SK Sens. Actuators B 2018, 255, 1391–1400. [Google Scholar]
- (32).Elabd AA RSC Adv 2016, 6, 45525–45532. [Google Scholar]
- (33).Chandra S; Agarwal H; Singh CK Anal Sci 2007, 23, 469–473. [DOI] [PubMed] [Google Scholar]
- (34).Gates AE; Gundersen LCS GSA Special Paper. 1992, 271, 17–28. [Google Scholar]
- (35).Wang D; Zhao Q; de Zoysa RSS; Guan X Sens. Actuators, B 2009, 139, 440–446. [Google Scholar]
- (36).Moore DS; Biochem. Educ 1985, 13, 10–11. [Google Scholar]
- (37).Wickleder MS; Fourest B; Dorhout PK Springer-Verlag. 2006, 3rd ed., 52–160. [Google Scholar]
- (38).Stefureac RI; Madampage CA; Andrievskaia O; Lee JS Biochem. Cell Biol 2010, 88, 347–358. [DOI] [PubMed] [Google Scholar]
- (39).Stefureac RI; Lee JS Small. 2008, 4, 1646–1650. [DOI] [PubMed] [Google Scholar]
- (40).Singh MK; Srivastava MN Talanta. 1972, 19, 699–700. [DOI] [PubMed] [Google Scholar]
- (41).Bukietyńska K; Podsiadly H; Karwecka Z J Inorg. Biochem 2003, 94, 317–25. [DOI] [PubMed] [Google Scholar]
- (42).Bregier-Jarzebowska R; Gasowska A; Lomozik L Bioinorg. Chem. Appl 2008, 253971. [DOI] [PMC free article] [PubMed] [Google Scholar]
- (43).Nelson DL; Cox MM Lehninger Principles of Biochemistry, W.H. Freeman and Company, New York: 2005, 71–95. [Google Scholar]
- (44).Micsonai A; Wien F; Kernya L; Lee YH; Goto Y; Réfrégiers M; Kardos J Proc. Natl. Acad. Sci. USA. 2015, 112, E3095–103. [DOI] [PMC free article] [PubMed] [Google Scholar]
- (45).Zhao Q; Jayawardhana DA; Wang D; Guan XJ Phys. Chem. B 2009, 113, 3572–3578. [DOI] [PubMed] [Google Scholar]
- (46).Jeanson A; Berthon C; Coantic S; Den Auwer C; Floquet N; Funke H; Guillaneux D; Hennig C; Martinez J; Moisy P; Petit S; Proux O; Quémeneur E; Solari PL; Subra G New J. Chem 2009, 33, 976–985 [Google Scholar]
- (47).Minicozzi V; Stellato F; Comai M; Serra MD; Potrich C; Meyer-Klaucke W; Morante SJ Biol. Chem 2008, 283, 10784–10792. [DOI] [PubMed] [Google Scholar]
- (48).Kang X; Gu L; Cheley S; Bayley H Angew. Chem., Int. Ed 2005, 44, 1495–1499. [DOI] [PubMed] [Google Scholar]
- (49).de Zoysa RSS; Krishantha DMM; Zhao Q; Gupta J; Guan X Electrophoresis. 2011, 32, 3034–3041. [DOI] [PMC free article] [PubMed] [Google Scholar]
- (50).Meller A; Nivon L; Branton D Phys. Rev. Lett 2001, 86, 3435–3438. [DOI] [PubMed] [Google Scholar]
- (51).Kuyucak S; Bastug TJ Biol. Phys 2003, 29, 429–446. [DOI] [PMC free article] [PubMed] [Google Scholar]
- (52).WHO. Guideline for drinking water quality. WHO, Geneva: 2004, 1. [Google Scholar]
Associated Data
This section collects any data citations, data availability statements, or supplementary materials included in this article.