

Due to the atypical serological profile of some patients with primary Q fever infection who do not develop IgM against Coxiella burnetii, we developed an avidity test to distinguish recent or past infections. We tested 39 serum samples by immunofluorescence with conventional assay and after urea treatment from 26 patients at different stages of the disease.
KEYWORDS: Coxiella burnetii, IgG, Q fever, serology, avidity, datation, diagnosis, immunofluorescence
ABSTRACT
Due to the atypical serological profile of some patients with primary Q fever infection who do not develop IgM against Coxiella burnetii, we developed an avidity test to distinguish recent or past infections. We tested 39 serum samples by immunofluorescence with conventional assay and after urea treatment from 26 patients at different stages of the disease. We observed a strong avidity in the 15 serum samples from patients with infections of >6 months and a low avidity for sera from patients with recent infections. A complete denaturation of the antibody-antigen complex was observed for patients for whom the time since the beginning of infection was <1 month and a mean of 2.06 ± 0.54 lowered titers when the infection was less than 3 months old. That was statistically significant compared to sera from patients with infections of greater than 6 months (mean 0.20 ± 0.41) and with infections between 3 and 6 months (mean, 1.17 ± 0.41) (P = 0.0022 and P < 0.0001, respectively). These results were visualized by Western blotting. We concluded that high avidity (≤1 lowered titer) ruled out infection during the last 6 months and that complete denaturation was related to an infection which had occurred within the previous 3 months. Between these two situations, the avidity test is inconclusive. We suggest using an avidity test for atypical Q fever serology that could be misclassified as residual antibodies (IgG against C. burnetii detected without active or recent infection) and for pregnant women risking obstetrical complications. This new test will dramatically improve the diagnosis and management of patients with Q fever.
INTRODUCTION
Q fever is a worldwide zoonosis caused by Coxiella burnetii. Acute infection is symptomatic in only 40% of cases and manifests commonly as flu-like syndrome, pneumonia, and/or transaminitis (1). The development of persistent infection including endocarditis was observed in patients with preexisting valvular heart disease (2–4) and vascular infection was observed in patients either with aneurysms or with vascular grafts (5). Because C. burnetii is a fastidious bacterium, the strategy for Q fever diagnosis is mainly based on serology. An indirect immunofluorescence assay (IFA) detecting phase I and phase II anti-C. burnetii antibodies is the reference method and is used for the routine diagnosis in our French Q fever reference center. The presence of phase II IgM (≥1:50) and IgG (≥1:200) favors acute Q fever, and a high titer of phase I IgG antibodies (≥1:800) suggests a persistent infection (6). We define residual antibodies as low or intermediate rate of IgG against Coxiella burnetii that can persist for several months or even years after primary infection, without active infection. However, we observed that 5% of patients who presented typical clinical symptoms of Q fever primary infection had positive serology with only phase I and phase II IgG antibodies (ranging between 1:100 and 1:400) without IgM (7). The biological interpretation of a serology with IgG at low or intermediate levels without IgM is then difficult to analyze, especially in distinguishing atypical acute infections from residual antibodies of past infections. Moreover, the symptoms of acute Q fever are multifaceted and indistinguishable from other diseases, and for many patients, we received only one serum sample within a few weeks or months following the clinical symptoms.
Therefore, we developed an avidity test to improve the accuracy of the serological diagnosis in dating the onset of the infection and to distinguish past from recent Q fever infections. Based on established practices with the use of urea for avidity tests on toxoplasmosis (8) and Cytomegalovirus infection (9) during pregnancy, we have developed avidity tests on phase I and phase II C. burnetii-specific IgG.
MATERIALS AND METHODS
Study design.
We included 39 serum samples from 26 patients diagnosed with acute or past Q fever in our French reference center between January 2016 and January 2019. Most of the patients had been treated for more than a year for persistent Q fever (vascular infection or endocarditis). For all patients testing with positive serology and/or quantitative PCR (qPCR) in our center, a standardized questionnaire was completed, including demographic data (age, geographical localization, etc.), date of onset of the symptoms, clinical signs, and risks factors of long-term complications (valvulopathy, aneurysm, elevated antiphospholipids, etc.).
We defined “past infection” for the patients whose diagnosis of Q fever was established at least 1 year prior. Eleven serum samples from 11 patients with phase I IgG antibody titers ranging between 1:200 and 1:6,400 were included is this group. In the “recent infections” group, we included 28 serum samples from 15 patients with acute Q fever according to the following diagnostic criteria: the association of clinical symptoms (fever, hepatitis, and/or pneumonia) with (i) a positive qPCR targeting the IS1111 and IS30A repeated sequences (10) on serum or blood and/or (ii) the presence of phase II IgM anti-Coxiella burnetii (≥1:50) or (iii) a seroconversion objectified by the appearance of IgG anti-Coxiella burnetii in a patient known negative. In this recent infections group, phase I and phase II IgG antibody titers ranged between 1:200 and 1:800. We received only one serum sample from each of 5 patients and several serum samples collected postinfection for 10 patients. Based on the combination of the onset of clinical symptoms and microbiological evidence of infection by qPCR and/or serology, we classified the 39 serum samples in 3 groups for statistical analysis. The onset of infection was ≤3 months for 19 serum samples, between 3 and 6 months for 5 serum samples, and >6 months for 15 serum samples (Table 1).
TABLE 1.
Workflow of patients and their serum samples in the study and distribution for statistical groups
| Patient no. | No. of serum samples for group: |
||
|---|---|---|---|
| ≤3 mo | 3–6 mo | ≥6 mo | |
| Recent infection | |||
| 1 | 1 | ||
| 2 | 2 | ||
| 3 | 2 | ||
| 4 | 1 | 2 | |
| 5 | 1 | 1 | |
| 6 | 1 | 1 | |
| 7 | 1 | ||
| 8 | 1 | ||
| 9 | 1 | ||
| 10 | 2 | ||
| 11 | 3 | ||
| 12 | 1 | 1 | |
| 13 | 1 | ||
| 14 | 1 | 2 | |
| 15 | 2 | ||
| Past infection (serum collected at least 1 yr after diagnosis of Q fever) | |||
| 16 | 1 | ||
| 17 | 1 | ||
| 18 | 1 | ||
| 19 | 1 | ||
| 20 | 1 | ||
| 21 | 1 | ||
| 22 | 1 | ||
| 23 | 1 | ||
| 24 | 1 | ||
| 25 | 1 | ||
| 26 | 1 | ||
Serology.
Serology was performed using our in-house-developed immunofluorescence assay (IFA) protocol using C. burnetii Nine Mile strain phase I and phase II antigen as previously described (patient serum is serially diluted 1/100 to 1/1,600) (6). To measure the serum avidity of phase I and phase II IgG, we used a modified protocol by adding a step of incubation with a commercial reagent containing urea (Vidas CMV IgG avidity II; bioMérieux, Marcy-l’Étoile, France). The exact composition of the reagent is not given; however, we have determined the urea concentration using a biochemical analyzer Cobas 6000 (method, UV; Roche Company, Switzerland). The urea concentration in the reagent used is approximately 5,350 mmol/liter. Urea is a chaotrope and alters the three-dimensional structure of biological macromolecules, including antigen-antibody complexes, and denatures them by interference with weak (noncovalent) intramolecular interactions. In the antigen-antibody reaction, the denaturing power of urea acts mainly on the antibodies developed during the early stage of the infection. The IgG avidity is initially low but increases toward high avidity a few months after the primary infection (11, 12). Twenty-five microliters of the reagent with urea is deposited on the slide after 30 min of incubation of the sera with the antigen. Urea remains in contact with the antibody-antigen complex on the slide for 10 min at 37°C, and then 3 washing steps of 10 min in phosphate-buffered saline (PBS) Tween were performed to eliminate urea and low avidity antibodies (6). Strictly positive (serum from a patient with Coxiella burnetii endocarditis objectified by PCR and culture positive on heart valve) and negative controls (control with sterile water, control with anti-human immunoglobulins, and control with no fat milk) were used, and the reading of slides with immunofluorescence microscopy was performed by two different operators. Phase I and phase II IgG titers with and without urea treatment were compared. The denaturing power of urea was therefore considered effective if more than one dilution difference was observed between the initial serology and the serology after urea by the two operators.
We first tested 11 serum samples from the 11 patients from the past infections group with IgG titers ranging from 1:200 to 1:6,400. As expected, even after 30 min of incubation with urea, the phase I and phase II IgG titers remained identical to the initial values in all of the patients. Urea appears unable to denature the antigen-antibody reaction in patients with past Q fever that showed high anti-Coxiella burnetii IgG avidity.
In the recent infections group, the diagnosis of acute Q fever was made by both serum qPCR and positive IgM (n = 5, patients 1 to 5), there was only positive PCR on serum but no IgM (n = 4, patients 6 to 9) and only positive IgM and negative qPCR (n = 5, patients 10 to 14). One patient (patient 15) had negative qPCR and negative IgM but presented an IgG seroconversion (Table 2). First, we tested 9 serum samples from patients sampled during the early stage of the acute infection dating less than 1 month (IgG titers ranging from 1:200 to 1:400). A complete denaturation of the antigen-antibody complex was observed for phase I and phase II IgG, and immunofluorescence was entirely negative for the 9 serum samples treated with urea (Table 2). To optimize our protocol and to reduce the incubation time of sera with urea, we tested again these 9 serum samples with different incubation times of 5, 10, 15, 20, and 30 min. We also observed complete denaturation of the antigen-antibody complex for the different incubation times tested except for the incubation time of 5 min, for which denaturation was incomplete. We retained an incubation time of 10 min for the rest of the study.
TABLE 2.
Chronology of IgG serology test before and after urea treatment of our patients
| Patient no. | Date of infection (day-mo-yr) | Status of infection |
Date (day-mo-yr) of: |
Time from infection | IgG titer dilution factor |
No. of lowered titers |
||||||
|---|---|---|---|---|---|---|---|---|---|---|---|---|
| Phase I |
Phase II |
|||||||||||
| qPCR (serum) | IgM | Seroconversion IgG | Serology | Before urea | After urea | Before urea | After urea | Phase I | Phase II | |||
| 1 | 8-Nov-18 | Positive | Positive | 28-Nov-18 | <1 mo | 200 | 0 | 200 | 0 | 2 | 2 | |
| 2 | 22-Aug-18 | Positive | Positive | 22-Aug-18 | <1 mo | 200 | 0 | 100 | 0 | 2 | 1 | |
| 9-Nov-18 | 2.5 mo | 200 | 100 | 100 | 0 | 1 | 1 | |||||
| 3 | 4-Sep-18 | Positive | Positive | 29-Oct-18 | 1 mo | 200 | 0 | 100 | 0 | 2 | 1 | |
| 4-Dec-18 | 2.5 mo | 200 | 0 | 100 | 0 | 2 | 1 | |||||
| 4 | 2-Aug-18 | Positive | Positive | 12-Oct-18 | 2 mo | 400 | 200 | 400 | 200 | 1 | 1 | |
| 23-Nov-18 | 3 mo | 200 | 100 | 200 | 100 | 1 | 1 | |||||
| 12-Dec-18 | 4 mo | 200 | 100 | 200 | 100 | 1 | 1 | |||||
| 5 | 3-Jul-17 | Positive | Positive | 4-Sep-17 | 2 mo | 400 | 100 | 400 | 100 | 2 | 2 | |
| 16-Dec-17 | 5 mo | 200 | 0 | 200 | 0 | 2 | 2 | |||||
| 6 | 18-Apr-18 | Positive | Negative | 26-Sep-18 | 5 mo | 400 | 200 | 400 | 200 | 1 | 1 | |
| 6-Dec-18 | 8 mo | 200 | 200 | 200 | 200 | 0 | 0 | |||||
| 7 | 19-Nov-18 | Positive | Negative | 19-Nov-18 | <1 mo | 200 | 0 | 200 | 0 | 2 | 2 | |
| 8 | 21-Aug-18 | Positive | Negative | 20-Nov-18 | 3 mo | 400 | 100 | 400 | 0 | 2 | 3 | |
| 9 | 28-Sep-18 | Positive | Negative | 17-Jan-19 | 2,5 mo | 200 | 0 | 100 | 0 | 2 | 1 | |
| 10 | 9-Aug-18 | Negative | Positive | 15-Oct-18 | 2 mo | 200 | 0 | 100 | 0 | 2 | 1 | |
| 8-Nov-18 | 3 mo | 200 | 0 | 200 | 0 | 2 | 2 | |||||
| 11 | 30-May-18 | Negative | Positive | 12-Jun-18 | <1 mo | 400 | 0 | 200 | 0 | 3 | 2 | |
| 6-Aug-18 | 2 mo | 200 | 0 | 200 | 0 | 2 | 2 | |||||
| 17-Sep-18 | 3 mo | 100 | 0 | 100 | 0 | 1 | 1 | |||||
| 12 | 3-May-18 | Negative | Positive | 17-May-18 | <1 mo | 200 | 0 | 200 | 0 | 2 | 2 | |
| 14-Aug-18 | 3.5 mo | 200 | 100 | 200 | 0 | 1 | 2 | |||||
| 13 | 28-May-18 | Negative | Positive | 17-Dec-18 | 7 mo | 400 | 200 | 400 | 200 | 1 | 1 | |
| 14 | 10-Jun-17 | Negative | Positive | 2-Sep-17 | 3 mo | 800 | 200 | 800 | 100 | 2 | 3 | |
| 4-Dec-17 | 8 mo | 800 | 400 | 800 | 400 | 1 | 1 | |||||
| 8-Jun-18 | 12 mo | 400 | 200 | 400 | 200 | 1 | 1 | |||||
| 15 | Not precisely known | Negative | Negative | Between 15-May-18 and 25-Jun-18 | 15-Jun-18 | <1 mo | 400 | 0 | 400 | 0 | 3 | 3 |
| 2-Jul-18 | 1 mo | 400 | 0 | 400 | 0 | 3 | 3 | |||||
| 16 | 28-May-2010 | Positive | Positive | 5-Oct-2018 | 8 yr | 200 | 200 | 100 | 100 | 0 | 0 | |
| 17 | 13-Mar-2016 | Negative | Positive | 10-Oct-2018 | 2 yr | 400 | 400 | 400 | 400 | 0 | 0 | |
| 18 | 20-Jul-2017 | Positive | Negative | 1-Oct-2018 | 1.5 yr | 200 | 200 | 100 | 100 | 0 | 0 | |
| 19 | 9-Mar-2011 | Negative | Positive | 18-Dec-2018 | 7 yr | 200 | 200 | 200 | 200 | 0 | 0 | |
| 20 | 5-Apr-2017 | Positive | Positive | 12-Dec-2018 | 1.5 yr | 800 | 800 | 400 | 400 | 0 | 0 | |
| 21 | 28-Feb-2016 | Positive | Positive | 19-Dec-2018 | 2 yr | 200 | 200 | 200 | 200 | 0 | 0 | |
| 22 | 6-Jun-2014 | Positive | Positive | 2-Nov-2018 | 4 yr | 800 | 800 | 800 | 800 | 0 | 0 | |
| 23 | 14-Apr-2013 | Negative | Positive | 7-Nov-2018 | 5 yr | 400 | 400 | 100 | 100 | 0 | 0 | |
| 24 | 9-Nov-2017 | Positive | Positive | 15-Dec-2018 | 1 yr | 3,200 | 3,200 | 800 | 800 | 0 | 0 | |
| 25 | 22-Mar-2016 | Positive | Positive | 25-Oct-2018 | 2 yr | 800 | 800 | 400 | 400 | 0 | 0 | |
| 26 | 26-Aug-2017 | Positive | Positive | 22-Nov-2018 | 1.5 yr | 1,600 | 1,600 | 400 | 400 | 0 | 0 | |
Western blotting.
Twenty microliters of the preparation of C. burnetii Nine Mile strain phase I antigen (0.20 μg/ml), purified by a sucrose gradient, was electrophoresed at 100 V for 2 h through 12% polyacrylamide separating gels (Bio-Rad miniprotean II Cell). C. burnetii resolved antigens were then transferred to a 0.45-μm-pore-size nitrocellulose membrane (Trans-Blot Cell; Bio-Rad) for 1 h at 4°C and 100 V (Tris, glycine 10× [500 ml], 1 liter of ethanol, and 3.5 liters of distilled water). The blots were blocked overnight at 4°C with 5% nonfat milk powder in lab-made buffer (12.1 g Tris, 87.6 g NaCl, and 5 ml Tween 20 for 10 liters of distilled water, pH 7). For each patient, two serum samples (dilution 1:100 in lab-made buffer with 0.5% nonfat milk powder) were applied to the membrane for 1 h at room temperature and with constant agitation. After three washes of 10 min with lab-made buffer containing 0.5% nonfat milk powder, the urea denaturation step was performed on one of the two serum samples. Urea (Vidas CMV IgG avidity II; bioMérieux, Marcy-l’Étoile, France) was applied for 20 min on the membrane at room temperature and with constant agitation. Three 10-min washes were again performed with lab-made buffer containing 0.5% nonfat milk powder to remove urea and denatured low avidity antibodies. The two serum samples were then subjected to the same protocol again. The anti-human globulins (peroxidase-conjugated AffiniPure goat anti-human; Jackson ImmunoResearch Laboratories, Inc., West Grove, PA) at 0.8 μg/ml (lab-made buffer, 0.5% nonfat milk powder) were added and incubated on the membrane for 1 h. Three more washes of 10 min each were performed with the lab-made buffer (no milk was added). Bound conjugate was revealed by incubating with a Luminol solution (ECL Western blotting substrate; Promega, Madison, WI, USA). The chemiluminescence reaction was visualized with the Fusion FX7 (Vilber Lourmat, Marne-la-Vallée, France).
Statistical analyses.
We reasoned that there would be lower titers for serology without urea than for serology with urea. Indeed, our manual serology technique does not allow a precise titration but rather a reading of the last dilution of the serum giving a positive fluorescence signal. The denaturation capacity of the antigen-antibody complex is therefore quantified by the numbers of lowered titers. To compare our data, we used a Mann Whitney test with Prism 8 (GraphPad).
RESULTS
We defined 3 groups depending on the onset of infection: <3 months (n = 19), between 3 and 6 months (n = 5), and infections dating back more than 6 months (n = 15) (Fig. 1). For past infections, the average of lowered titers was 0.2 ± 0.41 for both phase I and phase II IgG titers. In the “between 3 and 6 months” group, the average of lowered titers was 1.17 ± 0.41 for phase I IgG and 1.33 ± 0.52 for phase II IgG. In the “<3 months” group, the average was 2.06 ± 0.54 for phase I IgG and 1.83 ± 0.79 for phase II IgG. The averages of lowered titers were significantly higher in the “< 3 months” group and in the “between 3 and 6 months” group than in the “> 6 months” group for phase I and phase II IgG (P < 0.0001, P = 0.0010, P < 0.0001 and P = 0.0006, respectively, using Mann Whitney test). The average of lowered titers for the group “<3 months” was higher than for the “between 3 and 6 months” group for phase I IgG (significant, P = 0.0022) and phase II IgG (not significant, P = 0.218). However, the group “between 3 and 6 months” included only 5 serum samples. This group is therefore extremely limited and the statistical analysis is not very relevant.
FIG 1.
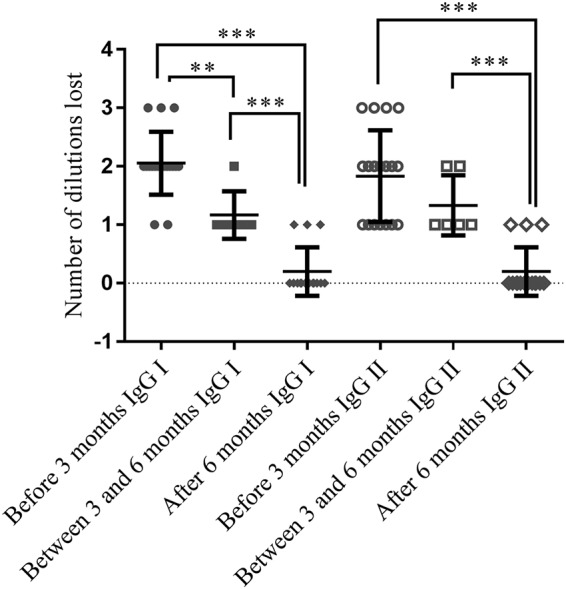
Comparison of lowered titers before and after urea treatment (IgG phase I and phase II) between three groups depending on the onset of infection: <3 months, between 3 and 6 months, >6 months (calculated means and standard deviations). **, P < 0.01; ***, P < 0.001.
To confirm our results, we performed Western blotting with phase II Coxiella burnetii antigen. We tested 5 serum samples collected during the acute phase of the disease (<1 month) and 5 serum samples from patients with past infections (>6 months). As for the immunofluorescence assay, we conducted in parallel experiments with and without urea. The Western blot from the five serum samples from patients with past infection showed high reactivity, and we observed identical profiles of the Western blotting performed with or without urea for the 5 patients (Fig. 2). The Western blot of patients with recent infection showed lower reactivity than for patients with past infection. A single band was observed for 4 patients, and similarly to the IFA, a complete disappearance or a decreased intensity of the bands was observed after treatment with urea. For the 5th patient with recent infection, approximately 10 bands were observed, and 9 disappeared after treatment with urea.
FIG 2.

Coxiella burnetii Western blot before and after (′) urea treatment. A, B, C, D, and E are patients from the <3 months group. Patients F, G, H, I, and J are from the “previous infections” group.
DISCUSSION
We tested phase I and phase II IgG avidity on 39 serum samples from 26 patients presenting Q fever at different stages of the disease. In our center, we have over 30 years of experience in the serological diagnosis of Q fever using validated IFA protocols with strict positive and negative controls. Here, we clearly established that a denaturation of phase I and II IgG with urea is observed in cases of recent infection, while a strong avidity is found for patients who suffered from an infection of >6 months. These results were confirmed using Western blotting, as we observed a disappearance of the bands after urea treatment in cases of recent infection, whereas the Western blot profiles of the patients remained identical with and without urea in cases of past infection. To more precisely date the infection, we concluded that a low avidity is in favor of possible Q fever infection occurring in the 3 months preceding the onset of symptoms and that a high avidity excludes recent Q fever infection within the last 6 months. Even if there a statistically significant difference in the calculated means between the three groups, values overlap between the first and second groups and between the second and third groups. This seems to reveal significant interindividual variability, but unfortunately, we do not have enough data to refine dating between 3 and 6 months. These results were concordant with the already known dating with avidity performed for toxoplasmosis or cytomegalovirus infection. Indeed, in the case of toxoplasmosis and Cytomegalovirus, high avidity (IgG after urea treatment of >80% of the initial titers) indicates an infection dating back more than 2, 3, or 4 months according to the reagent kits used and the pathogens. Very low avidity (<20%) is in favor of a recent infection. Finally, in some cases, avidity is intermediate and therefore not contributory, since we cannot certify the residual antibodies (9, 13).
Unlike existing commercial enzyme-linked immunosorbent assays (ELISAs), manual immunofluorescence does not allow us to calculate an avidity index; however, we choose to reason in terms of lowered titers between initial values and those after urea treatment. To limit variations in the appreciation of the degree of fluorescence, the slides were read by 2 different operators, and we concluded that lowered titers occurred when the two operators had concordant results. No disagreement was observed between the 2 different operators concerning the lowered titers between sera treated or not with urea during this study. Our avidity measurement technique is therefore difficult to apply to low titers of IgG, and we suggest using avidity tests only for sera with an IgG titer of ≥1:200. Moreover, the test showed reproducible results; concordant results were found in each of the 3 groups of patients.
Avidity testing could be very useful for patients presenting isolated phase I and phase II IgG antibodies (between 1:200 and 1:400), which represent approximately 5% of the patients diagnosed in our center. Most of them were tested for Q fever concomitantly or following a febrile episode. This was the case for patients 6, 7, 8, and 9 who presented only phase I and phase II IgG without IgM and for which the microbiological confirmation of the acute stage of the disease could be established only by the detection of the bacterium in the serum by qPCR. When the qPCR remained negative, we were unable to clearly distinguish a primary infection from a past infection in most cases. Moreover, DNA of the bacteria became rapidly undetectable using qPCR as antibodies appeared (7), and we did not always receive 2 serum samples to determine the kinetics of the infection (as in the case of patient 15). Therefore, avidity allowed us to refine our diagnosis criteria and to estimate if the patient was infected with C. burnetii recently or not, which is crucial for the management of the patient. It is important to investigate if the patient with recent infection presented with risk factors for progression toward a persistent infection and to start antibiotic prophylaxis with doxycycline and hydroxychloroquine if necessary (2).
We suggest using this avidity test for patients that present compatible clinical symptoms for acute Q fever (fever, transaminitis, and pneumonia) within 3 months of a positive serology with phase I and II IgG titers of ≥1:200 without IgM and a negative qPCR (Fig. 3). It is particularly useful to test patients with unknown valvular and vascular risk factors at the time of the diagnosis. A low avidity, whatever the gG levels, should indicate acute Q fever. If avidity is high and IgG is <1:800, we conclude there are residual antibodies. When a high avidity with IgG of ≥1:800 is observed, a persistent focalized infection should be investigated according to our updated strategy (1). As first-line diagnostic techniques, transthoracic echocardiography (TTE) and antiphospholipid dosage are recommended for all patients diagnosed with acute Q fever in our center (14). Avidity could also be very useful in pregnant woman who are diagnosed with isolated Q fever serology (presence of IgG only without specific clinical signs). Diagnosis of Q fever in pregnant women is particularly difficult, because they are very frequently asymptomatic (15). Various obstetrical complications such as miscarriage, stillbirths, malformations, growth retardation, and premature delivery were described in infected pregnant women (16, 17). Hence, because infection is frequently asymptomatic but can cause severe obstetrical complications, an isolated positive serology (presence of IgG only without specific clinical signs) is a therapeutic challenge. Q fever avidity could be critical in this context. Indeed, we recommend systematically treating pregnant women with primary infections by C. burnetii during pregnancy with co-trimoxazole until the end of the 8th month, and this treatment prevents obstetrical complications (17). Consequently, as is the case in the context of toxoplasmosis, pregnant women with positive C. burnetii serology and low avidity should be treated promptly and carefully. Avidity should be performed systematically in this context. However, before this technique can be used to change therapeutic recommendations, confirmation by other teams is necessary to ensure reproducibility and generalizability.
FIG 3.

Decisional algorithm for the use of the urea avidity test on Q fever IgG in our French National Reference Center.
In conclusion, we determined that the avidity was strong when no lowering of dilution or at most a lowering of a single dilution was observed. A high avidity allowed the exclusion of an infection occurring in the last 6 months. We determined a low avidity if a complete denaturation of the C. burnetii antigen and phase I and II antibodies was observed and was related to a recent infection (less than 3 months). Between these two situations, if the number of lowered titers is ≥1 but without total denaturation, the avidity is intermediate and inconclusive. The urea test is a new serological tool that is reliable, fast, simple, and inexpensive and that allows us to catch some cases of primary infection with atypical serological profiles. To our knowledge, we are the only ones to use it in the context of Q fever; it is now integrated into our hospital routine. This test may be used for serology of atypical or acute Q fever infections that have been misclassified as residual antibodies. This is important because the management of the patient changes accordingly. Because persistent infections remain fatal without efficient treatment and an earlier diagnosis significantly improves the prognosis (3), the predisposing factor for evolution of acute Q fever in persistent infection could be identified in these patients with systematic TTE or antiphospholipid dosage, and a treatment with doxycycline could be instituted in cases of symptomatic infection.
REFERENCES
- 1.Eldin C, Mélenotte C, Mediannikov O, Ghigo E, Million M, Edouard S, Mege J-L, Maurin M, Raoult D. 2017. From Q fever to Coxiella burnetii infection: a paradigm change. Clin Microbiol Rev 30:115–190. doi: 10.1128/CMR.00045-16. [DOI] [PMC free article] [PubMed] [Google Scholar]
- 2.Million M, Walter G, Thuny F, Habib G, Raoult D. 2013. Evolution from acute Q fever to endocarditis is associated with underlying valvulopathy and age and can be prevented by prolonged antibiotic treatment. Clin Infect Dis 57:836–844. doi: 10.1093/cid/cit419. [DOI] [PubMed] [Google Scholar]
- 3.Million M, Thuny F, Richet H, Raoult D. 2010. Long-term outcome of Q fever endocarditis: a 26-year personal survey. Lancet Infect Dis 10:527–535. doi: 10.1016/S1473-3099(10)70135-3. [DOI] [PubMed] [Google Scholar]
- 4.Million M, Raoult D. 2015. Recent advances in the study of Q fever epidemiology, diagnosis and management. J Infect 71:S2–S9. doi: 10.1016/j.jinf.2015.04.024. [DOI] [PubMed] [Google Scholar]
- 5.Eldin C, Mailhe M, Lions C, Carrieri P, Safi H, Brouqui P, Raoult D. 2016. Treatment and prophylactic strategy for Coxiella burnetii infection of aneurysms and vascular grafts: a retrospective cohort study. Medicine (Baltimore) 95:e2810. doi: 10.1097/MD.0000000000002810. [DOI] [PMC free article] [PubMed] [Google Scholar]
- 6.Dupont HT, Thirion X, Raoulti D. 1994. Q fever serology: cutoff determination for microimmunofluorescence. Clin Diagn Lab Immunol 1:189–196. [DOI] [PMC free article] [PubMed] [Google Scholar]
- 7.Fournier P-E, Raoult D. 2003. Comparison of PCR and serology assays for early diagnosis of acute Q fever. J Clin Microbiol 41:5094–5098. doi: 10.1128/jcm.41.11.5094-5098.2003. [DOI] [PMC free article] [PubMed] [Google Scholar]
- 8.Holliman RE, Raymond R, Renton N, Johnson JD. 1994. The diagnosis of toxoplasmosis using IgG avidity. Epidemiol Infect 112:399–408. doi: 10.1017/s0950268800057812. [DOI] [PMC free article] [PubMed] [Google Scholar]
- 9.Blackburn NK, Besselaar TG, Schoub BD, O'Connell KF. 1991. Differentiation of primary cytomegalovirus infection from reactivation using the urea denaturation test for measuring antibody avidity. J Med Virol 33:6–9. doi: 10.1002/jmv.1890330103. [DOI] [PubMed] [Google Scholar]
- 10.Renvoisé A, Raoult D, Eldin C, Angelakis E. 2013. Coxiella burnetii DNA, but not viable bacteria, in dairy products in France. Am J Trop Med Hyg 88:765–769. doi: 10.4269/ajtmh.12-0212. [DOI] [PMC free article] [PubMed] [Google Scholar]
- 11.Inouye S, Hasegawa A, Matsuno S, Katow S. 1984. Changes in antibody avidity after virus infections: detection by an immunosorbent assay in which a mild protein-denaturing agent is employed. J Clin Microbiol 20:525. [DOI] [PMC free article] [PubMed] [Google Scholar]
- 12.Lappalainen M, Hedman K. 2004. Serodiagnosis of toxoplasmosis. The impact of measurement of IgG avidity. Ann Ist Super Sanita 40:81–88. [PubMed] [Google Scholar]
- 13.Hedman K, Lappalainen M, Seppäiä I, Mäkelä O. 1989. Recent primary toxoplasma infection indicated by a low avidity of specific IgG. J Infect Dis 159:736–740. doi: 10.1093/infdis/159.4.736. [DOI] [PubMed] [Google Scholar]
- 14.Melenotte C, Protopopescu C, Million M, Edouard S, Carrieri MP, Eldin C, Angelakis E, Djossou F, Bardin N, Fournier P-E, Mège J-L, Raoult D. 2018. Clinical features and complications of Coxiella burnetii infections from the French National Reference Center for Q fever. JAMA Netw Open 1:e181580. doi: 10.1001/jamanetworkopen.2018.1580. [DOI] [PMC free article] [PubMed] [Google Scholar]
- 15.Tissot-Dupont H, Vaillant V, Rey S, Raoult D. 2007. Role of sex, age, previous valve lesion, and pregnancy in the clinical expression and outcome of Q fever after a large outbreak. Clin Infect Dis 44:232–237. doi: 10.1086/510389. [DOI] [PubMed] [Google Scholar]
- 16.Raoult D, Fenollar F, Stein A. 2002. Q fever during pregnancy: diagnosis, treatment, and follow-up. Arch Intern Med 162:701. doi: 10.1001/archinte.162.6.701. [DOI] [PubMed] [Google Scholar]
- 17.Million M, Roblot F, Carles D, D'Amato F, Protopopescu C, Carrieri MP, Raoult D. 2014. Reevaluation of the risk of fetal death and malformation after Q fever. Clin Infect Dis 59:256–260. doi: 10.1093/cid/ciu259. [DOI] [PubMed] [Google Scholar]