Abstract
Objective:
Extracellular vesicles secreted by cardiosphere-derived cells (CDCev) polarize macrophages (Mϕ) toward a distinctive phenotype with enhanced phagocytic capacity (MCDCev). These changes underlie cardioprotection by CDCev and by the parent CDCs, notably attenuating the “no reflow” phenomenon following myocardial infarction (MI), but the mechanisms are unclear. Here we tested the hypothesis that MCDCev are especially effective at scavenging debris from dying cells (i.e., efferocytosis) to attenuate irreversible damage post-MI.
Approach and Results:
In vitro efferocytosis assays with bone marrow-derived Mϕ, and in vivo transgenic rodent models of MI, demonstrate enhanced apoptotic cell clearance with MCDCev. CDCev exposure induces sustained MerTK expression in MCDCev through extracellular vesicle transfer of miR-26a (via suppression of Adam17); the cardioprotective response is lost in animals deficient in MerTK. Single-cell RNA-sequencing revealed phagocytic pathway activation in MCDCev, with increased expression of complement factor C1qa, a phagocytosis facilitator.
Conclusions:
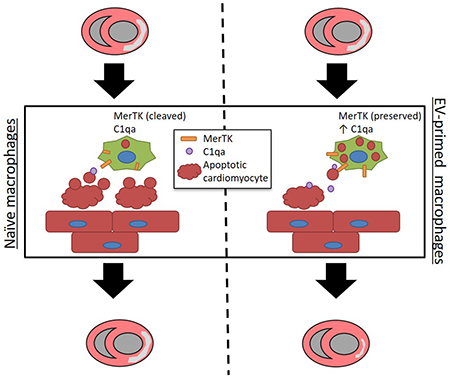
Together, these data demonstrate that extracellular vesicle modulation of MerTK and C1qa expression leads to enhanced Mϕ efferocytosis and cardioprotection.
Keywords: Myocardial infarction, extracellular vesicles, macrophages, efferocytosis, Cell therapy, inflammation, myocardial infarction
Graphical Abstract
INTRODUCTION
Efficient clearance of dying cells, or efferocytosis1, is a fundamental physiological process that supports tissue growth and homeostasis2, 3. Apoptotic cells are rapidly removed in steady state without much inflammatory response2. Defective clearance of apoptotic cells leads to a proinflammatory response and a propensity to autoimmunity (e.g., systemic lupus erythematosus)4. In myocardial infarction (MI), death of myocardial cells (e.g., cardiomyocytes, endothelial cells, fibroblasts) during ischemia/reperfusion stimulates the recruitment of neutrophils and monocyte/macrophages (Mϕ)5. Mϕ exhibit extensive functional plasticity dependent upon activation (in vitro) or microenvironmental milieu (in vivo)6. Following MI, monocytes are implicated in (at least) two distinct phases7, 8: first, a highly phagocytic, proteolytic, and proinflammatory monocyte population is recruited to the site of injury, where they differentiate into Mϕ to clear necrotic and apoptotic cell debris. Later, a contrasting Mϕ phenotype emerges with anti-inflammatory, profibrotic, and angiogenic properties to resolve the complex inflammatory response. The final consequence is systematic replacement of contractile myocardium by scar.
Cardiosphere-derived cells (CDCs)9–11 are therapeutic candidates in clinical testing for a variety of indications, including post-MI contractile dysfunction12. CDCs and their secreted extracellular vesicles (CDCev) limit MI size when delivered within 30 minutes of reperfusion in rats9, 10 and pigs13, 14. Such cardioprotection minimizes the “no reflow” phenomenon of microvascular occlusion after extensive myocardial necrosis13, 14. The mechanism of CDC- and CDCev-mediated cardioprotection is critically dependent upon Mϕ: exposure to either CDCs or CDCev polarizes Mϕ into a phenotype that is highly phagocytic yet anti-inflammatory9, 10. Here we test the hypothesis that CDCev, which mediate the benefits of CDCs, limit myocardial damage post-MI through enhanced Mϕ efferocytosis and an attenuated proinflammatory response. Using an array of in vitro and in vivo assays, we validate our hypothesis and identify a CDCev-derived microRNA responsible for sustaining MerTK (key efferocytosis receptor) expression in Mϕ conditioned by CDCs (MCDCev).
MATERIALS AND METHODS
The data that support the findings of this study are available from the corresponding author upon reasonable request.
Cell culture and extracellular vesicle (EV) isolation
Primary human cells (Cardiosphere-derived cells [CDCs] and dermal fibroblasts [FB]) were isolated from primary human tissue or purchased from ATCC, respectively9. To isolate EVs, cells were grown to confluence, washed 4 times with PBS (to remove any residual FBS-derived EVs), and then incubated in serum-free media at 37°C. Fifteen days later, conditioned media was collected, filtered (0.45μm, Millipore), and then concentrated using ultrafiltration by centrifugation (UFC) with a 10kDa molecular weight cut-off (MWCO; Millipore).
Cell isolation
Macrophages.
Bone marrow was isolated as previously described. Rat or mouse femurs were isolated, sterilized with ethanol (70% in H2O), flushed with PBS (containing 1% FBS, 2mM EDTA), and filtered through a 70μm filter. Red blood cells were lysed with ACK buffer (Invitrogen) then resuspended in IMDM (containing 10% FBS, 10ng/mL M-CSF [R&D Systems]). The resulting cell suspension was plated and grown for 6–7 days to obtain macrophages (Mϕ).
Neutrophils.
Rats were injected intraperitoneally with Brewer’s Thioglycollate (3% in PBS, MilliporeSigma). Four hours later, animals were sacrificed, and peritoneal cavity flushed (PBS containing 2mM EDTA). The resulting cell suspension was analyzed for purity by flow cytometry (Figure II, A–B in the online-only Data Supplement).
Neonatal Cardiomyocytes.
Cell and EV visualization
Nanoparticle Tracking Analysis (NTA).
Extracellular vesicles were analyzed for particle number and size distribution using NTA (Nanosight NS300, Malvern). Conditioned media was advanced into the microfluidics chamber of the NS300 using an automated syringe pump and then particles were visualized (20x magnification) and captured by video (30 frames per second). Four representative cycles were collected for each sample, and measurements for concentration and size were obtained and averaged.
Oxford Nanoimaging (ONI).
Extracellular vesicles were analyzed for uptake by super-resolution microscopy (Nanoimager, ONI). To visualize EVs, concentrated conditioned media was incubated with CD81 monoclonal antibody (clone M83, ThermoFisher; 37˚C for 60 minutes). Extracellular vesicles were washed by UFC and then incubated with a secondary Alexa Fluor 488 antibody (ThermoFisher; 37°C for 60 minutes). All residual unbound antibodies were removed by two sequential PBS washes.
Immunofluorescence.
All tissue and cell samples were visualized by either confocal microscopy (Leica) or cell imaging multi-mode reader (Cytation 5, Biotek).
Cell Treatment
Extracellular Vesicles.
Polarization of Mϕ toward MFBev or MCDCev (3×10⁹ particles) was performed on the night between days 7 and 8 (~18hrs).
miRNA mimics.
Mϕ were transfected with miRNA mimic (hsa-miR-26a-5p; Horizon) or scrambled control (Horizon) using DharmaFECT 1 (Horizon) to generate MmiR-26a and MmiR-sc. Treatments were performed on the night between days 7 and 8 (~18hrs).
Animal models
All studies were performed at Cedars-Sinai Medical Center and Northwestern University in accordance with the Institutional Animal Care and Use Committee (IACUC) guidelines. Female rodents were used for all in vivo experimental studies to control for body weight and size during surgery.
Rat.
All rats were housed in a pathogen-free facility (cage bedding: Sani-Chips, PJ Murphy) with a 14hrs/10hrs light/dark cycle with food (PicoLab Rodent Diet 20 [#5053], LabDiet) and water provided ad libitum. In vivo experimental protocols were performed on 7-10-week-old female Wistar-Kyoto (WKY; Charles River Labs, Wilmington, MA) and Sprague-Dawley transgenic enhanced Green Fluorescent Protein (SD-Tg(UBC-EGFP)2BalRrrc, denoted as SD-eGFP for simplicity; Rat Resource & Research Center, Columbia, MO) rats. To induce ischemic injury, rats were provided general anesthesia and then a thoracotomy was performed at the 4th intercostal space to expose the heart and left anterior descending (LAD) coronary artery. A 7-0 silk suture was then used to ligate the LAD. In WKY rats, myocardial ischemia-reperfusion (IR) injury was created by removing the suture after 45 minutes to allow for reperfusion. Twenty minutes later, Mϕ (5×10⁵ cells in 100μL PBS) were injected into the left ventricular cavity with an aortic cross-clamp, over a period of 20 seconds. In SD-eGFP rats, myocardial infarction (MI) was created by permanently ligating the LAD. Twenty minutes later, Mϕ (1×10⁶ cells in 100μL PBS) were injected into the infarct border zone.
Mouse.
All mice were housed in a pathogen-free facility (cage bedding: Aspen Coarse Grade Woodchip, Prairieland Feeds) with a 14hrs/10hrs light/dark cycle with food (Teklad LM-485 [#7912], Envigo) and water provided ad libitum. In vivo experimental protocols were performed on 2-4-month-old female C57BL/6J (WT) and αMHC-mCherry mice purchased from Jackson Labs (Bar Harbor, ME). MerTK deficient (MerTK−/−) mice were backcrossed over 10 generations to a C57BL/6J background15 and maintained in-house. Mice were anesthetized with avertin and received buprenorphine (0.1mg/kg) prior to surgery for pain management. Following left-side thoracotomy, myocardial IR injury was induced by temporarily ligating the LAD coronary artery for 45 minutes followed by removing the suture to allow for reperfusion; ischemia was confirmed by tissue blanching and reperfusion confirmed by restoration of blood flow through the LAD and return of natural tissue color. Twenty minutes later, CDCev (5×10⁹ particles in 30μL PBS) or vehicle (30μL PBS) were injected into the myocardium at three different sites (10μL/site) within the infarct border zone.
Flow cytometry
Cell culture.
In vitro efferocytosis cocultures were detached (Accutase, ThermoFisher Scientific), washed (Perm/Wash, BD Biosciences), and then stained with APC-CD11b (BD Biosciences). Cells were sorted (CyAn ADP Analyze, Dako) and analyzed (FlowJo Software, Tree Star) based on their cell surface marker expression (Mϕ: CD11b+) or lipophilic stain (cardiomyocytes: DiD+, Invitrogen).
Cardiac Tissue.
Hearts were harvested 2 (mouse) or 4 (rat) hours after ischemic injury and the infarcted left ventricle was excised. Heart tissue was minced and digested (Collagenase Type II and DNase I) at 37°C for 30 minutes with rotation and triturated through a 40μm filter to generate a single-cell suspension. Cells were incubated with TruStain fcX (BioLegend) and then labeled with fluorescently-conjugated antibodies (mouse: CD11b, Ly6G, Ly6C, F4/80, and CD64 [BioLegend]; rat: CD45 [BD Biosciences]). Cells were sorted (LSRFortessa, BD Biosciences; CyAn ADP Analyze, Dako) and analyzed (FlowJo Software, Tree Star) based on their cell surface marker expression (Leukocytes: CD45+, Mϕ: CD11b+Ly6G−Ly6CloF4/80+CD64+, monocytes: CD11b+Ly6G−Ly6ChiF4/80loCD64−, and neutrophils: CD11b+Ly6G+) and lipophilic stain (DiD+).
Infarct size measurements
Two days following IR injury, hearts were arrested in diastole (10% KCl), excised, washed (PBS), and cut into serial sections of ~1 mm thickness (from apex to basal edge of infarction). Sections were incubated with TTC (2,3,5-Triphenyl-2H-tetrazolium chloride, 1% solution in PBS) for 20 minutes in the dark, washed (PBS), then imaged and weighed. Infarcts were delineated from viable tissue (white versus red, respectively) and analyzed using ImageJ software as previously reported9. The area-at-risk (AAR) was assessed by fluorescent microsphere perfusion as previously reported16. Infarct mass, viable mass, and LV mass were calculated by extrapolating for infarct and non-infarct volumes (based on the areas calculated from both sides of a tissue section) and weight of the tissue. Percentage infarct mass was calculated using (Infarct Mass/Viable Mass) × 100%.
Cell labeling
Admixtures.
Cells designated for in vivo adoptive transfer (Mϕ) or in vitro experiments were prelabeled using lipophilic dyes DiI, DiO, and DiD (ThermoFisher) per the manufacturer’s protocol.
Immunohistochemistry.
To assess Mϕ distribution within the heart, OCT-cut tissue sections were fixed with 4% PFA, blocked (Dako), and stained with mouse anti-rat α-actinin (MilliporeSigma). The appropriate fluorescently-conjugated secondary antibodies (Invitrogen) were applied prior to mounting using Fluoroshield with DAPI (MilliporeSigma).
Immunocytochemistry.
Cells were either grown on collagen-coated coverslips (Corning) or attached by centrifugation onto a glass slide (Cytospin 4, ThermoFisher). All samples were fixed with 4% PFA, blocked (Dako), and then stained (Wheat Germ Agglutinin [WGA], ThermoFisher; Hoescht 33342, ThermoFisher; CD68, CD45, CD11b, and Gr1, BD Biosciences). The appropriate fluorescently-conjugated secondary antibodies (ThermoFisher) were applied to samples stained with primary antibodies prior to mounting with Fluoroshield with DAPI (MilliporeSigma).
In vitro efferocytosis assay
To examine Mϕ efferocytosis in vitro, we adapted an established protocol17–19. Briefly, neonatal cardiomyocytes (or thioglycollate-elicited peritoneal neutrophils) were labeled with DiI (Invitrogen), UV-irradiated (254nm, 7 minutes), and then incubated at 37°C for 2 hours. The resulting apoptotic cells were collected and added to Mϕ cultures. At the appropriate time point (20 or 60 minutes), cells were washed and then collected for flow cytometry or immunocytochemical analyses. For the inhibitor study, anti-IgG or anti-C1qa (Abcam) were added in conjunction with apoptotic cells.
Single-cell RNA-sequencing (scRNA-seq) and data analysis
Multiplex cell labeling.
Prior to scRNA-seq, bone marrow-derived macrophages were labeled with the Single-Cell Multiplexing Kit (BD Biosciences) according to the manufacturer’s protocol. Macrophages were collected, resuspended in Stain Buffer (BD Biosciences), and then transferred to tubes with unique Sample Tag (tags 1-12). Twenty minutes later, cells were washed 3 times with Stain Buffer and then combined into 2 tubes (tube 1: sample tags 1-6; tube 2: sample tags 7-12) prior to scRNA-seq.
Single-cell library construction.
Libraries were prepared per the Single Cell 3’ v2 Reagent Kits User Guide (10× Genomics, Pleasanton, California). Cell suspensions from tubes 1 and 2 were loaded on the Chromium Controller instrument (10× Genomics) to generate single-cell Gel Bead-In-EMulsions (GEMs). GEM-RT was performed in a Veriti 96-well thermal cycler (Thermo Fisher Scientific, Waltham, MA). GEMs were then harvested, and the cDNA was amplified and cleaned up with SPRIselect Reagent Kit (Beckman Coulter, Brea, CA). Indexed sequencing libraries were constructed using Chromium Single-Cell 3’ Library Kit for enzymatic fragmentation, end-repair, A-tailing, adapter ligation, ligation cleanup, sample indexing, and PCR cleanup. The barcoded sequencing libraries were quantified by qPCR using the KAPA Library Quantification Kit for Illumina platforms (KAPA Biosystems, Wilmington, MA). Sequencing libraries were loaded on a NextSeq500 (Illumina, San Diego, CA) with a custom sequencing setting (26bp for Read 1 and 98bp for Read 2) to obtain a sequencing depth of ~200K reads per cell.
Data Analysis.
Reference sequences for the Sample Tags were generated using BD Biosciences multiplexing tools (https://bitbucket.org/CRSwDev/multiplexing_tools/overview). The demultiplexed raw reads were aligned using STAR20 (v2.5.1) with default parameters to the Sample Tags sequences and a custom mouse mm10 transcriptome reference (GENCODE Release M9), containing all protein coding and long non-coding RNA genes. Expression counts for each gene in all samples were collapsed into unique molecular identifier (UMI) counts using Cell Ranger (v2.1.0, 10× Genomics). Sample Tag expression was used as input for t-distribution Stochastic Neighbor Embedding (tSNE) analysis21. Singlets (cells with one Sample Tag), multiplets (cells with multiple Sample Tags), and negatives (cells with no Sample Tags) were identified based on their distinctive tSNE clusters. Multiplets, negatives, and aberrant cells (>15% of reads mapping to mitochondrial genes or <300 expressed genes) were removed from further analysis.
UMI counts were normalized by multiplying the size factor (calculated based on the median UMI count for all cells) and then dividing the total of UMI counts for each cell. Principal component analysis (PCA) was run on the normalized gene-barcode matrix to reduce the number of feature dimensions and obtain two-dimensional population dynamic projections. The top 10 principle components were selected in Seurat (v2.2) using a permutation-based test and then analyzed in Cell Ranger (v2.1.0, 10× Genomics). The tSNE plots were created after performing 1,000 iterations with a perplexity value of 30 and theta of 0.5; all other parameters were left in their default setting. Cell populations and gene expression changes were visualized with the Loupe Cell Browser (v2.0.0, 10× Genomics).
Statistical Analysis of scRNA-seq Data.
Differential gene expression was determined using Cell Ranger with the integrated software of sSeq22 or edgeR23. Gene expression for each cluster was compared to other cells yielding a list of genes that were differentially expressed in that cluster relative to the rest of the sample. Raw p-values were adjusted for multiple hypothesis testing using the Benjamini-Hochberg method. Genes with an adjusted p<0.05 were considered exclusively expressed in each single subgroup and used for drawing heat maps and violin plots by using ggplot2 (v2.2.1) in R (v3.4.1).
Statistical Analysis
Results are expressed as mean ± SEM. Datasets that passed both the Shapiro-Wilk normality and Brown-Forsythe equal variance tests were analyzed using two-tailed unpaired Student’s t test, 1-way ANOVA followed by Holm-Sidak’s multiple comparisons test, or 2-way ANOVA followed by Holm-Sidak’s multiple hypothesis correction. Datasets that failed normality and equal variance test were analyzed by the Mann-Whitney non-parametric test or 1-way ANOVA followed by Dunn’s multiple comparisons test. All statistical analyses were performed using Prism 5 software (GraphPad) and only differences with a p<0.05 were considered statistically significant. Some experiments have small sample sizes that may limit the interpretation of the data.
Refer to the online-only Data Supplement for additional descriptions of the methodology.
RESULTS
Extracellular vesicle (EV) characterization and macrophage polarization
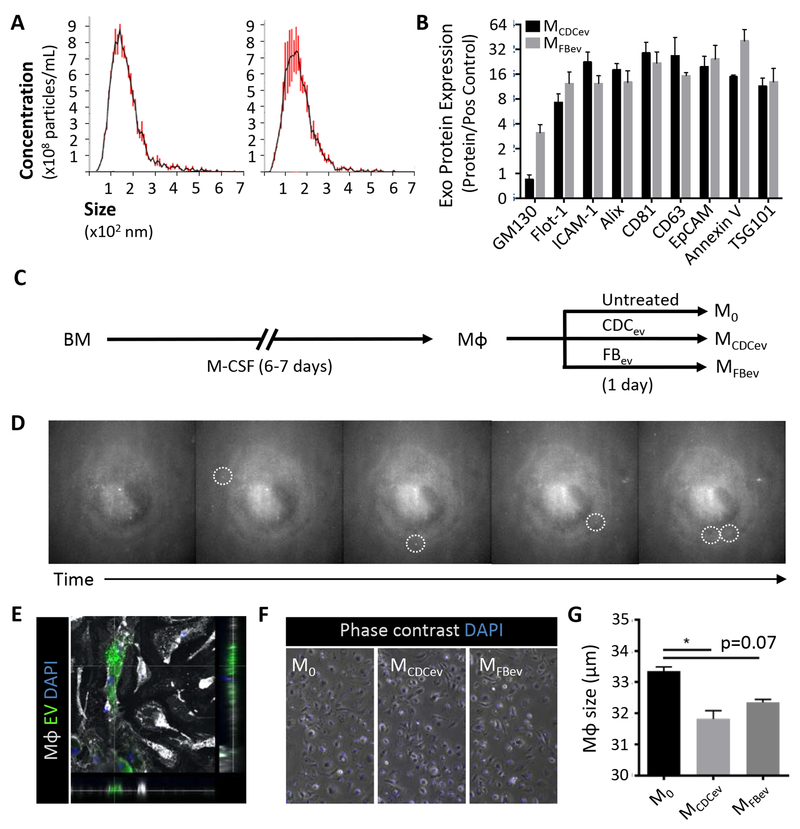
Human CDCev and dermal fibroblast EV (FBev, as a control) were isolated following serum-free culture of either parent cell type for 15 days. Cell viability was >99% at the end of the culture period (Figure IA in the online-only Data Supplement). The resulting conditioned media was purified by filtration (0.45μm) and concentrated using a 10kDa filter (ultrafiltration by centrifugation [UFC], Millipore), as reported9. Both CDCev and FBev revealed size distributions (NS300, Malvern; Figure 1A) and protein expression profiles (Figure 1B and Figure IB in the online-only Data Supplement) typical of exosomes (i.e., 30-150nm EVs) derived from various cell types24. To dissect the mechanisms whereby CDCev polarize Mϕ toward a cardioprotective phenotype9, we exposed rat bone marrow-derived Mϕ to saline (untreated control), CDCev, or FBev to generate M0, MCDCev, and MFBev, respectively (Figure 1C). Extracellular vesicles were taken up rapidly (within minutes of treatment), stochastically (Figure 1D, dotted circles), and continually over time (Video I in the online-only Data Supplement); cell area was found to be significantly decreased following CDCev or FBev exposure (Figure 1F). Together, these data demonstrate that both CDC- and FB-derived EVs are readily taken up by Mϕ in culture.
Figure 1. Extracellular vesicle (EV) profiling and in vitro macrophage polarization.
(A) Nanoparticle tracking analysis (Nanosight) of EV size and concentration. CDCev: CDC-derived EVs, FBev: FB-derived EVs. (B) Exosome protein markers observed on CDCev and FBev. (C) Schematic depicting the protocol used to generate macrophages (Mϕ) from bone marrow (BM) over the course of 6–7 days. Mϕ were then left untreated (M0) or polarized with EVs (FBev: MFBev; CDCev: MCDCev) for 1 day prior to use. (D) Sequential images of EV (fluorescently-labeled) uptake by Mϕ over time captured from time lapse video (Video S1). Dotted circles highlight distinct EV attachment and uptake. (E) Confocal image depicting EV (DiO-labeled) internalization within Mϕ (WGA-labeled). (F) Representative images of Mϕ with or without EV treatment. (G) Quantitative analysis of cell size in (F). Graphs depict mean +/− SEM with n=3–5/group. Statistical significance was determined using 2-tailed, unpaired, Student’s t test or 1-way ANOVA followed by Dunn’s multiple corrections test. *p<0.05.
Adoptive transfer of MCDCev is cardioprotective following ischemia-reperfusion injury
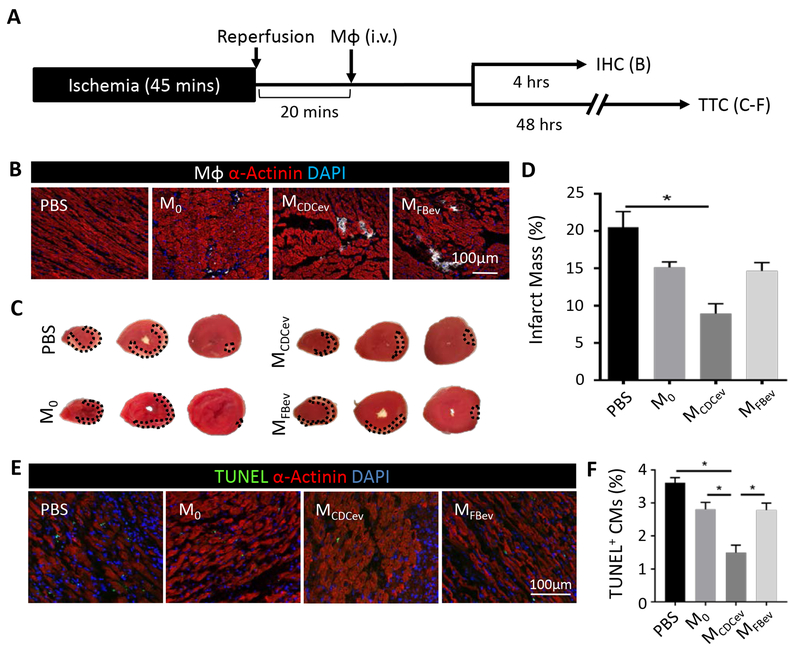
Since Mϕ are critically important in CDC- and CDCev-mediated cardioprotection, we tested whether adoptive transfer of MCDCev could induce cardioprotection in lieu of CDCev. Rats underwent 45 minutes of ischemia and 20 minutes of reperfusion (ischemia-reperfusion; IR) prior to intravenous delivery of polarized Mϕ (DiD-labeled M0, MCDCev or MFBev; 1×10⁶/rat) or PBS (vehicle control) (Figure 2A). To examine both homing of Mϕ to the infarct and reduction of infarct size (as measured by TTC), animals were subdivided into two experimental endpoints (4 and 48 hours, respectively). While both MCDCev and MFBev were found within the infarct area at 4 hours (Figure 2B), only animals treated with MCDCev revealed reductions in MI scar mass (versus either MFBev or PBS; Figure 2, C–D) at 48 hours. These data corroborate our previous findings9, 14 and pinpoint Mϕ as critical effectors of CDC-mediated cellular postconditioning.
Figure 2. MCDCev reduce infarct size post-MI.
(A) Schematic of the in vivo protocol used to assess adoptive transfer of Mϕ following ischemia-reperfusion injury in rats. IHC: immunohistochemistry; TTC: 2,3,5-Triphenyl-2H-tetrazolium chloride. (B) Representative images of DiD-labeled Mϕ in the infarct border zone at 4 hours. (C) Representative TTC-stained hearts at 48 hours. (D) Quantification of percent infarct mass from (C). (E) Representative images of TUNEL-stained hearts in the infarct border zone at 48 hours. (F) Quantification of percent TUNEL positive cardiomyocytes (CM) from (E). Graphs depict mean +/− SEM with n=5–6/group. Statistical significance was determined using 1-way ANOVA followed by Holm-Sidak’s multiple corrections test. *p<0.05.
CDCev enhance Mϕ efferocytosis in vitro
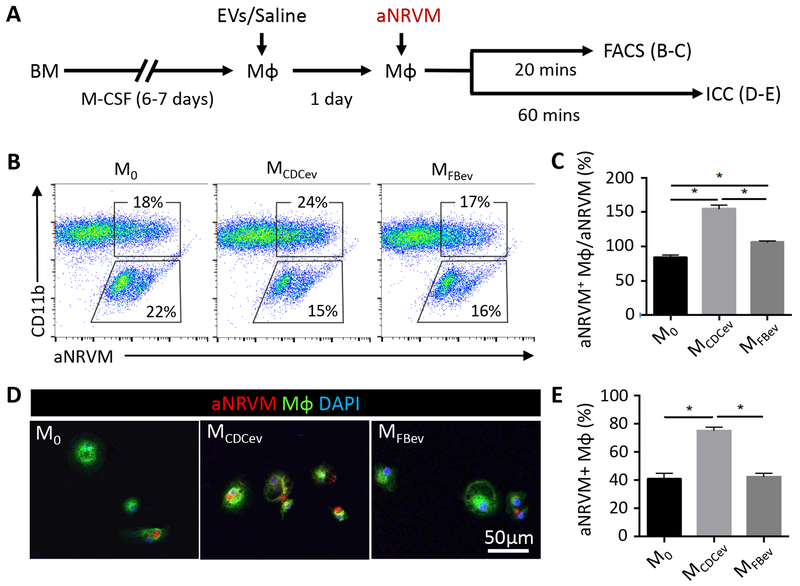
CDCs and CDCev enhance Mϕ phagocytosis of fluorescent microspheres9, 10, hinting that efferocytosis may likewise be enhanced19. To test this hypothesis, we adapted an in vitro efferocytosis assay17–19 to examine the uptake of apoptotic neonatal rat ventricular myocytes (aNRVM) by M0, MCDCev, and MFBev (Figure 3A). NRVM labeled with a lipophilic dye (DiI, Invitrogen) were exposed to UV-irradiation. The resulting DiI+ apoptotic cells were collected and co-cultured with Mϕ (Figure 3A). Next, Mϕ efferocytosis was examined from unwashed (to examine the ratio of aNRVM efferocytosis to residual aNRVM; Figure 3, B–C) and PBS-washed (to assess the total percentage of aNRVM+ Mϕ; Figure 3, D–E) cultures. Within 20 minutes of co-culture, MCDCev revealed greater uptake of aNRVM than either M0 or MFBev (Figure 3, B–C). In support of these findings, the enhanced efferocytosis phenotype observed in MCDCev was recapitulated with apoptotic polymorphonuclear neutrophils (aPMN; Figure II in the online-only Data Supplement). After 60 minutes in co-culture, MCDCev retained the greatest number of aNRVM+ Mϕ relative to either M0 or MFBev Mϕ (Figure 3, D–E). Together, these data support the idea that MCDCev–mediated cardioprotection may result from enhanced clearance of apoptotic cell debris within the myocardium following ischemic injury, a conjecture which we tested in vivo.
Figure 3. In vitro efferocytosis.
(A) Schematic of protocol used to assess Mϕ efferocytosis. aNRVM (DiI-labeled). aNRVM: apoptotic neonatal rat ventricular myocytes; FACS: Fluorescence-activated cell sorting; ICC: immunocytochemistry. (B) Representative FACS plots of efferocytosis co-culture experiments. aNRVM (DiI+), Mϕ (CD11b+), Mϕ with engulfed aNRVM (DiI+CD11b+). (C) Quantification of the percentage of aNRVM+ Mϕ in (B). (D) Representative images of DiI-aNRVM+ Mϕ (WGA-labeled). (E) Quantification of the percentage of aNRVM+ Mϕ in (D). Graphs depict mean +/− SEM with n=4–6/group. Statistical significance was determined using 1-way ANOVA followed by Holm-Sidak’s multiple corrections test. *p<0.05.
CDCev enhance Mϕ efferocytosis in a rat model of MI
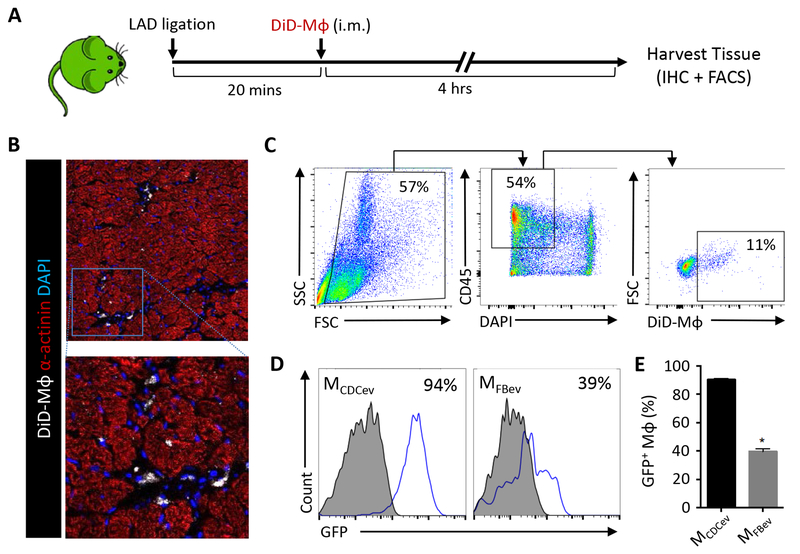
Transgenic Sprague-Dawley rats expressing enhanced green fluorescent protein (SD-eGFP)25 were subjected to coronary artery ligation and, 20 minutes later, randomly allocated to receive intramyocardial injection of DiD-labeled MCDCev or MFBev (1×10⁶/rat). Four hours later, hearts were harvested from SD-eGFP rats to assess Mϕ retention and efferocytosis (Figure 4A). Immunohistochemical analyses revealed significant retention of DiD-labeled Mϕ within the myocardium (Figure 4B). Next, we sought to compare the levels of efferocytosis between treatment groups by flow cytometry. To do so, we enzymatically digested the myocardial area-at-risk (AAR) and generated a single-cell suspension, as reported9, 10. After staining (CD45+) and gating for DiD+ Mϕ (CD45+DiD+) (Figure 4C), we compared Mϕ efferocytosis in MCDCev and MFBev-treated SD-eGFP animals. Consistent with our in vitro data (Figure 3), we observed significantly greater cellular GFP positivity in MCDCev relative to MFBev (Figure 4, D–E). These experiments were performed in SD-eGFP rats (ubiquitous expression of GFP), thus reflecting Mϕ efferocytosis of a heterogeneous population of dead cell types (e.g., cardiomyocytes, neutrophils, endothelial cells, fibroblasts) and cell fragments within the post-MI milieu.
Figure 4. In vivo rat efferocytosis post-MI.
(A) Schematic of protocol used to assess efferocytosis of adoptively-transferred DiD-labeled Mϕ (DiD-Mϕ) in SD-GFP rats post-MI. (B) Representative images of DiD-Mϕ within the infarct border zone. (C) Gating strategy used to select DiD+ Mϕ from the infarcted heart. (D) Representative plots of GFP expression in DiD+ Mϕ following the gating strategy depicted in (C). (E) Quantification of GFP expression in cardiac Mϕ in (D). Graphs depict mean +/− SEM with n=6–8/group. Statistical significance was determined using 2-tailed, unpaired, Student’s t test. *p<0.05.
CDCev enhance Mϕ-dependent cardiomyocyte efferocytosis in a mouse model of IR
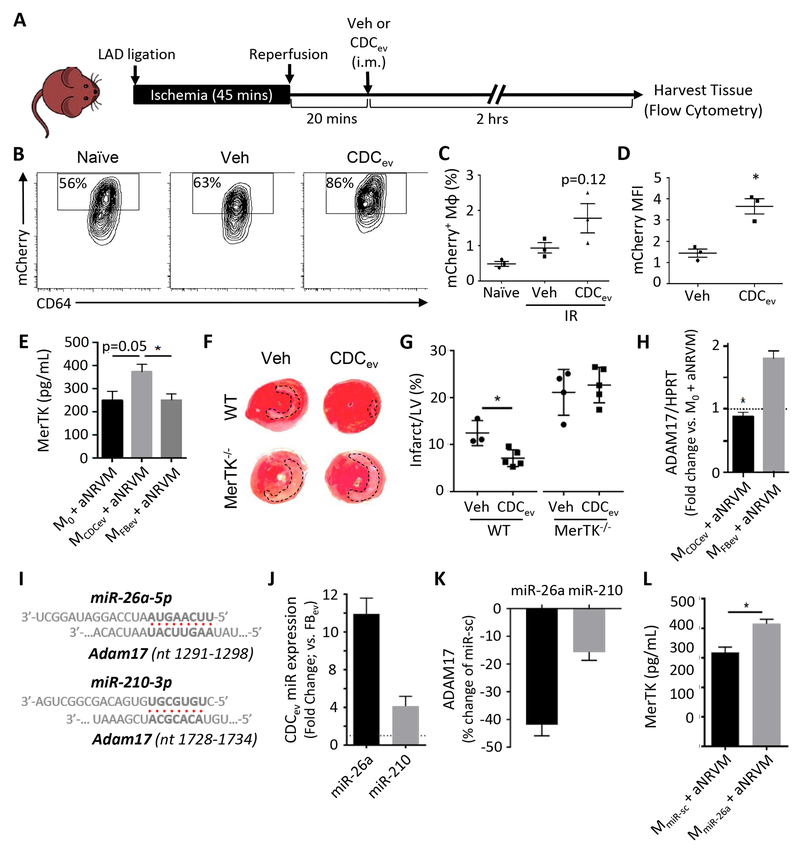
To examine efferocytosis of injured cardiomyocytes in vivo, fluorescently-labeled cardiomyocyte-specific transgenic mice (αMHC-mCherry) were subjected to 45 minutes of ischemia followed by 20 minutes of reperfusion prior to intramyocardial delivery of saline (vehicle) or CDCev (5×10⁹ particles in 30μL PBS) (Figure 5A); a subset of animals was neither subjected to IR nor injected intramyocardially (naïve). Two hours later, hearts were harvested, and the AAR was isolated and digested to generate a single cell suspension. Cardiac Mϕ were identified based on surface marker expression (CD11b+Ly6G−Ly6CloF4/80+CD64+). While αMHC-mCherry mice treated with CDCev revealed variable, and overall non-significant, increases in mCherry+ Mϕ within the myocardium (Figure 5, B–C), the uptake of mCherry+ apoptotic debris (mean fluorescent intensity, MFI) was significantly enhanced relative to that in vehicle-treated animals (Figure 5D); no significant changes in neutrophil counts were observed (Figure III in the online-only Data Supplement). Together, these data corroborate our in vitro and SD-eGFP in vivo data, and demonstrate that CDCev enhance Mϕ-mediated efferocytosis post-MI.
Figure 5. MerTK expression is required for enhanced efferocytosis and cardioprotection.
(A) Schematic of protocol used to assess efferocytosis of CDCev-treated mCherry mice post-IR. Veh: vehicle, i.m.: intramuscular. (B) Representative contour plots of mCherry expression in cardiac Mϕ (CD11b+Ly6G−Ly6CloF4/80+CD64+) isolated from hearts of naïve (no IR injury) or post-IR (vehicle or CDCev treatment) mice. (C and D) Percent and MFI of mCherry in cardiac Mϕ. MFI: mean fluorescence intensity. (E) Protein expression of MerTK as determined by ELISA 2 hours following aNRVM coculture. (F) Representative images of TTC-stained hearts 2 days following AMI. WT and MerTK−/− mice were treated with either Veh (saline) or CDCev 20 minutes following reperfusion (as in A). (G) Quantification of LV and infarct size from TTC-stained in (F). Statistical significance observed between WT vehicle and CDCev. LV: left ventricle. (H) Adam17 gene expression is suppressed in MCDCev. (I) Predicted binding sites of miR-26a-5p and miR-210–3p with Adam17 (nucleotide range denoted in brackets). (J) Fold change in expression of miR-26a and miR-210 in CDCev versus FBev. (K) Percent change in luciferase assay activity in HEK293T cells 2 days following treatment with miR-26, miR-210, or miR-sc. (L) Protein expression of MerTK in MmiR-sc and MmiR-26a co-cultured with aNRVM. Graphs depict mean +/− SEM with n=3–4/group. Statistical significance was determined using 2-tailed, unpaired, Student’s t test, or 1-way ANOVA followed by Tukey’s multiple corrections test. *p<0.05.
MCDCev reduce proinflammatory signaling during efferocytosis
Inflammatory cells infiltrating the myocardium soon after MI secrete proinflammatory cytokines that exacerbate IR injury26. Since MCDCev are cardioprotective (Figure 2), we assessed whether MCDCev alter the proinflammatory cytokine response when exposed to aNRVM. Using our in vitro efferocytosis assay (Figure 3A), we determined Mϕ activation through transcription factor phosphorylation (STAT3, p65, and p38)27. Interestingly, Mϕ treated with CDCev (prior to and following aNRVM coculture), significantly increased phosphorylation of STAT3 (p-STAT3) and decreased the phosphorylation of p65 (p-p65) and p38 (p-p38) (Figure IV, A–D in the online-only Data Supplement). These changes corroborate our published data revealing an attenuation of proinflammatory signaling in Mϕ exposed to CDCev. Following aNRVM co-culture, these effects persisted with reduced expression of pro-inflammatory cytokines (Il6, Il1a, Il1b, and Tnf; Figure 4E in the online-only Data Supplement).
CDCev promote MerTK expression in Mϕ
The TAM (Tyro3, Axl, and MerTK) family of receptor tyrosine kinases have important roles in Mϕ-dependent inflammation and efferocytosis28. Therefore, we examined their expression on MCDCev and MFBev in response to aNRVM coculture. While Tyro3 and Axl were unchanged (Figure VA in the online-only Data Supplement), CDCev promoted the expression of MerTK (Figure 5E). To examine the role of MerTK in vivo, WT and MerTK deficient (MerTK−/−)15 mice were subjected to MI and then randomly allocated to receive intramyocardial injection of vehicle (saline) or CDCev (as in Figure 5A). Two hours later, hearts were evaluated for infarct size by TTC staining. Consistent with our previous report in rats9, IR injury was attenuated in WT mice receiving CDCev (Figure 5, F–G, and Figure V, B–C in the online-only Data Supplement). Interestingly, MerTK−/− mice not only exhibited enhanced infarct sizes relative to WT, but also lack of CDCev-mediated cardioprotection (Figure 5, F–G).
CDCev-derived miRNAs sustain MerTK expression in Mϕ
Next, we sought to determine how CDCev modulate the expression of MerTK in Mϕ. It has been reported that ADAM17 (A Disintegrin And Metalloproteinase 17)29 cleaves MerTK following LPS stimulation to release its soluble ectodomain and deactivate efferocytosis30. Since changes in MerTK expression were detected by an immunogen sequence for the extracellular fraction (Figure 5E), but not the cytoplasmic fraction (Figure VI, A–B in the online-only Data Supplement), we examined the role of MerTK cleavage. In our in vitro efferocytosis assay, Adam17 gene expression was significantly attenuated in MCDCev relative to MFBev (Figure 5H). To examine how Adam17 is regulated, we utilized miRNA targeting prediction software (TargetScan31 and miRmap32) to identify miRNAs that target Adam17 and then cross-referenced their expression values in our CDCev and FBev RNA-seq dataset9. We thereby identified 2 candidate miRNAs (Figure 5I ): miR-26a-5p (TargetScan score: 97, miRmap score: 65.81; denoted herein as miR-26a) and miR-210–3p (TargetScan score: no score, miRmap score: 98.18; denoted herein as miR-210).The expression of both miRNAs were confirmed by qPCR, with greater expression of miR-26a than miR-210 in CDCev compared to FBev (Figure 5J). While miR-26a has been reported to target Adam17 in adipocytes33, miR-210 targets genes within the hypoxia pathway34. To assess their efficiency of binding Adam17 in vitro, we inserted mouse Adam17 into a firefly luciferase reporter construct (OriGene) and transfected it along with scrambled miR, miR-26a, or miR-210 into HEK293T cells. Two days later, we assessed luciferase activity, which was reduced by both miRs, but attenuated more effectively by miR-26a (Figure 5K). Based on these data, we focused on the role of miR-26a in modulating MerTK. To test the ability of miR-26a to modulate Adam17 expression during efferocytosis, Mϕ were exposed to miR-26a (MmiR-26a) or scrambled control (MmiR-sc) mimics ~18 hours prior to performing our in vitro efferocytosis assay. Although the overall RNA expression values of Adam17 and MerTK were decreased (miR-26a does not have predicted binding sites to MerTK when examined by TargetScan or miRmap databases), the relative ratio of MerTK-to-Adam17 was significantly increased in MmiR-26a, relative to control MmiR-sc (Figure VIC in the online-only Data Supplement). Additionally, MerTK (extracellular fraction) protein expression was significantly greater (Figure 5L), and proinflammatory gene expression was attenuated (Figure VID in the online-only Data Supplement), in MmiR-26a relative to MmiR-sc controls.
CDCev stimulate C1qa expression to promote Mϕ efferocytosis
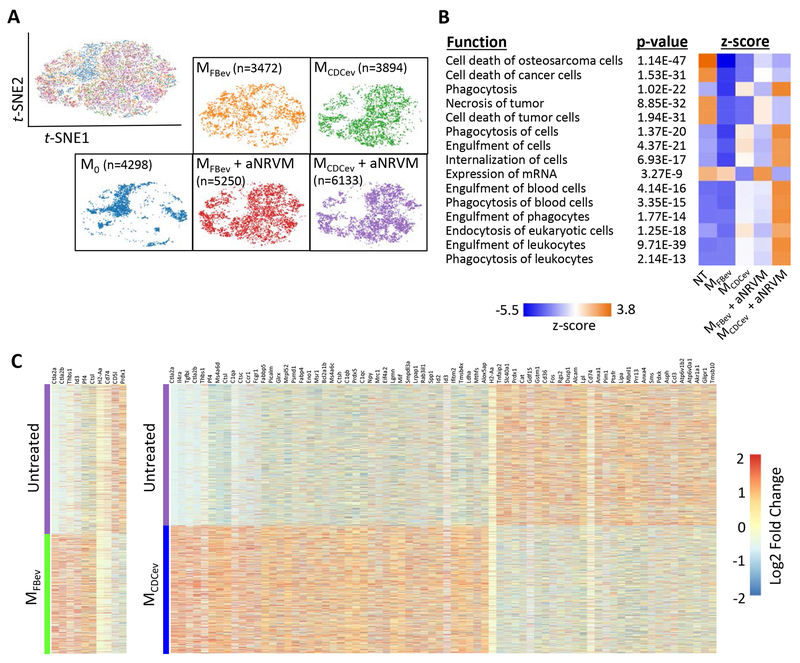
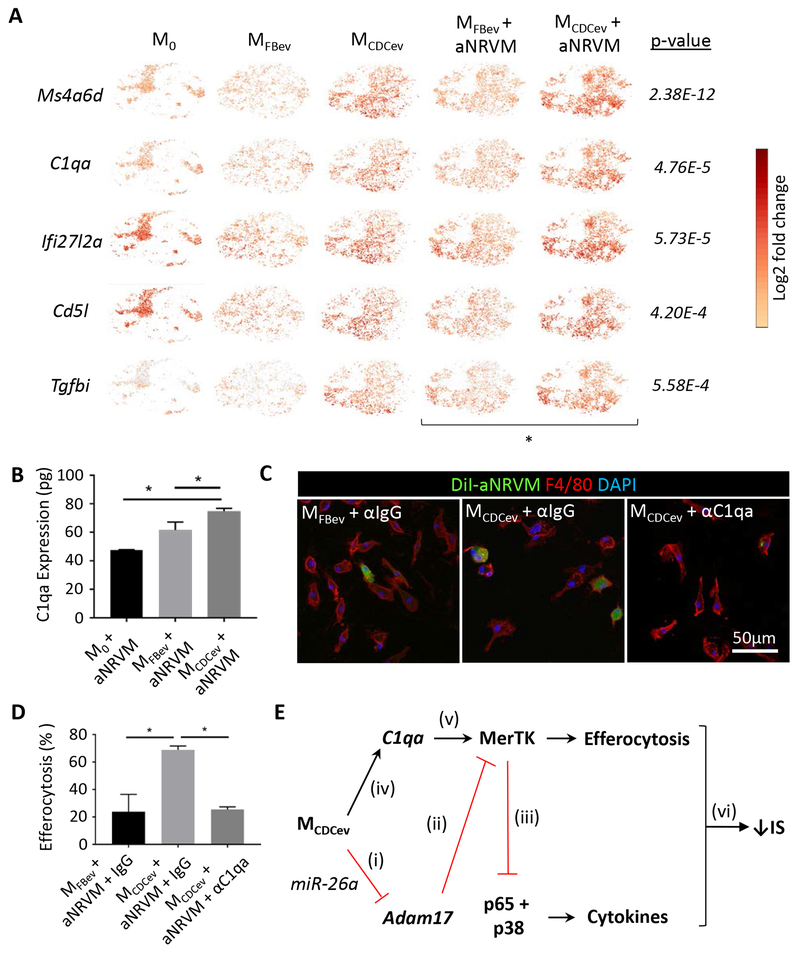
Although MerTK is a critical receptor for Mϕ efferocytosis, various bridging molecules (e.g., Gas6 or MFG-E8) can bind phosphatidyl serine to enhance apoptotic cell uptake35, 36. To assess whether CDCev modify the gene expression profile of Mϕ, we performed single-cell RNA-sequencing (scRNA-seq) on each in vitro efferocytosis experimental group (Figure 3). The t-distributed Stochastic Neighbor Embedding (t-SNE)21 machine learning algorithm revealed distinct populations of cells (Figure 6A) which were aggregated for analysis of differentially-expressed genes by Ingenuity Pathway Analysis (QIAGEN). Ten of 15 pathways, ranked by z-score, were associated with phagocytosis (and enhanced by MCDCev + aNRVM), while 4 of 15 were associated with cell death (and attenuated by MCDCev + aNRVM) (Figure 6B). Next, we assessed which genes were differentially expressed in response to EV treatment. CDCev, in contrast to FBev, conferred dramatic changes in Mϕ gene expression (Figure 6C). To better understand how CDCev confer changes in efferocytosis, we focused on the top 5 differentially expressed genes between MFBev + aNRVM and MCDCev + aNRVM (Figure 7A). Surprisingly, Ms4a6d, C1qa, and Tgfbi, which increased following CDCev treatment, retained elevated expression prior to and following the addition of aNRVM.
Figure 6. scRNA-seq reveals global changes in phagocytic gene expression.
(A) t-SNE plots of single cells from Mϕ treatment groups. Cell numbers analyzed per group denoted in brackets. (B) Pathway analysis of gene expression profiles related to cellular function ranked by z-score. (C) Heatmap of significantly different gene expression changes in Mϕ treated with or without EVs.
Figure 7. CDCev promote C1qa expression to enhance Mϕ efferocytosis.
(A) scRNA-seq t-SNE plots of the top 5 significantly different genes (ranked by fold-change in expression) between MFBev + aNRVM and MCDCev + aNRVM. (B) Protein expression of C1qa in Mϕ during efferocytosis as determined by ELISA. (C) Representative immunofluorescent images of Mϕ treated with anti-IgG (αIgG) or anti-C1qa (αC1qa). (D) Quantification of efferocytosis (uptake of DiI-labeled aNRVM) in (C). Percent increase versus M0 + aNRVM. (E) Schematic of our hypothesized mechanism of action: (i and ii) CDCev transfer miR-26a into Mϕ to suppress Adam17 expression and sustain MerTK expression; (iii) MerTK expression suppresses proinflammatory gene expression; (iv and v) CDCev induces C1qa expression to bridge apoptotic cells to promote MerTK-dependent Mϕ efferocytosis; (vi) together, enhanced efferocytosis and reduced proinflammatory gene expression limit infarct size (IS). Graphs depict mean +/− SEM with n=3-4/group. Statistical significance was determined using 1-way ANOVA followed by Holm-Sidak’s multiple corrections test. *p<0.05.
Although C1q is often associated with complement-mediated cell lysis, it also functions as a bridging molecule in apoptotic cell clearance37, 38. Not only was C1q the second most differentially expressed gene between MFBev + aNRVM and MCDCev + aNRVM (4.76E-5; Figure 7A), but its protein level was also increased by ELISA (Figure 7B). To determine if C1qa is required for CDCev-mediated efferocytosis, we added anti-C1qa (αC1qa) or anti-IgG (αIgG; control) antibody to our in vitro efferocytosis assay. Addition of αC1qa, but not αIgG, significantly reduced efferocytosis by MCDCexo (Figure 7, C-D).
In summary, we have demonstrated that CDCev polarization of Mϕ enhances efferocytosis and leads to cardioprotection (Figure 7E). In silico predictive targeting software and in vitro validation studies reveal that CDCev-derived miR-26a and miR-210 suppress the expression of Adam17 and, in turn, sustain the expression and function of MerTK. We demonstrate through scRNA-seq and in vitro inhibitor studies that CDCev promote the expression of C1qa to enhance phagocytic uptake of apoptotic cells. Hyper-phagocytic MCDCev efficiently remove apoptotic cell debris and reduce proinflammatory gene expression to attenuate infarct size.
DISCUSSION
Mounting evidence demonstrates that immunomodulation, rather than immunosuppression, is necessary for many of the reparative and protective effects observed during wound healing26, 39. Macrophages have received considerable attention in myocardial repair because of their rapid mobilization to the site of injury and functional contribution to inflammatory resolution7, 40. The focus on Mϕ is justified by their distinctive intrinsic attributes: diversity in origin (yolk sac-derived versus bone marrow-derived) and plasticity (or rather polarization) in response to microenvironmental cues7, 26, 41, 42. In the context of cell therapy, it is becoming increasingly clear that inflammation is required for efficacy, with a particularly important role for Mϕ. CDCs and their secreted EVs modulate the inflammatory response to mitigate MI damage9, 10, 13, 14, 43. The anti-inflammatory effects of CDCs are not limited to IR injury, having also been reported in heart failure with preserved ejection fraction44, dilated cardiomyopathy45, autoimmune myocarditis46, pulmonary hypertension47, and muscular dystrophy48.
Here we expand upon the observations that CDC- or CDCev-polarized Mϕ (MCDC or MCDCev) are required for cardioprotection post-MI. Adoptive transfer experiments reveal that MCDCev, in lieu of CDCev, suffice to elicit cardioprotection, a finding that is in line with our previous report using MCDC10. To examine how MCDCev are cardioprotective, we investigated the phenotype, consistently observed in both MCDC and MCDCev, of enhanced phagocytosis. Since MI promotes extensive cell death with a concomitant increase in proinflammatory cytokine expression, we examined whether MCDCev could reduce injury through enhanced efferocytosis. Using both in vitro and in vivo efferocytosis assays, we demonstrate that MCDCev more rapidly and with greater avidity clear apoptotic cell debris than untreated Mϕ or MFBev.
Efferocytosis is regulated by several recognition and uptake receptors that are expressed in Mϕ49, 50. Here, we explored the family of TAM receptor tyrosine kinases (Tyro3, Axl, and MerTK) that are strongly associated with apoptotic cell uptake; MerTK is responsible for engulfment and internalization/clearance of apoptotic cells15. Although Tyro3 and Axl remained unchanged, the extracellular fraction of MerTK was significantly elevated in MCDCev. Since Adam17 cleaves the extracellular fraction of MerTK and subsequently suppresses efferocytosis30, we examined Adam17 expression. Not only was Adam17 attenuated in MCDCev, but we also found that EV-derived miR-26a specifically targeted and repressed Adam17 in MCDCev. The concomitant decrease in proinflammatory cytokine expression can be rationalized by the known ability of MerTK to broadly inhibit TLR and TLR-induced cytokine cascades (e.g., p65 and p38)51.
Bridging molecules have been reported to play a critical role in efficient cell clearance52, 53. One molecule important for cell clearance in a variety of diseases is C1q. Here, using scRNA-seq, we show that CDCev promote the gene expression of C1qa in Mϕ. These data were corroborated with increased protein expression during CDCev-mediated efferocytosis, effects that were blunted upon introduction of an anti-C1qa antibody. These data suggest that sustained MerTK expression and enhanced C1qa production promote efferocytosis in MCDCev.
Together, these data provide detailed mechanistic insight into the role of CDC-mediated cardioprotection. Specifically, we highlight that CDCev, which are the main paracrine factors responsible for CDC function, polarize Mϕ to a distinct, hyper-phagocytic and blunted inflammatory state (MCDCev). These macrophages act locally within the ischemic myocardium to enhance the resolution of myocardial IR injury (broader systemic changes in inflammation were not directly assessed in this study). Although tested specifically in MI, Mϕ dysfunction is observed in an array of disease pathogeneses (e.g., systemic lupus erythematosus, Alzheimer’s disease)54–56, which suggests that the therapeutic efficacy of CDCev may extend beyond the treatment of ischemic heart disease.
Supplementary Material
HIGHLIGHTS.
Extracellular vesicles are readily taken up by macrophages
Extracellular vesicles enhance macrophage efferocytosis by sustaining MerTK and promoting C1qa expression
Enhanced macrophage efferocytosis is the dominant mechanism of extracellular vesicle-mediated cardioprotection following ischemic injury
ACKNOWLEDGMENTS
We thank R. Jorand (Oxford Nanoimaging) and A. Echavez for technical assistance.
SOURCES OF FUNDING
This work was supported by the National Institutes of Health (R01HL133835 [to EM], R01HL142579 [to GdC]), American Heart Association (18CDA34110445 [to GdC]), and the Mark S. Siegel Family Distinguished Chair of the Cedars-Sinai Medical Center (held by EM).
DISCLOSURES
E. Marbán owns founder’s equity in, and serves as unpaid advisor to, Capricor Inc. G. de Couto is a paid consultant for Capricor. Capricor neither provided funding for this work nor did the company have approval rights over the manuscript. The other authors declare no competing financial interests.
ABBREVIATIONS
- CDC
Cardiosphere-derived cell
- EV
Extracellular vesicle
- CDCev
CDC EV
- FBev
Fibroblast EV
- Mϕ
Macrophages
- MI
Myocardial infarction
- IR
Ischemia-reperfusion
- TTC
2,3,5-Triphenyl-2H-tetrazolium chloride
- AAR
Area-at-risk
- aNRVM
Apoptotic neonatal rat ventricular myocytes
- miR
microRNA
Footnotes
The online-only Data Supplement is available with this article.
REFERENCES
- 1.deCathelineau AM and Henson PM. The final step in programmed cell death: phagocytes carry apoptotic cells to the grave. Essays Biochem. 2003;39:105–117. [DOI] [PubMed] [Google Scholar]
- 2.Arandjelovic S and Ravichandran KS. Phagocytosis of apoptotic cells in homeostasis. Nat Immunol. 2015;16:907–917. [DOI] [PMC free article] [PubMed] [Google Scholar]
- 3.Henson PM and Hume DA. Apoptotic cell removal in development and tissue homeostasis. Trends Immunol. 2006;27:244–250. [DOI] [PubMed] [Google Scholar]
- 4.Nagata S, Hanayama R and Kawane K. Autoimmunity and the clearance of dead cells. Cell. 2010;140:619–630. [DOI] [PubMed] [Google Scholar]
- 5.Laflamme MA and Murry CE. Regenerating the heart. Nat Biotechnol. 2005;23:845–856. [DOI] [PubMed] [Google Scholar]
- 6.Murray PJ, Allen JE, Biswas SK, Fisher EA, Gilroy DW, Goerdt S, et al. Macrophage activation and polarization: nomenclature and experimental guidelines. Immunity. 2014;41:14–20. [DOI] [PMC free article] [PubMed] [Google Scholar]
- 7.Nahrendorf M, Swirski FK, Aikawa E, Stangenberg L, Wurdinger T, Figueiredo JL, et al. The healing myocardium sequentially mobilizes two monocyte subsets with divergent and complementary functions. J Exp Med. 2007;204:3037–3047. [DOI] [PMC free article] [PubMed] [Google Scholar]
- 8.Dutta P and Nahrendorf M. Monocytes in myocardial infarction. Arterioscler Thromb Vasc Biol. 2015;35:1066–1070. [DOI] [PMC free article] [PubMed] [Google Scholar]
- 9.de Couto G, Gallet R, Cambier L, Jaghatspanyan E, Makkar N, Dawkins JF, et al. Exosomal MicroRNA Transfer Into Macrophages Mediates Cellular Postconditioning. Circulation. 2017;136:200–214. [DOI] [PMC free article] [PubMed] [Google Scholar]
- 10.de Couto G, Liu W, Tseliou E, Sun B, Makkar N, Kanazawa H, et al. Macrophages mediate cardioprotective cellular postconditioning in acute myocardial infarction. J Clin Invest. 2015;125:3147–3162. [DOI] [PMC free article] [PubMed] [Google Scholar]
- 11.Smith RR, Barile L, Cho HC, Leppo MK, Hare JM, Messina E, et al. Regenerative potential of cardiosphere-derived cells expanded from percutaneous endomyocardial biopsy specimens. Circulation. 2007;115:896–908. [DOI] [PubMed] [Google Scholar]
- 12.Ashur C and Frishman WH. Cardiosphere-Derived Cells and Ischemic Heart Failure. Cardiol Rev. 2018;26:8–21. [DOI] [PubMed] [Google Scholar]
- 13.Kanazawa H, Tseliou E, Malliaras K, Yee K, Dawkins JF, de Couto G, et al. Cellular postconditioning: allogeneic cardiosphere-derived cells reduce infarct size and attenuate microvascular obstruction when administered after reperfusion in pigs with acute myocardial infarction. Circ Heart Fail. 2015;8:322–332. [DOI] [PMC free article] [PubMed] [Google Scholar]
- 14.Gallet R, Dawkins J, Valle J, Simsolo E, de Couto G, Middleton R, et al. Exosomes secreted by cardiosphere-derived cells reduce scarring, attenuate adverse remodelling, and improve function in acute and chronic porcine myocardial infarction. Eur Heart J. 2017;38:201–211. [DOI] [PMC free article] [PubMed] [Google Scholar]
- 15.Scott RS, McMahon EJ, Pop SM, Reap EA, Caricchio R, Cohen PL, et al. Phagocytosis and clearance of apoptotic cells is mediated by MER. Nature. 2001;411:207–211. [DOI] [PubMed] [Google Scholar]
- 16.DeBerge M, Yeap XY, Dehn S, Zhang S, Grigoryeva L, Misener S, et al. MerTK Cleavage on Resident Cardiac Macrophages Compromises Repair After Myocardial Ischemia Reperfusion Injury. Circ Res. 2017;121:930–940. [DOI] [PMC free article] [PubMed] [Google Scholar]
- 17.Wan E, Yeap XY, Dehn S, Terry R, Novak M, Zhang S, et al. Enhanced efferocytosis of apoptotic cardiomyocytes through myeloid-epithelial-reproductive tyrosine kinase links acute inflammation resolution to cardiac repair after infarction. Circ Res. 2013;113:1004–1012. [DOI] [PMC free article] [PubMed] [Google Scholar]
- 18.Jehle AW, Gardai SJ, Li S, Linsel-Nitschke P, Morimoto K, Janssen WJ, et al. ATP-binding cassette transporter A7 enhances phagocytosis of apoptotic cells and associated ERK signaling in macrophages. J Cell Biol. 2006;174:547–556. [DOI] [PMC free article] [PubMed] [Google Scholar]
- 19.McPhillips K, Janssen WJ, Ghosh M, Byrne A, Gardai S, Remigio L, et al. TNF-alpha inhibits macrophage clearance of apoptotic cells via cytosolic phospholipase A2 and oxidant-dependent mechanisms. J Immunol. 2007;178:8117–8126. [DOI] [PubMed] [Google Scholar]
- 20.Dobin A, Davis CA, Schlesinger F, Drenkow J, Zaleski C, Jha S, et al. STAR: ultrafast universal RNA-seq aligner. Bioinformatics. 2013;29:15–21. [DOI] [PMC free article] [PubMed] [Google Scholar]
- 21.Lvd Maaten and Hinton G. Visualizing data using t-SNE. Journal of machine learning research. 2008;9:2579–2605. [Google Scholar]
- 22.Yu D, Huber W and Vitek O. Shrinkage estimation of dispersion in Negative Binomial models for RNA-seq experiments with small sample size. Bioinformatics. 2013;29:1275–1282. [DOI] [PMC free article] [PubMed] [Google Scholar]
- 23.Robinson MD, McCarthy DJ and Smyth GK. edgeR: a Bioconductor package for differential expression analysis of digital gene expression data. Bioinformatics. 2010;26:139–140. [DOI] [PMC free article] [PubMed] [Google Scholar]
- 24.Chernyshev VS, Rachamadugu R, Tseng YH, Belnap DM, Jia Y, Branch KJ, et al. Size and shape characterization of hydrated and desiccated exosomes. Anal Bioanal Chem. 2015;407:3285–3301. [DOI] [PubMed] [Google Scholar]
- 25.Lois C, Hong EJ, Pease S, Brown EJ and Baltimore D. Germline transmission and tissue-specific expression of transgenes delivered by lentiviral vectors. Science. 2002;295:868–872. [DOI] [PubMed] [Google Scholar]
- 26.Frangogiannis NG. The inflammatory response in myocardial injury, repair, and remodelling. Nat Rev Cardiol. 2014;11:255–265. [DOI] [PMC free article] [PubMed] [Google Scholar]
- 27.Gordon S and Martinez FO. Alternative activation of macrophages: mechanism and functions. Immunity. 2010;32:593–604. [DOI] [PubMed] [Google Scholar]
- 28.Lemke G and Rothlin CV. Immunobiology of the TAM receptors. Nat Rev Immunol. 2008;8:327–336. [DOI] [PMC free article] [PubMed] [Google Scholar]
- 29.Scheller J, Chalaris A, Garbers C and Rose-John S. ADAM17: a molecular switch to control inflammation and tissue regeneration. Trends Immunol. 2011;32:380–387. [DOI] [PubMed] [Google Scholar]
- 30.Thorp E, Vaisar T, Subramanian M, Mautner L, Blobel C and Tabas I. Shedding of the Mer tyrosine kinase receptor is mediated by ADAM17 protein through a pathway involving reactive oxygen species, protein kinase Cdelta, and p38 mitogen-activated protein kinase (MAPK). J Biol Chem. 2011;286:33335–33344. [DOI] [PMC free article] [PubMed] [Google Scholar]
- 31.Lewis BP, Shih IH, Jones-Rhoades MW, Bartel DP and Burge CB. Prediction of mammalian microRNA targets. Cell. 2003;115:787–798. [DOI] [PubMed] [Google Scholar]
- 32.Vejnar CE and Zdobnov EM. MiRmap: comprehensive prediction of microRNA target repression strength. Nucleic Acids Res. 2012;40:11673–11683. [DOI] [PMC free article] [PubMed] [Google Scholar]
- 33.Karbiener M, Pisani DF, Frontini A, Oberreiter LM, Lang E, Vegiopoulos A, et al. MicroRNA-26 family is required for human adipogenesis and drives characteristics of brown adipocytes. Stem Cells. 2014;32:1578–1590. [DOI] [PubMed] [Google Scholar]
- 34.Huang X, Le QT and Giaccia AJ. MiR-210--micromanager of the hypoxia pathway. Trends Mol Med. 2010;16:230–237. [DOI] [PMC free article] [PubMed] [Google Scholar]
- 35.Hanayama R, Tanaka M, Miwa K, Shinohara A, Iwamatsu A and Nagata S. Identification of a factor that links apoptotic cells to phagocytes. Nature. 2002;417:182–187. [DOI] [PubMed] [Google Scholar]
- 36.Ishimoto Y, Ohashi K, Mizuno K and Nakano T. Promotion of the uptake of PS liposomes and apoptotic cells by a product of growth arrest-specific gene, gas6. J Biochem. 2000;127:411–417. [DOI] [PubMed] [Google Scholar]
- 37.Mukundan L, Odegaard JI, Morel CR, Heredia JE, Mwangi JW, Ricardo-Gonzalez RR, et al. PPAR-delta senses and orchestrates clearance of apoptotic cells to promote tolerance. Nat Med. 2009;15:1266–1272. [DOI] [PMC free article] [PubMed] [Google Scholar]
- 38.Paidassi H, Tacnet-Delorme P, Garlatti V, Darnault C, Ghebrehiwet B, Gaboriaud C, et al. C1q binds phosphatidylserine and likely acts as a multiligand-bridging molecule in apoptotic cell recognition. J Immunol. 2008;180:2329–2338. [DOI] [PMC free article] [PubMed] [Google Scholar]
- 39.Saxena A, Russo I and Frangogiannis NG. Inflammation as a therapeutic target in myocardial infarction: learning from past failures to meet future challenges. Transl Res. 2016;167:152–166. [DOI] [PMC free article] [PubMed] [Google Scholar]
- 40.Dutta P, Sager HB, Stengel KR, Naxerova K, Courties G, Saez B, et al. Myocardial Infarction Activates CCR2(+) Hematopoietic Stem and Progenitor Cells. Cell Stem Cell. 2015;16:477–487. [DOI] [PMC free article] [PubMed] [Google Scholar]
- 41.Epelman S, Lavine KJ, Beaudin AE, Sojka DK, Carrero JA, Calderon B, et al. Embryonic and adult-derived resident cardiac macrophages are maintained through distinct mechanisms at steady state and during inflammation. Immunity. 2014;40:91–104. [DOI] [PMC free article] [PubMed] [Google Scholar]
- 42.Swirski FK, Nahrendorf M, Etzrodt M, Wildgruber M, Cortez-Retamozo V, Panizzi P, et al. Identification of splenic reservoir monocytes and their deployment to inflammatory sites. Science. 2009;325:612–616. [DOI] [PMC free article] [PubMed] [Google Scholar]
- 43.Cambier L, de Couto G, Ibrahim A, Echavez AK, Valle J, Liu W, et al. Y RNA fragment in extracellular vesicles confers cardioprotection via modulation of IL-10 expression and secretion. EMBO Mol Med. 2017;9:337–352. [DOI] [PMC free article] [PubMed] [Google Scholar]
- 44.Gallet R, de Couto G, Simsolo E, Valle J, Sun B, Liu W, et al. Cardiosphere-derived cells reverse heart failure with preserved ejection fraction (HFpEF) in rats by decreasing fibrosis and inflammation. JACC Basic Transl Sci. 2016;1:14–28. [DOI] [PMC free article] [PubMed] [Google Scholar]
- 45.Aminzadeh MA, Tseliou E, Sun B, Cheng K, Malliaras K, Makkar RR, et al. Therapeutic efficacy of cardiosphere-derived cells in a transgenic mouse model of non-ischaemic dilated cardiomyopathy. Eur Heart J. 2015;36:751–762. [DOI] [PMC free article] [PubMed] [Google Scholar]
- 46.Nana-Leventaki E, Nana M, Poulianitis N, Sampaziotis D, Perrea D, Sanoudou D, et al. Cardiosphere-Derived Cells Attenuate Inflammation, Preserve Systolic Function, and Prevent Adverse Remodeling in Rat Hearts With Experimental Autoimmune Myocarditis. J Cardiovasc Pharmacol Ther. 2018:1074248418784287. [DOI] [PubMed] [Google Scholar]
- 47.Middleton RC, Fournier M, Xu X, Marban E and Lewis MI. Therapeutic benefits of intravenous cardiosphere-derived cell therapy in rats with pulmonary hypertension. PLoS One. 2017;12:e0183557. [DOI] [PMC free article] [PubMed] [Google Scholar]
- 48.Aminzadeh MA, Rogers RG, Fournier M, Tobin RE, Guan X, Childers MK, et al. Exosome-Mediated Benefits of Cell Therapy in Mouse and Human Models of Duchenne Muscular Dystrophy. Stem Cell Reports. 2018. [DOI] [PMC free article] [PubMed] [Google Scholar]
- 49.Hochreiter-Hufford A and Ravichandran KS. Clearing the dead: apoptotic cell sensing, recognition, engulfment, and digestion. Cold Spring Harb Perspect Biol. 2013;5:a008748. [DOI] [PMC free article] [PubMed] [Google Scholar]
- 50.Zagorska A, Traves PG, Lew ED, Dransfield I and Lemke G. Diversification of TAM receptor tyrosine kinase function. Nat Immunol. 2014;15:920–928. [DOI] [PMC free article] [PubMed] [Google Scholar]
- 51.Rothlin CV, Ghosh S, Zuniga EI, Oldstone MB and Lemke G. TAM receptors are pleiotropic inhibitors of the innate immune response. Cell. 2007;131:1124–1136. [DOI] [PubMed] [Google Scholar]
- 52.Korns D, Frasch SC, Fernandez-Boyanapalli R, Henson PM and Bratton DL. Modulation of macrophage efferocytosis in inflammation. Front Immunol. 2011;2:57. [DOI] [PMC free article] [PubMed] [Google Scholar]
- 53.Thorp EB. Mechanisms of failed apoptotic cell clearance by phagocyte subsets in cardiovascular disease. Apoptosis. 2010;15:1124–1136. [DOI] [PMC free article] [PubMed] [Google Scholar]
- 54.Ravichandran KS. Find-me and eat-me signals in apoptotic cell clearance: progress and conundrums. J Exp Med. 2010;207:1807–1817. [DOI] [PMC free article] [PubMed] [Google Scholar]
- 55.Taylor PR, Carugati A, Fadok VA, Cook HT, Andrews M, Carroll MC, et al. A hierarchical role for classical pathway complement proteins in the clearance of apoptotic cells in vivo. J Exp Med. 2000;192:359–366. [DOI] [PMC free article] [PubMed] [Google Scholar]
- 56.Sarlus H and Heneka MT. Microglia in Alzheimer’s disease. J Clin Invest. 2017;127:3240–3249. [DOI] [PMC free article] [PubMed] [Google Scholar]
Associated Data
This section collects any data citations, data availability statements, or supplementary materials included in this article.


